Attached files
| file | filename |
|---|---|
| 8-K - FORM 8-K - BERKSHIRE HATHAWAY INC | d8k.htm |
Table of Contents
Exhibit 99.1
BERKSHIRE HATHAWAY INC.
| 2010 ANNUAL REPORT |
Table of Contents
Berkshire Hathaway Inc. is a holding company owning subsidiaries that engage in a number of diverse business activities including property and casualty insurance and reinsurance, freight rail transportation, utilities and energy, finance, manufacturing, services and retailing. Included in the group of subsidiaries that underwrite property and casualty insurance and reinsurance is GEICO, the third largest private passenger auto insurer in the United States and two of the largest reinsurers in the world, General Re and the Berkshire Hathaway Reinsurance Group. Other subsidiaries that underwrite property and casualty insurance include National Indemnity Company and affiliated insurance entities, Medical Protective Company, Applied Underwriters, U.S. Liability Insurance Company, Central States Indemnity Company, Kansas Bankers Surety, Cypress Insurance Company, BoatU.S. and several other subsidiaries referred to as the “Berkshire Hathaway Homestate Companies.”
Burlington Northern Santa Fe Corporation (“BNSF”), acquired by Berkshire on February 12, 2010, operates one of the largest railroad systems in North America. In serving the Midwest, Pacific Northwest and the Western, Southwestern and Southeastern regions and ports of the U.S., BNSF transports a range of products and commodities derived from manufacturing, agricultural and natural resource industries. MidAmerican Energy Holdings Company (“MidAmerican”) is an international energy holding company owning a wide variety of operating companies engaged in the generation, transmission and distribution of energy. Among MidAmerican’s operating energy companies are Northern Electric and Yorkshire Electricity; MidAmerican Energy Company; Pacific Power and Rocky Mountain Power; and Kern River Gas Transmission Company and Northern Natural Gas. In addition, MidAmerican owns HomeServices of America, a real estate brokerage firm.
Berkshire’s finance and financial products businesses primarily engage in proprietary investing strategies (BH Finance), commercial and consumer lending (Berkshire Hathaway Credit Corporation and Clayton Homes) and transportation equipment and furniture leasing (XTRA and CORT). McLane Company is a wholesale distributor of groceries and nonfood items to discount retailers, convenience stores, quick service restaurants and others. The Marmon Group is an international association of approximately 130 manufacturing and service businesses that operate independently within diverse business sectors.
Numerous business activities are conducted through Berkshire’s other manufacturing, services and retailing subsidiaries. Shaw Industries is the world’s largest manufacturer of tufted broadloom carpet. Benjamin Moore is a formulator, manufacturer and retailer of architectural and industrial coatings. Johns Manville is a leading manufacturer of insulation and building products. Acme Building Brands is a manufacturer of face brick and concrete masonry products. MiTek Inc. produces steel connector products and engineering software for the building components market. Fruit of the Loom, Russell, Vanity Fair, Garan, Fechheimer, H.H. Brown Shoe Group and Justin Brands manufacture, license and distribute apparel and footwear under a variety of brand names. FlightSafety International provides training to aircraft operators. NetJets provides fractional ownership programs for general aviation aircraft. Nebraska Furniture Mart, R.C. Willey Home Furnishings, Star Furniture and Jordan’s Furniture are retailers of home furnishings. Borsheims, Helzberg Diamond Shops and Ben Bridge Jeweler are retailers of fine jewelry.
In addition, other manufacturing, service and retail businesses include: The Buffalo News, a publisher of a daily and Sunday newspaper; See’s Candies, a manufacturer and seller of boxed chocolates and other confectionery products; Scott Fetzer, a diversified manufacturer and distributor of commercial and industrial products; Larson-Juhl, a designer, manufacturer and distributor of high-quality picture framing products; CTB International, a manufacturer of equipment for the livestock and agricultural industries; International Dairy Queen, a licensor and service provider to about 6,000 stores that offer prepared dairy treats and food; The Pampered Chef, the premier direct seller of kitchen tools in the U.S.; Forest River, a leading manufacturer of leisure vehicles in the U.S.; Business Wire, the leading global distributor of corporate news, multimedia and regulatory filings; Iscar Metalworking Companies, an industry leader in the metal cutting tools business; TTI, Inc., a leading distributor of electronic components and Richline Group, a leading jewelry manufacturer.
Operating decisions for the various Berkshire businesses are made by managers of the business units. Investment decisions and all other capital allocation decisions are made for Berkshire and its subsidiaries by Warren E. Buffett, in consultation with Charles T. Munger. Mr. Buffett is Chairman and Mr. Munger is Vice Chairman of Berkshire’s Board of Directors.
************
Table of Contents
| 2 | ||||
| 3 | ||||
| 27 | ||||
| 28 | ||||
| Management’s Report on Internal Control Over Financial Reporting |
28 | |||
| 29 | ||||
| 30 | ||||
| 67 | ||||
| 97 | ||||
| 103 | ||||
| 104 | ||||
| 106 | ||||
| Inside Back Cover | ||||
|
*Copyright©2011
By Warren E. Buffett |
||||
Table of Contents
Berkshire’s Corporate Performance vs. the S&P 500
| Annual Percentage Change | ||||||||||||
| Year |
in Per-Share Book Value of Berkshire (1) |
in S&P 500 with Dividends Included (2) |
Relative Results (1)-(2) |
|||||||||
| 1965 |
23.8 | 10.0 | 13.8 | |||||||||
| 1966 |
20.3 | (11.7 | ) | 32.0 | ||||||||
| 1967 |
11.0 | 30.9 | (19.9 | ) | ||||||||
| 1968 |
19.0 | 11.0 | 8.0 | |||||||||
| 1969 |
16.2 | (8.4 | ) | 24.6 | ||||||||
| 1970 |
12.0 | 3.9 | 8.1 | |||||||||
| 1971 |
16.4 | 14.6 | 1.8 | |||||||||
| 1972 |
21.7 | 18.9 | 2.8 | |||||||||
| 1973 |
4.7 | (14.8 | ) | 19.5 | ||||||||
| 1974 |
5.5 | (26.4 | ) | 31.9 | ||||||||
| 1975 |
21.9 | 37.2 | (15.3 | ) | ||||||||
| 1976 |
59.3 | 23.6 | 35.7 | |||||||||
| 1977 |
31.9 | (7.4 | ) | 39.3 | ||||||||
| 1978 |
24.0 | 6.4 | 17.6 | |||||||||
| 1979 |
35.7 | 18.2 | 17.5 | |||||||||
| 1980 |
19.3 | 32.3 | (13.0 | ) | ||||||||
| 1981 |
31.4 | (5.0 | ) | 36.4 | ||||||||
| 1982 |
40.0 | 21.4 | 18.6 | |||||||||
| 1983 |
32.3 | 22.4 | 9.9 | |||||||||
| 1984 |
13.6 | 6.1 | 7.5 | |||||||||
| 1985 |
48.2 | 31.6 | 16.6 | |||||||||
| 1986 |
26.1 | 18.6 | 7.5 | |||||||||
| 1987 |
19.5 | 5.1 | 14.4 | |||||||||
| 1988 |
20.1 | 16.6 | 3.5 | |||||||||
| 1989 |
44.4 | 31.7 | 12.7 | |||||||||
| 1990 |
7.4 | (3.1 | ) | 10.5 | ||||||||
| 1991 |
39.6 | 30.5 | 9.1 | |||||||||
| 1992 |
20.3 | 7.6 | 12.7 | |||||||||
| 1993 |
14.3 | 10.1 | 4.2 | |||||||||
| 1994 |
13.9 | 1.3 | 12.6 | |||||||||
| 1995 |
43.1 | 37.6 | 5.5 | |||||||||
| 1996 |
31.8 | 23.0 | 8.8 | |||||||||
| 1997 |
34.1 | 33.4 | .7 | |||||||||
| 1998 |
48.3 | 28.6 | 19.7 | |||||||||
| 1999 |
.5 | 21.0 | (20.5 | ) | ||||||||
| 2000 |
6.5 | (9.1 | ) | 15.6 | ||||||||
| 2001 |
(6.2 | ) | (11.9 | ) | 5.7 | |||||||
| 2002 |
10.0 | (22.1 | ) | 32.1 | ||||||||
| 2003 |
21.0 | 28.7 | (7.7 | ) | ||||||||
| 2004 |
10.5 | 10.9 | (.4 | ) | ||||||||
| 2005 |
6.4 | 4.9 | 1.5 | |||||||||
| 2006 |
18.4 | 15.8 | 2.6 | |||||||||
| 2007 |
11.0 | 5.5 | 5.5 | |||||||||
| 2008 |
(9.6 | ) | (37.0 | ) | 27.4 | |||||||
| 2009 |
19.8 | 26.5 | (6.7 | ) | ||||||||
| 2010 |
13.0 | 15.1 | (2.1 | ) | ||||||||
| Compounded Annual Gain – 1965-2010 |
20.2 | % | 9.4 | % | 10.8 | |||||||
| Overall Gain – 1964-2010 |
490,409 | % | 6,262 | % | ||||||||
Notes: Data are for calendar years with these exceptions: 1965 and 1966, year ended 9/30; 1967, 15 months ended 12/31.
Starting in 1979, accounting rules required insurance companies to value the equity securities they hold at market rather than at the lower of cost or market, which was previously the requirement. In this table, Berkshire’s results through 1978 have been restated to conform to the changed rules. In all other respects, the results are calculated using the numbers originally reported.
The S&P 500 numbers are pre-tax whereas the Berkshire numbers are after-tax. If a corporation such as Berkshire were simply to have owned the S&P 500 and accrued the appropriate taxes, its results would have lagged the S&P 500 in years when that index showed a positive return, but would have exceeded the S&P 500 in years when the index showed a negative return. Over the years, the tax costs would have caused the aggregate lag to be substantial.
2
Table of Contents
To the Shareholders of Berkshire Hathaway Inc.:
The per-share book value of both our Class A and Class B stock increased by 13% in 2010. Over the last 46 years (that is, since present management took over), book value has grown from $19 to $95,453, a rate of 20.2% compounded annually.*
The highlight of 2010 was our acquisition of Burlington Northern Santa Fe, a purchase that’s working out even better than I expected. It now appears that owning this railroad will increase Berkshire’s “normal” earning power by nearly 40% pre-tax and by well over 30% after-tax. Making this purchase increased our share count by 6% and used $22 billion of cash. Since we’ve quickly replenished the cash, the economics of this transaction have turned out very well.
A “normal year,” of course, is not something that either Charlie Munger, Vice Chairman of Berkshire and my partner, or I can define with anything like precision. But for the purpose of estimating our current earning power, we are envisioning a year free of a mega-catastrophe in insurance and possessing a general business climate somewhat better than that of 2010 but weaker than that of 2005 or 2006. Using these assumptions, and several others that I will explain in the “Investment” section, I can estimate that the normal earning power of the assets we currently own is about $17 billion pre-tax and $12 billion after-tax, excluding any capital gains or losses. Every day Charlie and I think about how we can build on this base.
Both of us are enthusiastic about BNSF’s future because railroads have major cost and environmental advantages over trucking, their main competitor. Last year BNSF moved each ton of freight it carried a record 500 miles on a single gallon of diesel fuel. That’s three times more fuel-efficient than trucking is, which means our railroad owns an important advantage in operating costs. Concurrently, our country gains because of reduced greenhouse emissions and a much smaller need for imported oil. When traffic travels by rail, society benefits.
Over time, the movement of goods in the United States will increase, and BNSF should get its full share of the gain. The railroad will need to invest massively to bring about this growth, but no one is better situated than Berkshire to supply the funds required. However slow the economy, or chaotic the markets, our checks will clear.
Last year – in the face of widespread pessimism about our economy – we demonstrated our enthusiasm for capital investment at Berkshire by spending $6 billion on property and equipment. Of this amount, $5.4 billion – or 90% of the total – was spent in the United States. Certainly our businesses will expand abroad in the future, but an overwhelming part of their future investments will be at home. In 2011, we will set a new record for capital spending – $8 billion – and spend all of the $2 billion increase in the United States.
Money will always flow toward opportunity, and there is an abundance of that in America. Commentators today often talk of “great uncertainty.” But think back, for example, to December 6, 1941, October 18, 1987 and September 10, 2001. No matter how serene today may be, tomorrow is always uncertain.
* All per-share figures used in this report apply to Berkshire’s A shares. Figures for the B shares are 1/1500th of those shown for A.
3
Table of Contents
Don’t let that reality spook you. Throughout my lifetime, politicians and pundits have constantly moaned about terrifying problems facing America. Yet our citizens now live an astonishing six times better than when I was born. The prophets of doom have overlooked the all-important factor that is certain: Human potential is far from exhausted, and the American system for unleashing that potential – a system that has worked wonders for over two centuries despite frequent interruptions for recessions and even a Civil War – remains alive and effective.
We are not natively smarter than we were when our country was founded nor do we work harder. But look around you and see a world beyond the dreams of any colonial citizen. Now, as in 1776, 1861, 1932 and 1941, America’s best days lie ahead.
Performance
Charlie and I believe that those entrusted with handling the funds of others should establish performance goals at the onset of their stewardship. Lacking such standards, managements are tempted to shoot the arrow of performance and then paint the bull’s-eye around wherever it lands.
In Berkshire’s case, we long ago told you that our job is to increase per-share intrinsic value at a rate greater than the increase (including dividends) of the S&P 500. In some years we succeed; in others we fail. But, if we are unable over time to reach that goal, we have done nothing for our investors, who by themselves could have realized an equal or better result by owning an index fund.
The challenge, of course, is the calculation of intrinsic value. Present that task to Charlie and me separately, and you will get two different answers. Precision just isn’t possible.
To eliminate subjectivity, we therefore use an understated proxy for intrinsic-value – book value – when measuring our performance. To be sure, some of our businesses are worth far more than their carrying value on our books. (Later in this report, we’ll present a case study.) But since that premium seldom swings wildly from year to year, book value can serve as a reasonable device for tracking how we are doing.
The table on page 2 shows our 46-year record against the S&P, a performance quite good in the earlier years and now only satisfactory. The bountiful years, we want to emphasize, will never return. The huge sums of capital we currently manage eliminate any chance of exceptional performance. We will strive, however, for better-than-average results and feel it fair for you to hold us to that standard.
Yearly figures, it should be noted, are neither to be ignored nor viewed as all-important. The pace of the earth’s movement around the sun is not synchronized with the time required for either investment ideas or operating decisions to bear fruit. At GEICO, for example, we enthusiastically spent $900 million last year on advertising to obtain policyholders who deliver us no immediate profits. If we could spend twice that amount productively, we would happily do so though short-term results would be further penalized. Many large investments at our railroad and utility operations are also made with an eye to payoffs well down the road.
To provide you a longer-term perspective on performance, we present on the facing page the yearly figures from page 2 recast into a series of five-year periods. Overall, there are 42 of these periods, and they tell an interesting story. On a comparative basis, our best years ended in the early 1980s. The market’s golden period, however, came in the 17 following years, with Berkshire achieving stellar absolute returns even as our relative advantage narrowed.
After 1999, the market stalled (or have you already noticed that?). Consequently, the satisfactory performance relative to the S&P that Berkshire has achieved since then has delivered only moderate absolute results.
Looking forward, we hope to average several points better than the S&P – though that result is, of course, far from a sure thing. If we succeed in that aim, we will almost certainly produce better relative results in bad years for the stock market and suffer poorer results in strong markets.
4
Table of Contents
Berkshire’s Corporate Performance vs. the S&P 500 by Five-Year Periods
| Annual Percentage Change | ||||||||||||
| Five-Year Period |
in Per-Share Book Value of Berkshire (1) |
in S&P 500 with Dividends Included (2) |
Relative Results (1)-(2) |
|||||||||
| 1965-1969 |
17.2 | 5.0 | 12.2 | |||||||||
| 1966-1970 |
14.7 | 3.9 | 10.8 | |||||||||
| 1967-1971 |
13.9 | 9.2 | 4.7 | |||||||||
| 1968-1972 |
16.8 | 7.5 | 9.3 | |||||||||
| 1969-1973 |
17.7 | 2.0 | 15.7 | |||||||||
| 1970-1974 |
15.0 | (2.4 | ) | 17.4 | ||||||||
| 1971-1975 |
13.9 | 3.2 | 10.7 | |||||||||
| 1972-1976 |
20.8 | 4.9 | 15.9 | |||||||||
| 1973-1977 |
23.4 | (0.2 | ) | 23.6 | ||||||||
| 1974-1978 |
24.4 | 4.3 | 20.1 | |||||||||
| 1975-1979 |
30.1 | 14.7 | 15.4 | |||||||||
| 1976-1980 |
33.4 | 13.9 | 19.5 | |||||||||
| 1977-1981 |
29.0 | 8.1 | 20.9 | |||||||||
| 1978-1982 |
29.9 | 14.1 | 15.8 | |||||||||
| 1979-1983 |
31.6 | 17.3 | 14.3 | |||||||||
| 1980-1984 |
27.0 | 14.8 | 12.2 | |||||||||
| 1981-1985 |
32.6 | 14.6 | 18.0 | |||||||||
| 1982-1986 |
31.5 | 19.8 | 11.7 | |||||||||
| 1983-1987 |
27.4 | 16.4 | 11.0 | |||||||||
| 1984-1988 |
25.0 | 15.2 | 9.8 | |||||||||
| 1985-1989 |
31.1 | 20.3 | 10.8 | |||||||||
| 1986-1990 |
22.9 | 13.1 | 9.8 | |||||||||
| 1987-1991 |
25.4 | 15.3 | 10.1 | |||||||||
| 1988-1992 |
25.6 | 15.8 | 9.8 | |||||||||
| 1989-1993 |
24.4 | 14.5 | 9.9 | |||||||||
| 1990-1994 |
18.6 | 8.7 | 9.9 | |||||||||
| 1991-1995 |
25.6 | 16.5 | 9.1 | |||||||||
| 1992-1996 |
24.2 | 15.2 | 9.0 | |||||||||
| 1993-1997 |
26.9 | 20.2 | 6.7 | |||||||||
| 1994-1998 |
33.7 | 24.0 | 9.7 | |||||||||
| 1995-1999 |
30.4 | 28.5 | 1.9 | |||||||||
| 1996-2000 |
22.9 | 18.3 | 4.6 | |||||||||
| 1997-2001 |
14.8 | 10.7 | 4.1 | |||||||||
| 1998-2002 |
10.4 | (0.6 | ) | 11.0 | ||||||||
| 1999-2003 |
6.0 | (0.6 | ) | 6.6 | ||||||||
| 2000-2004 |
8.0 | (2.3 | ) | 10.3 | ||||||||
| 2001-2005 |
8.0 | 0.6 | 7.4 | |||||||||
| 2002-2006 |
13.1 | 6.2 | 6.9 | |||||||||
| 2003-2007 |
13.3 | 12.8 | 0.5 | |||||||||
| 2004-2008 |
6.9 | (2.2 | ) | 9.1 | ||||||||
| 2005-2009 |
8.6 | 0.4 | 8.2 | |||||||||
| 2006-2010 |
10.0 | 2.3 | 7.7 | |||||||||
Notes: The first two periods cover the five years beginning September 30 of the previous year. The third period covers 63 months beginning September 30, 1966 to December 31, 1971. All other periods involve calendar years.
The other notes on page 2 also apply to this table.
5
Table of Contents
Intrinsic Value – Today and Tomorrow
Though Berkshire’s intrinsic value cannot be precisely calculated, two of its three key pillars can be measured. Charlie and I rely heavily on these measurements when we make our own estimates of Berkshire’s value.
The first component of value is our investments: stocks, bonds and cash equivalents. At yearend these totaled $158 billion at market value.
Insurance float – money we temporarily hold in our insurance operations that does not belong to us – funds $66 billion of our investments. This float is “free” as long as insurance underwriting breaks even, meaning that the premiums we receive equal the losses and expenses we incur. Of course, underwriting results are volatile, swinging erratically between profits and losses. Over our entire history, though, we’ve been significantly profitable, and I also expect us to average breakeven results or better in the future. If we do that, all of our investments – those funded both by float and by retained earnings – can be viewed as an element of value for Berkshire shareholders.
Berkshire’s second component of value is earnings that come from sources other than investments and insurance underwriting. These earnings are delivered by our 68 non-insurance companies, itemized on page 106. In Berkshire’s early years, we focused on the investment side. During the past two decades, however, we’ve increasingly emphasized the development of earnings from non-insurance businesses, a practice that will continue.
The following tables illustrate this shift. In the first table, we present per-share investments at decade intervals beginning in 1970, three years after we entered the insurance business. We exclude those investments applicable to minority interests.
| Yearend |
Per-Share Investments |
Period | Compounded Annual Increase in Per-Share Investments |
|||||||||
| 1970 |
$ | 66 | ||||||||||
| 1980 |
754 | 1970-1980 | 27.5 | % | ||||||||
| 1990 |
7,798 | 1980-1990 | 26.3 | % | ||||||||
| 2000 |
50,229 | 1990-2000 | 20.5 | % | ||||||||
| 2010 |
94,730 | 2000-2010 | 6.6 | % | ||||||||
Though our compounded annual increase in per-share investments was a healthy 19.9% over the 40-year period, our rate of increase has slowed sharply as we have focused on using funds to buy operating businesses.
The payoff from this shift is shown in the following table, which illustrates how earnings of our non-insurance businesses have increased, again on a per-share basis and after applicable minority interests.
| Year |
Per-Share Pre-Tax Earnings |
Period | Compounded Annual Increase in Per-Share Pre-Tax Earnings |
|||||||||
| 1970 |
$ | 2.87 | ||||||||||
| 1980 |
19.01 | 1970-1980 | 20.8 | % | ||||||||
| 1990 |
102.58 | 1980-1990 | 18.4 | % | ||||||||
| 2000 |
918.66 | 1990-2000 | 24.5 | % | ||||||||
| 2010 |
5,926.04 | 2000-2010 | 20.5 | % | ||||||||
6
Table of Contents
For the forty years, our compounded annual gain in pre-tax, non-insurance earnings per share is 21.0%. During the same period, Berkshire’s stock price increased at a rate of 22.1% annually. Over time, you can expect our stock price to move in rough tandem with Berkshire’s investments and earnings. Market price and intrinsic value often follow very different paths – sometimes for extended periods – but eventually they meet.
There is a third, more subjective, element to an intrinsic value calculation that can be either positive or negative: the efficacy with which retained earnings will be deployed in the future. We, as well as many other businesses, are likely to retain earnings over the next decade that will equal, or even exceed, the capital we presently employ. Some companies will turn these retained dollars into fifty-cent pieces, others into two-dollar bills.
This “what-will-they-do-with-the-money” factor must always be evaluated along with the “what-do-we-have-now” calculation in order for us, or anybody, to arrive at a sensible estimate of a company’s intrinsic value. That’s because an outside investor stands by helplessly as management reinvests his share of the company’s earnings. If a CEO can be expected to do this job well, the reinvestment prospects add to the company’s current value; if the CEO’s talents or motives are suspect, today’s value must be discounted. The difference in outcome can be huge. A dollar of then-value in the hands of Sears Roebuck’s or Montgomery Ward’s CEOs in the late 1960s had a far different destiny than did a dollar entrusted to Sam Walton.
* * * * * * * * * * * *
Charlie and I hope that the per-share earnings of our non-insurance businesses continue to increase at a decent rate. But the job gets tougher as the numbers get larger. We will need both good performance from our current businesses and more major acquisitions. We’re prepared. Our elephant gun has been reloaded, and my trigger finger is itchy.
Partially offsetting our anchor of size are several important advantages we have. First, we possess a cadre of truly skilled managers who have an unusual commitment to their own operations and to Berkshire. Many of our CEOs are independently wealthy and work only because they love what they do. They are volunteers, not mercenaries. Because no one can offer them a job they would enjoy more, they can’t be lured away.
At Berkshire, managers can focus on running their businesses: They are not subjected to meetings at headquarters nor financing worries nor Wall Street harassment. They simply get a letter from me every two years (it’s reproduced on pages 104-105) and call me when they wish. And their wishes do differ: There are managers to whom I have not talked in the last year, while there is one with whom I talk almost daily. Our trust is in people rather than process. A “hire well, manage little” code suits both them and me.
Berkshire’s CEOs come in many forms. Some have MBAs; others never finished college. Some use budgets and are by-the-book types; others operate by the seat of their pants. Our team resembles a baseball squad composed of all-stars having vastly different batting styles. Changes in our line-up are seldom required.
Our second advantage relates to the allocation of the money our businesses earn. After meeting the needs of those businesses, we have very substantial sums left over. Most companies limit themselves to reinvesting funds within the industry in which they have been operating. That often restricts them, however, to a “universe” for capital allocation that is both tiny and quite inferior to what is available in the wider world. Competition for the few opportunities that are available tends to become fierce. The seller has the upper hand, as a girl might if she were the only female at a party attended by many boys. That lopsided situation would be great for the girl, but terrible for the boys.
At Berkshire we face no institutional restraints when we deploy capital. Charlie and I are limited only by our ability to understand the likely future of a possible acquisition. If we clear that hurdle – and frequently we can’t – we are then able to compare any one opportunity against a host of others.
7
Table of Contents
When I took control of Berkshire in 1965, I didn’t exploit this advantage. Berkshire was then only in textiles, where it had in the previous decade lost significant money. The dumbest thing I could have done was to pursue “opportunities” to improve and expand the existing textile operation – so for years that’s exactly what I did. And then, in a final burst of brilliance, I went out and bought another textile company. Aaaaaaargh! Eventually I came to my senses, heading first into insurance and then into other industries.
There is even a supplement to this world-is-our-oyster advantage: In addition to evaluating the attractions of one business against a host of others, we also measure businesses against opportunities available in marketable securities, a comparison most managements don’t make. Often, businesses are priced ridiculously high against what can likely be earned from investments in stocks or bonds. At such moments, we buy securities and bide our time.
Our flexibility in respect to capital allocation has accounted for much of our progress to date. We have been able to take money we earn from, say, See’s Candies or Business Wire (two of our best-run businesses, but also two offering limited reinvestment opportunities) and use it as part of the stake we needed to buy BNSF.
Our final advantage is the hard-to-duplicate culture that permeates Berkshire. And in businesses, culture counts.
To start with, the directors who represent you think and act like owners. They receive token compensation: no options, no restricted stock and, for that matter, virtually no cash. We do not provide them directors and officers liability insurance, a given at almost every other large public company. If they mess up with your money, they will lose their money as well. Leaving my holdings aside, directors and their families own Berkshire shares worth more than $3 billion. Our directors, therefore, monitor Berkshire’s actions and results with keen interest and an owner’s eye. You and I are lucky to have them as stewards.
This same owner-orientation prevails among our managers. In many cases, these are people who have sought out Berkshire as an acquirer for a business that they and their families have long owned. They came to us with an owner’s mindset, and we provide an environment that encourages them to retain it. Having managers who love their businesses is no small advantage.
Cultures self-propagate. Winston Churchill once said, “You shape your houses and then they shape you.” That wisdom applies to businesses as well. Bureaucratic procedures beget more bureaucracy, and imperial corporate palaces induce imperious behavior. (As one wag put it, “You know you’re no longer CEO when you get in the back seat of your car and it doesn’t move.”) At Berkshire’s “World Headquarters” our annual rent is $270,212. Moreover, the home-office investment in furniture, art, Coke dispenser, lunch room, high-tech equipment – you name it – totals $301,363. As long as Charlie and I treat your money as if it were our own, Berkshire’s managers are likely to be careful with it as well.
Our compensation programs, our annual meeting and even our annual reports are all designed with an eye to reinforcing the Berkshire culture, and making it one that will repel and expel managers of a different bent. This culture grows stronger every year, and it will remain intact long after Charlie and I have left the scene.
We will need all of the strengths I’ve just described to do reasonably well. Our managers will deliver; you can count on that. But whether Charlie and I can hold up our end in capital allocation depends in part on the competitive environment for acquisitions. You will get our best efforts.
GEICO
Now let me tell you a story that will help you understand how the intrinsic value of a business can far exceed its book value. Relating this tale also gives me a chance to relive some great memories.
Sixty years ago last month, GEICO entered my life, destined to shape it in a huge way. I was then a 20-year-old graduate student at Columbia, having elected to go there because my hero, Ben Graham, taught a once-a-week class at the school.
8
Table of Contents
One day at the library, I checked out Ben’s entry in Who’s Who in America and found he was chairman of Government Employees Insurance Co. (now called GEICO). I knew nothing of insurance and had never heard of the company. The librarian, however, steered me to a large compendium of insurers and, after reading the page on GEICO, I decided to visit the company. The following Saturday, I boarded an early train for Washington.
Alas, when I arrived at the company’s headquarters, the building was closed. I then rather frantically started pounding on a door, until finally a janitor appeared. I asked him if there was anyone in the office I could talk to, and he steered me to the only person around, Lorimer Davidson.
That was my lucky moment. During the next four hours, “Davy” gave me an education about both insurance and GEICO. It was the beginning of a wonderful friendship. Soon thereafter, I graduated from Columbia and became a stock salesman in Omaha. GEICO, of course, was my prime recommendation, which got me off to a great start with dozens of customers. GEICO also jump-started my net worth because, soon after meeting Davy, I made the stock 75% of my $9,800 investment portfolio. (Even so, I felt over-diversified.)
Subsequently, Davy became CEO of GEICO, taking the company to undreamed-of heights before it got into trouble in the mid-1970s, a few years after his retirement. When that happened – with the stock falling by more than 95% – Berkshire bought about one-third of the company in the market, a position that over the years increased to 50% because of GEICO’s repurchases of its own shares. Berkshire’s cost for this half of the business was $46 million. (Despite the size of our position, we exercised no control over operations.)
We then purchased the remaining 50% of GEICO at the beginning of 1996, which spurred Davy, at 95, to make a video tape saying how happy he was that his beloved GEICO would permanently reside with Berkshire. (He also playfully concluded with, “Next time, Warren, please make an appointment.”)
A lot has happened at GEICO during the last 60 years, but its core goal – saving Americans substantial money on their purchase of auto insurance – remains unchanged. (Try us at 1-800-847-7536 or www.GEICO.com.) In other words, get the policyholder’s business by deserving his business. Focusing on this objective, the company has grown to be America’s third-largest auto insurer, with a market share of 8.8%.
When Tony Nicely, GEICO’s CEO, took over in 1993, that share was 2.0%, a level at which it had been stuck for more than a decade. GEICO became a different company under Tony, finding a path to consistent growth while simultaneously maintaining underwriting discipline and keeping its costs low.
Let me quantify Tony’s achievement. When, in 1996, we bought the 50% of GEICO we didn’t already own, it cost us about $2.3 billion. That price implied a value of $4.6 billion for 100%. GEICO then had tangible net worth of $1.9 billion.
The excess over tangible net worth of the implied value – $2.7 billion – was what we estimated GEICO’s “goodwill” to be worth at that time. That goodwill represented the economic value of the policyholders who were then doing business with GEICO. In 1995, those customers had paid the company $2.8 billion in premiums. Consequently, we were valuing GEICO’s customers at about 97% (2.7/2.8) of what they were annually paying the company. By industry standards, that was a very high price. But GEICO was no ordinary insurer: Because of the company’s low costs, its policyholders were consistently profitable and unusually loyal.
Today, premium volume is $14.3 billion and growing. Yet we carry the goodwill of GEICO on our books at only $1.4 billion, an amount that will remain unchanged no matter how much the value of GEICO increases. (Under accounting rules, you write down the carrying value of goodwill if its economic value decreases, but leave it unchanged if economic value increases.) Using the 97%-of-premium-volume yardstick we applied to our 1996 purchase, the real value today of GEICO’s economic goodwill is about $14 billion. And this value is likely to be much higher ten and twenty years from now. GEICO – off to a strong start in 2011 – is the gift that keeps giving.
9
Table of Contents
One not-so-small footnote: Under Tony, GEICO has developed one of the country’s largest personal-lines insurance agencies, which primarily sells homeowners policies to our GEICO auto insurance customers. In this business, we represent a number of insurers that are not affiliated with us. They take the risk; we simply sign up the customers. Last year we sold 769,898 new policies at this agency operation, up 34% from the year before. The obvious way this activity aids us is that it produces commission revenue; equally important is the fact that it further strengthens our relationship with our policyholders, helping us retain them.
I owe an enormous debt to Tony and Davy (and, come to think of it, to that janitor as well).
* * * * * * * * * * * *
Now, let’s examine the four major sectors of Berkshire. Each has vastly different balance sheet and income characteristics from the others. Lumping them together therefore impedes analysis. So we’ll present them as four separate businesses, which is how Charlie and I view them.
We will look first at insurance, Berkshire’s core operation and the engine that has propelled our expansion over the years.
Insurance
Property-casualty (“P/C”) insurers receive premiums upfront and pay claims later. In extreme cases, such as those arising from certain workers’ compensation accidents, payments can stretch over decades. This collect-now, pay-later model leaves us holding large sums – money we call “float” – that will eventually go to others. Meanwhile, we get to invest this float for Berkshire’s benefit. Though individual policies and claims come and go, the amount of float we hold remains remarkably stable in relation to premium volume. Consequently, as our business grows, so does our float. And how we have grown: Just take a look at the following table:
| Yearend |
Float (in $ millions) |
|||
| 1970 |
$ | 39 | ||
| 1980 |
237 | |||
| 1990 |
1,632 | |||
| 2000 |
27,871 | |||
| 2010 |
65,832 | |||
If our premiums exceed the total of our expenses and eventual losses, we register an underwriting profit that adds to the investment income that our float produces. When such a profit occurs, we enjoy the use of free money – and, better yet, get paid for holding it. Alas, the wish of all insurers to achieve this happy result creates intense competition, so vigorous in most years that it causes the P/C industry as a whole to operate at a significant underwriting loss. This loss, in effect, is what the industry pays to hold its float. For example, State Farm, by far the country’s largest insurer and a well-managed company, has incurred an underwriting loss in seven of the last ten years. During that period, its aggregate underwriting loss was more than $20 billion.
At Berkshire, we have now operated at an underwriting profit for eight consecutive years, our total underwriting gain for the period having been $17 billion. I believe it likely that we will continue to underwrite profitably in most – though certainly not all – future years. If we accomplish that, our float will be better than cost-free. We will benefit just as we would if some party deposited $66 billion with us, paid us a fee for holding its money and then let us invest its funds for our own benefit.
10
Table of Contents
Let me emphasize again that cost-free float is not an outcome to be expected for the P/C industry as a whole: In most years, industry premiums have been inadequate to cover claims plus expenses. Consequently, the industry’s overall return on tangible equity has for many decades fallen far short of the average return realized by American industry, a sorry performance almost certain to continue. Berkshire’s outstanding economics exist only because we have some terrific managers running some unusual businesses. We’ve already told you about GEICO, but we have two other very large operations, and a bevy of smaller ones as well, each a star in its own way.
* * * * * * * * * * * *
First off is the Berkshire Hathaway Reinsurance Group, run by Ajit Jain. Ajit insures risks that no one else has the desire or the capital to take on. His operation combines capacity, speed, decisiveness and, most importantly, brains in a manner that is unique in the insurance business. Yet he never exposes Berkshire to risks that are inappropriate in relation to our resources. Indeed, we are far more conservative than most large insurers in that respect. In the past year, Ajit has significantly increased his life reinsurance operation, developing annual premium volume of about $2 billion that will repeat for decades.
From a standing start in 1985, Ajit has created an insurance business with float of $30 billion and significant underwriting profits, a feat that no CEO of any other insurer has come close to matching. By his accomplishments, he has added a great many billions of dollars to the value of Berkshire. Even kryptonite bounces off Ajit.
* * * * * * * * * * * *
We have another insurance powerhouse in General Re, managed by Tad Montross.
At bottom, a sound insurance operation requires four disciplines: (1) An understanding of all exposures that might cause a policy to incur losses; (2) A conservative evaluation of the likelihood of any exposure actually causing a loss and the probable cost if it does; (3) The setting of a premium that will deliver a profit, on average, after both prospective loss costs and operating expenses are covered; and (4) The willingness to walk away if the appropriate premium can’t be obtained.
Many insurers pass the first three tests and flunk the fourth. The urgings of Wall Street, pressures from the agency force and brokers, or simply a refusal by a testosterone-driven CEO to accept shrinking volumes has led too many insurers to write business at inadequate prices. “The other guy is doing it so we must as well” spells trouble in any business, but none more so than insurance.
Tad has observed all four of the insurance commandments, and it shows in his results. General Re’s huge float has been better than cost-free under his leadership, and we expect that, on average, it will continue to be.
* * * * * * * * * * * *
Finally, we own a group of smaller companies, most of them specializing in odd corners of the insurance world. In aggregate, their results have consistently been profitable and, as the table below shows, the float they provide us is substantial. Charlie and I treasure these companies and their managers.
Here is the record of all four segments of our property-casualty and life insurance businesses:
| Underwriting Profit |
Yearend Float |
|||||||||||||||
| (in millions) | ||||||||||||||||
| Insurance Operations |
2010 | 2009 | 2010 | 2009 | ||||||||||||
| General Re |
$ | 452 | $ | 477 | $ | 20,049 | $ | 21,014 | ||||||||
| BH Reinsurance |
176 | 250 | 30,370 | 27,753 | ||||||||||||
| GEICO |
1,117 | 649 | 10,272 | 9,613 | ||||||||||||
| Other Primary |
268 | 84 | 5,141 | 5,061 | ||||||||||||
| $ | 2,013 | $ | 1,460 | $ | 65,832 | $ | 63,441 | |||||||||
Among large insurance operations, Berkshire’s impresses me as the best in the world.
11
Table of Contents
Manufacturing, Service and Retailing Operations
Our activities in this part of Berkshire cover the waterfront. Let’s look, though, at a summary balance sheet and earnings statement for the entire group.
Balance Sheet 12/31/10 (in millions)
Earnings Statement (in millions)
| 2010 | 2009 | 2008 | ||||||||||
| Revenues |
$ | 66,610 | $ | 61,665 | $ | 66,099 | ||||||
| Operating expenses (including depreciation of $1,362 in 2010, $1,422 in 2009 and $1,280 in 2008) |
62,225 | 59,509 | 61,937 | |||||||||
| Interest expense |
111 | 98 | 139 | |||||||||
| Pre-tax earnings |
4,274 | * | 2,058 | * | 4,023 | * | ||||||
| Income taxes and non-controlling interests |
1,812 | 945 | 1,740 | |||||||||
| Net earnings |
$ | 2,462 | $ | 1,113 | $ | 2,283 | ||||||
*Does not include purchase-accounting adjustments.
This group of companies sells products ranging from lollipops to jet airplanes. Some of the businesses enjoy terrific economics, measured by earnings on unleveraged net tangible assets that run from 25% after-tax to more than 100%. Others produce good returns in the area of 12-20%. Unfortunately, a few have very poor returns, a result of some serious mistakes I have made in my job of capital allocation. These errors came about because I misjudged either the competitive strength of the business I was purchasing or the future economics of the industry in which it operated. I try to look out ten or twenty years when making an acquisition, but sometimes my eyesight has been poor.
Most of the companies in this section improved their earnings last year and four set records. Let’s look first at the record-breakers.
| • | TTI, our electronic components distributor, had sales 21% above its previous high (recorded in 2008) and pre-tax earnings that topped its earlier record by 58%. Its sales gains spanned three continents, with North America at 16%, Europe at 26%, and Asia at 50%. The thousands of items TTI distributes are pedestrian, many selling for less than a dollar. The magic of TTI’s exceptional performance is created by Paul Andrews, its CEO, and his associates. |
12
Table of Contents
| • | Forest River, our RV and boat manufacturer, had record sales of nearly $2 billion and record earnings as well. Forest River has 82 plants, and I have yet to visit one (or the home office, for that matter). There’s no need; Pete Liegl, the company’s CEO, runs a terrific operation. Come view his products at the annual meeting. Better yet, buy one. |
| • | CTB, our farm-equipment company, again set an earnings record. I told you in the 2008 Annual Report about Vic Mancinelli, the company’s CEO. He just keeps getting better. Berkshire paid $140 million for CTB in 2002. It has since paid us dividends of $160 million and eliminated $40 million of debt. Last year it earned $106 million pre-tax. Productivity gains have produced much of this increase. When we bought CTB, sales per employee were $189,365; now they are $405,878. |
| • | Would you believe shoes? H. H. Brown, run by Jim Issler and best known for its Born brand, set a new record for sales and earnings (helped by its selling 1,110 pairs of shoes at our annual meeting). Jim has brilliantly adapted to major industry changes. His work, I should mention, is overseen by Frank Rooney, 89, a superb businessman and still a dangerous fellow with whom to have a bet on the golf course. |
A huge story in this sector’s year-to-year improvement occurred at NetJets. I can’t overstate the breadth and importance of Dave Sokol’s achievements at this company, the leading provider of fractional ownership of jet airplanes. NetJets has long been an operational success, owning a 2010 market share five times that of its nearest competitor. Our overwhelming leadership stems from a wonderful team of pilots, mechanics and service personnel. This crew again did its job in 2010, with customer satisfaction, as delineated in our regular surveys, hitting new highs.
Even though NetJets was consistently a runaway winner with customers, our financial results, since its acquisition in 1998, were a failure. In the 11 years through 2009, the company reported an aggregate pre-tax loss of $157 million, a figure that was far understated since borrowing costs at NetJets were heavily subsidized by its free use of Berkshire’s credit. Had NetJets been operating on a stand-alone basis, its loss over the years would have been several hundreds of millions greater.
We are now charging NetJets an appropriate fee for Berkshire’s guarantee. Despite this fee (which came to $38 million in 2010), NetJets earned $207 million pre-tax in 2010, a swing of $918 million from 2009. Dave’s quick restructuring of management and the company’s rationalization of its purchasing and spending policies has ended the hemorrhaging of cash and turned what was Berkshire’s only major business problem into a solidly profitable operation.
Dave has meanwhile maintained NetJets’ industry-leading reputation for safety and service. In many important ways, our training and operational standards are considerably stronger than those required by the FAA. Maintaining top-of-the-line standards is the right thing to do, but I also have a selfish reason for championing this policy. My family and I have flown more than 5,000 hours on NetJets (that’s equal to being airborne 24 hours a day for seven months) and will fly thousands of hours more in the future. We receive no special treatment and have used a random mix of at least 100 planes and 300 crews. Whichever the plane or crew, we always know we are flying with the best-trained pilots in private aviation.
The largest earner in our manufacturing, service and retailing sector is Marmon, a collection of 130 businesses. We will soon increase our ownership in this company to 80% by carrying out our scheduled purchase of 17% of its stock from the Pritzker family. The cost will be about $1.5 billion. We will then purchase the remaining Pritzker holdings in 2013 or 2014, whichever date is selected by the family. Frank Ptak runs Marmon wonderfully, and we look forward to 100% ownership.
13
Table of Contents
Next to Marmon, the two largest earners in this sector are Iscar and McLane. Both had excellent years. In 2010, Grady Rosier’s McLane entered the wine and spirits distribution business to supplement its $32 billion operation as a distributor of food products, cigarettes, candy and sundries. In purchasing Empire Distributors, an operator in Georgia and North Carolina, we teamed up with David Kahn, the company’s dynamic CEO. David is leading our efforts to expand geographically. By yearend he had already made his first acquisition, Horizon Wine and Spirits in Tennessee.
At Iscar, profits were up 159% in 2010, and we may well surpass pre-recession levels in 2011. Sales are improving throughout the world, particularly in Asia. Credit Eitan Wertheimer, Jacob Harpaz and Danny Goldman for an exceptional performance, one far superior to that of Iscar’s main competitors.
All that is good news. Our businesses related to home construction, however, continue to struggle. Johns Manville, MiTek, Shaw and Acme Brick have maintained their competitive positions, but their profits are far below the levels of a few years ago. Combined, these operations earned $362 million pre-tax in 2010 compared to $1.3 billion in 2006, and their employment has fallen by about 9,400.
A housing recovery will probably begin within a year or so. In any event, it is certain to occur at some point. Consequently: (1) At MiTek, we have made, or committed to, five bolt-on acquisitions during the past eleven months; (2) At Acme, we just recently acquired the leading manufacturer of brick in Alabama for $50 million; (3) Johns Manville is building a $55 million roofing membrane plant in Ohio, to be completed next year; and (4) Shaw will spend $200 million in 2011 on plant and equipment, all of it situated in America. These businesses entered the recession strong and will exit it stronger. At Berkshire, our time horizon is forever.
Regulated, Capital-Intensive Businesses
We have two very large businesses, BNSF and MidAmerican Energy, with important common characteristics that distinguish them from our many others. Consequently, we give them their own sector in this letter and split out their financial statistics in our GAAP balance sheet and income statement.
A key characteristic of both companies is the huge investment they have in very long-lived, regulated assets, with these funded by large amounts of long-term debt that is not guaranteed by Berkshire. Our credit is not needed: Both businesses have earning power that, even under very adverse business conditions, amply covers their interest requirements. For example, in recessionary 2010 with BNSF’s car loadings far off peak levels, the company’s interest coverage was 6:1.
Both companies are heavily regulated, and both will have a never-ending need to make major investments in plant and equipment. Both also need to provide efficient, customer-satisfying service to earn the respect of their communities and regulators. In return, both need to be assured that they will be allowed to earn reasonable earnings on future capital investments.
Earlier I explained just how important railroads are to our country’s future. Rail moves 42% of America’s inter-city freight, measured by ton-miles, and BNSF moves more than any other railroad – about 28% of the industry total. A little math will tell you that more than 11% of all inter-city ton-miles of freight in the U.S. is transported by BNSF. Given the shift of population to the West, our share may well inch higher.
All of this adds up to a huge responsibility. We are a major and essential part of the American economy’s circulatory system, obliged to constantly maintain and improve our 23,000 miles of track along with its ancillary bridges, tunnels, engines and cars. In carrying out this job, we must anticipate society’s needs, not merely react to them. Fulfilling our societal obligation, we will regularly spend far more than our depreciation, with this excess amounting to $2 billion in 2011. I’m confident we will earn appropriate returns on our huge incremental investments. Wise regulation and wise investment are two sides of the same coin.
At MidAmerican, we participate in a similar “social compact.” We are expected to put up ever-increasing sums to satisfy the future needs of our customers. If we meanwhile operate reliably and efficiently, we know that we will obtain a fair return on these investments.
14
Table of Contents
MidAmerican supplies 2.4 million customers in the U.S. with electricity, operating as the largest supplier in Iowa, Wyoming and Utah and as an important provider in other states as well. Our pipelines transport 8% of the country’s natural gas. Obviously, many millions of Americans depend on us every day.
MidAmerican has delivered outstanding results for both its owners (Berkshire’s interest is 89.8%) and its customers. Shortly after MidAmerican purchased Northern Natural Gas pipeline in 2002, that company’s performance as a pipeline was rated dead last, 43 out of 43, by the leading authority in the field. In the most recent report published, Northern Natural was ranked second. The top spot was held by our other pipeline, Kern River.
In its electric business, MidAmerican has a comparable record. Iowa rates have not increased since we purchased our operation there in 1999. During the same period, the other major electric utility in the state has raised prices more than 70% and now has rates far above ours. In certain metropolitan areas in which the two utilities operate side by side, electric bills of our customers run far below those of their neighbors. I am told that comparable houses sell at higher prices in these cities if they are located in our service area.
MidAmerican will have 2,909 megawatts of wind generation in operation by the end of 2011, more than any other regulated electric utility in the country. The total amount that MidAmerican has invested or committed to wind is a staggering $5.4 billion. We can make this sort of investment because MidAmerican retains all of its earnings, unlike other utilities that generally pay out most of what they earn.
As you can tell by now, I am proud of what has been accomplished for our society by Matt Rose at BNSF and by David Sokol and Greg Abel at MidAmerican. I am also both proud and grateful for what they have accomplished for Berkshire shareholders. Below are the relevant figures:
| MidAmerican |
Earnings (in millions) | |||||||
| 2010 | 2009 | |||||||
| U.K. utilities |
$ | 333 | $ | 248 | ||||
| Iowa utility |
279 | 285 | ||||||
| Western utilities |
783 | 788 | ||||||
| Pipelines |
378 | 457 | ||||||
| HomeServices |
42 | 43 | ||||||
| Other (net) |
47 | 25 | ||||||
| Operating earnings before corporate interest and taxes |
1,862 | 1,846 | ||||||
| Interest, other than to Berkshire |
(323 | ) | (318 | ) | ||||
| Interest on Berkshire junior debt |
(30 | ) | (58 | ) | ||||
| Income tax |
(271 | ) | (313 | ) | ||||
| Net earnings |
$ | 1,238 | $ | 1,157 | ||||
| Earnings applicable to Berkshire* |
$ | 1,131 | $ | 1,071 | ||||
*Includes interest earned by Berkshire (net of related income taxes) of $19 in 2010 and $38 in 2009.
| BNSF |
||||||||
| (Historical accounting through 2/12/10; purchase accounting subsequently) |
(in millions) | |||||||
| 2010 | 2009 | |||||||
| Revenues |
$ | 16,850 | $ | 14,016 | ||||
| Operating earnings |
4,495 | 3,254 | ||||||
| Interest (Net) |
507 | 613 | ||||||
| Pre-Tax earnings |
3,988 | 2,641 | ||||||
| Net earnings |
2,459 | 1,721 | ||||||
15
Table of Contents
Finance and Financial Products
This, our smallest sector, includes two rental companies, XTRA (trailers) and CORT (furniture), and Clayton Homes, the country’s leading producer and financer of manufactured homes.
Both of our leasing businesses improved their performances last year, albeit from a very low base. XTRA increased the utilization of its equipment from 63% in 2009 to 75% in 2010, thereby raising pre-tax earnings to $35 million from $17 million in 2009. CORT experienced a pickup in business as the year progressed and also significantly tightened its operations. The combination increased its pre-tax results from a loss of $3 million in 2009 to $18 million of profit in 2010.
At Clayton, we produced 23,343 homes, 47% of the industry’s total of 50,046. Contrast this to the peak year of 1998, when 372,843 homes were manufactured. (We then had an industry share of 8%.) Sales would have been terrible last year under any circumstances, but the financing problems I commented upon in the 2009 report continue to exacerbate the distress. To explain: Home-financing policies of our government, expressed through the loans found acceptable by FHA, Freddie Mac and Fannie Mae, favor site-built homes and work to negate the price advantage that manufactured homes offer.
We finance more manufactured-home buyers than any other company. Our experience, therefore, should be instructive to those parties preparing to overhaul our country’s home-loan practices. Let’s take a look.
Clayton owns 200,804 mortgages that it originated. (It also has some mortgage portfolios that it purchased.) At the origination of these contracts, the average FICO score of our borrowers was 648, and 47% were 640 or below. Your banker will tell you that people with such scores are generally regarded as questionable credits.
Nevertheless, our portfolio has performed well during conditions of stress. Here’s our loss experience during the last five years for originated loans:
| Year |
Net Losses as a Percentage of Average Loans |
|||
| 2006 |
1.53 | % | ||
| 2007 |
1.27 | % | ||
| 2008 |
1.17 | % | ||
| 2009 |
1.86 | % | ||
| 2010 |
1.72 | % | ||
Our borrowers get in trouble when they lose their jobs, have health problems, get divorced, etc. The recession has hit them hard. But they want to stay in their homes, and generally they borrowed sensible amounts in relation to their income. In addition, we were keeping the originated mortgages for our own account, which means we were not securitizing or otherwise reselling them. If we were stupid in our lending, we were going to pay the price. That concentrates the mind.
If home buyers throughout the country had behaved like our buyers, America would not have had the crisis that it did. Our approach was simply to get a meaningful down-payment and gear fixed monthly payments to a sensible percentage of income. This policy kept Clayton solvent and also kept buyers in their homes.
Home ownership makes sense for most Americans, particularly at today’s lower prices and bargain interest rates. All things considered, the third best investment I ever made was the purchase of my home, though I would have made far more money had I instead rented and used the purchase money to buy stocks. (The two best investments were wedding rings.) For the $31,500 I paid for our house, my family and I gained 52 years of terrific memories with more to come.
16
Table of Contents
But a house can be a nightmare if the buyer’s eyes are bigger than his wallet and if a lender – often protected by a government guarantee – facilitates his fantasy. Our country’s social goal should not be to put families into the house of their dreams, but rather to put them into a house they can afford.
Investments
Below we show our common stock investments that at yearend had a market value of more than $1 billion.
| 12/31/10 | ||||||||||||||||
| Shares |
Company |
Percentage of Company Owned |
Cost * | Market | ||||||||||||
| (in millions) | ||||||||||||||||
| 151,610,700 | American Express Company | 12.6 | $ | 1,287 | $ | 6,507 | ||||||||||
| 225,000,000 | BYD Company, Ltd. | 9.9 | 232 | 1,182 | ||||||||||||
| 200,000,000 | The Coca-Cola Company | 8.6 | 1,299 | 13,154 | ||||||||||||
| 29,109,637 | ConocoPhillips | 2.0 | 2,028 | 1,982 | ||||||||||||
| 45,022,563 | Johnson & Johnson | 1.6 | 2,749 | 2,785 | ||||||||||||
| 97,214,584 | Kraft Foods Inc. | 5.6 | 3,207 | 3,063 | ||||||||||||
| 19,259,600 | Munich Re | 10.5 | 2,896 | 2,924 | ||||||||||||
| 3,947,555 | POSCO | 4.6 | 768 | 1,706 | ||||||||||||
| 72,391,036 | The Procter & Gamble Company | 2.6 | 464 | 4,657 | ||||||||||||
| 25,848,838 | Sanofi-Aventis | 2.0 | 2,060 | 1,656 | ||||||||||||
| 242,163,773 | Tesco plc | 3.0 | 1,414 | 1,608 | ||||||||||||
| 78,060,769 | U.S. Bancorp | 4.1 | 2,401 | 2,105 | ||||||||||||
| 39,037,142 | Wal-Mart Stores, Inc. | 1.1 | 1,893 | 2,105 | ||||||||||||
| 358,936,125 | Wells Fargo & Company | 6.8 | 8,015 | 11,123 | ||||||||||||
| Others | 3,020 | 4,956 | ||||||||||||||
| Total Common Stocks Carried at Market | $ | 33,733 | $ | 61,513 | ||||||||||||
| * | This is our actual purchase price and also our tax basis; GAAP “cost” differs in a few cases because of write-ups or write-downs that have been required. |
In our reported earnings we reflect only the dividends our portfolio companies pay us. Our share of the undistributed earnings of these investees, however, was more than $2 billion last year. These retained earnings are important. In our experience – and, for that matter, in the experience of investors over the past century – undistributed earnings have been either matched or exceeded by market gains, albeit in a highly irregular manner. (Indeed, sometimes the correlation goes in reverse. As one investor said in 2009: “This is worse than divorce. I’ve lost half my net worth – and I still have my wife.”) In the future, we expect our market gains to eventually at least equal the earnings our investees retain.
* * * * * * * * * * * *
In our earlier estimate of Berkshire’s normal earning power, we made three adjustments that relate to future investment income (but did not include anything for the undistributed earnings factor I have just described).
The first adjustment was decidedly negative. Last year, we discussed five large fixed-income investments that have been contributing substantial sums to our reported earnings. One of these – our Swiss Re note – was redeemed in the early days of 2011, and two others – our Goldman Sachs and General Electric preferred stocks – are likely to be gone by yearend. General Electric is entitled to call our preferred in October and has stated its intention to do so. Goldman Sachs has the right to call our preferred on 30 days notice, but has been held back by the Federal Reserve (bless it!), which unfortunately will likely give Goldman the green light before long.
17
Table of Contents
All three of the companies redeeming must pay us a premium to do so – in aggregate about $1.4 billion – but all of the redemptions are nevertheless unwelcome. After they occur, our earning power will be significantly reduced. That’s the bad news.
There are two probable offsets. At yearend we held $38 billion of cash equivalents that have been earning a pittance throughout 2010. At some point, however, better rates will return. They will add at least $500 million – and perhaps much more – to our investment income. That sort of increase in money-market yields is unlikely to come soon. It is appropriate, nevertheless, for us to include improved rates in an estimate of “normal” earning power. Even before higher rates come about, furthermore, we could get lucky and find an opportunity to use some of our cash hoard at decent returns. That day can’t come too soon for me: To update Aesop, a girl in a convertible is worth five in the phone book.
In addition, dividends on our current common stock holdings will almost certainly increase. The largest gain is likely to come at Wells Fargo. The Federal Reserve, our friend in respect to Goldman Sachs, has frozen dividend levels at major banks, whether strong or weak, during the last two years. Wells Fargo, though consistently prospering throughout the worst of the recession and currently enjoying enormous financial strength and earning power, has therefore been forced to maintain an artificially low payout. (We don’t fault the Fed: For various reasons, an across-the-board freeze made sense during the crisis and its immediate aftermath.)
At some point, probably soon, the Fed’s restrictions will cease. Wells Fargo can then reinstate the rational dividend policy that its owners deserve. At that time, we would expect our annual dividends from just this one security to increase by several hundreds of millions of dollars annually.
Other companies we hold are likely to increase their dividends as well. Coca-Cola paid us $88 million in 1995, the year after we finished purchasing the stock. Every year since, Coke has increased its dividend. In 2011, we will almost certainly receive $376 million from Coke, up $24 million from last year. Within ten years, I would expect that $376 million to double. By the end of that period, I wouldn’t be surprised to see our share of Coke’s annual earnings exceed 100% of what we paid for the investment. Time is the friend of the wonderful business.
Overall, I believe our “normal” investment income will at least equal what we realized in 2010, though the redemptions I described will cut our take in 2011 and perhaps 2012 as well.
* * * * * * * * * * * *
Last summer, Lou Simpson told me he wished to retire. Since Lou was a mere 74 – an age Charlie and I regard as appropriate only for trainees at Berkshire – his call was a surprise.
Lou joined GEICO as its investment manager in 1979, and his service to that company has been invaluable. In the 2004 Annual Report, I detailed his record with equities, and I have omitted updates only because his performance made mine look bad. Who needs that?
Lou has never been one to advertise his talents. But I will: Simply put, Lou is one of the investment greats. We will miss him.
* * * * * * * * * * * *
Four years ago, I told you that we needed to add one or more younger investment managers to carry on when Charlie, Lou and I weren’t around. At that time we had multiple outstanding candidates immediately available for my CEO job (as we do now), but we did not have backup in the investment area.
It’s easy to identify many investment managers with great recent records. But past results, though important, do not suffice when prospective performance is being judged. How the record has been achieved is crucial, as is the manager’s understanding of – and sensitivity to – risk (which in no way should be measured by beta, the choice of too many academics). In respect to the risk criterion, we were looking for someone with a hard-to-evaluate skill: the ability to anticipate the effects of economic scenarios not previously observed. Finally, we wanted someone who would regard working for Berkshire as far more than a job.
18
Table of Contents
When Charlie and I met Todd Combs, we knew he fit our requirements. Todd, as was the case with Lou, will be paid a salary plus a contingent payment based on his performance relative to the S&P. We have arrangements in place for deferrals and carryforwards that will prevent see-saw performance being met by undeserved payments. The hedge-fund world has witnessed some terrible behavior by general partners who have received huge payouts on the upside and who then, when bad results occurred, have walked away rich, with their limited partners losing back their earlier gains. Sometimes these same general partners thereafter quickly started another fund so that they could immediately participate in future profits without having to overcome their past losses. Investors who put money with such managers should be labeled patsies, not partners.
As long as I am CEO, I will continue to manage the great majority of Berkshire’s holdings, both bonds and equities. Todd initially will manage funds in the range of one to three billion dollars, an amount he can reset annually. His focus will be equities but he is not restricted to that form of investment. (Fund consultants like to require style boxes such as “long-short,” “macro,” “international equities.” At Berkshire our only style box is “smart.”)
Over time, we may add one or two investment managers if we find the right individuals. Should we do that, we will probably have 80% of each manager’s performance compensation be dependent on his or her own portfolio and 20% on that of the other manager(s). We want a compensation system that pays off big for individual success but that also fosters cooperation, not competition.
When Charlie and I are no longer around, our investment manager(s) will have responsibility for the entire portfolio in a manner then set by the CEO and Board of Directors. Because good investors bring a useful perspective to the purchase of businesses, we would expect them to be consulted – but not to have a vote – on the wisdom of possible acquisitions. In the end, of course, the Board will make the call on any major acquisition.
One footnote: When we issued a press release about Todd’s joining us, a number of commentators pointed out that he was “little-known” and expressed puzzlement that we didn’t seek a “big-name.” I wonder how many of them would have known of Lou in 1979, Ajit in 1985, or, for that matter, Charlie in 1959. Our goal was to find a 2-year-old Secretariat, not a 10-year-old Seabiscuit. (Whoops – that may not be the smartest metaphor for an 80-year-old CEO to use.)
Derivatives
Two years ago, in the 2008 Annual Report, I told you that Berkshire was a party to 251 derivatives contracts (other than those used for operations at our subsidiaries, such as MidAmerican, and the few left over at Gen Re). Today, the comparable number is 203, a figure reflecting both a few additions to our portfolio and the unwinding or expiration of some contracts.
Our continuing positions, all of which I am personally responsible for, fall largely into two categories. We view both categories as engaging us in insurance-like activities in which we receive premiums for assuming risks that others wish to shed. Indeed, the thought processes we employ in these derivatives transactions are identical to those we use in our insurance business. You should also understand that we get paid up-front when we enter into the contracts and therefore run no counterparty risk. That’s important.
Our first category of derivatives consists of a number of contracts, written in 2004-2008, that required payments by us if there were bond defaults by companies included in certain high-yield indices. With minor exceptions, we were exposed to these risks for five years, with each contract covering 100 companies.
In aggregate, we received premiums of $3.4 billion for these contracts. When I originally told you in our 2007 Annual Report about them, I said that I expected the contracts would deliver us an “underwriting profit,” meaning that our losses would be less than the premiums we received. In addition, I said we would benefit from the use of float.
19
Table of Contents
Subsequently, as you know too well, we encountered both a financial panic and a severe recession. A number of the companies in the high-yield indices failed, which required us to pay losses of $2.5 billion. Today, however, our exposure is largely behind us because most of our higher-risk contracts have expired. Consequently, it appears almost certain that we will earn an underwriting profit as we originally anticipated. In addition, we have had the use of interest-free float that averaged about $2 billion over the life of the contracts. In short, we charged the right premium, and that protected us when business conditions turned terrible three years ago.
Our other large derivatives position – whose contracts go by the name of “equity puts” – involves insurance we wrote for parties wishing to protect themselves against a possible decline in equity prices in the U.S., U.K., Europe and Japan. These contracts are tied to various equity indices, such as the S&P 500 in the U.S. and the FTSE 100 in the U.K. In the 2004-2008 period, we received $4.8 billion of premiums for 47 of these contracts, most of which ran for 15 years. On these contracts, only the price of the indices on the termination date counts: No payments can be required before then.
As a first step in updating you about these contracts, I can report that late in 2010, at the instigation of our counterparty, we unwound eight contracts, all of them due between 2021 and 2028. We had originally received $647 million in premiums for these contracts, and the unwinding required us to pay $425 million. Consequently, we realized a gain of $222 million and also had the interest-free and unrestricted use of that $647 million for about three years.
Those 2010 transactions left us with 39 equity put contracts remaining on our books at yearend. On these, at their initiation, we received premiums of $4.2 billion.
The future of these contracts is, of course, uncertain. But here is one perspective on them. If the prices of the relevant indices are the same at the contract expiration dates as these prices were on December 31, 2010 – and foreign exchange rates are unchanged – we would owe $3.8 billion on expirations occurring from 2018 to 2026. You can call this amount “settlement value.”
On our yearend balance sheet, however, we carry the liability for those remaining equity puts at $6.7 billion. In other words, if the prices of the relevant indices remain unchanged from that date, we will record a $2.9 billion gain in the years to come, that being the difference between the liability figure of $6.7 billion and the settlement value of $3.8 billion. I believe that equity prices will very likely increase and that our liability will fall significantly between now and settlement date. If so, our gain from this point will be even greater. But that, of course, is far from a sure thing.
What is sure is that we will have the use of our remaining “float” of $4.2 billion for an average of about 10 more years. (Neither this float nor that arising from the high-yield contracts is included in the insurance float figure of $66 billion.) Since money is fungible, think of a portion of these funds as contributing to the purchase of BNSF.
As I have told you before, almost all of our derivatives contracts are free of any obligation to post collateral – a fact that cut the premiums we could otherwise have charged. But that fact also left us feeling comfortable during the financial crisis, allowing us in those days to commit to some advantageous purchases. Foregoing some additional derivatives premiums proved to be well worth it.
On Reporting and Misreporting: The Numbers That Count and Those That Don’t
Earlier in this letter, I pointed out some numbers that Charlie and I find useful in valuing Berkshire and measuring its progress.
Let’s focus here on a number we omitted, but which many in the media feature above all others: net income. Important though that number may be at most companies, it is almost always meaningless at Berkshire. Regardless of how our businesses might be doing, Charlie and I could – quite legally – cause net income in any given period to be almost any number we would like.
20
Table of Contents
We have that flexibility because realized gains or losses on investments go into the net income figure, whereas unrealized gains (and, in most cases, losses) are excluded. For example, imagine that Berkshire had a $10 billion increase in unrealized gains in a given year and concurrently had $1 billion of realized losses. Our net income – which would count only the loss – would be reported as less than our operating income. If we had meanwhile realized gains in the previous year, headlines might proclaim that our earnings were down X% when in reality our business might be much improved.
If we really thought net income important, we could regularly feed realized gains into it simply because we have a huge amount of unrealized gains upon which to draw. Rest assured, though, that Charlie and I have never sold a security because of the effect a sale would have on the net income we were soon to report. We both have a deep disgust for “game playing” with numbers, a practice that was rampant throughout corporate America in the 1990s and still persists, though it occurs less frequently and less blatantly than it used to.
Operating earnings, despite having some shortcomings, are in general a reasonable guide as to how our businesses are doing. Ignore our net income figure, however. Regulations require that we report it to you. But if you find reporters focusing on it, that will speak more to their performance than ours.
Both realized and unrealized gains and losses are fully reflected in the calculation of our book value. Pay attention to the changes in that metric and to the course of our operating earnings, and you will be on the right track.
* * * * * * * * * * * *
As a p.s., I can’t resist pointing out just how capricious reported net income can be. Had our equity puts had a termination date of June 30, 2010, we would have been required to pay $6.4 billion to our counterparties at that date. Security prices then generally rose in the next quarter, a move that brought the corresponding figure down to $5.8 billion on September 30th. Yet the Black-Scholes formula that we use in valuing these contracts required us to increase our balance-sheet liability during this period from $8.9 billion to $9.6 billion, a change that, after the effect of tax accruals, reduced our net income for the quarter by $455 million.
Both Charlie and I believe that Black-Scholes produces wildly inappropriate values when applied to long-dated options. We set out one absurd example in these pages two years ago. More tangibly, we put our money where our mouth was by entering into our equity put contracts. By doing so, we implicitly asserted that the Black-Scholes calculations used by our counterparties or their customers were faulty.
We continue, nevertheless, to use that formula in presenting our financial statements. Black-Scholes is the accepted standard for option valuation – almost all leading business schools teach it – and we would be accused of shoddy accounting if we deviated from it. Moreover, we would present our auditors with an insurmountable problem were we to do that: They have clients who are our counterparties and who use Black-Scholes values for the same contracts we hold. It would be impossible for our auditors to attest to the accuracy of both their values and ours were the two far apart.
Part of the appeal of Black-Scholes to auditors and regulators is that it produces a precise number. Charlie and I can’t supply one of those. We believe the true liability of our contracts to be far lower than that calculated by Black-Scholes, but we can’t come up with an exact figure – anymore than we can come up with a precise value for GEICO, BNSF, or for Berkshire Hathaway itself. Our inability to pinpoint a number doesn’t bother us: We would rather be approximately right than precisely wrong.
John Kenneth Galbraith once slyly observed that economists were most economical with ideas: They made the ones learned in graduate school last a lifetime. University finance departments often behave similarly. Witness the tenacity with which almost all clung to the theory of efficient markets throughout the 1970s and 1980s, dismissively calling powerful facts that refuted it “anomalies.” (I always love explanations of that kind: The Flat Earth Society probably views a ship’s circling of the globe as an annoying, but inconsequential, anomaly.)
21
Table of Contents
Academics’ current practice of teaching Black-Scholes as revealed truth needs re-examination. For that matter, so does the academic’s inclination to dwell on the valuation of options. You can be highly successful as an investor without having the slightest ability to value an option. What students should be learning is how to value a business. That’s what investing is all about.
Life and Debt
The fundamental principle of auto racing is that to finish first, you must first finish. That dictum is equally applicable to business and guides our every action at Berkshire.
Unquestionably, some people have become very rich through the use of borrowed money. However, that’s also been a way to get very poor. When leverage works, it magnifies your gains. Your spouse thinks you’re clever, and your neighbors get envious. But leverage is addictive. Once having profited from its wonders, very few people retreat to more conservative practices. And as we all learned in third grade – and some relearned in 2008 – any series of positive numbers, however impressive the numbers may be, evaporates when multiplied by a single zero. History tells us that leverage all too often produces zeroes, even when it is employed by very smart people.
Leverage, of course, can be lethal to businesses as well. Companies with large debts often assume that these obligations can be refinanced as they mature. That assumption is usually valid. Occasionally, though, either because of company-specific problems or a worldwide shortage of credit, maturities must actually be met by payment. For that, only cash will do the job.
Borrowers then learn that credit is like oxygen. When either is abundant, its presence goes unnoticed. When either is missing, that’s all that is noticed. Even a short absence of credit can bring a company to its knees. In September 2008, in fact, its overnight disappearance in many sectors of the economy came dangerously close to bringing our entire country to its knees.
Charlie and I have no interest in any activity that could pose the slightest threat to Berkshire’s well-being. (With our having a combined age of 167, starting over is not on our bucket list.) We are forever conscious of the fact that you, our partners, have entrusted us with what in many cases is a major portion of your savings. In addition, important philanthropy is dependent on our prudence. Finally, many disabled victims of accidents caused by our insureds are counting on us to deliver sums payable decades from now. It would be irresponsible for us to risk what all these constituencies need just to pursue a few points of extra return.
A little personal history may partially explain our extreme aversion to financial adventurism. I didn’t meet Charlie until he was 35, though he grew up within 100 yards of where I have lived for 52 years and also attended the same inner-city public high school in Omaha from which my father, wife, children and two grandchildren graduated. Charlie and I did, however, both work as young boys at my grandfather’s grocery store, though our periods of employment were separated by about five years. My grandfather’s name was Ernest, and perhaps no man was more aptly named. No one worked for Ernest, even as a stock boy, without being shaped by the experience.
On the facing page you can read a letter sent in 1939 by Ernest to his youngest son, my Uncle Fred. Similar letters went to his other four children. I still have the letter sent to my Aunt Alice, which I found – along with $1,000 of cash – when, as executor of her estate, I opened her safe deposit box in 1970.
Ernest never went to business school – he never in fact finished high school – but he understood the importance of liquidity as a condition for assured survival. At Berkshire, we have taken his $1,000 solution a bit further and have pledged that we will hold at least $10 billion of cash, excluding that held at our regulated utility and railroad businesses. Because of that commitment, we customarily keep at least $20 billion on hand so that we can both withstand unprecedented insurance losses (our largest to date having been about $3 billion from Katrina, the insurance industry’s most expensive catastrophe) and quickly seize acquisition or investment opportunities, even during times of financial turmoil.
22
Table of Contents
Dear Fred & Catherine:
Over a period of a good many years I have known a great many people who at some time or another have suffered in various ways simply because they did not have ready cash. I have known people who have had to sacrifice some of their holdings in order to have money that was necessary at that time.
For a good many years your grandfather kept a certain amount of money where he could put his hands on it in very short notice.
For a number of years I have made it a point to keep a reserve, should some occasion come up where I would need money quickly, without disturbing the money that I have in my business. There have been a couple of occasions when I found it very convenient to go to this fund.
Thus, I feel that everyone should have a reserve. I hope it never happens to you, but the chances are that some day you will need money, and need it badly, and with this thought in view, I started a fund by placing $200.00 in an envelope, with your name on it, when you were married. Each year I added something to it, until there is now $1000.00 in the fund.
Ten year have elapsed since you were married, and this fund is now complete.
It is my wish that you place this envelope in your safety deposit box, and keep it for the purpose that it was created for. Should the time come when you need part, I would suggest that you use as little as possible, and replace it as soon as possible.
You might feel that this should be invested and bring you an income. Forget it — the mental satisfaction of having $1000.00 laid away where you can put your hands on it, is worth more than what interest it might bring, especially if you have the investment in something that you could not realize on quickly.
If in after years you feel this has been a good idea, you might repeat it with your own children.
For your information, I might mention that there has never been a Buffet who ever left a very large estate, but there has never been one that did not leave something. They never spent all they made, but always saved part of what they made, and it has all worked pretty well.
This letter is being written at the expiration of ten years after you were married.
| /s/ Ernest Buffett |
| “Dad” |
23
Table of Contents
We keep our cash largely in U.S. Treasury bills and avoid other short-term securities yielding a few more basis points, a policy we adhered to long before the frailties of commercial paper and money market funds became apparent in September 2008. We agree with investment writer Ray DeVoe’s observation, “More money has been lost reaching for yield than at the point of a gun.” At Berkshire, we don’t rely on bank lines, and we don’t enter into contracts that could require postings of collateral except for amounts that are tiny in relation to our liquid assets.
Furthermore, not a dime of cash has left Berkshire for dividends or share repurchases during the past 40 years. Instead, we have retained all of our earnings to strengthen our business, a reinforcement now running about $1 billion per month. Our net worth has thus increased from $48 million to $157 billion during those four decades and our intrinsic value has grown far more. No other American corporation has come close to building up its financial strength in this unrelenting way.
By being so cautious in respect to leverage, we penalize our returns by a minor amount. Having loads of liquidity, though, lets us sleep well. Moreover, during the episodes of financial chaos that occasionally erupt in our economy, we will be equipped both financially and emotionally to play offense while others scramble for survival. That’s what allowed us to invest $15.6 billion in 25 days of panic following the Lehman bankruptcy in 2008.
The Annual Meeting
The annual meeting will be held on Saturday, April 30th. Carrie Kizer from our home office will be the ringmaster, and her theme this year is Planes, Trains and Automobiles. This gives NetJets, BNSF and BYD a chance to show off.
As always, the doors will open at the Qwest Center at 7 a.m., and a new Berkshire movie will be shown at 8:30. At 9:30 we will go directly to the question-and-answer period, which (with a break for lunch at the Qwest’s stands) will last until 3:30. After a short recess, Charlie and I will convene the annual meeting at 3:45. If you decide to leave during the day’s question periods, please do so while Charlie is talking. (Act fast; he can be terse.)
The best reason to exit, of course, is to shop. We will help you do that by filling the 194,300-square-foot hall that adjoins the meeting area with products from dozens of Berkshire subsidiaries. Last year, you did your part, and most locations racked up record sales. In a nine-hour period, we sold 1,053 pairs of Justin boots, 12,416 pounds of See’s candy, 8,000 Dairy Queen Blizzards® and 8,800 Quikut knives (that’s 16 knives per minute). But you can do better. Remember: Anyone who says money can’t buy happiness simply hasn’t learned where to shop.
GEICO will have a booth staffed by a number of its top counselors from around the country, all of them ready to supply you with auto insurance quotes. In most cases, GEICO will be able to give you a shareholder discount (usually 8%). This special offer is permitted by 44 of the 51 jurisdictions in which we operate. (One supplemental point: The discount is not additive if you qualify for another, such as that given certain groups.) Bring the details of your existing insurance and check out whether we can save you money. For at least half of you, I believe we can.
Be sure to visit the Bookworm. It will carry more than 60 books and DVDs, including the Chinese language edition of Poor Charlie’s Almanack, the ever-popular book about my partner. So what if you can’t read Chinese? Just buy a copy and carry it around; it will make you look urbane and erudite. Should you need to ship your book purchases, a shipping service will be available nearby.
If you are a big spender – or merely a gawker – visit Elliott Aviation on the east side of the Omaha airport between noon and 5:00 p.m. on Saturday. There we will have a fleet of NetJets aircraft that will get your pulse racing. Come by bus; leave by private jet.
24
Table of Contents
An attachment to the proxy material that is enclosed with this report explains how you can obtain the credential you will need for admission to the meeting and other events. As for plane, hotel and car reservations, we have again signed up American Express (800-799-6634) to give you special help. Carol Pedersen, who handles these matters, does a terrific job for us each year, and I thank her for it. Hotel rooms can be hard to find, but work with Carol and you will get one.
Airlines have often jacked up prices – sometimes dramatically so – for the Berkshire weekend. If you are coming from far away, compare the cost of flying to Kansas City versus Omaha. The drive is about 2 1/2 hours and it may be that you can save significant money, particularly if you had planned to rent a car in Omaha.
At Nebraska Furniture Mart, located on a 77-acre site on 72nd Street between Dodge and Pacific, we will again be having “Berkshire Weekend” discount pricing. Last year the store did $33.3 million of business during its annual meeting sale, a volume that – as far as I know – exceeds the one-week total of any retail store anyplace. To obtain the Berkshire discount, you must make your purchases between Tuesday, April 26th and Monday, May 2nd inclusive, and also present your meeting credential. The period’s special pricing will even apply to the products of several prestigious manufacturers that normally have ironclad rules against discounting but which, in the spirit of our shareholder weekend, have made an exception for you. We appreciate their cooperation. NFM is open from 10 a.m. to 9 p.m. Monday through Saturday, and 10 a.m. to 6 p.m. on Sunday. On Saturday this year, from 5:30 p.m. to 8 p.m., NFM is having a picnic to which you are all invited.
At Borsheims, we will again have two shareholder-only events. The first will be a cocktail reception from 6 p.m. to 9 p.m. on Friday, April 29th. The second, the main gala, will be held on Sunday, May 1st , from 9 a.m. to 4 p.m. On Saturday, we will be open until 6 p.m. On Sunday, around 1 p.m., I will be at Borsheims with a smile and a shoeshine, selling jewelry just as I sold men’s shirts at J.C. Penney’s 63 years ago. I’ve told Susan Jacques, Borsheims’ CEO, that I’m still a hotshot salesman. But I see doubt in her eyes. So cut loose and buy something from me for your wife or sweetheart (presumably the same person). Make me look good.
We will have huge crowds at Borsheims throughout the weekend. For your convenience, therefore, shareholder prices will be available from Monday, April 25th through Saturday, May 7th. During that period, please identify yourself as a shareholder by presenting your meeting credentials or a brokerage statement that shows you are a Berkshire shareholder.
On Sunday, in the mall outside of Borsheims, a blindfolded Patrick Wolff, twice U.S. chess champion, will take on all comers – who will have their eyes wide open – in groups of six. Nearby, Norman Beck, a remarkable magician from Dallas, will bewilder onlookers. Additionally, we will have Bob Hamman and Sharon Osberg, two of the world’s top bridge experts, available to play bridge with our shareholders on Sunday afternoon.
Gorat’s and Piccolo’s will again be open exclusively for Berkshire shareholders on Sunday, May 1st. Both will be serving until 10 p.m., with Gorat’s opening at 1 p.m. and Piccolo’s opening at 4 p.m. These restaurants are my favorites and – still being a growing boy – I will eat at both of them on Sunday evening. Remember: To make a reservation at Gorat’s, call 402-551-3733 on April 1st (but not before) and at Piccolo’s call 402-342-9038.
We will again have the same three financial journalists lead the question-and-answer period, asking Charlie and me questions that shareholders have submitted to them by e-mail. The journalists and their e-mail addresses are: Carol Loomis, of Fortune, who may be emailed at cloomis@fortunemail.com; Becky Quick, of CNBC, at BerkshireQuestions@cnbc.com, and Andrew Ross Sorkin, of The New York Times, at arsorkin@nytimes.com.
From the questions submitted, each journalist will choose the dozen or so he or she decides are the most interesting and important. The journalists have told me your question has the best chance of being selected if you keep it concise, avoid sending it in at the last moment, make it Berkshire-related and include no more than two questions in any email you send them. (In your email, let the journalist know if you would like your name mentioned if your question is selected.)
Neither Charlie nor I will get so much as a clue about the questions to be asked. We know the journalists will pick some tough ones, and that’s the way we like it.
25
Table of Contents
We will again have a drawing at 8:15 a.m. on Saturday at each of 13 microphones for those shareholders wishing to ask questions themselves. At the meeting, I will alternate the questions asked by the journalists with those from the winning shareholders. We hope to answer at least 60 questions. From our standpoint, the more the better. Our goal, which we pursue both through these annual letters and by our meeting discussions, is to give you a better understanding of the business that you own.
* * * * * * * * * * * *
For good reason, I regularly extol the accomplishments of our operating managers. Equally important, however, are the 20 men and women who work with me at our corporate office (all on one floor, which is the way we intend to keep it!).
This group efficiently deals with a multitude of SEC and other regulatory requirements, files a 14,097-page Federal income tax return along with state and foreign returns, responds to countless shareholder and media inquiries, gets out the annual report, prepares for the country’s largest annual meeting, coordinates the Board’s activities – and the list goes on and on.
They handle all of these business tasks cheerfully and with unbelievable efficiency, making my life easy and joyful. Their efforts go beyond activities strictly related to Berkshire: They deal with 48 universities (selected from 200 applicants) who will send students to Omaha this school year for a day with me and also handle all kinds of requests that I receive, arrange my travel, and even get me hamburgers for lunch. No CEO has it better.
This home office crew has my deepest thanks and deserves yours as well. Come to our Woodstock for Capitalism on April 30th and tell them so.
| February 26, 2011 | Warren E. Buffett | |
| Chairman of the Board |
26
Table of Contents
and Subsidiaries
Selected Financial Data for the Past Five Years
(dollars in millions except per-share data)
| 2010 |
2009 |
2008 |
2007 |
2006 |
||||||||||||||||
| Revenues: |
||||||||||||||||||||
| Insurance premiums earned (1) |
$ | 30,749 | $ | 27,884 | $ | 25,525 | $ | 31,783 | $ | 23,964 | ||||||||||
| Sales and service revenues |
67,225 | 62,555 | 65,854 | 58,243 | 51,803 | |||||||||||||||
| Revenues of railroad, utilities and energy businesses (2) |
26,364 | 11,443 | 13,971 | 12,628 | 10,644 | |||||||||||||||
| Interest, dividend and other investment income |
5,215 | 5,531 | 5,140 | 5,161 | 4,568 | |||||||||||||||
| Interest and other revenues of finance and financial products businesses |
4,286 | 4,293 | 4,757 | 4,921 | 4,925 | |||||||||||||||
| Investment and derivative gains/losses (3) |
2,346 | 787 | (7,461 | ) | 5,509 | 2,635 | ||||||||||||||
| Total revenues |
$ | 136,185 | $ | 112,493 | $ | 107,786 | $ | 118,245 | $ | 98,539 | ||||||||||
| Earnings: |
||||||||||||||||||||
| Net earnings attributable to Berkshire Hathaway (3) |
$ | 12,967 | $ | 8,055 | $ | 4,994 | $ | 13,213 | $ | 11,015 | ||||||||||
| Net earnings per share attributable to Berkshire Hathaway shareholders (4) |
$ | 7,928 | $ | 5,193 | $ | 3,224 | $ | 8,548 | $ | 7,144 | ||||||||||
| Year-end data: |
||||||||||||||||||||
| Total assets |
$ | 372,229 | $ | 297,119 | $ | 267,399 | $ | 273,160 | $ | 248,437 | ||||||||||
| Notes payable and other borrowings: |
||||||||||||||||||||
| Insurance and other businesses |
12,471 | 4,561 | 5,149 | 3,447 | 4,431 | |||||||||||||||
| Railroad, utilities and energy businesses (2) |
31,626 | 19,579 | 19,145 | 19,002 | 16,946 | |||||||||||||||
| Finance and financial products businesses |
14,477 | 13,769 | 12,588 | 11,377 | 11,228 | |||||||||||||||
| Berkshire Hathaway shareholders’ equity |
157,318 | 131,102 | 109,267 | 120,733 | 108,419 | |||||||||||||||
| Class A equivalent common shares outstanding, in thousands |
1,648 | 1,552 | 1,549 | 1,548 | 1,543 | |||||||||||||||
| Berkshire Hathaway shareholders’ equity per outstanding Class A equivalent common share |
$ | 95,453 | $ | 84,487 | $ | 70,530 | $ | 78,008 | $ | 70,281 | ||||||||||
| (1) | Insurance premiums earned in 2007 included $7.1 billion from a single reinsurance transaction with Equitas. |
| (2) | On February 12, 2010, BNSF became a wholly-owned subsidiary of Berkshire and BNSF’s accounts are included in Berkshire’s Consolidated Financial Statements beginning as of February 13, 2010. From December 31, 2008 to February 12, 2010, Berkshire’s investment in BNSF common stock was accounted for pursuant to the equity method. |
| (3) | Investment gains/losses include realized gains and losses and non-cash other-than-temporary impairment losses. Derivative gains/losses include significant amounts related to non-cash changes in the fair value of long-term contracts arising from short-term changes in equity prices, interest rates and foreign currency rates, among other factors. After-tax investment and derivative gains/losses were $1.87 billion in 2010, $486 million in 2009, $(4.65) billion in 2008, $3.58 billion in 2007 and $1.71 billion in 2006. |
| (4) | Represents net earnings per equivalent Class A common share. Net earnings per Class B common share is equal to 1/1,500 of such amount. |
27
Table of Contents
ACQUISITION CRITERIA
We are eager to hear from principals or their representatives about businesses that meet all of the following criteria:
| (1) | Large purchases (at least $75 million of pre-tax earnings unless the business will fit into one of our existing units), |
| (2) | Demonstrated consistent earning power (future projections are of no interest to us, nor are “turnaround” situations), |
| (3) | Businesses earning good returns on equity while employing little or no debt, |
| (4) | Management in place (we can’t supply it), |
| (5) | Simple businesses (if there’s lots of technology, we won’t understand it), |
| (6) | An offering price (we don’t want to waste our time or that of the seller by talking, even preliminarily, about a transaction when price is unknown). |
The larger the company, the greater will be our interest: We would like to make an acquisition in the $5-20 billion range. We are not interested, however, in receiving suggestions about purchases we might make in the general stock market.
We will not engage in unfriendly takeovers. We can promise complete confidentiality and a very fast answer – customarily within five minutes – as to whether we’re interested. We prefer to buy for cash, but will consider issuing stock when we receive as much in intrinsic business value as we give. We don’t participate in auctions.
Charlie and I frequently get approached about acquisitions that don’t come close to meeting our tests: We’ve found that if you advertise an interest in buying collies, a lot of people will call hoping to sell you their cocker spaniels. A line from a country song expresses our feeling about new ventures, turnarounds, or auction-like sales: “When the phone don’t ring, you’ll know it’s me.”
MANAGEMENT’S REPORT ON INTERNAL CONTROL OVER FINANCIAL REPORTING
Management of Berkshire Hathaway Inc. is responsible for establishing and maintaining adequate internal control over financial reporting, as such term is defined in the Securities Exchange Act of 1934 Rule 13a-15(f). Under the supervision and with the participation of our management, including our principal executive officer and principal financial officer, we conducted an evaluation of the effectiveness of the Company’s internal control over financial reporting as of December 31, 2010 as required by the Securities Exchange Act of 1934 Rule 13a-15(c). In making this assessment, we used the criteria set forth in the framework in Internal Control – Integrated Framework issued by the Committee of Sponsoring Organizations of the Treadway Commission. Based on our evaluation under the framework in Internal Control – Integrated Framework, our management concluded that our internal control over financial reporting was effective as of December 31, 2010.
The effectiveness of our internal control over financial reporting as of December 31, 2010 has been audited by Deloitte & Touche LLP, an independent registered public accounting firm, as stated in their report which appears on the following page.
Berkshire Hathaway Inc.
February 25, 2011
28
Table of Contents
REPORT OF INDEPENDENT REGISTERED PUBLIC ACCOUNTING FIRM
To the Board of Directors and Shareholders of
Berkshire Hathaway Inc.
Omaha, Nebraska
We have audited the accompanying consolidated balance sheets of Berkshire Hathaway Inc. and subsidiaries (the “Company”) as of December 31, 2010 and 2009, and the related consolidated statements of earnings, cash flows and changes in shareholders’ equity and comprehensive income for each of the three years in the period ended December 31, 2010. We also have audited the Company’s internal control over financial reporting as of December 31, 2010, based on criteria established in Internal Control – Integrated Framework issued by the Committee of Sponsoring Organizations of the Treadway Commission. The Company’s management is responsible for these financial statements, for maintaining effective internal control over financial reporting, and for its assessment of the effectiveness of internal control over financial reporting, included in the accompanying Management’s Report on Internal Control over Financial Reporting. Our responsibility is to express an opinion on these financial statements and an opinion on the Company’s internal control over financial reporting based on our audits.
We conducted our audits in accordance with the standards of the Public Company Accounting Oversight Board (United States). Those standards require that we plan and perform the audit to obtain reasonable assurance about whether the financial statements are free of material misstatement and whether effective internal control over financial reporting was maintained in all material respects. Our audits of the financial statements included examining, on a test basis, evidence supporting the amounts and disclosures in the financial statements, assessing the accounting principles used and significant estimates made by management, and evaluating the overall financial statement presentation. Our audit of internal control over financial reporting included obtaining an understanding of internal control over financial reporting, assessing the risk that a material weakness exists, and testing and evaluating the design and operating effectiveness of internal control based on the assessed risk. Our audits also included performing such other procedures as we considered necessary in the circumstances. We believe that our audits provide a reasonable basis for our opinions.
A company’s internal control over financial reporting is a process designed by, or under the supervision of, the company’s principal executive and principal financial officers, or persons performing similar functions, and effected by the company’s board of directors, management, and other personnel to provide reasonable assurance regarding the reliability of financial reporting and the preparation of financial statements for external purposes in accordance with generally accepted accounting principles. A company’s internal control over financial reporting includes those policies and procedures that (1) pertain to the maintenance of records that, in reasonable detail, accurately and fairly reflect the transactions and dispositions of the assets of the company; (2) provide reasonable assurance that transactions are recorded as necessary to permit preparation of financial statements in accordance with generally accepted accounting principles, and that receipts and expenditures of the company are being made only in accordance with authorizations of management and directors of the company; and (3) provide reasonable assurance regarding prevention or timely detection of unauthorized acquisition, use, or disposition of the company’s assets that could have a material effect on the financial statements.
Because of the inherent limitations of internal control over financial reporting, including the possibility of collusion or improper management override of controls, material misstatements due to error or fraud may not be prevented or detected on a timely basis. Also, projections of any evaluation of the effectiveness of the internal control over financial reporting to future periods are subject to the risk that the controls may become inadequate because of changes in conditions, or that the degree of compliance with the policies or procedures may deteriorate.
In our opinion, the consolidated financial statements referred to above present fairly, in all material respects, the financial position of Berkshire Hathaway Inc. and subsidiaries as of December 31, 2010 and 2009, and the results of their operations and their cash flows for each of the three years in the period ended December 31, 2010, in conformity with accounting principles generally accepted in the United States of America. Also, in our opinion, the Company maintained, in all material respects, effective internal control over financial reporting as of December 31, 2010, based on the criteria established in Internal Control – Integrated Framework issued by the Committee of Sponsoring Organizations of the Treadway Commission.
DELOITTE & TOUCHE LLP
Omaha, Nebraska
February 25, 2011
29
Table of Contents
BERKSHIRE HATHAWAY INC.
and Subsidiaries
(dollars in millions)
| December 31, | ||||||||
| 2010 | 2009 | |||||||
| ASSETS |
||||||||
| Insurance and Other: |
||||||||
| Cash and cash equivalents |
$ | 34,767 | $ | 28,223 | ||||
| Investments: |
||||||||
| Fixed maturity securities |
33,803 | 35,729 | ||||||
| Equity securities |
59,819 | 56,562 | ||||||
| Other |
19,333 | 29,440 | ||||||
| Receivables |
20,917 | 14,792 | ||||||
| Inventories |
7,101 | 6,147 | ||||||
| Property, plant and equipment |
15,741 | 15,720 | ||||||
| Goodwill |
27,891 | 27,614 | ||||||
| Other |
13,529 | 13,070 | ||||||
| 232,901 | 227,297 | |||||||
| Railroad, Utilities and Energy: |
||||||||
| Cash and cash equivalents |
2,557 | 429 | ||||||
| Property, plant and equipment |
77,385 | 30,936 | ||||||
| Goodwill |
20,084 | 5,334 | ||||||
| Other |
13,579 | 8,072 | ||||||
| 113,605 | 44,771 | |||||||
| Finance and Financial Products: |
||||||||
| Cash and cash equivalents |
903 | 1,906 | ||||||
| Investments in fixed maturity securities |
1,080 | 1,402 | ||||||
| Other investments |
3,676 | 3,160 | ||||||
| Loans and finance receivables |
15,226 | 13,989 | ||||||
| Goodwill |
1,031 | 1,024 | ||||||
| Other |
3,807 | 3,570 | ||||||
| 25,723 | 25,051 | |||||||
| $ | 372,229 | $ | 297,119 | |||||
| LIABILITIES AND SHAREHOLDERS’ EQUITY |
||||||||
| Insurance and Other: |
||||||||
| Losses and loss adjustment expenses |
$ | 60,075 | $ | 59,416 | ||||
| Unearned premiums |
7,997 | 7,925 | ||||||
| Life, annuity and health insurance benefits |
8,565 | 5,228 | ||||||
| Accounts payable, accruals and other liabilities |
15,826 | 15,530 | ||||||
| Notes payable and other borrowings |
12,471 | 4,561 | ||||||
| 104,934 | 92,660 | |||||||
| Railroad, Utilities and Energy: |
||||||||
| Accounts payable, accruals and other liabilities |
12,367 | 5,895 | ||||||
| Notes payable and other borrowings |
31,626 | 19,579 | ||||||
| 43,993 | 25,474 | |||||||
| Finance and Financial Products: |
||||||||
| Accounts payable, accruals and other liabilities |
1,168 | 937 | ||||||
| Derivative contract liabilities |
8,371 | 9,269 | ||||||
| Notes payable and other borrowings |
14,477 | 13,769 | ||||||
| 24,016 | 23,975 | |||||||
| Income taxes, principally deferred |
36,352 | 19,225 | ||||||
| Total liabilities |
209,295 | 161,334 | ||||||
| Shareholders’ equity: |
||||||||
| Common stock |
8 | 8 | ||||||
| Capital in excess of par value |
37,533 | 27,074 | ||||||
| Accumulated other comprehensive income |
20,583 | 17,793 | ||||||
| Retained earnings |
99,194 | 86,227 | ||||||
| Berkshire Hathaway shareholders’ equity |
157,318 | 131,102 | ||||||
| Noncontrolling interests |
5,616 | 4,683 | ||||||
| Total shareholders’ equity |
162,934 | 135,785 | ||||||
| $ | 372,229 | $ | 297,119 | |||||
See accompanying Notes to Consolidated Financial Statements
30
Table of Contents
BERKSHIRE HATHAWAY INC.
and Subsidiaries
CONSOLIDATED STATEMENTS OF EARNINGS
(dollars in millions except per-share amounts)
| Year Ended December 31, | ||||||||||||
| 2010 | 2009 | 2008 | ||||||||||
| Revenues: |
||||||||||||
| Insurance and Other: |
||||||||||||
| Insurance premiums earned |
$ | 30,749 | $ | 27,884 | $ | 25,525 | ||||||
| Sales and service revenues |
67,225 | 62,555 | 65,854 | |||||||||
| Interest, dividend and other investment income |
5,215 | 5,531 | 5,140 | |||||||||
| Investment gains/losses |
4,044 | 358 | 1,166 | |||||||||
| Other-than-temporary impairment losses on investments |
(1,973 | ) | (3,155 | ) | (1,813 | ) | ||||||
| 105,260 | 93,173 | 95,872 | ||||||||||
| Railroad, Utilities and Energy: |
||||||||||||
| Operating revenues |
26,186 | 11,204 | 12,668 | |||||||||
| Other |
178 | 239 | 1,303 | |||||||||
| 26,364 | 11,443 | 13,971 | ||||||||||
| Finance and Financial Products: |
||||||||||||
| Interest, dividend and other investment income |
1,683 | 1,600 | 1,616 | |||||||||
| Investment gains/losses |
14 | (40 | ) | 7 | ||||||||
| Derivative gains/losses |
261 | 3,624 | (6,821 | ) | ||||||||
| Other |
2,603 | 2,693 | 3,141 | |||||||||
| 4,561 | 7,877 | (2,057 | ) | |||||||||
| 136,185 | 112,493 | 107,786 | ||||||||||
| Costs and expenses: |
||||||||||||
| Insurance and Other: |
||||||||||||
| Insurance losses and loss adjustment expenses |
18,087 | 18,251 | 16,259 | |||||||||
| Life, annuity and health insurance benefits |
4,453 | 1,937 | 1,942 | |||||||||
| Insurance underwriting expenses |
6,196 | 6,236 | 4,634 | |||||||||
| Cost of sales and services |
55,585 | 52,647 | 54,103 | |||||||||
| Selling, general and administrative expenses |
7,704 | 8,117 | 8,052 | |||||||||
| Interest expense |
278 | 189 | 212 | |||||||||
| 92,303 | 87,377 | 85,202 | ||||||||||
| Railroad, Utilities and Energy: |
||||||||||||
| Cost of sales and operating expenses |
19,637 | 8,739 | 9,840 | |||||||||
| Interest expense |
1,577 | 1,176 | 1,168 | |||||||||
| 21,214 | 9,915 | 11,008 | ||||||||||
| Finance and Financial Products: |
||||||||||||
| Interest expense |
703 | 627 | 583 | |||||||||
| Other |
2,914 | 3,022 | 3,419 | |||||||||
| 3,617 | 3,649 | 4,002 | ||||||||||
| 117,134 | 100,941 | 100,212 | ||||||||||
| Earnings before income taxes |
19,051 | 11,552 | 7,574 | |||||||||
| Income tax expense |
5,607 | 3,538 | 1,978 | |||||||||
| Earnings from equity method investments |
50 | 427 | — | |||||||||
| Net earnings |
13,494 | 8,441 | 5,596 | |||||||||
| Less: Earnings attributable to noncontrolling interests |
527 | 386 | 602 | |||||||||
| Net earnings attributable to Berkshire Hathaway |
$ | 12,967 | $ | 8,055 | $ | 4,994 | ||||||
| Average common shares outstanding * |
1,635,661 | 1,551,174 | 1,548,960 | |||||||||
| Net earnings per share attributable to Berkshire Hathaway shareholders * |
$ | 7,928 | $ | 5,193 | $ | 3,224 | ||||||
| * | Average shares outstanding include average Class A common shares and average Class B common shares determined on an equivalent Class A common stock basis. Net earnings per common share attributable to Berkshire Hathaway shown above represents net earnings per equivalent Class A common share. Net earnings per Class B common share is equal to one-fifteen-hundredth (1/1,500) of such amount or $5.29 per share for 2010, $3.46 per share for 2009 and $2.15 per share for 2008 after giving effect to the 50-for-1 Class B stock split that became effective on January 21, 2010. See Note 18. |
See accompanying Notes to Consolidated Financial Statements
31
Table of Contents
BERKSHIRE HATHAWAY INC.
and Subsidiaries
CONSOLIDATED STATEMENTS OF CASH FLOWS
(dollars in millions)
| Year Ended December 31, | ||||||||||||
| 2010 | 2009 | 2008 | ||||||||||
| Cash flows from operating activities: |
||||||||||||
| Net earnings |
$ | 13,494 | $ | 8,441 | $ | 5,596 | ||||||
| Adjustments to reconcile net earnings to operating cash flows: |
||||||||||||
| Investment (gains) losses and other-than-temporary impairment losses |
(2,085 | ) | 2,837 | 640 | ||||||||
| Depreciation |
4,279 | 3,127 | 2,810 | |||||||||
| Other |
255 | (149 | ) | (1,248 | ) | |||||||
| Changes in operating assets and liabilities before business acquisitions: |
||||||||||||
| Losses and loss adjustment expenses |
1,009 | 2,165 | 1,466 | |||||||||
| Deferred charges reinsurance assumed |
147 | (39 | ) | 64 | ||||||||
| Unearned premiums |
110 | (21 | ) | 1,311 | ||||||||
| Receivables and originated loans |
(1,979 | ) | 697 | (2,222 | ) | |||||||
| Derivative contract assets and liabilities |
(880 | ) | (5,441 | ) | 7,827 | |||||||
| Income taxes |
2,348 | 2,035 | (2,057 | ) | ||||||||
| Other assets and liabilities |
1,197 | 2,194 | (2,935 | ) | ||||||||
| Net cash flows from operating activities |
17,895 | 15,846 | 11,252 | |||||||||
| Cash flows from investing activities: |
||||||||||||
| Purchases of fixed maturity securities |
(9,819 | ) | (10,798 | ) | (35,615 | ) | ||||||
| Purchases of equity securities |
(4,265 | ) | (4,570 | ) | (10,140 | ) | ||||||
| Purchases of other investments |
— | (7,068 | ) | (14,452 | ) | |||||||
| Sales of fixed maturity securities |
5,435 | 4,338 | 14,796 | |||||||||
| Redemptions and maturities of fixed maturity securities |
6,517 | 5,234 | 18,550 | |||||||||
| Sales of equity securities |
5,886 | 5,626 | 6,840 | |||||||||
| Purchases of loans and finance receivables |
(3,149 | ) | (854 | ) | (1,446 | ) | ||||||
| Principal collections on loans and finance receivables |
3,498 | 796 | 740 | |||||||||
| Acquisitions of businesses, net of cash acquired |
(15,924 | ) | (108 | ) | (6,050 | ) | ||||||
| Purchases of property, plant and equipment |
(5,980 | ) | (4,937 | ) | (6,138 | ) | ||||||
| Other |
(476 | ) | 1,180 | 849 | ||||||||
| Net cash flows from investing activities |
(18,277 | ) | (11,161 | ) | (32,066 | ) | ||||||
| Cash flows from financing activities: |
||||||||||||
| Proceeds from borrowings of insurance and other businesses |
8,204 | 289 | 134 | |||||||||
| Proceeds from borrowings of railroad, utilities and energy businesses |
1,731 | 1,241 | 2,147 | |||||||||
| Proceeds from borrowings of finance businesses |
1,539 | 1,584 | 5,195 | |||||||||
| Repayments of borrowings of insurance and other businesses |
(430 | ) | (746 | ) | (247 | ) | ||||||
| Repayments of borrowings of railroad, utilities and energy businesses |
(777 | ) | (444 | ) | (2,147 | ) | ||||||
| Repayments of borrowings of finance businesses |
(2,417 | ) | (396 | ) | (3,847 | ) | ||||||
| Changes in short term borrowings, net |
370 | (885 | ) | 1,183 | ||||||||
| Acquisitions of noncontrolling interests and other |
(95 | ) | (410 | ) | (132 | ) | ||||||
| Net cash flows from financing activities |
8,125 | 233 | 2,286 | |||||||||
| Effects of foreign currency exchange rate changes |
(74 | ) | 101 | (262 | ) | |||||||
| Increase (decrease) in cash and cash equivalents |
7,669 | 5,019 | (18,790 | ) | ||||||||
| Cash and cash equivalents at beginning of year |
30,558 | 25,539 | 44,329 | |||||||||
| Cash and cash equivalents at end of year * |
$ | 38,227 | $ | 30,558 | $ | 25,539 | ||||||
| * Cash and cash equivalents at end of year are comprised of the following: |
||||||||||||
| Insurance and Other |
$ | 34,767 | $ | 28,223 | $ | 24,356 | ||||||
| Railroad, Utilities and Energy |
2,557 | 429 | 280 | |||||||||
| Finance and Financial Products |
903 | 1,906 | 903 | |||||||||
| $ | 38,227 | $ | 30,558 | $ | 25,539 | |||||||
See accompanying Notes to Consolidated Financial Statements
32
Table of Contents
BERKSHIRE HATHAWAY INC.
and Subsidiaries
CONSOLIDATED STATEMENTS OF CHANGES IN SHAREHOLDERS’ EQUITY
(dollars in millions)
| Berkshire Hathaway shareholders’ equity | Non- controlling interests |
|||||||||||||||||||
| Common stock and capital in excess of par value |
Accumulated other comprehensive income |
Retained earnings |
Total | |||||||||||||||||
| Balance at December 31, 2007 |
$ | 26,960 | $ | 21,620 | $ | 72,153 | $ | 120,733 | $ | 2,668 | ||||||||||
| Net earnings |
— | — | 4,994 | 4,994 | 602 | |||||||||||||||
| Other comprehensive income, net |
— | (17,267 | ) | — | (17,267 | ) | (255 | ) | ||||||||||||
| Adoption of equity method |
— | (399 | ) | 1,025 | 626 | — | ||||||||||||||
| Issuance of common stock and other transactions |
181 | — | — | 181 | — | |||||||||||||||
| Adoption of new accounting pronouncements |
— | — | — | — | 128 | |||||||||||||||
| Changes in noncontrolling interests: |
||||||||||||||||||||
| Business acquisitions |
— | — | — | — | 1,568 | |||||||||||||||
| Interests acquired and other transactions |
— | — | — | — | (271 | ) | ||||||||||||||
| Balance at December 31, 2008 |
27,141 | 3,954 | 78,172 | 109,267 | 4,440 | |||||||||||||||
| Net earnings |
— | — | 8,055 | 8,055 | 386 | |||||||||||||||
| Other comprehensive income, net |
— | 13,729 | — | 13,729 | 199 | |||||||||||||||
| Issuance of common stock and other transactions |
172 | — | — | 172 | — | |||||||||||||||
| Changes in noncontrolling interests: |
||||||||||||||||||||
| Interests acquired and other transactions |
(231 | ) | 110 | — | (121 | ) | (342 | ) | ||||||||||||
| Balance at December 31, 2009 |
27,082 | 17,793 | 86,227 | 131,102 | 4,683 | |||||||||||||||
| Net earnings |
— | — | 12,967 | 12,967 | 527 | |||||||||||||||
| Other comprehensive income, net |
— | 2,789 | — | 2,789 | 9 | |||||||||||||||
| Issuance of common stock and other transactions |
11,096 | — | — | 11,096 | — | |||||||||||||||
| Changes in noncontrolling interests: |
||||||||||||||||||||
| Interests acquired and other transactions |
(637 | ) | 1 | — | (636 | ) | 397 | |||||||||||||
| Balance at December 31, 2010 |
$ | 37,541 | $ | 20,583 | $ | 99,194 | $ | 157,318 | $ | 5,616 | ||||||||||
CONSOLIDATED STATEMENTS OF COMPREHENSIVE INCOME
(dollars in millions)
| 2010 | 2009 | 2008 | ||||||||||
| Comprehensive income attributable to Berkshire Hathaway: |
||||||||||||
| Net earnings |
$ | 12,967 | $ | 8,055 | $ | 4,994 | ||||||
| Other comprehensive income: |
||||||||||||
| Net change in unrealized appreciation of investments |
5,398 | 17,607 | (23,342 | ) | ||||||||
| Applicable income taxes |
(1,866 | ) | (6,263 | ) | 8,257 | |||||||
| Reclassification of investment appreciation in net earnings |
(1,068 | ) | 2,768 | 895 | ||||||||
| Applicable income taxes |
374 | (969 | ) | (313 | ) | |||||||
| Foreign currency translation |
(172 | ) | 851 | (2,140 | ) | |||||||
| Applicable income taxes |
(21 | ) | (17 | ) | 118 | |||||||
| Prior service cost and actuarial gains/losses of defined benefit plans |
(76 | ) | (41 | ) | (1,071 | ) | ||||||
| Applicable income taxes |
25 | (1 | ) | 389 | ||||||||
| Other, net |
195 | (206 | ) | (60 | ) | |||||||
| Other comprehensive income, net |
2,789 | 13,729 | (17,267 | ) | ||||||||
| Comprehensive income attributable to Berkshire Hathaway |
$ | 15,756 | $ | 21,784 | $ | (12,273 | ) | |||||
| Comprehensive income of noncontrolling interests |
$ | 536 | $ | 585 | $ | 347 | ||||||
See accompanying Notes to Consolidated Financial Statements
33
Table of Contents
BERKSHIRE HATHAWAY INC.
and Subsidiaries
NOTES TO CONSOLIDATED FINANCIAL STATEMENTS
December 31, 2010
| (1) | Significant accounting policies and practices |
| (a) | Nature of operations and basis of consolidation |
Berkshire Hathaway Inc. (“Berkshire”) is a holding company owning subsidiaries engaged in a number of diverse business activities, including property and casualty insurance and reinsurance, railroad, utilities and energy, finance, manufacturing, service and retailing. In these notes the terms “us,” “we,” or “our” refer to Berkshire and its consolidated subsidiaries. Further information regarding our reportable business segments is contained in Note 21. Significant business acquisitions completed over the past three years are discussed in Note 2.
The accompanying Consolidated Financial Statements include the accounts of Berkshire consolidated with the accounts of all subsidiaries and affiliates in which we hold a controlling financial interest as of the financial statement date. Normally a controlling financial interest reflects ownership of a majority of the voting interests. We consolidate a variable interest entity (“VIE”) when we possess both the power to direct the activities of the VIE that most significantly impact its economic performance and we are either obligated to absorb the losses that could potentially be significant to the VIE or we hold the right to receive benefits from the VIE that could potentially be significant to the VIE.
Intercompany accounts and transactions have been eliminated. Certain amounts in prior year presentations have been reclassified to conform with the current year presentation.
| (b) | Use of estimates in preparation of financial statements |
The preparation of our Consolidated Financial Statements in conformity with accounting principles generally accepted in the United States (“GAAP”) requires us to make estimates and assumptions that affect the reported amounts of assets and liabilities at the date of the financial statements and the reported amounts of revenues and expenses during the period. In particular, estimates of unpaid losses and loss adjustment expenses and related recoverables under reinsurance for property and casualty insurance are subject to considerable estimation error due to the inherent uncertainty in projecting ultimate claim amounts that will be settled over many years. In addition, estimates and assumptions associated with the amortization of deferred charges reinsurance assumed, determinations of fair values of certain financial instruments and evaluations of goodwill for impairment require considerable judgment. Actual results may differ from the estimates used in preparing our Consolidated Financial Statements.
| (c) | Cash and cash equivalents |
Cash equivalents consist of funds invested in U.S. Treasury Bills, money market accounts, demand deposits and other investments with a maturity of three months or less when purchased.
| (d) | Investments |
We determine the appropriate classification of investments in fixed maturity and equity securities at the acquisition date and re-evaluate the classification at each balance sheet date. Held-to-maturity investments are carried at amortized cost, reflecting the ability and intent to hold the securities to maturity. Trading investments are carried at fair value and include securities acquired with the intent to sell in the near term. All other securities are classified as available-for-sale and are carried at fair value with net unrealized gains or losses reported as a component of accumulated other comprehensive income.
We utilize the equity method of accounting with respect to investments when we possess the ability to exercise significant influence, but not control, over the operating and financial policies of the investee. The ability to exercise significant influence is presumed when an investor possesses more than 20% of the voting interests of the investee. This presumption may be overcome based on specific facts and circumstances that demonstrate that the ability to exercise significant influence is restricted. We apply the equity method to investments in common stock and to other investments when such other investments possess substantially identical subordinated interests to common stock. In applying the equity method with respect to investments previously accounted for at cost or fair value, the carrying value of the investment is adjusted on a step-by-step basis as if the equity method had been applied from the time the investment was first acquired.
34
Table of Contents
Notes to Consolidated Financial Statements (Continued)
| (1) | Significant accounting policies and practices (Continued) |
| (d) | Investments (Continued) |
In applying the equity method, we record our investment at cost and subsequently increase or decrease the carrying amount of the investment by our proportionate share of the net earnings or losses and other comprehensive income of the investee. We record dividends or other equity distributions as reductions in the carrying value of the investment. In the event that net losses of the investee reduce the carrying amount to zero, additional net losses may be recorded if other investments in the investee are at-risk even if we have not committed to provide financial support to the investee. Such additional equity method losses, if any, are based upon the change in our claim on the investee’s book value.
Investment gains and losses arise when investments are sold (as determined on a specific identification basis) or are other-than-temporarily impaired. If a decline in the value of an investment below cost is deemed other than temporary, the cost of the investment is written down to fair value, with a corresponding charge to earnings. Factors considered in judging whether an impairment is other than temporary include: the financial condition, business prospects and creditworthiness of the issuer, the relative amount of the decline, our ability and intent to hold the investment until the fair value recovers and the length of time that fair value has been less than cost. With respect to an investment in a debt security, we recognize an other-than-temporary impairment if we (a) intend to sell or expect to be required to sell before amortized cost is recovered or (b) do not expect to ultimately recover the amortized cost basis even if we do not intend to sell the security. We recognize losses under (a) in earnings and under (b) we recognize the credit loss component in earnings and the difference between fair value and the amortized cost basis net of the credit loss in other comprehensive income.
| (e) | Receivables, loans and finance receivables |
Trade, premium and other receivables of the insurance and other businesses are stated at the outstanding principal amounts, net of estimated allowances for uncollectible balances. Allowances for uncollectible balances are provided when as of the balance sheet date it is probable counterparties will be unable to pay all amounts due based on the contractual terms and the loss amounts can be reasonably estimated. Receivables are generally written off against allowances after all reasonable collection efforts are exhausted.
Loans and finance receivables consist of consumer loans (primarily manufactured housing and other real estate loans) and commercial loans originated or purchased. Loans and finance receivables are stated at amortized cost based on our ability and intent to hold such loans and receivables to maturity and are stated net of allowances for uncollectible accounts. Amortized cost represents acquisition cost, plus or minus origination and commitment costs paid or fees received, which together with acquisition premiums or discounts, are deferred and amortized as yield adjustments over the life of the loan. Loans and finance receivables include loan securitizations issued when we have the power to direct and the right to receive residual returns. Substantially all of our consumer loans are secured by real or personal property.
Allowances for credit losses from manufactured housing and other real estate loans include estimates of losses on loans currently in foreclosure and losses on loans not currently in foreclosure. Estimates of losses on loans in foreclosure are based on historical experience and collateral recovery rates. Estimates of losses on loans not currently in foreclosure consider historical default, collateral recovery rates and existing economic conditions. Allowances for credit losses also incorporate the historical average time elapsed from the last payment until foreclosure.
Loans in which payments are delinquent (with no grace period) are considered past due. Loans which are over 90 days past due, in foreclosure, or where borrowers are in bankruptcy, are placed on nonaccrual status and interest previously accrued but not collected is reversed. Subsequent amounts received on the loans are first applied to the principal and interest owed for the most delinquent amount. Interest income accruals are resumed once a loan is less than 90 days delinquent.
Loans in the foreclosure process are considered non-performing. Once a loan is in foreclosure, interest income is not recognized unless the foreclosure is cured or the loan is modified. Once a modification is complete, interest income is recognized based on the terms of the new loan. Loans that have gone through foreclosure are charged off when the collateral is sold. Loans not in foreclosure are evaluated for charge off based on individual circumstances that indicate future collectability of the loan, including the condition of the collateral securing the loan.
35
Table of Contents
Notes to Consolidated Financial Statements (Continued)
| (1) | Significant accounting policies and practices (Continued) |
| (f) | Derivatives |
We carry derivative contracts at estimated fair value in the accompanying Consolidated Balance Sheets. Such balances reflect reductions permitted under master netting agreements with counterparties. The changes in fair value of derivative contracts that do not qualify as hedging instruments for financial reporting purposes are recorded in earnings as derivative gains/losses.
Cash collateral received from or paid to counterparties to secure derivative contract assets or liabilities is included in other liabilities or assets. Securities received from counterparties as collateral are not recorded as assets and securities delivered to counterparties as collateral continue to be reflected as assets in our Consolidated Balance Sheets.
| (g) | Fair value measurements |
As defined under GAAP, fair value is the price that would be received to sell an asset or paid to transfer a liability between market participants in the principal market or in the most advantageous market when no principal market exists. Adjustments to transaction prices or quoted market prices may be required in illiquid or disorderly markets in order to estimate fair value. Different valuation techniques may be appropriate under the circumstances to determine the value that would be received to sell an asset or paid to transfer a liability in an orderly transaction. Market participants are assumed to be independent, knowledgeable, able and willing to transact an exchange and not under duress. Nonperformance or credit risk is considered in determining the fair value of liabilities. Considerable judgment may be required in interpreting market data used to develop the estimates of fair value. Accordingly, estimates of fair value presented herein are not necessarily indicative of the amounts that could be realized in a current or future market exchange.
| (h) | Inventories |
Inventories consist of manufactured goods and goods acquired for resale. Manufactured inventory costs include raw materials, direct and indirect labor and factory overhead. Inventories are stated at the lower of cost or market. As of December 31, 2010, approximately 39% of the total inventory cost was determined using the last-in-first-out (“LIFO”) method, 32% using the first-in-first-out (“FIFO”) method, with the remainder using the specific identification method or average cost methods. With respect to inventories carried at LIFO cost, the aggregate difference in value between LIFO cost and cost determined under FIFO methods was $637 million and $575 million as of December 31, 2010 and 2009, respectively.
| (i) | Property, plant and equipment |
Additions to property, plant and equipment are recorded at cost. The cost of major additions and betterments are capitalized, while the cost of replacements, maintenance and repairs, that do not improve or extend the useful lives of the related assets are expensed as incurred. Interest over the construction period is capitalized as a component of cost of constructed assets. The cost of constructed assets of certain of our regulated utility and energy subsidiaries that are subject to ASC 980 Regulated Operations also includes an equity allowance for funds used during construction. Also see Note 1(p).
Depreciation is provided principally on the straight-line method over estimated useful lives. Depreciation of assets of regulated utility and energy subsidiaries is provided over recovery periods based on composite asset class lives. Railroad properties are depreciated using the group method in which a single depreciation rate is applied to the gross investment in a particular class of property, despite differences in the service life or salvage value of individual property units within the same class.
We evaluate property, plant and equipment for impairment when events or changes in circumstances indicate that the carrying value of such assets may not be recoverable or the assets are being held for sale. Upon the occurrence of a triggering event, we review the asset to assess whether the estimated undiscounted cash flows expected from the use of the asset plus residual value from the ultimate disposal exceeds the carrying value of the asset. If the carrying value exceeds the estimated recoverable amounts, we write down the asset to the estimated fair value. Impairment losses are reflected in the Consolidated Statements of Earnings, except with respect to impairments of assets of certain domestic regulated utility and energy subsidiaries where impairment losses are offset by the establishment of a regulatory asset to the extent recovery in future rates is probable.
36
Table of Contents
Notes to Consolidated Financial Statements (Continued)
| (1) | Significant accounting policies and practices (Continued) |
| (i) | Property, plant and equipment (Continued) |
Our railroad business is very capital intensive and its large base of homogenous, network-type assets turns over on a continuous basis. Each year, a capital program is developed for the replacement of assets and for the acquisition or construction of assets to enhance the efficiency of operations, gain strategic benefit or provide new service offerings to customers. Assets purchased or constructed throughout the year are capitalized if they meet applicable minimum units of property criteria. Normal repairs and maintenance are charged to operating expense as incurred, while costs incurred that extend the useful life of an asset, improve the safety of our operations, or improve operating efficiency are capitalized. Rail grinding costs are expensed as incurred.
| (j) | Goodwill |
Goodwill represents the excess of the purchase price over the fair value of identifiable net assets acquired in business acquisitions. We evaluate goodwill for impairment at least annually. Evaluating goodwill for impairment involves a two-step process. The first step is to estimate the fair value of the reporting unit. There are several methods that may be used to estimate a reporting unit’s fair value, including market quotations, asset and liability fair values and other valuation techniques, including, but not limited to, discounted projected future net earnings or net cash flows and multiples of earnings. If the carrying amount of a reporting unit, including goodwill, exceeds the estimated fair value, a second step is performed. Under the second step, the identifiable assets and liabilities of the reporting unit are estimated at fair value as of the current testing date. The excess of the estimated fair value of the reporting unit over the current estimated fair value of net assets establishes the implied value of goodwill. The excess of the recorded goodwill over the implied goodwill value is charged to earnings as an impairment loss. A significant amount of judgment is required in estimating the fair value of the reporting unit and performing goodwill impairment tests.
| (k) | Revenue recognition |
Insurance premiums for prospective property/casualty and health insurance and reinsurance are earned over the loss exposure or coverage period, in proportion to the level of protection provided. In most cases, premiums are recognized as revenues ratably over the term of the contract with unearned premiums computed on a monthly or daily pro rata basis. Premiums for retroactive reinsurance property/casualty policies are earned at the inception of the contracts, as all of the underlying loss events covered by these policies occurred in the past. Premiums for life reinsurance contracts are earned when due. Premiums earned are stated net of amounts ceded to reinsurers. Premiums are estimated with respect to certain reinsurance contracts where reports from ceding companies for the period are not contractually due until after the balance sheet date. For contracts containing experience rating provisions, premiums are based upon estimated loss experience under the contract.
Sales revenues derive from the sales of manufactured products and goods acquired for resale. Revenues from sales are recognized upon passage of title to the customer, which generally coincides with customer pickup, product delivery or acceptance, depending on terms of the sales arrangement.
Service revenues are recognized as the services are performed. Services provided pursuant to a contract are either recognized over the contract period or upon completion of the elements specified in the contract depending on the terms of the contract. Revenues related to the sales of fractional ownership interests in aircraft are recognized ratably over the term of the related management services agreement as the transfer of ownership interest in the aircraft is inseparable from the management services agreement.
Interest income from investments in fixed maturity securities and loans is earned under the constant yield method and includes accrual of interest due under terms of the agreement as well as amortization of acquisition premiums, accruable discounts and capitalized loan origination fees, as applicable. In determining the constant yield for mortgage-backed securities, anticipated counterparty prepayments are estimated and evaluated periodically. Dividends from equity securities are recognized when earned, which is on the ex-dividend date or the declaration date, when there is no ex-dividend date.
Operating revenue of utilities and energy businesses resulting from the distribution and sale of natural gas and electricity to customers is recognized when the service is rendered or the energy is delivered. Amounts recognized include unbilled as well as billed amounts. Rates charged are generally subject to federal and state regulation or established under contractual arrangements. When preliminary rates are permitted to be billed prior to final approval by the applicable regulator, certain revenue collected may be subject to refund and a liability for estimated refunds is accrued.
37
Table of Contents
Notes to Consolidated Financial Statements (Continued)
| (1) | Significant accounting policies and practices (Continued) |
| (k) | Revenue recognition (Continued) |
Railroad transportation revenues are recognized based upon the proportion of service provided as of the balance sheet date. Customer incentives, which are primarily provided for shipping a specified cumulative volume or shipping to/from specific locations, are recorded as a reduction to revenue on a pro-rata basis based on actual or projected future customer shipments. When using projected shipments, we rely on historic trends as well as economic and other indicators to estimate the liability for customer incentives.
| (l) | Losses and loss adjustment expenses |
Liabilities for unpaid losses and loss adjustment expenses represent estimated claim and claim settlement costs of property/casualty insurance and reinsurance contracts issued by our insurance subsidiaries with respect to losses that have occurred as of the balance sheet date. The liabilities for losses and loss adjustment expenses are recorded at the estimated ultimate payment amounts, except that amounts arising from certain workers’ compensation reinsurance business are discounted as discussed below. Estimated ultimate payment amounts are based upon (1) individual case estimates, (2) reports of losses from policyholders and (3) estimates of incurred but not reported losses.
Provisions for losses and loss adjustment expenses are charged to earnings after deducting amounts recovered and estimates of amounts ceded under reinsurance contracts. Reinsurance contracts do not relieve the ceding company of its obligations to indemnify policyholders with respect to the underlying insurance and reinsurance contracts.
The estimated liabilities of workers’ compensation claims assumed under certain reinsurance contracts are carried at discounted amounts. Discounted amounts are based upon an annual discount rate of 4.5% for claims arising prior to January 1, 2003 and 1% for claims arising thereafter, consistent with discount rates used under insurance statutory accounting principles. The change in such reserve discounts, including the periodic discount accretion is included in earnings as a component of losses and loss adjustment expenses.
| (m) | Deferred charges reinsurance assumed |
Estimated liabilities for claims and claim costs in excess of the consideration received with respect to retroactive property and casualty reinsurance contracts that provide for indemnification of insurance risk are established as deferred charges at inception of such contracts. Deferred charges are subsequently amortized using the interest method over the expected claim settlement periods. Changes to the estimated timing or amount of loss payments produce changes in periodic amortization. Changes in such estimates are applied retrospectively and are included in insurance losses and loss adjustment expenses in the period of the change. The unamortized balances of deferred charges reinsurance assumed were $3,810 million and $3,957 million at December 31, 2010 and 2009, respectively.
| (n) | Insurance premium acquisition costs |
Costs that vary with and are related to the issuance of insurance policies are deferred, subject to ultimate recoverability, and are charged to underwriting expenses as the related premiums are earned. Acquisition costs consist of commissions, premium taxes, advertising and certain other costs. The recoverability of premium acquisition costs generally reflects anticipation of investment income. The unamortized balances of deferred premium acquisition costs are included in other assets and were $1,768 million and $1,770 million at December 31, 2010 and 2009, respectively.
| (p) | Regulated utilities and energy businesses |
Certain domestic energy subsidiaries prepare their financial statements in accordance with ASC 980 Regulated Operations, reflecting the economic effects from the ability to recover certain costs from customers and the requirement to return revenues to customers in the future through the regulated rate-setting process. Accordingly, certain costs are deferred as regulatory assets and obligations are accrued as regulatory liabilities which will be amortized over various future periods. At December 31, 2010, the Consolidated Balance Sheet includes $2,497 million in regulatory assets and $1,664 million in regulatory liabilities. At December 31, 2009, the Consolidated Balance Sheet includes $2,093 million in regulatory assets and $1,603 million in regulatory liabilities. Regulatory assets and liabilities are components of other assets and other liabilities of utilities and energy businesses.
38
Table of Contents
Notes to Consolidated Financial Statements (Continued)
| (1) | Significant accounting policies and practices (Continued) |
| (p) | Regulated utilities and energy businesses (Continued) |
Regulatory assets and liabilities are continually assessed for probable future inclusion in regulatory rates by considering factors such as applicable regulatory or legislative changes and recent rate orders received by other regulated entities. If future inclusion in regulatory rates ceases to be probable, the amount no longer probable of inclusion in regulatory rates is charged to earnings or reflected as an adjustment to rates.
| (q) | Life, annuity and health insurance benefits |
The liability for insurance benefits under life contracts has been computed based upon estimated future investment yields, expected mortality, morbidity, and lapse or withdrawal rates and reflect estimates for future premiums and expenses under the contracts. These assumptions, as applicable, also include a margin for adverse deviation and may vary with the characteristics of the reinsurance contract’s date of issuance, policy duration and country of risk. The interest rate assumptions used may vary by reinsurance contract or jurisdiction and generally range from approximately 3% to 6%. Annuity contracts are discounted based on the implicit rate of return as of the inception of the contracts and such interest rates range from approximately 1% to 7%.
| (r) | Foreign currency |
The accounts of our non-U.S. based subsidiaries are measured in most instances using the local currency of the subsidiary as the functional currency. Revenues and expenses of these businesses are generally translated into U.S. Dollars at the average exchange rate for the period. Assets and liabilities are translated at the exchange rate as of the end of the reporting period. Gains or losses from translating the financial statements of foreign-based operations are included in shareholders’ equity as a component of accumulated other comprehensive income. Gains and losses arising from transactions denominated in a currency other than the functional currency of the entity that is party to the transaction are included in earnings.
| (s) | Income taxes |
We file a consolidated federal income tax return in the United States, which includes our eligible subsidiaries. In addition, we file income tax returns in state, local and foreign jurisdictions as applicable. Provisions for current income tax liabilities are calculated and accrued on income and expense amounts expected to be included in the income tax returns for the current year.
Deferred income taxes are calculated under the liability method. Deferred income tax assets and liabilities are based on differences between the financial statement and tax basis of assets and liabilities at the enacted tax rates. Changes in deferred income tax assets and liabilities that are associated with components of other comprehensive income are charged or credited directly to other comprehensive income. Otherwise, changes in deferred income tax assets and liabilities are included as a component of income tax expense. Changes in deferred income tax assets and liabilities attributable to changes in enacted tax rates are charged or credited to income tax expense in the period of enactment. Valuation allowances are established for certain deferred tax assets where realization is not likely.
Assets and liabilities are established for uncertain tax positions taken or positions expected to be taken in income tax returns when such positions are judged to not meet the “more-likely-than-not” threshold based on the technical merits of the positions. Estimated interest and penalties related to uncertain tax positions are generally included as a component of income tax expense.
| (t) | New accounting pronouncements |
We adopted FASB Accounting Standards Updates (“ASU”) 2009-16 and ASU 2009-17 as of January 1, 2010. ASU 2009-16 eliminated the concept of a qualifying special-purpose entity (“QSPE”) and the exemption of QSPEs from previous consolidation guidance and also modified the criteria for derecognizing financial assets by transferors. ASU 2009-17 amended the standards related to consolidation of variable interest entities. ASU 2009-17 included new criteria for determining the primary beneficiary of VIEs and increased the frequency in which reassessments must be made to determine the primary beneficiary of VIEs. The guidance in these standards is applied prospectively except that upon the adoption of ASU 2009-17 we reevaluated VIEs for purposes of determining whether or not those entities should be included in our Consolidated Financial Statements based on the new guidance. See Notes 7 and 14 for information concerning the most significant impact of adopting these pronouncements.
39
Table of Contents
Notes to Consolidated Financial Statements (Continued)
| (1) | Significant accounting policies and practices (Continued) |
| (t) | New accounting pronouncements (Continued) |
In January 2010, the FASB issued ASU 2010-06, “Improving Disclosures About Fair Value Measurements.” ASU 2010-06 requires the separate disclosure of significant transfers into and out of the Level 1 and Level 2 categories; requires fair value measurement disclosures for each class of assets and liabilities; and requires disclosures about valuation techniques and inputs used in Level 2 and Level 3 fair value measurements. These disclosure requirements became effective at the beginning of 2010. In addition, effective in fiscal years beginning after December 15, 2010, ASU 2010-06 also requires Level 3 disclosures of activity on a gross rather than a net basis. We do not anticipate that the remaining disclosures under ASU 2010-06 will have a material impact on our Consolidated Financial Statements.
In July 2010, the FASB issued ASU 2010-20, “Disclosures about the Credit Quality of Financing Receivables and the Allowance for Credit Losses.” ASU 2010-20 requires increased disclosures about the credit quality of financing receivables and allowances for credit losses, including disclosure about credit quality indicators, past due information and modifications of finance receivables. The guidance regarding end of period reporting is effective for reporting periods ending after December 15, 2010, while guidance about activity during the reporting period is effective for reporting periods beginning after December 15, 2010, except for guidance regarding loan modifications, which has been delayed. We do not anticipate that the adoption of ASU 2010-20 will have a material impact on our Consolidated Financial Statements.
In October 2010, the FASB issued ASU 2010-26, “Accounting for Costs Associated with Acquiring or Renewing Insurance Contracts.” ASU 2010-26 modifies the types of costs incurred by insurance entities that are deferred in the acquiring or renewing of insurance contracts. ASU 2010-26 requires that only direct incremental costs related to successful efforts are capitalized. Capitalized costs may include certain advertising costs which are allowed to be capitalized if the primary purpose of the advertising is to elicit sales to customers proven to have responded directly to the advertising and the probable future revenues generated from the advertising are proven to be in excess of expected future costs to be incurred in realizing those revenues. ASU 2010-26 is effective for fiscal years and interim periods beginning after December 15, 2011 and may be applied on a prospective or retrospective basis. We are evaluating the effect that the adoption of ASU 2010-26 will have on our Consolidated Financial Statements.
In December 2010, the FASB issued ASU 2010-28, “When to Perform Step 2 of the Goodwill Impairment Test for Reporting Units with Zero or Negative Carrying Amounts.” ASU 2010-28 modifies Step 1 of the goodwill impairment test for reporting units with zero or negative carrying amounts. For those reporting units, Step 2 of the goodwill impairment test is required if it is more likely than not that a goodwill impairment exists, after considering whether there are any adverse qualitative factors indicating that an impairment may exist. ASU 2010-28 is effective prospectively for fiscal years and interim periods beginning after December 15, 2011. We do not anticipate the adoption of ASU 2010-28 will have a material impact on our Consolidated Financial Statements.
| (2) | Significant business acquisitions |
Our long-held acquisition strategy is to purchase businesses with consistent earning power, good returns on equity and able and honest management at sensible prices.
On February 12, 2010, we acquired all of the outstanding common stock of the Burlington Northern Santa Fe Corporation that we did not already own (about 264.5 million shares or 77.5%) for aggregate consideration of $26.5 billion that consisted of cash of approximately $15.9 billion with the remainder in Berkshire common stock (80,931 Class A shares and 20,976,621 Class B shares). Approximately 50% of the cash component was funded with existing cash balances and the remaining 50% was funded with proceeds from debt issued by Berkshire. The acquisition was completed through the merger of a wholly-owned merger subsidiary (a Delaware limited liability company) and Burlington Northern Santa Fe Corporation. The merger subsidiary was the surviving entity and was renamed Burlington Northern Santa Fe, LLC (“BNSF”). BNSF is based in Fort Worth, Texas, and through BNSF Railway Company operates one of the largest railroad systems in North America with approximately 32,000 route miles (including 23,000 route miles of track owned by BNSF) of track in 28 states and two Canadian provinces.
40
Table of Contents
Notes to Consolidated Financial Statements (Continued)
| (2) | Significant business acquisitions (Continued) |
Prior to February 12, 2010, we owned 76.8 million shares of BNSF (22.5% of the outstanding shares), which were acquired between August 2006 and January 2009. We accounted for those shares pursuant to the equity method and as of February 12, 2010, our investment had a carrying value of $6.6 billion. We are accounting for the acquisition of BNSF pursuant to the acquisition method under Accounting Standards Codification Section 805 Business Combinations (“ASC 805”). Upon completion of the acquisition of the remaining BNSF shares, we were required under ASC 805 to re-measure our previously owned investment in BNSF at fair value as of the acquisition date. In the first quarter of 2010, we recognized a one-time holding gain of approximately $1.0 billion for the difference between the fair value of the BNSF shares and our carrying value under the equity method.
The allocation of the aggregate $34.5 billion purchase price (including the fair value of the previously owned shares of BNSF and the value of certain BNSF outstanding equity awards that were converted into Berkshire Class B equity awards on the acquisition date) to BNSF’s assets and liabilities is summarized below (in millions):
BNSF’s financial statements are included in our Consolidated Financial Statements beginning as of February 13, 2010. The following table sets forth certain unaudited pro forma consolidated earnings data for the years ended December 31, 2010 and 2009, as if the BNSF acquisition was consummated on the same terms at the beginning of 2010 and 2009. Amounts are in millions, except earnings per share.
| 2010 | 2009 | |||||||
| Total revenues |
$ | 138,004 | $ | 126,745 | ||||
| Net earnings attributable to Berkshire Hathaway shareholders |
13,213 | 9,525 | ||||||
| Earnings per equivalent Class A common share attributable to Berkshire Hathaway shareholders |
8,024 | 5,786 | ||||||
We had no significant business acquisitions in 2009. During 2008, we acquired approximately 64% of the outstanding common stock of Marmon Holdings, Inc. (“Marmon”), a private company owned by trusts for the benefit of members of the Pritzker Family of Chicago, for approximately $4.8 billion in the aggregate. Marmon is an international association of approximately 130 manufacturing and service businesses that operate independently within diverse business sectors. Under the terms of the purchase agreement, we will acquire the remaining equity interests in Marmon between 2011 and 2014 for consideration to be based on the earnings of Marmon. We also acquired several other relatively small businesses during 2008. Consideration paid for all businesses acquired in 2008 was approximately $6.1 billion.
41
Table of Contents
Notes to Consolidated Financial Statements (Continued)
| (3) | Investments in fixed maturity securities |
Investments in securities with fixed maturities as of December 31, 2010 and 2009 are summarized below (in millions).
| Amortized Cost |
Unrealized Gains |
Unrealized Losses |
Fair Value |
|||||||||||||
| December 31, 2010 |
||||||||||||||||
| U.S. Treasury, U.S. government corporations and agencies |
$ | 2,151 | $ | 48 | $ | (2 | ) | $ | 2,197 | |||||||
| States, municipalities and political subdivisions |
3,356 | 225 | — | 3,581 | ||||||||||||
| Foreign governments |
11,721 | 242 | (51 | ) | 11,912 | |||||||||||
| Corporate bonds |
11,773 | 2,304 | (23 | ) | 14,054 | |||||||||||
| Mortgage-backed securities |
2,838 | 312 | (11 | ) | 3,139 | |||||||||||
| $ | 31,839 | $ | 3,131 | $ | (87 | ) | $ | 34,883 | ||||||||
| Insurance and other |
$ | 30,862 | $ | 3,028 | $ | (87 | ) | $ | 33,803 | |||||||
| Finance and financial products |
977 | 103 | — | 1,080 | ||||||||||||
| $ | 31,839 | $ | 3,131 | $ | (87 | ) | $ | 34,883 | ||||||||
| December 31, 2009 |
||||||||||||||||
| U.S. Treasury, U.S. government corporations and agencies |
$ | 2,362 | $ | 46 | $ | (1 | ) | $ | 2,407 | |||||||
| States, municipalities and political subdivisions |
3,689 | 275 | (1 | ) | 3,963 | |||||||||||
| Foreign governments |
11,518 | 368 | (42 | ) | 11,844 | |||||||||||
| Corporate bonds |
13,094 | 2,080 | (502 | ) | 14,672 | |||||||||||
| Mortgage-backed securities |
3,961 | 310 | (26 | ) | 4,245 | |||||||||||
| $ | 34,624 | $ | 3,079 | $ | (572 | ) | $ | 37,131 | ||||||||
| Insurance and other |
$ | 33,317 | $ | 2,984 | $ | (572 | ) | $ | 35,729 | |||||||
| Finance and financial products |
1,307 | 95 | — | 1,402 | ||||||||||||
| $ | 34,624 | $ | 3,079 | $ | (572 | ) | $ | 37,131 | ||||||||
Unrealized losses include $24 million at December 31, 2010 and $471 million at December 31, 2009, related to securities that have been in an unrealized loss position for 12 months or more. During the fourth quarter of 2010, we recorded other-than-temporary impairment charges of $1,020 million with respect to certain fixed maturity securities where we concluded that we were unlikely to receive all remaining contractual principal and interest amounts when due. These securities had been in an unrealized loss position for more than two years.
The amortized cost and estimated fair value of securities with fixed maturities at December 31, 2010 are summarized below by contractual maturity dates. Actual maturities will differ from contractual maturities because issuers of certain of the securities retain early call or prepayment rights. Amounts are in millions.
| Due in one year or less |
Due after one year through five years |
Due after five years through ten years |
Due after ten years |
Mortgage-backed securities |
Total | |||||||||||||||||||
| Amortized cost |
$ | 7,095 | $ | 14,734 | $ | 4,448 | $ | 2,724 | $ | 2,838 | $ | 31,839 | ||||||||||||
| Fair value |
7,231 | 16,146 | 5,091 | 3,276 | 3,139 | 34,883 | ||||||||||||||||||
42
Table of Contents
Notes to Consolidated Financial Statements (Continued)
| (4) | Investments in equity securities |
Investments in equity securities as of December 31, 2010 and 2009 are summarized below (in millions).
| Cost Basis | Unrealized Gains |
Unrealized Losses |
Fair Value |
|||||||||||||
| December 31, 2010 |
||||||||||||||||
| American Express Company |
$ | 1,287 | $ | 5,220 | $ | — | $ | 6,507 | ||||||||
| The Coca-Cola Company |
1,299 | 11,855 | — | 13,154 | ||||||||||||
| The Procter & Gamble Company |
4,321 | 336 | — | 4,657 | ||||||||||||
| Wells Fargo & Company |
8,015 | 3,521 | (413 | ) | 11,123 | |||||||||||
| Other |
20,622 | 5,709 | (259 | ) | 26,072 | |||||||||||
| $ | 35,544 | $ | 26,641 | $ | (672 | ) | $ | 61,513 | ||||||||
| Insurance and other |
$ | 34,875 | $ | 25,616 | $ | (672 | ) | $ | 59,819 | |||||||
| Railroad, utilities and energy * |
232 | 950 | — | 1,182 | ||||||||||||
| Finance and financial products * |
437 | 75 | — | 512 | ||||||||||||
| $ | 35,544 | $ | 26,641 | $ | (672 | ) | $ | 61,513 | ||||||||
| December 31, 2009 |
||||||||||||||||
| American Express Company |
$ | 1,287 | $ | 4,856 | $ | — | $ | 6,143 | ||||||||
| The Coca-Cola Company |
1,299 | 10,101 | — | 11,400 | ||||||||||||
| The Procter & Gamble Company |
4,962 | 78 | — | 5,040 | ||||||||||||
| Wells Fargo & Company |
7,394 | 2,721 | (1,094 | ) | 9,021 | |||||||||||
| Other |
22,265 | 7,118 | (1,953 | ) | 27,430 | |||||||||||
| $ | 37,207 | $ | 24,874 | $ | (3,047 | ) | $ | 59,034 | ||||||||
| Insurance and other |
$ | 36,538 | $ | 23,070 | $ | (3,046 | ) | $ | 56,562 | |||||||
| Railroad, utilities and energy * |
232 | 1,754 | — | 1,986 | ||||||||||||
| Finance and financial products * |
437 | 50 | (1 | ) | 486 | |||||||||||
| $ | 37,207 | $ | 24,874 | $ | (3,047 | ) | $ | 59,034 | ||||||||
| * | Included in Other assets. |
Unrealized losses of equity investments at December 31, 2010 that were in a continuous loss position for more than twelve months and for which other-than-temporary impairment charges were not recorded were $531 million, including $384 million related to Wells Fargo & Company. As of December 31, 2009, unrealized losses over one year in duration were approximately $2.7 billion, including $832 million related to Wells Fargo & Company. As of December 31, 2010, such losses generally ranged between 3% and 15% of the original cost of the related individual securities. We believe that the impairment of each of the individual securities that have been in an unrealized loss position over twelve months as of December 31, 2010 is temporary. Our belief is based on (a) our ability and current intent to hold the securities to recovery; (b) our assessment that the underlying business and financial condition of the issuers improved over the past year and that such conditions are currently favorable; (c) our opinion that the relative price declines are not significant; (d) the fact that the market prices of these issuers have increased over the past year; and (e) our belief that it is reasonably possible that market prices will increase to and exceed our cost in a relatively short period of time. Changes in market conditions and other facts and circumstances may change the business prospects of these issuers as well as our ability and current intent to hold these securities until the prices recover.
During the fourth quarter of 2010, we recorded other-than-temporary impairment losses of $938 million related to certain other equity securities. These securities had been in unrealized loss positions for over two years. The amount of the impairments averaged about 20% of the original cost of each security. Other-than-temporary impairment losses result in a reduction of the cost basis of the investment but not the fair value. Accordingly, such losses that are included in earnings are offset by a corresponding credit to other comprehensive income.
43
Table of Contents
Notes to Consolidated Financial Statements (Continued)
| (5) | Other investments |
Other investments include fixed maturity and equity securities of The Goldman Sachs Group, Inc. (“GS”), General Electric Company (“GE”), Wm. Wrigley Jr. Company (“Wrigley”), Swiss Reinsurance Company Ltd. (“Swiss Re”) and The Dow Chemical Company (“Dow”). As of December 31, 2009, we also owned 22.5% of BNSF’s outstanding common stock, which we accounted for pursuant to the equity method and included in other investments of insurance and other businesses in our Consolidated Balance Sheet. Upon acquiring all remaining outstanding shares of BNSF on February 12, 2010, we discontinued using the equity method and began consolidating the accounts of BNSF. See Note 2. A summary of other investments follows (in millions).
| Cost | Unrealized Gains |
Fair Value |
Carrying Value |
|||||||||||||
| December 31, 2010 |
||||||||||||||||
| Other fixed maturity and equity securities: |
||||||||||||||||
| Insurance and other |
$ | 15,700 | $ | 4,758 | $ | 20,458 | $ | 19,333 | ||||||||
| Finance and financial products |
2,742 | 947 | 3,689 | 3,676 | ||||||||||||
| $ | 18,442 | $ | 5,705 | $ | 24,147 | $ | 23,009 | |||||||||
| December 31, 2009 |
||||||||||||||||
| Other fixed maturity and equity securities: |
||||||||||||||||
| Insurance and other |
$ | 18,347 | $ | 5,451 | $ | 23,798 | $ | 22,854 | ||||||||
| Finance and financial products |
2,742 | 428 | 3,170 | 3,160 | ||||||||||||
| Equity method-BNSF |
5,851 | 1,721 | 7,572 | 6,586 | ||||||||||||
| $ | 26,940 | $ | 7,600 | $ | 34,540 | $ | 32,600 | |||||||||
We own 50,000 shares of 10% Cumulative Perpetual Preferred Stock of GS (“GS Preferred”) and warrants to purchase 43,478,260 shares of common stock of GS (“GS Warrants”) which we acquired in 2008 for a combined cost of $5 billion. The GS Preferred may be redeemed at any time by GS at a price of $110,000 per share ($5.5 billion in aggregate). The GS Warrants expire in 2013 and can be exercised for an additional aggregate cost of $5 billion ($115/share). In 2008, we also acquired 30,000 shares of 10% Cumulative Perpetual Preferred Stock of GE (“GE Preferred”) and warrants to purchase 134,831,460 shares of common stock of GE (“GE Warrants”) for a combined cost of $3 billion. The GE Preferred may be redeemed by GE beginning in October 2011 at a price of $110,000 per share ($3.3 billion in aggregate). The GE Warrants expire in 2013 and can be exercised for an additional aggregate cost of $3 billion ($22.25/share).
We own $4.4 billion par amount of 11.45% Wrigley subordinated notes due in 2018 and $2.1 billion of 5% Wrigley preferred stock, which we acquired in 2008. In December 2009, we also acquired $1.0 billion par amount of Wrigley senior notes due in 2013 and 2014. The Wrigley subordinated and senior notes are classified as held-to-maturity and we carry these investments at cost, adjusted for foreign currency exchange rate changes that apply to certain of the senior notes. We carry the Wrigley preferred stock at fair value classified as available-for-sale.
We own 3,000,000 shares of Series A Cumulative Convertible Perpetual Preferred Stock of Dow (“Dow Preferred”), which we acquired in 2009 for a cost of $3 billion. Under certain conditions, each share of the Dow Preferred is convertible into 24.201 shares of Dow common stock. Beginning in April 2014, if Dow’s common stock price exceeds $53.72 per share for any 20 trading days in a consecutive 30-day window, Dow, at its option, at any time, in whole or in part, may convert the Dow Preferred into Dow common stock at the then applicable conversion rate. The Dow Preferred is entitled to dividends at a rate of 8.5% per annum.
In 2009, we also acquired a 12% convertible perpetual capital instrument issued by Swiss Re at a cost of $2.7 billion. The instrument had a face amount of 3 billion Swiss Francs (“CHF”). The terms of the instrument allowed Swiss Re to redeem at its option the instrument under certain conditions. On November 3, 2010, we entered into an agreement with Swiss Re regarding the redemption of the instrument in exchange for aggregate consideration of approximately CHF 3.9 billion of which CHF 180 million was received on November 25, 2010 with the remainder to be paid to us in 2011. As of December 31, 2010, the amount due (and subsequently received on January 10, 2011) was classified in our Consolidated Balance Sheet as a component of receivables of insurance and other businesses.
44
Table of Contents
Notes to Consolidated Financial Statements (Continued)
| (6) | Investment gains/losses |
Investment gains/losses are summarized below (in millions).
| 2010 | 2009 | 2008 | ||||||||||
| Fixed maturity securities |
||||||||||||
| Gross gains from sales and other disposals |
$ | 720 | $ | 357 | $ | 212 | ||||||
| Gross losses from sales and other disposals |
(16 | ) | (54 | ) | (20 | ) | ||||||
| Equity and other securities |
||||||||||||
| Gross gains from sales and other disposals |
2,603 | 701 | 1,256 | |||||||||
| Gross losses from sales |
(266 | ) | (617 | ) | (530 | ) | ||||||
| Other |
1,017 | * | (69 | ) | 255 | |||||||
| $ | 4,058 | $ | 318 | $ | 1,173 | |||||||
| * | Includes a one-time holding gain of $979 million related to the BNSF acquisition. See note 2. |
Net investment gains/losses are reflected in the Consolidated Statements of Earnings as follows.
| Insurance and other |
$ | 4,044 | $ | 358 | $ | 1,166 | ||||||
| Finance and financial products |
14 | (40 | ) | 7 | ||||||||
| $ | 4,058 | $ | 318 | $ | 1,173 | |||||||
| (7) | Receivables |
Receivables of insurance and other businesses are comprised of the following (in millions).
| 2010 | 2009 | |||||||
| Insurance premiums receivable |
$ | 6,342 | $ | 5,295 | ||||
| Reinsurance recoverable on unpaid losses |
2,735 | 2,922 | ||||||
| Trade and other receivables |
12,223 | 6,977 | ||||||
| Allowances for uncollectible accounts |
(383 | ) | (402 | ) | ||||
| $ | 20,917 | $ | 14,792 | |||||
As of December 31, 2010, trade and other receivables included approximately $3.9 billion (CHF 3.7 billion) related to the redemption of the Swiss Re convertible capital instrument. See Note 5.
Loans and finance receivables of finance and financial products businesses are comprised of the following (in millions).
| 2010 | 2009 | |||||||
| Consumer installment loans and finance receivables |
$ | 14,042 | $ | 12,779 | ||||
| Commercial loans and finance receivables |
1,557 | 1,558 | ||||||
| Allowances for uncollectible loans |
(373 | ) | (348 | ) | ||||
| $ | 15,226 | $ | 13,989 | |||||
Consumer installment loans receivable increased by approximately $1.5 billion as of January 1, 2010 due to the adoption of ASU 2009-17. As of December 31, 2010, the outstanding balance of such loans was approximately $1.3 billion.
Allowances for uncollectible loans primarily relate to consumer installment loans. Provisions for consumer loan losses were $343 million in 2010 and $380 million in 2009. Loan charge-offs were $349 million in 2010 and $335 million in 2009. Consumer loan amounts are net of acquisition discounts of $580 million at December 31, 2010 and $594 million at December 31, 2009. At December 31, 2010, approximately 96% of consumer installment loan balances were evaluated collectively for impairment whereas about 91% of commercial loan balances were evaluated individually for impairment.
45
Table of Contents
Notes to Consolidated Financial Statements (Continued)
| (7) | Receivables (Continued) |
As a part of the evaluation process, credit quality indicators are reviewed and loans are designated as performing or non-performing. At December 31, 2010, approximately 98% of consumer installment and commercial loan balances were determined to be performing and approximately 93% of those balances were current as to payment status.
| (8) | Inventories |
Inventories are comprised of the following (in millions).
| 2010 | 2009 | |||||||
| Raw materials |
$ | 1,066 | $ | 908 | ||||
| Work in process and other |
509 | 438 | ||||||
| Finished manufactured goods |
2,180 | 1,975 | ||||||
| Goods acquired for resale |
3,346 | 2,826 | ||||||
| $ | 7,101 | $ | 6,147 | |||||
| (9) | Goodwill and other intangible assets |
A reconciliation of the change in the carrying value of goodwill is as follows (in millions).
| 2010 | 2009 | |||||||
| Balance at beginning of year |
$ | 33,972 | $ | 33,781 | ||||
| Acquisition of BNSF |
14,803 | — | ||||||
| Other |
231 | 191 | ||||||
| Balance at end of year |
$ | 49,006 | $ | 33,972 | ||||
Intangible assets other than goodwill are included in other assets and are summarized as follows (in millions).
| 2010 | 2009 | |||||||||||||||
| Gross carrying amount |
Accumulated amortization |
Gross carrying amount |
Accumulated amortization |
|||||||||||||
| Insurance and other |
$ | 6,944 | $ | 1,816 | $ | 6,334 | $ | 1,632 | ||||||||
| Railroad, utilities and energy |
2,082 | 306 | 76 | 24 | ||||||||||||
| $ | 9,026 | $ | 2,122 | $ | 6,410 | $ | 1,656 | |||||||||
| Trademarks and tradenames |
$ | 2,027 | $ | 166 | $ | 2,013 | $ | 114 | ||||||||
| Patents and technology |
2,922 | 1,013 | 1,656 | 808 | ||||||||||||
| Customer relationships |
2,676 | 612 | 2,080 | 426 | ||||||||||||
| Other |
1,401 | 331 | 661 | 308 | ||||||||||||
| $ | 9,026 | $ | 2,122 | $ | 6,410 | $ | 1,656 | |||||||||
Intangible assets with definite lives are amortized based on the estimated pattern in which the economic benefits are expected to be consumed or on a straight-line basis over their estimated economic lives. Amortization expense was $692 million in 2010, $414 million in 2009 and $362 million in 2008. Estimated amortization expense over the next five years is as follows (in millions): 2011 – $720; 2012 – $700; 2013 – $681; 2014 – $632; and 2015 – $345. Intangible assets with indefinite lives as of December 31, 2010 and 2009 were $1,635 million and $1,127 million, respectively. Intangible assets are reviewed for impairment when events or changes in circumstances indicate that the carrying amount may not be recoverable.
46
Table of Contents
Notes to Consolidated Financial Statements (Continued)
| (10) | Property, plant and equipment |
Property, plant and equipment of our insurance and other businesses is comprised of the following (in millions).
| Ranges of estimated useful life |
2010 | 2009 | ||||||||||
| Land |
— | $ | 744 | $ | 740 | |||||||
| Buildings and improvements |
3 – 40 years | 4,661 | 4,606 | |||||||||
| Machinery and equipment |
3 – 25 years | 11,573 | 10,845 | |||||||||
| Furniture, fixtures and other |
3 – 20 years | 1,932 | 1,595 | |||||||||
| Assets held for lease |
12 –30 years | 5,832 | 5,706 | |||||||||
| 24,742 | 23,492 | |||||||||||
| Accumulated depreciation |
(9,001 | ) | (7,772 | ) | ||||||||
| $ | 15,741 | $ | 15,720 | |||||||||
Assets held for lease consist primarily of railroad tank cars, intermodal tank containers and other equipment in the transportation and equipment services businesses of Marmon. As of December 31, 2010, the minimum future lease rentals to be received on the equipment lease fleet (including rail cars leased from others) were as follows (in millions): 2011 – $608; 2012 – $457; 2013 – $310; 2014 – $198; 2015 – $125; and thereafter – $243.
Property, plant and equipment of our railroad, utilities and energy businesses is comprised of the following (in millions).
| Ranges of estimated useful life |
2010 | 2009 | ||||||||||
| Railroad: |
||||||||||||
| Land |
— | $ | 5,901 | $ | — | |||||||
| Track structure and other roadway |
5 – 100 years | 35,463 | — | |||||||||
| Locomotives, freight cars and other equipment |
1 – 37 years | 4,329 | — | |||||||||
| Construction in progress |
— | 453 | — | |||||||||
| Utilities and energy: |
||||||||||||
| Utility generation, distribution and transmission system |
5 – 85 years | 37,643 | 35,616 | |||||||||
| Interstate pipeline assets |
3 – 67 years | 5,906 | 5,809 | |||||||||
| Independent power plants and other assets |
3 – 30 years | 1,097 | 1,157 | |||||||||
| Construction in progress |
— | 1,456 | 2,152 | |||||||||
| 92,248 | 44,734 | |||||||||||
| Accumulated depreciation |
(14,863 | ) | (13,798 | ) | ||||||||
| $ | 77,385 | $ | 30,936 | |||||||||
Railroad property, plant and equipment include the land, other roadway, track structure and rolling stock (primarily locomotives and freight cars) of BNSF, which we acquired on February 12, 2010. See Note 2. The cost of these assets includes the fair value adjustments made as of the acquisition date. The utility generation, distribution and transmission system and interstate pipeline assets are the regulated assets of public utility and natural gas pipeline subsidiaries.
47
Table of Contents
Notes to Consolidated Financial Statements (Continued)
| (11) | Derivative contracts |
Derivative contracts are used primarily by our finance and financial products businesses and our railroad, utilities and energy businesses. As of December 31, 2010 and 2009, substantially all of the derivative contracts of our finance and financial products businesses are not designated as hedges for financial reporting purposes. These contracts were initially entered into with the expectation that the premiums received would exceed the amounts ultimately paid to counterparties. Changes in the fair values of such contracts are reported in earnings as derivative gains/losses. A summary of derivative contracts of our finance and financial products businesses follows (in millions).
| 2010 | 2009 | |||||||||||||||||||||||
| Assets (3) | Liabilities | Notional Value |
Assets (3) | Liabilities | Notional Value |
|||||||||||||||||||
| Equity index put options |
$ | — | $ | 6,712 | $ | 33,891 | (1) | $ | — | $ | 7,309 | $ | 37,990 | (1) | ||||||||||
| Credit default obligations: |
||||||||||||||||||||||||
| High yield indexes |
— | 159 | 4,893 | (2) | — | 781 | 5,533 | (2) | ||||||||||||||||
| States/municipalities |
— | 1,164 | 16,042 | (2) | — | 853 | 16,042 | (2) | ||||||||||||||||
| Individual corporate |
84 | — | 3,565 | (2) | 81 | — | 3,565 | (2) | ||||||||||||||||
| Other |
341 | 375 | 378 | 360 | ||||||||||||||||||||
| Counterparty netting |
(82 | ) | (39 | ) | (193 | ) | (34 | ) | ||||||||||||||||
| $ | 343 | $ | 8,371 | $ | 266 | $ | 9,269 | |||||||||||||||||
| (1) | Represents the aggregate undiscounted amount payable at the contract expiration dates assuming that the value of each index is zero at the contract expiration date. |
| (2) | Represents the maximum undiscounted future value of losses payable under the contracts. The number of losses required to exhaust contract limits under substantially all of the contracts is dependent on the loss recovery rate related to the specific obligor at the time of a default. |
| (3) | Included in Other assets of finance and financial products businesses. |
A summary of derivative gains/losses of our finance and financial products businesses included in the Consolidated Statements of Earnings are as follows (in millions).
| 2010 | 2009 | 2008 | ||||||||||
| Equity index put options |
$ | 172 | $ | 2,713 | $ | (5,028 | ) | |||||
| Credit default obligations |
250 | 789 | (1,774 | ) | ||||||||
| Other |
(161 | ) | 122 | (19 | ) | |||||||
| $ | 261 | $ | 3,624 | $ | (6,821 | ) | ||||||
The equity index put option contracts are European style options written on four major equity indexes. Future payments, if any, under these contracts will be required if the underlying index value is below the strike price at the contract expiration dates which occur between June 2018 and January 2026. We received the premiums on these contracts in full at the contract inception dates and therefore we have no counterparty credit risk. During the fourth quarter of 2010, certain of these contracts were unwound at the instigation of our counterparty to these contracts. We had originally received premiums of $647 million for these contracts and we paid $425 million to unwind the contracts. The notional value of these contracts was approximately $4.3 billion.
At December 31, 2010, the aggregate intrinsic value (the undiscounted liability assuming the contracts are settled on their future expiration dates based on the December 31, 2010 index values and foreign currency exchange rates) was approximately $3.8 billion. However, these contracts may not be unilaterally terminated or fully settled before the expiration dates and therefore the ultimate amount of cash basis gains or losses on these contracts may not be determined for many years. The remaining weighted average life of all contracts was approximately 10 years at December 31, 2010.
Our credit default contracts pertain to various indexes of non-investment grade (or “high yield”) corporate issuers, state/municipal debt issuers and other individual corporate issuers. These contracts cover the loss in value of specified debt obligations of the issuers arising from default events, which are usually from their failure to make payments or bankruptcy. Loss amounts are subject to aggregate contract limits.
48
Table of Contents
Notes to Consolidated Financial Statements (Continued)
| (11) | Derivative contracts (Continued) |
The high yield index contracts are comprised of specified North American corporate issuers (usually 100 in number at inception) whose obligations are rated below investment grade. High yield contracts remaining in-force at December 31, 2010 expire from 2011 through 2013. State and municipality contracts are comprised of over 500 state and municipality issuers and had a weighted average contract life at December 31, 2010 of approximately 10.1 years. Potential obligations related to approximately 50% of the notional value of the state and municipality contracts cannot be settled before the maturity dates of the underlying obligations, which range from 2019 to 2054.
Premiums on the high yield index and state/municipality contracts are received in full at the inception dates of the contracts and, as a result, we have no counterparty credit risk. Our payment obligations under certain of these contracts are on a first loss basis. Losses under other contracts are subject to aggregate deductibles that must be satisfied before we have any payment obligations.
Individual corporate credit default contracts primarily relate to issuers of investment grade obligations. In most instances, premiums are due from counterparties on a quarterly basis over the terms of the contracts. As of December 31, 2010, all of the contracts in-force expire in 2013.
With limited exceptions, our equity index put option and credit default contracts contain no collateral posting requirements with respect to changes in either the fair value or intrinsic value of the contracts and/or a downgrade of Berkshire’s credit ratings. As of December 31, 2010, our collateral posting requirement under contracts with collateral provisions was $31 million compared to $35 million at December 31, 2009. As of December 31, 2010, had Berkshire’s credit ratings (currently AA+ from Standard & Poor’s and Aa2 from Moody’s) been downgraded below either A- by Standard & Poor’s or A3 by Moody’s an additional $1.1 billion would have been required to be posted as collateral.
Our railroad and regulated utility subsidiaries are exposed to variations in the market prices in the purchases and sales of natural gas and electricity and in commodity fuel costs. Derivative instruments, including forward purchases and sales, futures, swaps and options, are used to manage these price risks. Unrealized gains and losses under the contracts of our regulated utilities that are probable of recovery through rates are recorded as a regulatory net asset or liability. Unrealized gains or losses on contracts accounted for as cash flow or fair value hedges are recorded in accumulated other comprehensive income or in net earnings, as appropriate. Derivative contract assets included in other assets of railroad, utilities and energy businesses were $231 million and $188 million as of December 31, 2010 and 2009, respectively. Derivative contract liabilities included in accounts payable, accruals and other liabilities of railroad, utilities and energy businesses were $621 million as of December 31, 2010 and $581 million as of December 31, 2009.
| (12) | Supplemental cash flow information |
A summary of supplemental cash flow information for each of the three years ending December 31, 2010 is presented in the following table (in millions).
| 2010 | 2009 | 2008 | ||||||||||
| Cash paid during the year for: |
||||||||||||
| Income taxes |
$ | 3,547 | $ | 2,032 | $ | 3,530 | ||||||
| Interest of insurance and other businesses |
185 | 145 | 197 | |||||||||
| Interest of railroad, utilities and energy businesses |
1,667 | 1,142 | 1,172 | |||||||||
| Interest of finance and financial products businesses |
708 | 615 | 522 | |||||||||
| Non-cash investing and financing activities: |
||||||||||||
| Liabilities assumed in connection with acquisition of BNSF |
30,968 | — | — | |||||||||
| Common stock issued in connection with acquisition of BNSF |
10,577 | — | — | |||||||||
| Liabilities assumed in connection with acquisitions of other businesses |
438 | 278 | 4,763 | |||||||||
| Equity/fixed maturity securities exchanged for other securities/investments |
— | — | 2,329 | |||||||||
| (13) | Unpaid losses and loss adjustment expenses |
The liabilities for unpaid losses and loss adjustment expenses are based upon estimates of the ultimate claim costs associated with property and casualty claim occurrences as of the balance sheet dates including estimates for incurred but not reported (“IBNR”) claims. Considerable judgment is required to evaluate claims and establish estimated claim liabilities.
49
Table of Contents
Notes to Consolidated Financial Statements (Continued)
| (13) | Unpaid losses and loss adjustment expenses (Continued) |
A reconciliation of the changes in liabilities for unpaid losses and loss adjustment expenses of our property/casualty insurance subsidiaries is as follows (in millions).
| 2010 | 2009 | 2008 | ||||||||||
| Unpaid losses and loss adjustment expenses: |
||||||||||||
| Gross liabilities at beginning of year |
$ | 59,416 | $ | 56,620 | $ | 56,002 | ||||||
| Ceded losses and deferred charges at beginning of year |
(6,879 | ) | (7,133 | ) | (7,126 | ) | ||||||
| Net balance at beginning of year |
52,537 | 49,487 | 48,876 | |||||||||
| Incurred losses recorded during the year: |
||||||||||||
| Current accident year |
20,357 | 19,156 | 17,399 | |||||||||
| Prior accident years |
(2,270 | ) | (905 | ) | (1,140 | ) | ||||||
| Total incurred losses |
18,087 | 18,251 | 16,259 | |||||||||
| Payments during the year with respect to: |
||||||||||||
| Current accident year |
(7,666 | ) | (7,207 | ) | (6,905 | ) | ||||||
| Prior accident years |
(9,191 | ) | (8,315 | ) | (8,486 | ) | ||||||
| Total payments |
(16,857 | ) | (15,522 | ) | (15,391 | ) | ||||||
| Unpaid losses and loss adjustment expenses: |
||||||||||||
| Net balance at end of year |
53,767 | 52,216 | 49,744 | |||||||||
| Ceded losses and deferred charges at end of year |
6,545 | 6,879 | 7,133 | |||||||||
| Foreign currency translation adjustment |
(312 | ) | 232 | (616 | ) | |||||||
| Acquisitions |
75 | 89 | 359 | |||||||||
| Gross liabilities at end of year |
$ | 60,075 | $ | 59,416 | $ | 56,620 | ||||||
Incurred losses recorded during the current year but attributable to a prior accident year (“prior accident years”) reflects the amount of estimation error charged or credited to earnings in each calendar year with respect to the liabilities established as of the beginning of that year. We reduced the beginning of the year net losses and loss adjustment expenses liability by $2,626 million in 2010, $1,507 million in 2009 and $1,690 million in 2008, which excludes the effects of prior years’ discount accretion and deferred charge amortization referred to below. In each year, the reductions in loss estimates for occurrences in prior years were primarily due to lower than expected severities and frequencies on private passenger and commercial auto claims, lower than expected reported reinsurance losses in both property and casualty lines and lower than expected medical malpractice losses. Accident year loss estimates are regularly adjusted to consider emerging loss development patterns of prior years’ losses, whether favorable or unfavorable.
Incurred losses for prior accident years also include amortization of deferred charges related to retroactive reinsurance contracts incepting prior to the beginning of the year and the accretion of the net discounts recorded on certain workers’ compensation loss reserves. Amortization charges included in prior accident years’ losses were $261 million in 2010, $504 million in 2009 and $451 million in 2008. Net discounted workers’ compensation liabilities at December 31, 2010 and 2009 were $2,315 million and $2,356 million, respectively, reflecting net discounts of $2,269 million and $2,473 million, respectively. The accretion of discounted liabilities related to prior accident years’ incurred losses was approximately $95 million in 2010, $98 million in 2009 and $99 million in 2008.
We are exposed to environmental, asbestos and other latent injury claims arising from insurance and reinsurance contracts. Loss reserve estimates for environmental and asbestos exposures include case basis reserves and also reflect reserves for legal and other loss adjustment expenses and IBNR reserves. IBNR reserves are determined based upon our historic general liability exposure base and policy language, previous environmental loss experience and the assessment of current trends of environmental law, environmental cleanup costs, asbestos liability law and judgmental settlements of asbestos liabilities.
The liabilities for environmental, asbestos and latent injury claims and claims expenses net of reinsurance recoverables were approximately $12.4 billion at December 31, 2010 and $10.6 billion at December 31, 2009. These liabilities included approximately $10.7 billion at December 31, 2010 and $9.1 billion at December 31, 2009 of liabilities assumed under
50
Table of Contents
Notes to Consolidated Financial Statements (Continued)
| (13) | Unpaid losses and loss adjustment expenses (Continued) |
retroactive reinsurance contracts. Liabilities arising from retroactive contracts with exposure to claims of this nature are generally subject to aggregate policy limits. Thus, our exposure to environmental and latent injury claims under these contracts is, likewise, limited. We monitor evolving case law and its effect on environmental and latent injury claims. Changing government regulations, newly identified toxins, newly reported claims, new theories of liability, new contract interpretations and other factors could result in significant increases in these liabilities. Such development could be material to our results of operations. It is not possible to reliably estimate the amount of additional net loss or the range of net loss that is reasonably possible.
| (14) | Notes payable and other borrowings |
Notes payable and other borrowings are summarized below (in millions). The average interest rates shown in the following tables are the weighted average interest rates on outstanding debt as of December 31, 2010.
| Average Interest Rate |
2010 | 2009 | ||||||||||
| Insurance and other: |
||||||||||||
| Issued by Berkshire parent company due 2011-2047 |
1.5 | % | $ | 8,360 | $ | 340 | ||||||
| Short-term subsidiary borrowings |
0.3 | % | 1,682 | 1,607 | ||||||||
| Other subsidiary borrowings due 2011-2036 |
5.2 | % | 2,429 | 2,614 | ||||||||
| $ | 12,471 | $ | 4,561 | |||||||||
In connection with the BNSF acquisition, Berkshire issued $8.0 billion aggregate par amount of senior unsecured notes consisting of $2.0 billion par amount of floating rate notes due in 2011; $1.1 billion par amount of floating rate notes due in 2012; $600 million par amount of 1.4% notes due in 2012; $1.2 billion par amount of floating rate notes due in 2013; $1.4 billion par amount of 2.125% notes due in 2013; and $1.7 billion par amount of 3.2% notes due in 2015. The floating rate notes due in 2011 were repaid on February 10, 2011.
| Average Interest Rate |
2010 | 2009 | ||||||||||
| Railroad, utilities and energy: |
||||||||||||
| Issued by MidAmerican Energy Holdings Company (“MidAmerican”) and its subsidiaries: |
||||||||||||
| MidAmerican senior unsecured debt due 2012-2037 |
6.1 | % | $ | 5,371 | $ | 5,371 | ||||||
| Subsidiary and other debt due 2011-2039 |
5.8 | % | 14,275 | 14,208 | ||||||||
| Issued by BNSF due 2011-2097 |
6.1 | % | 11,980 | — | ||||||||
| $ | 31,626 | $ | 19,579 | |||||||||
Berkshire does not guarantee any debt or other borrowings of BNSF, MidAmerican or their subsidiaries. Subsidiary debt represents amounts issued by subsidiaries of MidAmerican pursuant to separate financing agreements. All or substantially all of the assets of certain MidAmerican subsidiaries are or may be pledged or encumbered to support or otherwise secure the debt. These borrowing arrangements generally contain various covenants including, but not limited to, leverage ratios, interest coverage ratios and debt service coverage ratios. As of December 31, 2010, BNSF and MidAmerican and its subsidiaries were in compliance with all applicable covenants.
As of the February 12, 2010 acquisition date, BNSF’s outstanding debt was approximately $11.1 billion. During 2010, BNSF issued $750 million of 5.75% debentures due in 2040, $250 million of 3.60% debentures due in 2020 and $500 million of 5.05% debentures due in 2041. BNSF’s borrowings are primarily unsecured.
| Average Interest Rate |
2010 | 2009 | ||||||||||
| Finance and financial products: |
||||||||||||
| Issued by Berkshire Hathaway Finance Corporation (“BHFC”) |
4.2 | % | $ | 11,535 | $ | 12,051 | ||||||
| Issued by other subsidiaries due 2011-2036 |
5.1 | % | 2,942 | 1,718 | ||||||||
| $ | 14,477 | $ | 13,769 | |||||||||
51
Table of Contents
Notes to Consolidated Financial Statements (Continued)
| (14) | Notes payable and other borrowings (Continued) |
BHFC is a 100% owned finance subsidiary of Berkshire, which has fully and unconditionally guaranteed its securities. Debt issued by BHFC matures between 2011 and 2040. During 2010, BHFC issued $750 million par amount of 5.75% senior notes due in 2040, $250 million par amount of floating rate senior notes due in 2012 and $500 million par amount of 2.45% senior notes due in 2015. In 2010, $2.0 billion par amount of BHFC senior notes matured and were repaid. In January 2011, BHFC issued an additional $1.5 billion par amount of notes and repaid $1.5 billion of maturing notes. The new notes are unsecured and are comprised of $750 million par amount of 4.25% senior notes due in 2021, $375 million par amount of 1.5% senior notes due in 2014 and $375 million par amount of floating rate senior notes due in 2014.
Prior to our acquisition of Clayton Homes in 2003, certain of its subsidiaries regularly sold their originated and acquired installment loans to special purpose entities (“SPEs”). The transferred loans were then securitized and sold to third party investors. We continue to service these installment loans and retain residual interests in the securitized loans. As described in Note 1(t), ASU 2009-16 eliminated the concept of QSPEs and, in accordance with the requirements of ASU 2009-17, we reevaluated the SPEs and determined that the SPEs were variable interest entities that should be consolidated under the new guidance, primarily because we are the servicer of the loans and hold the residual interests. Consequently, as of January 1, 2010, we increased other borrowings of finance and financial products by approximately $1.5 billion with a corresponding increase in consumer installment loans receivable. The SPEs continue to be distinct, bankruptcy remote entities that hold the interests in the related installment loans. The cash flows received from the collection of the installment loans continue to be pledged to satisfy the principal and interest due on the related debt now recorded in our Consolidated Financial Statements.
Our subsidiaries have approximately $6.2 billion of available unused lines of credit and commercial paper capacity in the aggregate at December 31, 2010, to support our short-term borrowing programs and provide additional liquidity. Generally, Berkshire’s guarantee of a subsidiary’s debt obligation is an absolute, unconditional and irrevocable guarantee for the full and prompt payment when due of all present and future payment obligations.
Principal payments expected during the next five years are as follows (in millions).
| 2011 | 2012 | 2013 | 2014 | 2015 | ||||||||||||||||
| Insurance and other |
$ | 3,915 | $ | 1,880 | $ | 2,706 | $ | 118 | $ | 1,921 | ||||||||||
| Railroad, utilities and energy |
2,162 | 2,097 | 1,104 | 1,618 | 713 | |||||||||||||||
| Finance and financial products |
2,031 | 2,942 | 3,658 | 587 | 1,658 | |||||||||||||||
| $ | 8,108 | $ | 6,919 | $ | 7,468 | $ | 2,323 | $ | 4,292 | |||||||||||
| (15) | Income taxes |
The liability for income taxes as of December 31, 2010 and 2009 as reflected in our Consolidated Balance Sheets is as follows (in millions).
| 2010 | 2009 | |||||||
| Payable currently |
$ | (211 | ) | $ | (396 | ) | ||
| Deferred |
35,558 | 18,695 | ||||||
| Other |
1,005 | 926 | ||||||
| $ | 36,352 | $ | 19,225 | |||||
52
Table of Contents
Notes to Consolidated Financial Statements (Continued)
| (15) | Income taxes (Continued) |
The tax effects of temporary differences that give rise to significant portions of deferred tax assets and deferred tax liabilities at December 31, 2010 and 2009 are shown below (in millions).
| 2010 | 2009 | |||||||
| Deferred tax liabilities: |
||||||||
| Investments – unrealized appreciation and cost basis differences |
$ | 13,376 | $ | 11,880 | ||||
| Deferred charges reinsurance assumed |
1,334 | 1,385 | ||||||
| Property, plant and equipment |
24,746 | 8,135 | ||||||
| Other |
5,108 | 4,236 | ||||||
| 44,564 | 25,636 | |||||||
| Deferred tax assets: |
||||||||
| Unpaid losses and loss adjustment expenses |
(1,052 | ) | (1,010 | ) | ||||
| Unearned premiums |
(508 | ) | (500 | ) | ||||
| Accrued liabilities |
(3,652 | ) | (1,643 | ) | ||||
| Derivative contract liabilities |
(862 | ) | (875 | ) | ||||
| Other |
(2,932 | ) | (2,913 | ) | ||||
| (9,006 | ) | (6,941 | ) | |||||
| Net deferred tax liability |
$ | 35,558 | $ | 18,695 | ||||
We have not established deferred income taxes with respect to undistributed earnings of certain foreign subsidiaries. Earnings expected to remain reinvested indefinitely were approximately $4.1 billion as of December 31, 2010. Upon distribution as dividends or otherwise, such amounts would be subject to taxation in the U.S. as well as foreign countries. However, U.S. income tax liabilities could be offset, in whole or in part, by tax credits allowable from taxes paid to foreign jurisdictions. Determination of the potential net tax due is impracticable due to the complexities of hypothetical calculations involving uncertain timing and amounts of taxable income and the effects of multiple taxing jurisdictions.
The Consolidated Statements of Earnings reflect charges for income taxes as shown below (in millions).
| 2010 | 2009 | 2008 | ||||||||||
| Federal |
$ | 4,546 | $ | 2,833 | $ | 915 | ||||||
| State |
337 | 124 | 249 | |||||||||
| Foreign |
724 | 581 | 814 | |||||||||
| $ | 5,607 | $ | 3,538 | $ | 1,978 | |||||||
| Current |
$ | 3,668 | $ | 1,619 | $ | 3,811 | ||||||
| Deferred |
1,939 | 1,919 | (1,833 | ) | ||||||||
| $ | 5,607 | $ | 3,538 | $ | 1,978 | |||||||
Charges for income taxes are reconciled to hypothetical amounts computed at the U.S. federal statutory rate in the table shown below (in millions).
| 2010 | 2009 | 2008 | ||||||||||
| Earnings before income taxes |
$ | 19,051 | $ | 11,552 | $ | 7,574 | ||||||
| Hypothetical amounts applicable to above computed at the federal statutory rate |
$ | 6,668 | $ | 4,043 | $ | 2,651 | ||||||
| Tax-exempt interest income |
(27 | ) | (33 | ) | (88 | ) | ||||||
| Dividends received deduction |
(477 | ) | (479 | ) | (415 | ) | ||||||
| State income taxes, less federal income tax benefit |
219 | 81 | 162 | |||||||||
| Foreign tax rate differences |
(154 | ) | (92 | ) | (59 | ) | ||||||
| BNSF holding gain |
(342 | ) | — | — | ||||||||
| Non-taxable exchange of investment |
— | — | (154 | ) | ||||||||
| Other differences, net |
(280 | ) | 18 | (119 | ) | |||||||
| $ | 5,607 | $ | 3,538 | $ | 1,978 | |||||||
53
Table of Contents
Notes to Consolidated Financial Statements (Continued)
| (15) | Income taxes (Continued) |
We file income tax returns in the U.S. federal jurisdiction and in state, local and foreign jurisdictions. We are under examination by the taxing authorities in many of these jurisdictions. With few exceptions, we have settled tax return liabilities with U.S. federal, state, local and foreign tax authorities for years before 2002. We anticipate that we will resolve all adjustments proposed by the U.S. Internal Revenue Service (“IRS”) for the 2002 through 2004 tax years at the IRS Appeals Division within the next 12 months. The IRS has completed its examination of our consolidated U.S. federal income tax returns for the 2005 and 2006 tax years and the proposed adjustments are currently being reviewed by the IRS Appeals Division process. The IRS is currently auditing our consolidated U.S. federal income tax returns for the 2007 through 2009 tax years. It is reasonably possible that certain of our income tax examinations will be settled within the next twelve months. We currently believe that there are no jurisdictions in which the outcome of unresolved issues or claims is likely to be material to the Consolidated Financial Statements.
At December 31, 2010 and 2009, net unrecognized tax benefits were $1,005 million and $926 million, respectively. Included in the balance at December 31, 2010, are $774 million of tax positions that, if recognized, would impact the effective tax rate. The remaining balance in net unrecognized tax benefits principally relates to tax positions for which the ultimate deductibility is highly certain but for which there is uncertainty about the timing of such deductibility. Because of the impact of deferred tax accounting, other than interest and penalties, the disallowance of the shorter deductibility period would not affect the annual effective tax rate but would accelerate the payment of cash to the taxing authority to an earlier period. As of December 31, 2010, we do not expect any material changes to the estimated amount of unrecognized tax benefits in the next twelve months.
| (16) | Dividend restrictions – Insurance subsidiaries |
Payments of dividends by our insurance subsidiaries are restricted by insurance statutes and regulations. Without prior regulatory approval, our principal insurance subsidiaries may declare up to approximately $9 billion as ordinary dividends before the end of 2011.
Combined shareholders’ equity of U.S. based property/casualty insurance subsidiaries determined pursuant to statutory accounting rules (Statutory Surplus as Regards Policyholders) was approximately $94 billion at December 31, 2010 and $64 billion at December 31, 2009. A significant portion of the increase in statutory surplus in 2010 was due to capital contributions by Berkshire in connection with the BNSF acquisition. BNSF is a wholly-owned subsidiary of National Indemnity Company, a U.S. based Berkshire insurance subsidiary. Statutory surplus differs from the corresponding amount determined on the basis of GAAP. The major differences between statutory basis accounting and GAAP are that deferred charges reinsurance assumed, deferred policy acquisition costs, unrealized gains and losses on investments in fixed maturity securities and related deferred income taxes are recognized for GAAP but not for statutory reporting purposes. In addition, statutory accounting for goodwill of acquired businesses requires amortization of goodwill over 10 years, whereas under GAAP, goodwill is not amortized and is subject to periodic tests for impairment.
54
Table of Contents
Notes to Consolidated Financial Statements (Continued)
| (17) | Fair value measurements |
The estimated fair values of our financial instruments are shown in the following table (in millions). The carrying values of cash and cash equivalents, accounts receivable and accounts payable, accruals and other liabilities are deemed to be reasonable estimates of their fair values.
| Carrying Value | Fair Value | |||||||||||||||
| December 31, 2010 |
December 31, 2009 |
December 31, 2010 |
December 31, 2009 |
|||||||||||||
| Investments in fixed maturity securities |
$ | 34,883 | $ | 37,131 | $ | 34,883 | $ | 37,131 | ||||||||
| Investments in equity securities |
61,513 | 59,034 | 61,513 | 59,034 | ||||||||||||
| Other investments |
23,009 | 32,600 | 24,147 | 34,540 | ||||||||||||
| Loans and finance receivables |
15,226 | 13,989 | 14,453 | 12,415 | ||||||||||||
| Derivative contract assets (1) |
574 | 454 | 574 | 454 | ||||||||||||
| Notes payable and other borrowings: |
||||||||||||||||
| Insurance and other |
12,471 | 4,561 | 12,705 | 4,669 | ||||||||||||
| Railroad, utilities and energy |
31,626 | 19,579 | 33,932 | 20,868 | ||||||||||||
| Finance and financial products |
14,477 | 13,769 | 15,191 | 14,355 | ||||||||||||
| Derivative contract liabilities: |
||||||||||||||||
| Railroad, utilities and energy (2) |
621 | 581 | 621 | 581 | ||||||||||||
| Finance and financial products |
8,371 | 9,269 | 8,371 | 9,269 | ||||||||||||
| (1) | Included in Other assets |
| (2) | Included in Accounts payable, accruals and other liabilities |
Fair value is the price that would be received to sell an asset or paid to transfer a liability in an orderly transaction between market participants as of the measurement date. Fair value measurements assume the asset or liability is exchanged in an orderly manner; the exchange is in the principal market for that asset or liability (or in the most advantageous market when no principal market exists); and the market participants are independent, knowledgeable, able and willing to transact an exchange.
Fair values for substantially all of our financial instruments were measured using market or income approaches. Considerable judgment may be required in interpreting market data used to develop the estimates of fair value. Accordingly, the estimates presented herein are not necessarily indicative of the amounts that could be realized in an actual current market exchange. The use of different market assumptions and/or estimation methodologies may have a material effect on the estimated fair value.
The hierarchy for measuring fair value consists of Levels 1 through 3.
Level 1 – Inputs represent unadjusted quoted prices for identical assets or liabilities exchanged in active markets. Substantially all of our equity investments are traded on an exchange in active markets and fair values are based on the closing prices as of the balance sheet date.
Level 2 – Inputs include directly or indirectly observable inputs (other than Level 1 inputs) such as quoted prices for similar assets or liabilities exchanged in active or inactive markets; quoted prices for identical assets or liabilities exchanged in inactive markets; other inputs that may be considered in fair value determinations of the assets or liabilities, such as interest rates and yield curves, volatilities, prepayment speeds, loss severities, credit risks and default rates; and inputs that are derived principally from or corroborated by observable market data by correlation or other means. Fair values for our investments in fixed maturity securities are primarily based on price evaluations which incorporate market prices for identical instruments in inactive markets and market data available for instruments with similar characteristics. Pricing evaluations generally reflect discounted expected future cash flows, which incorporate yield curves for instruments with similar characteristics, such as credit rating, estimated duration, and yields for other instruments of the issuer or entities in the same industry sector.
Level 3 – Inputs include unobservable inputs used in the measurement of assets and liabilities. Management is required to use its own assumptions regarding unobservable inputs because there is little, if any, market activity in the assets or liabilities or related observable inputs that can be corroborated at the measurement date. Unobservable inputs require management to make certain projections and assumptions about the information that would be used by market participants in pricing assets or liabilities. Measurements of non-exchange traded derivative contracts and certain other investments carried at fair value are based primarily on valuation models, discounted cash flow models or other valuation techniques that are believed to be used by market participants. We value equity index put option contracts based on the Black-Scholes option valuation model which we believe is widely used by market participants. Inputs to this model include current index
55
Table of Contents
Notes to Consolidated Financial Statements (Continued)
| (17) | Fair value measurements (Continued) |
price, expected volatility, dividend and interest rates and contract duration. Credit default contracts are primarily valued based on indications of bid or offer data as of the balance sheet date. These contracts are not exchange traded and certain of the terms of our contracts are not standard in derivatives markets. For example, we are not required to post collateral under most of our contracts. For these reasons, we classified these contracts as Level 3.
Financial assets and liabilities measured and carried at fair value on a recurring basis in our financial statements are summarized according to the hierarchy previously described as follows (in millions).
| Total Fair Value |
Quoted Prices (Level 1) |
Significant Other Observable Inputs (Level 2) |
Significant Unobservable Inputs (Level 3) |
|||||||||||||
| December 31, 2010 |
||||||||||||||||
| Investments in fixed maturity securities: |
||||||||||||||||
| U.S. Treasury, U.S. government corporations and agencies |
$ | 2,197 | $ | 535 | $ | 1,658 | $ | 4 | ||||||||
| States, municipalities and political subdivisions |
3,581 | — | 3,581 | — | ||||||||||||
| Foreign governments |
11,912 | 5,633 | 6,167 | 112 | ||||||||||||
| Corporate bonds |
14,054 | 23 | 13,346 | 685 | ||||||||||||
| Mortgage-backed securities |
3,139 | — | 3,139 | — | ||||||||||||
| Investments in equity securities |
61,513 | 61,390 | 88 | 35 | ||||||||||||
| Other investments |
17,589 | — | — | 17,589 | ||||||||||||
| Net derivative contract (assets)/liabilities: |
||||||||||||||||
| Railroad, utilities and energy |
390 | 7 | 52 | 331 | ||||||||||||
| Finance and financial products: |
||||||||||||||||
| Equity index put options |
6,712 | — | — | 6,712 | ||||||||||||
| Credit default obligations |
1,239 | — | — | 1,239 | ||||||||||||
| Other |
77 | — | 137 | (60 | ) | |||||||||||
| December 31, 2009 |
||||||||||||||||
| Investments in fixed maturity securities |
$ | 37,131 | $ | 5,407 | $ | 30,806 | $ | 918 | ||||||||
| Investments in equity securities |
59,034 | 58,640 | 90 | 304 | ||||||||||||
| Other investments |
20,614 | — | — | 20,614 | ||||||||||||
| Net derivative contract (assets)/liabilities: |
||||||||||||||||
| Railroad, utilities and energy |
393 | (1 | ) | 35 | 359 | |||||||||||
| Finance and financial products |
9,003 | — | 166 | 8,837 | ||||||||||||
Reconciliations of assets and liabilities measured and carried at fair value on a recurring basis with the use of significant unobservable inputs (Level 3) for 2010 and 2009 follow (in millions).
| Investments in fixed maturity securities |
Investments in equity securities |
Other investments |
Net derivative contract liabilities |
|||||||||||||
| Balance at December 31, 2008 |
$ | 639 | $ | 328 | $ | 10,275 | $ | (14,519 | ) | |||||||
| Gains (losses) included in: |
||||||||||||||||
| Earnings |
1 | 4 | — | 3,635 | ||||||||||||
| Other comprehensive income |
49 | 25 | 4,702 | — | ||||||||||||
| Regulatory assets and liabilities |
— | — | — | 47 | ||||||||||||
| Purchases, sales, issuances and settlements |
244 | (8 | ) | 5,637 | 1,664 | |||||||||||
| Transfers into (out of) Level 3 |
(15 | ) | (45 | ) | — | (23 | ) | |||||||||
| Balance at December 31, 2009 |
918 | 304 | 20,614 | (9,196 | ) | |||||||||||
| Gains (losses) included in: |
||||||||||||||||
| Earnings |
— | — | 1,305 | 471 | ||||||||||||
| Other comprehensive income |
16 | (8 | ) | (358 | ) | — | ||||||||||
| Regulatory assets and liabilities |
— | — | — | (33 | ) | |||||||||||
| Purchases, sales, issuances and settlements |
9 | (1 | ) | (3,972 | ) | 533 | ||||||||||
| Transfers into (out of) Level 3 |
(142 | ) | (260 | ) | — | 3 | ||||||||||
| Balance at December 31, 2010 |
$ | 801 | $ | 35 | $ | 17,589 | $ | (8,222 | ) | |||||||
56
Table of Contents
Notes to Consolidated Financial Statements (Continued)
| (17) | Fair value measurement (Continued) |
Gains and losses included in net earnings are included as components of investment gains/losses, derivative gains/losses and other revenues, as appropriate and are related to changes in valuations of derivative contracts and disposal or settlement transactions. The gain included in earnings in 2010 related to other investments was attributable to the redemption of the Swiss Re 12% convertible perpetual capital instrument. Other investments with Level 3 measurements at December 31, 2010 and 2009 include our investments in GS, GE, Dow and Wrigley preferred stock and the GS and GE warrants and at December 31, 2009 also included our investment in the Swiss Re instrument.
| (18) | Common stock |
On January 20, 2010, our shareholders approved proposals to increase the authorized number of Class B common shares from 55,000,000 to 3,225,000,000 and to effect a 50-for-1 split of the Class B common stock which became effective on January 21, 2010. The Class A common stock was not split. Thereafter, each share of Class A common stock became convertible, at the option of the holder, into 1,500 shares of Class B common stock. Class B common stock is not convertible into Class A common stock. The Class B share data in the following table and the related disclosures regarding Class B shares are presented on a post-split basis for all periods.
Changes in issued and outstanding Berkshire common stock during the three years ended December 31, 2010 are shown in the table below.
| Class A, $5 Par Value | Class B, $0.0033 Par Value | |||||||
| (1,650,000 shares
authorized) Shares Issued and Outstanding |
(3,225,000,000 shares
authorized) Shares Issued and Outstanding |
|||||||
| Balance December 31, 2007 |
1,081,024 | 700,004,000 | ||||||
| Conversions of Class A common stock to Class B common stock and other |
(22,023 | ) | 35,345,800 | |||||
| Balance December 31, 2008 |
1,059,001 | 735,349,800 | ||||||
| Conversions of Class A common stock to Class B common stock and other |
(3,720 | ) | 9,351,500 | |||||
| Balance December 31, 2009 |
1,055,281 | 744,701,300 | ||||||
| Shares issued in the acquisition of BNSF (See Note 2) |
80,931 | 20,976,621 | ||||||
| Conversions of Class A common stock to Class B common stock and other |
(188,752 | ) | 285,312,547 | |||||
| Balance December 31, 2010 |
947,460 | 1,050,990,468 | ||||||
Class B common stock possesses dividend and distribution rights equal to one-fifteen-hundredth (1/1,500) of such rights of Class A common stock. Each Class A common share is entitled to one vote per share. Each Class B common share possesses voting rights equivalent to one-ten-thousandth (1/10,000) of the voting rights of a Class A share. Unless otherwise required under Delaware General Corporation Law, Class A and Class B common shares vote as a single class.
On an equivalent Class A common stock basis, there were 1,648,120 shares outstanding as of December 31, 2010 and 1,551,749 shares outstanding as of December 31, 2009. The Class B stock split had no effect on the number of equivalent Class A common shares outstanding. In addition to our common stock, 1,000,000 shares of preferred stock are authorized, but none are issued and outstanding.
| (19) | Pension plans |
Several of our subsidiaries individually sponsor defined benefit pension plans covering certain employees. Benefits under the plans are generally based on years of service and compensation, although benefits under certain plans are based on years of service and fixed benefit rates. Contributions to the plans are made, generally, to meet regulatory requirements. Additional amounts may be contributed as determined by management based on actuarial valuations.
57
Table of Contents
Notes to Consolidated Financial Statements (Continued)
| (19) | Pension plans (Continued) |
The components of net periodic pension expense for each of the three years ending December 31, 2010 are as follows (in millions).
| 2010 | 2009 | 2008 | ||||||||||
| Service cost |
$ | 165 | $ | 162 | $ | 176 | ||||||
| Interest cost |
543 | 455 | 452 | |||||||||
| Expected return on plan assets |
(528 | ) | (417 | ) | (463 | ) | ||||||
| Other |
69 | 35 | 20 | |||||||||
| Net pension expense |
$ | 249 | $ | 235 | $ | 185 | ||||||
The accumulated benefit obligation is the actuarial present value of benefits earned based on service and compensation prior to the valuation date. As of December 31, 2010 and 2009, the accumulated benefit obligation was $9,954 million and $7,379 million, respectively. The projected benefit obligation is the actuarial present value of benefits earned based upon service and compensation prior to the valuation date and, if applicable, includes assumptions regarding future compensation levels. Information regarding projected benefit obligations is shown in the table that follows (in millions).
| 2010 | 2009 | |||||||
| Projected benefit obligation, beginning of year |
$ | 8,136 | $ | 7,587 | ||||
| Service cost |
165 | 162 | ||||||
| Interest cost |
543 | 455 | ||||||
| Benefits paid |
(528 | ) | (408 | ) | ||||
| BNSF acquisition |
1,986 | — | ||||||
| Actuarial (gain) or loss and other |
296 | 340 | ||||||
| Projected benefit obligation, end of year |
$ | 10,598 | $ | 8,136 | ||||
Benefit obligations under qualified U.S. defined benefit plans are funded through assets held in trusts and are not included as assets in our Consolidated Financial Statements. Pension obligations under certain non-U.S. plans and non-qualified U.S. plans are unfunded. As of December 31, 2010, projected benefit obligations of non-qualified U.S. plans and non-U.S. plans which are not funded through assets held in trusts were $797 million. A reconciliation of the changes in plan assets and a summary of plan assets held as of December 31, 2010 and 2009 is presented in the table that follows (in millions).
| 2010 | 2009 | |||||||
| Plan assets at beginning of year |
$ | 5,926 | $ | 5,322 | ||||
| Employer contributions |
776 | 224 | ||||||
| Benefits paid |
(528 | ) | (408 | ) | ||||
| Actual return on plan assets |
795 | 749 | ||||||
| BNSF acquisition |
1,342 | — | ||||||
| Other and expenses |
(65 | ) | 39 | |||||
| Plan assets at end of year |
$ | 8,246 | $ | 5,926 | ||||
58
Table of Contents
Notes to Consolidated Financial Statements (Continued)
| (19) | Pension plans (Continued) |
Fair value measurements for pension assets as of December 31, 2010 and 2009 follow (in millions).
| Total Fair Value |
Quoted Prices (Level 1) |
Significant Other Observable Inputs (Level 2) |
Significant Unobservable Inputs (Level 3) |
|||||||||||||
| December 31, 2010 |
||||||||||||||||
| Cash and equivalents |
$ | 474 | $ | 423 | $ | 51 | $ | — | ||||||||
| Government obligations |
895 | 609 | 285 | 1 | ||||||||||||
| Investment funds |
2,020 | 597 | 1,423 | — | ||||||||||||
| Corporate debt obligations |
1,015 | 147 | 868 | — | ||||||||||||
| Equity securities |
3,069 | 3,069 | — | — | ||||||||||||
| Other |
773 | 54 | 349 | 370 | ||||||||||||
| $ | 8,246 | $ | 4,899 | $ | 2,976 | $ | 371 | |||||||||
| December 31, 2009 |
||||||||||||||||
| Cash and equivalents |
$ | 408 | $ | 401 | $ | 7 | $ | — | ||||||||
| Government obligations |
674 | 554 | 120 | — | ||||||||||||
| Investment funds |
1,470 | 174 | 1,296 | — | ||||||||||||
| Corporate debt obligations |
744 | 157 | 587 | — | ||||||||||||
| Equity securities |
2,152 | 2,131 | 21 | — | ||||||||||||
| Other |
478 | 27 | 223 | 228 | ||||||||||||
| $ | 5,926 | $ | 3,444 | $ | 2,254 | $ | 228 | |||||||||
Refer to Note 17 for a discussion of the three levels in the hierarchy of fair values. Pension assets measured at fair value with significant unobservable inputs (Level 3) for the year ended December 31, 2010 and 2009 consisted primarily of real estate and limited partnership interests.
Pension plan assets are generally invested with the long-term objective of earning sufficient amounts to cover expected benefit obligations, while assuming a prudent level of risk. Allocations may change as a result of changing market conditions and investment opportunities. The expected rates of return on plan assets reflect subjective assessments of expected invested asset returns over a period of several years. Generally, past investment returns are not given significant consideration when establishing assumptions for expected long-term rates of returns on plan assets. Actual experience will differ from the assumed rates.
The defined benefit plans expect to pay benefits to participants over the next ten years, reflecting expected future service as appropriate, as follows (in millions): 2011 – $588; 2012 – $606; 2013 – $625; 2014 – $645; 2015 – $650; and 2016 to 2020 – $3,431. Sponsoring subsidiaries expect to contribute $340 million to defined benefit pension plans in 2011.
As of December 31, 2010 and 2009, the net funded status of the plans is summarized in the table that follows (in millions).
| 2010 | 2009 | |||||||
| Amounts recognized in the Consolidated Balance Sheets: |
||||||||
| Other liabilities |
$ | 2,425 | $ | 2,288 | ||||
| Other assets |
(73 | ) | (78 | ) | ||||
| $ | 2,352 | $ | 2,210 | |||||
A reconciliation of amounts included in accumulated other comprehensive income related to defined benefit plans for the years ending December 31, 2010 and 2009 follows (in millions).
| 2010 | 2009 | |||||||
| Accumulated other comprehensive income (loss), beginning of year |
$ | (1,368 | ) | $ | (1,320 | ) | ||
| Amount included in net periodic pension expense |
53 | 39 | ||||||
| Gains (losses) current period and other |
(80 | ) | (87 | ) | ||||
| Accumulated other comprehensive income (loss), end of year |
$ | (1,395 | )* | $ | (1,368 | ) | ||
| * | Includes $96 million that is expected to be included in net periodic pension expense in 2011. |
59
Table of Contents
Notes to Consolidated Financial Statements (Continued)
| (19) | Pension plans (Continued) |
Weighted average interest rate assumptions used in determining projected benefit obligations and net periodic pension expense were as follows.
| 2010 | 2009 | |||||||
| Discount rate |
5.4 | % | 5.9 | % | ||||
| Expected long-term rate of return on plan assets |
7.1 | 6.9 | ||||||
| Rate of compensation increase |
3.7 | 4.0 | ||||||
Several of our subsidiaries also sponsor defined contribution retirement plans, such as 401(k) or profit sharing plans. Employee contributions to the plans are subject to regulatory limitations and the specific plan provisions. Several of the plans require that the subsidiary match these contributions up to levels specified in the plans and provide for additional discretionary contributions as determined by management. Expenses related to employer contributions for these plans were $567 million, $540 million and $519 million for the years ended December 31, 2010, 2009 and 2008, respectively. Certain subsidiaries contribute to multiemployer retirement plans. Contributions by these subsidiaries to such plans were $78 million in 2010, $22 million in 2009 and $23 million in 2008. The increase in 2010 was due to contributions by BNSF.
| (20) | Contingencies and Commitments |
We are parties in a variety of legal actions arising out of the normal course of business. In particular, such legal actions affect our insurance and reinsurance businesses. Such litigation generally seeks to establish liability directly through insurance contracts or indirectly through reinsurance contracts issued by Berkshire subsidiaries. Plaintiffs occasionally seek punitive or exemplary damages. We do not believe that such normal and routine litigation will have a material effect on its financial condition or results of operations. Berkshire and certain of its subsidiaries are also involved in other kinds of legal actions, some of which assert or may assert claims or seek to impose fines and penalties in substantial amounts.
| a) | Civil Litigation |
Litigation Related to ROA
General Reinsurance Corporation (“General Reinsurance”), a wholly-owned subsidiary of Berkshire, and several current and former employees, along with numerous other defendants, have been sued in fourteen federal lawsuits involving Reciprocal of America (“ROA”) and related entities. ROA was a Virginia-based reciprocal insurer and reinsurer of physician, hospital and lawyer professional liability risks. Ten are putative class actions initiated by doctors, hospitals and lawyers that purchased insurance through ROA or certain of its Tennessee-based risk retention groups. These complaints seek compensatory, treble, and punitive damages in an amount plaintiffs contend is just and reasonable. The most recently filed action was filed in April 2010 by the same attorneys representing the same hospitals as in three of the other putative class actions pending in the U.S. District Court for the Western District of Tennessee. The allegations are virtually identical to the previously filed hospital policyholder actions.
General Reinsurance is also subject to actions brought by the Virginia Commissioner of Insurance, as Deputy Receiver of ROA, the Tennessee Commissioner of Insurance, as Receiver for purposes of liquidating three Tennessee risk retention groups, a state lawsuit filed by a Missouri-based hospital group that was removed to federal court and another state lawsuit filed by an Alabama doctor that was also removed to federal court. The first of these actions was filed in March 2003 and additional actions were filed in April 2003 through June 2006. Twelve of these cases are collectively assigned to the U.S. District Court for the Western District of Tennessee for pretrial proceedings.
General Reinsurance has settled with both the Virginia and Tennessee Receivers, whose respective claims against General Reinsurance and its current and former employees have been dismissed with prejudice. The Missouri-based hospital group has also agreed to dismiss its claims against General Reinsurance.
Actions related to AIG
General Reinsurance is a defendant in In re American International Group Securities Litigation, Case No. 04-CV-8141-(LTS), United States District Court, Southern District of New York, a putative class action (the “AIG Securities Litigation”)
60
Table of Contents
Notes to Consolidated Financial Statements (Continued)
| (20) | Contingencies and Commitments (Continued) |
asserted on behalf of investors who purchased publicly-traded securities of AIG between October 1999 and March 2005. The complaint, originally filed in April 2005, asserts various claims against AIG and certain of its officers, directors, investment banks and other parties, including former employees of General Reinsurance (whom the Complaint defines, together with General Reinsurance, as the “General Re Defendants”). The Complaint alleges that the General Re Defendants violated Section 10(b) of the Securities Exchange Act and Rule 10b-5 in connection with General Reinsurance’s transaction with AIG initially effected in 2000 (“the AIG Transaction”). The Complaint seeks damages and other relief in unspecified amounts. General Reinsurance has answered the Complaint, denying liability and asserting various affirmative defenses. Lead plaintiffs filed a motion for class certification on February 20, 2008. Various defendants, including General Reinsurance, have filed oppositions to class certification. The lead plaintiffs and General Reinsurance previously reached agreement concerning the terms of a settlement that would resolve all claims against the General Re Defendants in exchange for a payment by General Reinsurance of $72 million, out of which the court may award plaintiffs’ counsel no more than $11.5 million in fees and reimbursement of costs, with the remaining amount of at least $60.5 million to be distributed to purchasers of AIG securities. There was no court decision specifically approving or disapproving this settlement but rather, on February 22, 2010, the court granted class certification with respect to claims against AIG, and denied class certification with respect to claims against General Reinsurance. On September 23, 2010, the court entered a final judgment dismissing the General Re Defendants from the case. On October 21, 2010, the lead plaintiffs, on behalf of themselves and the putative class, filed a notice of appeal of that final judgment, and also appealed from the court’s February 22, 2010 order (granting in part and denying in part the lead plaintiffs’ motion to certify the class, but only to the extent the order denied class certification as against the General Re Defendants), and the court’s March 4, 2010 order denying as moot the lead plaintiffs’ motion for preliminary court approval of the class action settlement with General Re.
A member of the putative class in the litigation described in the preceding paragraph has asserted similar claims against General Reinsurance and a former officer of General Reinsurance in a separate complaint, Florida State Board of Administration v. General Re Corporation, et al., Case No. 06-CV-3967, United States District Court, Southern District of New York. The parties have settled this matter, the terms of which will require dismissal of this action with prejudice.
On July 27, 2005, General Reinsurance received a Summons and a Verified and Amended Shareholder Derivative Complaint in In re American International Group, Inc. Derivative Litigation, Case No. 04-CV-08406, United States District Court, Southern District of New York. The complaint, brought by several alleged shareholders of AIG, seeks damages, injunctive and declaratory relief against various officers and directors of AIG as well as a variety of individuals and entities with whom AIG did business, relating to a wide variety of allegedly wrongful practices by AIG. Plaintiffs have petitioned the court to dismiss the action with prejudice as to all defendants.
In August 2005, General Reinsurance received a Summons and First Amended Consolidated Shareholders’ Derivative Complaint in In re American International Group, Inc. Consolidated Derivative Litigation, Case No. 769-N, Delaware Chancery Court. On September 28, 2007, AIG and the shareholder plaintiffs filed a Second Combined Amended Complaint, in which AIG asserted claims against certain of its former officers and the shareholder plaintiffs asserted claims against a number of other defendants, including General Reinsurance. On July 13, 2009, the Delaware Chancery Court entered judgment dismissing with prejudice the claims asserted against General Reinsurance and certain other defendants in the matter. By Order dated December 29, 2010, the Delaware Supreme Court unanimously affirmed the Chancery Court dismissal of the claims against General Reinsurance and certain other defendants.
FAI/HIH Matter
In December 2003, the Liquidators of both FAI Insurance Limited (“FAI”) and HIH Insurance Limited (“HIH”) advised indirect wholly-owned subsidiaries of Berkshire (General Reinsurance Australia Limited (“GRA”) and Kölnische Rückversicherungs-Gesellschaft AG (“Cologne Re”)) that they intended to assert claims arising from insurance transactions GRA entered into with FAI in May and June 1998. In August 2004, the Liquidators filed claims in the Supreme Court of New South Wales in order to avoid the expiration of a statute of limitations for certain plaintiffs. The focus of the Liquidators’ allegations against GRA and Cologne Re are the 1998 transactions GRA entered into with FAI (which was acquired by HIH in 1999). The Liquidators contend, among other things, that GRA and Cologne Re engaged in deceptive conduct that assisted FAI in improperly accounting for such transactions as reinsurance, and that such deception led to HIH’s acquisition of FAI and caused various losses to FAI and HIH. The Liquidator of HIH served its Complaint on GRA and Cologne Re in June 2006 and
61
Table of Contents
Notes to Consolidated Financial Statements (Continued)
| (20) | Contingencies and Commitments (Continued) |
discovery has been ongoing. The FAI Liquidator previously dismissed his complaint against GRA and Cologne Re. GRA and Cologne Re have finalized their settlement with the HIH Liquidator and as a result on March 24, 2010 court orders were entered dismissing the HIH Liquidators action in its entirety.
We have established reserves for certain of the legal proceedings discussed above where we have concluded that the likelihood of an unfavorable outcome is probable and the amount of the loss can be reasonably estimated. We believe that any liability that may arise as a result of current pending civil litigation, including the matters discussed above, will not have a material effect on our financial condition or results of operations.
| b) | Commitments |
We lease certain manufacturing, warehouse, retail and office facilities as well as certain equipment. Rent expense for all operating leases was $1,204 million in 2010, $701 million in 2009 and $725 million in 2008. The increase in 2010 was due to the BNSF acquisition. Minimum rental payments for operating leases having initial or remaining non-cancelable terms in excess of one year are as follows. Amounts are in millions.
| 2011 |
2012 | 2013 | 2014 | 2015 | After 2015 |
Total | ||||||||||||||||||
| $1,156 | $ | 1,043 | $ | 910 | $ | 816 | $ | 740 | $ | 4,456 | $ | 9,121 | ||||||||||||
Several of our subsidiaries have made commitments in the ordinary course of business to purchase goods and services used in their businesses. The most significant of these relate to our railroad, utilities and energy businesses. As of December 31, 2010, commitments under all such subsidiary arrangements were approximately $9.8 billion in 2011, $4.4 billion in 2012, $4.3 billion in 2013, $3.1 billion in 2014, $2.5 billion in 2015 and $10.8 billion after 2015.
In the first quarter of 2011, we are acquiring an additional 16.6% of the outstanding common stock of Marmon, thus increasing our total ownership interest to 80.2%. We currently estimate the cost of this additional share purchase to be approximately $1.5 billion. The purchase of these shares is being accounted for as an acquisition of noncontrolling interest. Accordingly, the difference of approximately $600 million between the consideration expected to be paid and the prior carrying amount of the noncontrolling interest being acquired has been recorded as a reduction to Berkshire’s shareholders’ equity. Berkshire will acquire substantially all of the remaining equity interests in Marmon in 2013 or 2014. However, the consideration ultimately payable is contingent upon future operating results of Marmon and the per-share cost could be greater than or less than the price in 2011.
We currently own 80.1% of the outstanding common stock of Wesco Financial Corporation (“Wesco”) and on February 4, 2011, we entered into an agreement to acquire the 19.9% noncontrolling interests in Wesco that we did not already own for a price that is based on Wesco’s estimated shareholders’ equity per share at the time the acquisition closes. Based on Wesco’s shareholders’ equity at December 31, 2010, the cost to acquire these shares would be approximately $550 million, payable at the election of the Wesco shareholders in either cash or Berkshire Class B common stock. The acquisition is subject to customary prior approvals including the affirmative vote of holders of a majority of Wesco’s outstanding shares not owned by Berkshire.
Pursuant to the terms of shareholder agreements with noncontrolling shareholders in certain of our other less than wholly-owned subsidiaries, we may be obligated to acquire their equity ownership interests. The consideration payable for such interests is generally based on the fair value. If we acquired all such outstanding noncontrolling interests as of December 31, 2010, the cost would have been approximately $2.9 billion. However, the timing and the amount of any such future payments that might be required are contingent on future actions of the noncontrolling owners and future operating results of the related subsidiaries.
| (21) | Business segment data |
Our reportable business segments are organized in a manner that reflects how management views those business activities. Certain businesses have been grouped together for segment reporting based upon similar products or product lines, marketing, selling and distribution characteristics, even though those business units are operated under separate local management.
The tabular information that follows shows data of reportable segments reconciled to amounts reflected in the Consolidated Financial Statements. Intersegment transactions are not eliminated in instances where management considers those transactions in assessing the results of the respective segments. Furthermore, our management does not consider investment and derivative
62
Table of Contents
Notes to Consolidated Financial Statements (Continued)
| (21) | Business segment data (Continued) |
gains/losses or amortization of purchase accounting adjustments in assessing the performance of reporting units. Collectively, these items are included in reconciliations of segment amounts to consolidated amounts.
| Business Identity |
Business Activity | |
| GEICO |
Underwriting private passenger automobile insurance mainly by direct response methods | |
| General Re |
Underwriting excess-of-loss, quota-share and facultative reinsurance worldwide | |
| Berkshire Hathaway Reinsurance Group |
Underwriting excess-of-loss and quota-share reinsurance for insurers and reinsurers | |
| Berkshire Hathaway Primary Group |
Underwriting multiple lines of property and casualty insurance policies for primarily commercial accounts | |
| Burlington Northern Santa Fe |
Operates one of the largest railroad systems in North America | |
| BH Finance, Clayton Homes, XTRA, CORT and other financial services (“Finance and financial products”) | Proprietary investing, manufactured housing and related consumer financing, transportation equipment leasing and furniture leasing | |
| Marmon |
An association of approximately 130 manufacturing and service businesses that operate within 11 diverse business sectors | |
| McLane Company |
Wholesale distribution of groceries and non-food items | |
| MidAmerican |
Regulated electric and gas utility, including power generation and distribution activities in the U.S. and internationally; domestic real estate brokerage | |
Other businesses not specifically identified with reportable business segments consist of a large, diverse group of manufacturing, service and retailing businesses.
| Business Activity |
Business Identity | |
| Manufacturing |
Acme Building Brands, Benjamin Moore, H.H. Brown Shoe Group, CTB, Fechheimer Brothers, Forest River, Fruit of the Loom, Garan, IMC, Johns Manville, Justin Brands, Larson-Juhl, MiTek, Richline, Scott Fetzer and Shaw Industries | |
| Service |
Buffalo News, Business Wire, FlightSafety, International Dairy Queen, Pampered Chef, NetJets and TTI | |
| Retailing |
Ben Bridge Jeweler, Borsheims, Helzberg Diamond Shops, Jordan’s Furniture, Nebraska Furniture Mart, See’s Candies, Star Furniture and R.C. Willey | |
63
Table of Contents
Notes to Consolidated Financial Statements (Continued)
| (21) | Business segment data (Continued) |
A disaggregation of our consolidated data for each of the three most recent years is presented in the tables which follow on this and the following two pages (in millions).
| Revenues | Earnings before income taxes | |||||||||||||||||||||||
| 2010 | 2009 | 2008 | 2010 | 2009 | 2008 | |||||||||||||||||||
| Operating Businesses: |
||||||||||||||||||||||||
| Insurance group: |
||||||||||||||||||||||||
| Underwriting: |
||||||||||||||||||||||||
| GEICO |
$ | 14,283 | $ | 13,576 | $ | 12,479 | $ | 1,117 | $ | 649 | $ | 916 | ||||||||||||
| General Re |
5,693 | 5,829 | 6,014 | 452 | 477 | 342 | ||||||||||||||||||
| Berkshire Hathaway Reinsurance Group |
9,076 | 6,706 | 5,082 | 176 | 250 | 1,222 | ||||||||||||||||||
| Berkshire Hathaway Primary Group |
1,697 | 1,773 | 1,950 | 268 | 84 | 210 | ||||||||||||||||||
| Investment income |
5,186 | 5,509 | 4,933 | 5,145 | 5,459 | 4,896 | ||||||||||||||||||
| Total insurance group |
35,935 | 33,393 | 30,458 | 7,158 | 6,919 | 7,586 | ||||||||||||||||||
| Burlington Northern Santa Fe (1) |
15,059 | — | — | 3,611 | — | — | ||||||||||||||||||
| Finance and financial products |
4,264 | 4,301 | 4,773 | 689 | 653 | 771 | ||||||||||||||||||
| Marmon (2) |
5,967 | 5,067 | 5,529 | 813 | 686 | 733 | ||||||||||||||||||
| McLane Company |
32,687 | 31,207 | 29,852 | 369 | 344 | 276 | ||||||||||||||||||
| MidAmerican |
11,305 | 11,443 | 13,971 | 1,539 | 1,528 | 2,963 | ||||||||||||||||||
| Other businesses |
27,956 | 25,391 | 30,718 | 3,092 | 1,028 | 3,014 | ||||||||||||||||||
| 133,173 | 110,802 | 115,301 | 17,271 | 11,158 | 15,343 | |||||||||||||||||||
| Reconciliation of segments to consolidated amount: |
||||||||||||||||||||||||
| Investment and derivative gains/losses |
2,346 | 787 | (7,461 | ) | 2,346 | 787 | (7,461 | ) | ||||||||||||||||
| Interest expense, not allocated to segments |
— | — | — | (208 | ) | (101 | ) | (91 | ) | |||||||||||||||
| Eliminations and other |
666 | 904 | (54 | ) | (358 | ) | (292 | ) | (217 | ) | ||||||||||||||
| $ | 136,185 | $ | 112,493 | $ | 107,786 | $ | 19,051 | $ | 11,552 | $ | 7,574 | |||||||||||||
| (1) | Includes results from the acquisition date of February 12, 2010. |
| (2) | Includes results from the acquisition date of March 18, 2008. |
| Capital expenditures | Depreciation of tangible assets |
|||||||||||||||||||||||
| 2010 | 2009 | 2008 | 2010 | 2009 | 2008 | |||||||||||||||||||
| Operating Businesses: |
||||||||||||||||||||||||
| Insurance group |
$ | 40 | $ | 50 | $ | 72 | $ | 66 | $ | 71 | $ | 70 | ||||||||||||
| Burlington Northern Santa Fe (1) |
1,829 | — | — | 1,221 | — | — | ||||||||||||||||||
| Finance and financial products |
233 | 148 | 185 | 204 | 219 | 228 | ||||||||||||||||||
| Marmon (2) |
307 | 436 | 553 | 507 | 521 | 361 | ||||||||||||||||||
| McLane Company |
166 | 172 | 180 | 129 | 120 | 109 | ||||||||||||||||||
| MidAmerican |
2,593 | 3,413 | 3,936 | 1,262 | 1,246 | 1,128 | ||||||||||||||||||
| Other businesses |
812 | 718 | 1,212 | 890 | 950 | 914 | ||||||||||||||||||
| $ | 5,980 | $ | 4,937 | $ | 6,138 | $ | 4,279 | $ | 3,127 | $ | 2,810 | |||||||||||||
| (1) | Includes amounts from acquisition date of February 12, 2010. |
| (2) | Includes amounts from acquisition date of March 18, 2008. |
64
Table of Contents
Notes to Consolidated Financial Statements (Continued)
| (21) | Business segment data (Continued) |
| Goodwill at year-end |
Identifiable assets at year-end |
|||||||||||||||
| 2010 | 2009 | 2010 | 2009 | |||||||||||||
| Operating Businesses: |
||||||||||||||||
| Insurance group: |
||||||||||||||||
| GEICO |
$ | 1,372 | $ | 1,372 | $ | 25,631 | $ | 22,996 | ||||||||
| General Re |
13,532 | 13,532 | 29,196 | 30,894 | ||||||||||||
| Berkshire Hathaway Reinsurance and Primary Groups |
589 | 589 | 104,383 | 102,787 | ||||||||||||
| Total insurance group |
15,493 | 15,493 | 159,210 | 156,677 | ||||||||||||
| Burlington Northern Santa Fe |
14,803 | — | 53,476 | — | ||||||||||||
| Finance and financial products |
1,031 | 1,024 | 24,692 | 24,027 | ||||||||||||
| Marmon |
709 | 706 | 10,047 | 9,768 | ||||||||||||
| McLane Company |
155 | 155 | 4,018 | 3,505 | ||||||||||||
| MidAmerican |
5,281 | 5,334 | 40,045 | 39,437 | ||||||||||||
| Other businesses |
11,534 | 11,260 | 24,144 | 22,888 | ||||||||||||
| $ | 49,006 | $ | 33,972 | 315,632 | 256,302 | |||||||||||
| Reconciliation of segments to consolidated amount: |
||||||||||||||||
| Corporate and other |
7,591 | 6,845 | ||||||||||||||
| Goodwill |
49,006 | 33,972 | ||||||||||||||
| $ | 372,229 | $ | 297,119 | |||||||||||||
Insurance premiums written by geographic region (based upon the domicile of the insured or reinsured) are summarized below. Dollars are in millions.
| Property/Casualty | Life/Health | |||||||||||||||||||||||
| 2010 | 2009 | 2008 | 2010 | 2009 | 2008 | |||||||||||||||||||
| United States |
$ | 21,539 | $ | 19,280 | $ | 19,267 | $ | 3,210 | $ | 1,095 | $ | 1,119 | ||||||||||||
| Western Europe |
3,377 | 5,236 | 4,145 | 945 | 761 | 749 | ||||||||||||||||||
| All other |
918 | 737 | 797 | 927 | 774 | 720 | ||||||||||||||||||
| $ | 25,834 | $ | 25,253 | $ | 24,209 | $ | 5,082 | $ | 2,630 | $ | 2,588 | |||||||||||||
In 2010, 2009 and 2008, premiums written and earned attributable to Western Europe were primarily in the United Kingdom, Germany, Switzerland and Luxembourg. In 2010 and 2009, property/casualty insurance premiums earned included approximately $2.4 billion and $4.6 billion, respectively, from Swiss Reinsurance Company Ltd. and its affiliates. Life/health insurance premiums written and earned in the United States in 2010 included approximately $2.1 billion from a single contract with Swiss Re Life & Health America Inc., an affiliate of Swiss Reinsurance Company Ltd.
Consolidated sales and service revenues in 2010, 2009 and 2008 were $67.2 billion, $62.6 billion and $65.9 billion, respectively. Approximately 88% of such amounts in 2010 were in the United States compared with approximately 90% in 2009 and 2008. The remainder of sales and service revenues were primarily in Europe and Canada. In 2010, consolidated sales and service revenues included $11.8 billion of sales to Wal-Mart Stores, Inc. which were primarily related to McLane’s wholesale distribution business.
Approximately 97% of our revenues in 2010 from railroad, utilities and energy businesses were in the United States versus 91% in 2009 and 2008. In each year most of the remainder was attributed to the United Kingdom. At December 31, 2010, approximately 92% of our consolidated net property, plant and equipment were located in the United States with the remainder primarily in the United Kingdom, Canada and Europe.
65
Table of Contents
Notes to Consolidated Financial Statements (Continued)
| (21) | Business segment data (Continued) |
Premiums written and earned by the property/casualty and life/health insurance businesses are summarized below (in millions).
| Property/Casualty | Life/Health | |||||||||||||||||||||||
| 2010 | 2009 | 2008 | 2010 | 2009 | 2008 | |||||||||||||||||||
| Premiums Written: |
||||||||||||||||||||||||
| Direct |
$ | 17,128 | $ | 16,484 | $ | 16,953 | $ | 3 | $ | — | $ | — | ||||||||||||
| Assumed |
9,171 | 9,321 | 7,960 | 5,203 | 2,727 | 2,690 | ||||||||||||||||||
| Ceded |
(465 | ) | (552 | ) | (704 | ) | (124 | ) | (97 | ) | (102 | ) | ||||||||||||
| $ | 25,834 | $ | 25,253 | $ | 24,209 | $ | 5,082 | $ | 2,630 | $ | 2,588 | |||||||||||||
| Premiums Earned: |
||||||||||||||||||||||||
| Direct |
$ | 16,932 | $ | 16,553 | $ | 16,269 | $ | 3 | $ | — | $ | — | ||||||||||||
| Assumed |
9,266 | 9,284 | 7,332 | 5,208 | 2,723 | 2,682 | ||||||||||||||||||
| Ceded |
(536 | ) | (579 | ) | (656 | ) | (124 | ) | (97 | ) | (102 | ) | ||||||||||||
| $ | 25,662 | $ | 25,258 | $ | 22,945 | $ | 5,087 | $ | 2,626 | $ | 2,580 | |||||||||||||
| (22) | Quarterly data |
A summary of revenues and earnings by quarter for each of the last two years is presented in the following table. This information is unaudited. Dollars are in millions, except per share amounts.
| 1st Quarter |
2nd Quarter |
3rd Quarter |
4th Quarter |
|||||||||||||
| 2010 |
||||||||||||||||
| Revenues |
$ | 32,037 | $ | 31,709 | $ | 36,274 | $ | 36,165 | ||||||||
| Net earnings attributable to Berkshire * |
3,633 | 1,968 | 2,989 | 4,377 | ||||||||||||
| Net earnings attributable to Berkshire per equivalent Class A common share |
2,272 | 1,195 | 1,814 | 2,656 | ||||||||||||
| 2009 |
||||||||||||||||
| Revenues |
$ | 22,784 | $ | 29,607 | $ | 29,904 | $ | 30,198 | ||||||||
| Net earnings attributable to Berkshire * |
(1,534 | ) | 3,295 | 3,238 | 3,056 | |||||||||||
| Net earnings attributable to Berkshire per equivalent Class A common share |
(990 | ) | 2,123 | 2,087 | 1,969 | |||||||||||
| * | Includes realized investment gains/losses, other-than-temporary impairment losses on investments and derivative gains/losses. Derivative gains/losses include significant amounts related to non-cash changes in the fair value of long-term contracts arising from short-term changes in equity prices, interest rates and foreign currency rates, among other factors. After-tax investment and derivative gains/losses for the periods presented above are as follows (in millions): |
| 1st Quarter |
2nd Quarter |
3rd Quarter |
4th Quarter |
|||||||||||||
| Investment and derivative gains/losses – 2010 |
$ | 1,411 | $ | (1,106 | ) | $ | 202 | $ | 1,367 | |||||||
| Investment and derivative gains/losses – 2009 |
(3,239 | ) | 1,515 | 1,183 | 1,027 | |||||||||||
66
Table of Contents
and Subsidiaries
Management’s Discussion and Analysis of
Financial Condition and Results of Operations
Results of Operations
Net earnings attributable to Berkshire for each of the past three years are disaggregated in the table that follows. Amounts are after deducting income taxes and exclude earnings attributable to noncontrolling interests. Amounts are in millions.
| 2010 | 2009 | 2008 | ||||||||||
| Insurance – underwriting |
$ | 1,301 | $ | 949 | $ | 1,739 | ||||||
| Insurance – investment income |
3,860 | 4,271 | 3,610 | |||||||||
| Railroad |
2,235 | * | — | — | ||||||||
| Utilities and energy |
1,131 | 1,071 | 1,704 | |||||||||
| Manufacturing, service and retailing |
2,462 | 1,113 | 2,283 | |||||||||
| Finance and financial products |
441 | 411 | 469 | |||||||||
| Other |
(337 | ) | (246 | ) | (166 | ) | ||||||
| Investment and derivative gains/losses |
1,874 | 486 | (4,645 | ) | ||||||||
| Net earnings attributable to Berkshire |
$ | 12,967 | $ | 8,055 | $ | 4,994 | ||||||
| * | Earnings are for the period between February 13 and December 31, 2010. |
Our operating businesses are managed on an unusually decentralized basis. There are essentially no centralized or integrated business functions (such as sales, marketing, purchasing, legal or human resources) and there is minimal involvement by our corporate headquarters in the day-to-day business activities of the operating businesses. Our corporate senior management team participates in and is ultimately responsible for significant capital allocation decisions, investment activities and the selection of the Chief Executive to head each of the operating businesses. The business segment data (Note 21 to the Consolidated Financial Statements) should be read in conjunction with this discussion.
On February 12, 2010, we completed the acquisition of the 77.5% of BNSF common stock that we did not already own. Beginning as of February 13, 2010, BNSF’s results and net earnings are included fully in our consolidated results and net earnings. In 2009 and until February 12, 2010, our share of net earnings related to our previously held investments in BNSF, as determined under the equity method, is included as a component of insurance investment income in the preceding table.
Over the last half of 2008 and throughout 2009, operating results of many of our businesses were adversely impacted by the world-wide economic recession. While our two largest business segments, which in 2009 were insurance and utilities, remained strong and operating results were not negatively impacted in any significant way by the recession, earnings of most of our diverse group of manufacturing, service and retailing businesses declined during 2009 as compared to the preceding two years. The effects from the economic recession resulted in lower sales volume and profit margins as consumers significantly curtailed spending, particularly for discretionary items. In 2010, operating results for many of our manufacturing, service and retailing businesses improved versus 2009, reflecting some stabilization of economic conditions.
In 2010, we realized after-tax investment and derivative gains of approximately $1.9 billion. The gains included a one-time holding gain of $979 million related to our acquisition of BNSF, net realized gains from the dispositions of investments, and net gains from derivative contracts, partially offset by non-cash other-than-temporary impairment losses recorded with respect to certain fixed maturity and equity securities. In 2009, we realized after-tax investment and derivative gains of $486 million, while in 2008 we had losses of approximately $4.6 billion. In 2009 and 2008, the gains and losses primarily derived from credit default contracts, dispositions of equity securities, other-than-temporary impairment losses with respect to certain equity securities and changes in estimated fair values of long duration equity index put option contracts. Changes in the equity and credit markets from period to period can and have caused significant volatility in periodic earnings.
In response to the crises in the financial markets and the global recession, the U.S. government and governments around the world are taking measures to regulate financial institutions, stabilize financial markets (including over-the-counter
67
Table of Contents
Management’s Discussion (Continued)
derivatives markets) and stimulate economic activity. In the United States, regulatory reform legislation known as the Dodd-Frank Wall Street Reform and Consumer Protection Act was signed into law on July 21, 2010. The ultimate impact that these governmental actions will have on us is not entirely certain at this time. Our operating companies have taken and will continue to take actions as necessary to manage through the current economic situation and to improve our operations for the long-term. We continue to believe that the economic franchises of our operating businesses remain intact. We anticipate that general economic conditions will continue to gradually improve, albeit unevenly, over time.
Insurance—Underwriting
We engage in both primary insurance and reinsurance of property and casualty risks. In primary insurance activities, we assume defined portions of the risks of loss from persons or organizations that are directly subject to the risks. In reinsurance activities, we assume defined portions of similar or dissimilar risks that other insurers or reinsurers have subjected themselves to in their own insuring activities. Our insurance and reinsurance businesses are: (1) GEICO, (2) General Re, (3) Berkshire Hathaway Reinsurance Group (“BHRG”) and (4) Berkshire Hathaway Primary Group. Through General Re and BHRG, we also reinsure life and health risks.
We view insurance businesses as possessing two distinct operations – underwriting and investing. Underwriting decisions are the responsibility of the unit managers; investing, with limited exceptions, is the responsibility of Berkshire’s Chairman and CEO, Warren E. Buffett. Accordingly, we evaluate performance of underwriting operations without any allocation of investment income.
Our periodic underwriting results can be affected significantly by changes in estimates for unpaid losses and loss adjustment expenses, including amounts established for occurrences in prior years. In addition, the timing and amount of catastrophe losses can produce significant volatility in our periodic underwriting results. Our underwriting results also include significant unrealized foreign currency transaction gains and losses arising from the periodic revaluation of certain non-U.S. Dollar denominated reinsurance liabilities into U.S. Dollars as a result of foreign currency exchange rate fluctuations.
A key marketing strategy followed by all of our insurance businesses is the maintenance of extraordinary capital strength. Statutory surplus of our insurance businesses was approximately $94 billion at December 31, 2010. This superior capital strength creates opportunities, especially with respect to reinsurance activities, to negotiate and enter into insurance and reinsurance contracts specially designed to meet the unique needs of insurance and reinsurance buyers.
Underwriting results from our insurance businesses are summarized below. Amounts are in millions.
| 2010 | 2009 | 2008 | ||||||||||
| Underwriting gain attributable to: |
||||||||||||
| GEICO |
$ | 1,117 | $ | 649 | $ | 916 | ||||||
| General Re |
452 | 477 | 342 | |||||||||
| Berkshire Hathaway Reinsurance Group |
176 | 250 | 1,222 | |||||||||
| Berkshire Hathaway Primary Group |
268 | 84 | 210 | |||||||||
| Pre-tax underwriting gain |
2,013 | 1,460 | 2,690 | |||||||||
| Income taxes and noncontrolling interests |
712 | 511 | 951 | |||||||||
| Net underwriting gain |
$ | 1,301 | $ | 949 | $ | 1,739 | ||||||
68
Table of Contents
Management’s Discussion (Continued)
Insurance—Underwriting (Continued)
GEICO
Through GEICO, we primarily write private passenger automobile insurance, offering coverages to insureds in all 50 states and the District of Columbia. GEICO’s policies are marketed mainly by direct response methods in which customers apply for coverage directly to the company via the Internet or over the telephone. This is a significant element in our strategy to be a low-cost auto insurer. In addition, we strive to provide excellent service to customers, with the goal of establishing long-term customer relationships. GEICO’s underwriting results are summarized below. Dollars are in millions.
| 2010 | 2009 | 2008 | ||||||||||||||||||||||
| Amount | % | Amount | % | Amount | % | |||||||||||||||||||
| Premiums written |
$ | 14,494 | $ | 13,758 | $ | 12,741 | ||||||||||||||||||
| Premiums earned |
$ | 14,283 | 100.0 | $ | 13,576 | 100.0 | $ | 12,479 | 100.0 | |||||||||||||||
| Losses and loss adjustment expenses |
10,631 | 74.4 | 10,457 | 77.0 | 9,332 | 74.8 | ||||||||||||||||||
| Underwriting expenses |
2,535 | 17.8 | 2,470 | 18.2 | 2,231 | 17.9 | ||||||||||||||||||
| Total losses and expenses |
13,166 | 92.2 | 12,927 | 95.2 | 11,563 | 92.7 | ||||||||||||||||||
| Pre-tax underwriting gain |
$ | 1,117 | $ | 649 | $ | 916 | ||||||||||||||||||
Premiums earned in 2010 increased $707 million (5.2%) over 2009. The growth in premiums earned for voluntary auto was 5.3% in 2010, reflecting a 5.9% increase in policies-in-force over the past year. Premiums earned in 2010 also reflected a very slight increase in average premiums per policy over the year, although by the end of 2010 average premiums per policy declined to year-end 2009 levels. Voluntary auto new business sales in 2010 declined 2.6% from relatively high levels during 2009 when new business sales increased 9.0% versus 2008. Voluntary auto policies-in-force at December 31, 2010 were approximately 563,000 greater than at December 31, 2009. The strong growth that occurred during the fourth quarter of 2010 when voluntary auto policies-in-force grew by about 165,000 is continuing. As of February 21, 2011, voluntary auto policies-in-force grew by about 188,500 since year-end.
Losses and loss adjustment expenses incurred in 2010 increased 1.7% over amounts incurred in 2009. The loss ratio was 74.4% in 2010 compared to 77.0% in 2009. The lower loss ratio in 2010 reflected the favorable impact of increased premium volume which was partially offset by changes in claim frequencies and severities. Claims frequencies in 2010 for property damage and collision coverages increased in the one to two percent range versus 2009, while frequencies for comprehensive coverages rose in the five to seven percent range from 2009 due to higher numbers of glass claims. Injury claims frequencies increased in the two to four percent range versus 2009. Claim severities in 2010 for physical damage coverages rose in the two to four percent range compared to 2009, while injury severities increased in the three to seven percent range. Incurred losses from catastrophe events in 2010 were $109 million compared to $83 million in 2009. Underwriting expenses incurred in 2010 increased 2.6% versus 2009 and primarily reflected increased advertising.
Premiums earned in 2009 increased $1,097 million (8.8%) over 2008, reflecting growth in voluntary auto premiums earned as a result of an overall increase in policies-in-force of 7.8%. Policies-in-force grew more rapidly in the latter part of 2008 and the early part of 2009 and moderated over the remainder of 2009. As a result, premiums earned in 2009 increased at a higher rate than policies-in-force, despite a slight decline in premiums per policy. Voluntary auto policies-in-force at December 31, 2009 were 684,000 greater than at December 31, 2008.
Losses and loss adjustment expenses incurred in 2009 increased $1,125 million (12.1%) compared with 2008. The loss ratio was 77.0% in 2009 compared to 74.8% in 2008. The higher loss ratio in 2009 reflected overall increases in claim frequencies and injury claim severities. Claims frequencies in 2009 for physical damage coverages increased in the one to two percent range, while frequencies for injury coverages increased in the five to seven percent range compared with the very low frequency levels in 2008. Injury severities in 2009 increased in the three to five percent range while physical damage severities decreased in the two to four percent range from 2008. Incurred losses from catastrophe events in 2009 of $83 million were relatively unchanged from 2008. Underwriting expenses in 2009 increased $239 million (10.7%) due primarily to higher policy issuance costs and increased salary and employee benefit expenses, which included increased interest on deferred compensation liabilities.
General Re
Through General Re, we conduct a reinsurance business offering property and casualty and life and health coverages to clients worldwide. We write property and casualty reinsurance in North America on a direct basis through General Reinsurance
69
Table of Contents
Management’s Discussion (Continued)
Insurance—Underwriting (Continued)
General Re (Continued)
Corporation and internationally through Germany-based General Reinsurance AG (formerly named Cologne Re) and other wholly-owned affiliates. Property and casualty reinsurance is also written through brokers with respect to Faraday in London. Life and health reinsurance is written in North America through General Re Life Corporation and internationally through General Reinsurance AG. General Re strives to generate underwriting profits in essentially all of its product lines, without consideration of investment income. Our management does not evaluate underwriting performance based upon market share and our underwriters are instructed to reject inadequately priced risks. General Re’s underwriting results are summarized in the following table. Amounts are in millions.
| Premiums written | Premiums earned | Pre-tax underwriting gain | ||||||||||||||||||||||||||||||||||
| 2010 | 2009 | 2008 | 2010 | 2009 | 2008 | 2010 | 2009 | 2008 | ||||||||||||||||||||||||||||
| Property/casualty |
$ | 2,923 | $ | 3,091 | $ | 3,383 | $ | 2,979 | $ | 3,203 | $ | 3,434 | $ | 289 | $ | 300 | $ | 163 | ||||||||||||||||||
| Life/health |
2,709 | 2,630 | 2,588 | 2,714 | 2,626 | 2,580 | 163 | 177 | 179 | |||||||||||||||||||||||||||
| $ | 5,632 | $ | 5,721 | $ | 5,971 | $ | 5,693 | $ | 5,829 | $ | 6,014 | $ | 452 | $ | 477 | $ | 342 | |||||||||||||||||||
Property/casualty
Premiums written in 2010 declined $168 million (5.4%) from 2009, while premiums earned in 2010 declined $224 million (7.0%) from 2009. Excluding the effects of foreign currency exchange rate changes, premiums written and earned in 2010 declined $202 million (6.5%) and $169 million (5.3%), respectively, compared with 2009. Premiums written and earned in 2010 reflected decreased volume as price competition in most property and casualty lines has led to decreases in premium volume over the past several years. Our underwriters continue to maintain discipline by rejecting inadequately priced offerings. Increased price competition and capacity within the industry could continue to constrain premium volume during 2011.
Underwriting gains were $289 million in 2010 and consisted of gains of $236 million from property business and $53 million from casualty/workers’ compensation business. The property business produced underwriting losses of $96 million for the 2010 accident year, offset by gains of $332 million from loss reserve reductions related to loss events occurring before 2010. The property results in 2010 were net of $339 million of catastrophe losses incurred primarily from the Chilean and New Zealand earthquakes and weather-related losses in Europe, Australia and New England. The timing and magnitude of catastrophe and large individual losses produces significant volatility in periodic underwriting results. The underwriting gains of $53 million from casualty/workers’ compensation business reflected overall reductions in prior years’ loss reserve estimates offset in part by $125 million of workers’ compensation loss reserve discount accretion and deferred charge amortization.
Premiums written and earned in 2009 declined $292 million (8.6%) and $231 million (6.7%), respectively, from 2008. Premiums in 2008 included $205 million with respect to a reinsurance-to-close transaction that increased our economic interest in the run-off of Lloyd’s Syndicate 435’s 2000 year of account from 39% to 100%. Under the reinsurance-to-close transaction, we also assumed a corresponding amount of net loss reserves and as a result, there was no impact on net underwriting gains in 2008. There was no similar transaction in 2009. Excluding the reinsurance-to-close transaction and the effects of foreign currency exchange rate changes, premiums written and earned in 2009 increased $149 million (4.7%) and $107 million (3.3%), respectively, compared to 2008, primarily due to increased volume in European treaty and Lloyd’s market property business.
Underwriting results in 2009 included underwriting gains of $478 million from property business and losses of $178 million from casualty/workers’ compensation business. The property business produced underwriting gains of $173 million for the 2009 accident year, and $305 million from loss reserve reductions related to loss events occurring before 2009. The property gains in 2009 were net of $48 million of losses from catastrophes, which were primarily from winter storm Klaus in Europe, the Victoria bushfires in Australia and an earthquake in Italy. The underwriting losses from casualty/workers’ compensation business were primarily the result of establishing higher loss reserves for 2009 accident year occurrences to reflect higher loss trends as well as $118 million of workers’ compensation loss reserve discount accretion and deferred charge amortization, offset in part by reserve reductions related to prior years’ casualty/workers’ compensation loss reserves.
Underwriting results in 2008 included $275 million in underwriting gains from property business partially offset by $112 million in underwriting losses from casualty/workers’ compensation business. The property business produced
70
Table of Contents
Management’s Discussion (Continued)
Insurance—Underwriting (Continued)
Property/casualty (Continued)
underwriting losses of $120 million for the 2008 accident year, offset by $395 million of gains from loss reserve reductions related to loss events occurring before 2008. The 2008 accident year results included $174 million of catastrophe losses from Hurricanes Gustav and Ike and $56 million of catastrophe losses from European storms. The underwriting losses from casualty/workers’ compensation business in 2008 included $117 million of workers’ compensation loss reserve discount accretion and deferred charge amortization, offset in part by reserve reductions related to prior years’ other casualty lines. The casualty results were also adversely impacted by legal costs incurred in connection with regulatory investigations.
Life/health
Premiums earned in 2010 increased 3.4% over 2009, which increased 1.8% over 2008. Adjusting for the effects of foreign currency exchange rate changes, premiums earned increased 4.8% over 2009, which increased 4.7% over 2008. The increases in premiums earned since 2008 were primarily due to increased international business. Underwriting results for the global life/health operations produced underwriting gains of $163 million in 2010, $177 million in 2009 and $179 million in 2008. Overall results were profitable in each of the past three years driven by gains from the life business due primarily to favorable mortality.
Berkshire Hathaway Reinsurance Group
Through the Berkshire Hathaway Reinsurance Group, we underwrite excess-of-loss reinsurance and quota-share coverages on property and casualty risks for insurers and reinsurers worldwide. BHRG’s business includes catastrophe excess-of-loss reinsurance and excess primary and facultative reinsurance for large or otherwise unusual discrete property risks referred to as individual risk. BHRG also writes retroactive reinsurance, which provides indemnification of losses and loss adjustment expenses with respect to past loss events. Other multi-line business refers to other property and casualty business written on both a quota-share and excess basis. Beginning in 2010, BHRG’s underwriting activities include life reinsurance as well as a life annuity business, which in previous years was included in the finance and financial products segment. Amounts for 2009 and 2008 have been reclassified to conform to the current year presentation. BHRG’s underwriting results are summarized in the table below. Amounts are in millions.
| Premiums earned | Pre-tax underwriting gain/loss | |||||||||||||||||||||||
| 2010 | 2009 | 2008 | 2010 | 2009 | 2008 | |||||||||||||||||||
| Catastrophe and individual risk |
$ | 623 | $ | 823 | $ | 955 | $ | 260 | $ | 782 | $ | 776 | ||||||||||||
| Retroactive reinsurance |
2,621 | 1,989 | 204 | (90 | ) | (448 | ) | (414 | ) | |||||||||||||||
| Other multi-line |
3,459 | 3,894 | 3,923 | 203 | 15 | 962 | ||||||||||||||||||
| Life and annuity |
2,373 | — | — | (197 | ) | (99 | ) | (102 | ) | |||||||||||||||
| $ | 9,076 | $ | 6,706 | $ | 5,082 | $ | 176 | $ | 250 | $ | 1,222 | |||||||||||||
Catastrophe and individual risk contracts may provide exceptionally large limits of indemnification and cover catastrophe risks (such as hurricanes, earthquakes or other natural disasters) or other property and liability risks. The timing and magnitude of losses produces extraordinary volatility in periodic underwriting results of this business. Catastrophe and individual risk premiums written were approximately $584 million in 2010, $725 million in 2009 and $1.1 billion in 2008. The level of business that we write in a given period will vary significantly due to changes in market conditions and our management’s assessment of the adequacy of premium rates. We constrained the volume of business written in 2010 as premium rates have not been attractive enough to warrant increasing volume. However, we have the capacity and willingness to write substantially more business when appropriate pricing can be obtained. Premiums earned from catastrophe and individual risk contracts in 2010 declined 24% from 2009 which declined 14% from 2008.
Underwriting results from catastrophe and individual risk business in 2010 included estimated losses of $322 million arising from several significant property catastrophe and casualty loss occurrences in 2010. Underwriting results in 2009 reflected no significant losses from catastrophes during the year, while in 2008 we incurred approximately $270 million of estimated losses from Hurricanes Gustav and Ike. Underwriting results in 2008 also included a gain of $224 million from a contract in which we agreed to purchase, under certain conditions, up to $4 billion of revenue bonds issued by the Florida Hurricane Catastrophe Fund Finance Corporation. Our obligation was conditioned upon, among other things, the occurrence of a specified amount of Florida hurricane losses during a period that expired on December 31, 2008 and which was not met.
71
Table of Contents
Management’s Discussion (Continued)
Insurance—Underwriting (Continued)
Berkshire Hathaway Reinsurance Group (Continued)
Retroactive reinsurance policies generally provide very large, but limited, indemnification of unpaid losses and loss adjustment expenses with respect to past loss events that are generally expected to be paid over long periods of time. Premiums earned in 2010 included approximately $2.25 billion from a reinsurance contract entered into with Continental Casualty Company, a subsidiary of CNA Financial Corporation, and several of its other insurance subsidiaries (collectively the “CNA Companies”). Under the terms of the reinsurance contract, BHRG assumed certain asbestos and environmental pollution liabilities of the CNA Companies subject to an aggregate limit of indemnification of $4 billion of covered losses and allocated loss adjustment expenses. The premiums earned related to this contract were offset by a corresponding amount of losses incurred (comprised of estimated loss reserves of approximately $2.45 billion less a deferred charge asset of approximately $200 million), thus resulting in no immediate impact on underwriting results. Premiums earned from retroactive reinsurance in 2009 included 2.0 billion Swiss Francs (approximately $1.7 billion) from an adverse loss development contract with Swiss Reinsurance Company Ltd. and its affiliates (“Swiss Re”) covering substantially all of Swiss Re’s non-life insurance losses and allocated loss adjustment expenses for loss events occurring prior to January 1, 2009.
Underwriting losses from retroactive reinsurance include the recurring amortization of deferred charges that are established with respect to these contracts. At the inception of a contract, deferred charges represent the difference between the premium received and the estimated ultimate losses payable. Deferred charges are subsequently amortized over the estimated claims payment period using the interest method and are based on estimates of the timing and amount of loss payments. Amortization charges are recorded as a component of losses and loss adjustment expenses. The relatively low underwriting losses in 2010 reflected the impact of net reductions in ultimate reserve estimates on certain large contracts and generally slower than expected loss payments, which resulted in lower rates of deferred charge amortization. At December 31, 2010, unamortized deferred charges for all of BHRG’s retroactive contracts were approximately $3.7 billion and gross unpaid losses were approximately $18.7 billion.
Other multi-line property and casualty premiums earned included $2.4 billion in 2010, $2.8 billion in 2009 and $1.8 billion in 2008 from a 20% quota-share reinsurance contract with Swiss Re covering substantially all of Swiss Re’s property/casualty risks incepting from January 1, 2008 and running through December 31, 2012. Excluding the Swiss Re quota-share contract, premiums earned in 2010 from other multi-line business declined $75 million (7%) from 2009, which declined $969 million (46%) compared to 2008.
Underwriting results from other multi-line business are affected by the timing and magnitude of catastrophe losses and unrealized foreign currency transactions. Underwriting results in 2010 for our other multi-line business included estimated catastrophe losses of approximately $308 million from the Chilean and New Zealand earthquakes, the Gulf of Mexico BP Deepwater Horizon oil rig explosion and the Australian floods. There were no significant catastrophe losses in 2009. Underwriting results in 2008 included approximately $435 million of estimated catastrophe losses from Hurricanes Gustav and Ike. Underwriting results also included losses of approximately $168 million in 2010 and $280 million in 2009 and gains of approximately $930 million in 2008 from unrealized foreign currency transaction gains and losses arising from the conversion of certain reinsurance loss reserves and other liabilities denominated in foreign currencies into U.S. Dollars as of the balance sheet dates. Excluding the effects of the currency gains/losses, other multi-line business produced underwriting gains of $371 million in 2010, $295 million in 2009 and $32 million in 2008.
In January 2010, BHRG entered in to a life reinsurance contract with Swiss Re Life & Health America Inc. (“SRLHA”). Under the agreement, BHRG assumed the liabilities and subsequent renewal premiums associated with a closed block of yearly renewable term reinsurance business reinsuring permanent and term products and universal life products written, assumed or subsequently acquired by SRLHA. BHRG assumes the mortality risk on the underlying lives with respect to the SRLHA business effective as of October 1, 2009, until the underlying yearly renewable term reinsured policy non-renews or the insurer ceding the business to SRLHA recaptures the business. Premiums earned in 2010 from this contract were $2.1 billion and underwriting losses were $83 million. The agreement is expected to remain in-force for several decades and, over time, is expected to result in substantial premiums earned and life benefits incurred. The underwriting results of the life and annuity business also included periodic interest charges arising from accretion of discounted annuity reserves. At December 31, 2010, the net reserves for all life and annuity benefits were approximately $2.8 billion.
72
Table of Contents
Management’s Discussion (Continued)
Insurance—Underwriting (Continued)
Berkshire Hathaway Primary Group
Our primary insurance group consists of a wide variety of independently managed insurance businesses that principally write liability coverages for commercial accounts. These businesses include: Medical Protective Corporation (“MedPro”), a provider of professional liability insurance to physicians, dentists and other healthcare providers; National Indemnity Company’s primary group (“NICO Primary Group”), writers of commercial motor vehicle and general liability coverages; U.S. Investment Corporation, whose subsidiaries underwrite specialty insurance coverages; a group of companies referred to internally as “Berkshire Hathaway Homestate Companies,” providers of standard commercial multi-line insurance; Central States Indemnity Company, a provider of credit and disability insurance to individuals nationwide through financial institutions; Applied Underwriters, a provider of integrated workers’ compensation solutions; and BoatU.S., a writer of insurance for owners of boats and small watercraft.
Earned premiums by our primary insurance businesses were $1.7 billion in 2010, $1.8 billion in 2009 and $2.0 billion in 2008. Premium volume of our primary insurers, in general, has been and continues to be constrained by soft market conditions and as a result, we are accepting less business. Underwriting gains as percentages of premiums earned were approximately 16% in 2010, 5% in 2009 and 11% in 2008. The improvement in underwriting results was primarily due to reductions of MedPro’s estimated prior years’ loss reserves and lower loss ratios of the Berkshire Hathaway Homestate Companies.
Insurance—Investment Income
A summary of net investment income of our insurance operations follows. Amounts are in millions.
| 2010 | 2009 | 2008 | ||||||||||
| Investment income before taxes, noncontrolling interests and equity method earnings |
$ | 5,145 | $ | 5,459 | $ | 4,896 | ||||||
| Income taxes and noncontrolling interests |
1,335 | 1,615 | 1,286 | |||||||||
| Net investment income before equity method earnings |
3,810 | 3,844 | 3,610 | |||||||||
| Equity method earnings |
50 | 427 | — | |||||||||
| Net investment income |
$ | 3,860 | $ | 4,271 | $ | 3,610 | ||||||
Investment income consists of interest and dividends earned on cash and cash equivalents and investments attributable to our insurance businesses. Pre-tax investment income declined $314 million (5.8%) compared with 2009. The decline in 2010 investment income reflected lower dividends earned from our investments in Wells Fargo common stock and the impact of a realized gain in 2009 of about $100 million from a short-term currency transaction made in anticipation of our investment in the Swiss Re convertible capital instrument.
Pre-tax investment income in 2009 exceeded 2008 by $563 million (11.5%). The increase in investment income in 2009 primarily reflected earnings from several large investments made in the fourth quarter of 2008 and first half of 2009, partially offset by lower earnings on cash and cash equivalents due to lower short-term interest rates and lower average cash balances.
In October 2008, we acquired 11.45% subordinated notes and 5% preferred stock issued by Wrigley and preferred stocks of Goldman Sachs and General Electric that each pay an annual dividend of 10%. In March 2009, we acquired a 12% convertible capital instrument of Swiss Re and in April 2009, we acquired an 8.5% Cumulative Convertible Perpetual Preferred Stock of Dow. In December 2009, we also acquired $1.0 billion par amount of senior notes issued by Wrigley. Approximately 85% of these securities were acquired by our insurance group, with the remainder primarily held in our finance and financial products businesses. Our insurance group earned about $1.8 billion in 2010 and $1.7 billion in 2009 in interest and dividends from the aforementioned investments.
Our investment income in 2011 may decline as compared to 2010 as a result of maturities and redemptions of higher yielding investments that occurred in 2010 and are expected to occur in 2011 and low interest rates currently available for reinvestment purposes. As a result, our cash and cash equivalent balances will likely increase during 2011. In November 2010, an agreement was entered into with Swiss Re providing for the redemption of the 12% capital instrument for aggregate consideration of approximately CHF 3.9 billion. In addition, our investment in Goldman Sachs preferred stock may be redeemed at the option of Goldman Sachs at any time and our investment in General Electric preferred stock may be redeemed
73
Table of Contents
Management’s Discussion (Continued)
Insurance—Investment Income (Continued)
at the option of General Electric beginning in October 2011. We anticipate that both of these securities will be redeemed in 2011. The negative impact on investment income from these events may be partially offset to the extent that dividend rates increase with respect to certain of our major common stock investments.
Insurance investment income also includes earnings from equity method investments (BNSF and Moody’s). Equity method earnings represented our proportionate share of the net earnings of these companies. As a result of a reduction of our ownership of Moody’s in July of 2009, we discontinued the use of the equity method for our investment in Moody’s as of the beginning of the third quarter of 2009. As a result of our acquisition of the remaining outstanding stock of BNSF on February 12, 2010, we discontinued the use of the equity method and BNSF’s accounts are now included in our Consolidated Financial Statements beginning as of February 13, 2010. Dividends received on equity method investments are not reflected in our earnings.
Invested assets derive from shareholder capital and reinvested earnings as well as net liabilities under insurance contracts or “float.” The major components of float are unpaid losses, life, annuity and health benefit liabilities, unearned premiums and other liabilities to policyholders less premium and reinsurance receivables, deferred charges assumed under retroactive reinsurance contracts and deferred policy acquisition costs. Float approximated $66 billion at December 31, 2010, $63 billion at December 31, 2009 and $60 billion at December 31, 2008, respectively. The cost of float, as represented by the ratio of underwriting gain or loss to average float, was negative for the last three years, as our insurance business generated underwriting gains in each year.
A summary of cash and investments held in our insurance businesses follows. Amounts are in millions.
| 2010 | 2009 | |||||||
| Cash and cash equivalents |
$ | 24,818 | $ | 18,655 | ||||
| Equity securities |
59,517 | 56,289 | ||||||
| Fixed maturity securities |
32,889 | 35,537 | ||||||
| Other * |
19,133 | 29,240 | ||||||
| $ | 136,357 | $ | 139,721 | |||||
| * | Other investments include the investments in Wrigley, Goldman Sachs, General Electric and Dow. At December 31, 2009, other investments also included our investment in Swiss Re’s 12% convertible capital instrument and our investment in BNSF which was then accounted for under the equity method as previously discussed. |
In 2010, invested assets and policyholder float include amounts related to our life annuity business. In prior years, this business was included in the finance and financial products segment. Amounts for 2009 have been reclassified to conform to the current year presentation.
Fixed maturity investments as of December 31, 2010 were as follows. Amounts are in millions.
| Amortized cost |
Unrealized gains/losses |
Fair value |
||||||||||
| U.S. Treasury, U.S. government corporations and agencies |
$ | 2,151 | $ | 46 | $ | 2,197 | ||||||
| States, municipalities and political subdivisions |
3,356 | 225 | 3,581 | |||||||||
| Foreign governments |
10,909 | 196 | 11,105 | |||||||||
| Corporate bonds, investment grade |
5,400 | 693 | 6,093 | |||||||||
| Corporate bonds, non-investment grade |
5,724 | 1,531 | 7,255 | |||||||||
| Mortgage-backed securities |
2,408 | 250 | 2,658 | |||||||||
| $ | 29,948 | $ | 2,941 | $ | 32,889 | |||||||
As of December 31, 2010, all U.S. government obligations were rated AAA by the major rating agencies and approximately 86% of all state, municipal and political subdivisions, foreign government obligations and mortgage-backed securities were rated AA or higher. Non-investment grade securities represent securities that are rated below BBB- or Baa3.
74
Table of Contents
Management’s Discussion (Continued)
Railroad (“Burlington Northern Santa Fe”)
We acquired control of Burlington Northern Santa Fe Corporation (“BNSF”) on February 12, 2010. BNSF’s revenues and operating results are included in our consolidated results beginning immediately after the acquisition. In 2009 and for the period between January 1, 2010 and February 12, 2010, we accounted for our interest in BNSF pursuant to the equity method. Our share of BNSF’s earnings for those periods is included in net investment income of our insurance group. Earnings of BNSF following the acquisition are summarized below (in millions). BNSF’s earnings for the years ending December 31, 2010 and 2009 are provided for comparison, although these results are not consolidated in our financial statements.
| Feb. 13, 2010 to Dec. 31, 2010 |
2010 | 2009 | ||||||||||
| Revenues |
$ | 15,059 | $ | 16,850 | $ | 14,016 | ||||||
| Operating expenses |
11,013 | 12,355 | 10,762 | |||||||||
| Interest expense |
435 | 507 | 613 | |||||||||
| 11,448 | 12,862 | 11,375 | ||||||||||
| Pre-tax earnings |
3,611 | 3,988 | 2,641 | |||||||||
| Income taxes |
1,376 | 1,529 | 920 | |||||||||
| Net earnings |
$ | 2,235 | $ | 2,459 | $ | 1,721 | ||||||
BNSF operates one of the largest railroad systems in North America with approximately 32,000 route miles of track (including 23,000 route miles owned) in 28 states and two Canadian provinces. BNSF’s major business groups are classified by product shipped and include consumer products, coal, industrial products and agricultural products. The discussion that follows compares BNSF’s results for the years ending December 31, 2010 and 2009.
Revenues for the year ending December 31, 2010 were approximately $16.9 billion, representing an increase of approximately $2.8 billion (20%) over 2009. In 2010, revenues from each of the four business groups increased between 17% to 23% as compared to 2009. The increases reflected increased industrial products, agricultural products, consumer products and coal freight volume as well as overall increased yields. In addition, annual revenues in 2010 included an increase in fuel surcharges of $740 million versus 2009.
Operating expenses in 2010 were $12.4 billion, an increase of $1.6 billion (15%) over 2009, reflecting an increase in costs to handle the increase in freight volume as well as higher fuel and wage costs. Fuel costs increased $644 million in 2010 primarily due to higher prices. Compensation and benefits expense increased $523 million in 2010 primarily due to increased incentive compensation, increased health and welfare expenses and general wage increases. Operating expenses in 2010 also reflected increased depreciation and amortization expense versus 2009.
Utilities and Energy (“MidAmerican”)
Revenues and earnings of MidAmerican are summarized below. Amounts are in millions.
| Revenues | Earnings | |||||||||||||||||||||||
| 2010 | 2009 | 2008 | 2010 | 2009 | 2008 | |||||||||||||||||||
| PacifiCorp |
$ | 4,518 | $ | 4,543 | $ | 4,558 | $ | 783 | $ | 788 | $ | 703 | ||||||||||||
| MidAmerican Energy Company |
3,824 | 3,711 | 4,742 | 279 | 285 | 425 | ||||||||||||||||||
| Natural gas pipelines |
994 | 1,073 | 1,221 | 378 | 457 | 595 | ||||||||||||||||||
| U.K. utilities |
804 | 829 | 1,001 | 333 | 248 | 339 | ||||||||||||||||||
| Real estate brokerage |
1,046 | 1,071 | 1,147 | 42 | 43 | (45 | ) | |||||||||||||||||
| Other |
119 | 216 | 1,302 | 47 | 25 | 1,278 | ||||||||||||||||||
| $ | 11,305 | $ | 11,443 | $ | 13,971 | |||||||||||||||||||
| Earnings before corporate interest and taxes |
1,862 | 1,846 | 3,295 | |||||||||||||||||||||
| Corporate interest |
(323 | ) | (318 | ) | (332 | ) | ||||||||||||||||||
| Interest on Berkshire junior debt |
(30 | ) | (58 | ) | (111 | ) | ||||||||||||||||||
| Income taxes and noncontrolling interests |
(271 | ) | (313 | ) | (1,002 | ) | ||||||||||||||||||
| Net earnings |
$ | 1,238 | $ | 1,157 | $ | 1,850 | ||||||||||||||||||
| Earnings attributable to Berkshire * |
$ | 1,131 | $ | 1,071 | $ | 1,704 | ||||||||||||||||||
| Debt owed to others at December 31 |
19,646 | 19,579 | 19,145 | |||||||||||||||||||||
| Debt owed to Berkshire at December 31 |
165 | 353 | 1,087 | |||||||||||||||||||||
| * | Net of noncontrolling interests and includes interest earned by Berkshire (net of related income taxes). |
75
Table of Contents
Management’s Discussion (Continued)
Utilities and Energy (“MidAmerican”) (Continued)
We hold an 89.8% ownership interest in MidAmerican Energy Holdings Company (“MidAmerican”), which operates an international energy business. MidAmerican’s domestic regulated energy interests are comprised of two regulated utility companies and two interstate natural gas pipeline companies. In the United Kingdom, MidAmerican operates two electricity distribution businesses. The rates that our utilities and natural gas pipelines charge customers for energy and other services are generally subject to regulatory approval. Rates are based in large part on the costs of business operations, including a return on capital. To the extent we are not allowed to include such costs in the approved rates, operating results will be adversely affected. In addition, MidAmerican also operates a diversified portfolio of independent power projects and the second-largest residential real estate brokerage firm in the United States.
Our U.S. based regulated utilities businesses are conducted through PacifiCorp and MidAmerican Energy Company (“MEC”). PacifiCorp’s revenues and earnings before corporate interest and taxes (“EBIT”) in 2010 were $4,518 million and $783 million, respectively, relatively unchanged from 2009. Revenues in 2010 reflected lower average wholesale prices and a decrease in wholesale sales volume of approximately 8%, offset by higher retail prices approved by regulators and higher renewable energy credit sales. PacifiCorp’s EBIT reflected decreased prices of purchased electricity and natural gas and lower natural gas volumes, offset by higher transmission costs from higher contract rates, higher volumes of purchased electricity and higher coal prices. Revenues of MEC in 2010 increased $113 million (3%) over 2009, primarily due to higher volumes of regulated and non-regulated electricity sales which are attributable to higher customer usage, impacted by weather conditions and customer growth. MEC’s EBIT in 2010 was $279 million, a slight decrease compared to 2009, primarily due to higher energy costs, operating expenses and depreciation and amortization. Energy costs increased due to higher coal prices and greater thermal generation as a result of higher sales volume. Operating expenses increased due to higher maintenance costs from plant outages and storm damages.
PacifiCorp’s revenues in 2009 of $4,543 million were relatively unchanged from 2008. Revenues in 2009 reflect an overall decrease in sales volume (both wholesale and retail) of approximately 2% and lower wholesale prices, somewhat offset by higher retail prices approved by regulators and higher renewable energy credit sales. PacifiCorp’s EBIT in 2009 of $788 million increased $85 million (12%) over 2008, primarily due to lower volume and prices of energy purchased in response to lower sales volumes and the use of lower-cost generation facilities put into service in the second half of 2008 and first quarter of 2009. Revenues of MEC in 2009 declined $1,031 million (22%) from 2008, primarily due to lower regulated natural gas and electricity sales. Regulated natural gas revenues decreased by $520 million in 2009, primarily due to a lower average per-unit cost of gas sold, which is passed on to customers and a 5% decline in sales volume. MEC’s regulated electricity revenues declined $315 million primarily as a result of a 35% decline in average wholesale prices and lower volumes, which were attributable to reduced demand due to economic conditions as well as mild temperatures in 2009. MEC’s EBIT in 2009 declined $140 million (33%) compared to 2008, primarily due to the lower regulated electricity revenues and increased depreciation due to additions of new wind-power generation facilities, partially offset by lower costs of purchased electricity and natural gas.
Our natural gas pipeline businesses are conducted through Northern Natural Gas and Kern River. Natural gas pipelines revenues and EBIT each declined $79 million in 2010 from 2009. The declines were primarily due to lower transportation volume resulting from less favorable economic conditions and lower natural gas price spreads. Natural gas pipelines revenues and EBIT in 2009 declined $148 million and $138 million, respectively, from 2008 due primarily to lower volumes due to the economic climate, lower price spreads and the effects of a favorable rate proceeding included in the results for 2008.
U.K. utility revenues decreased $25 million in 2010 from 2009 due to lower contracting revenue and lower gas production, partially offset by higher distribution revenue. The $85 million increase in EBIT is due to the sale of CE Gas (Australia) Limited during 2010 and an impairment of certain assets that was recorded during 2009. U.K. utility revenues in 2009 declined $172 million (17%) versus 2008, principally due to the impact from foreign currency exchange rates as a result of a stronger U.S. Dollar in 2009 as compared with 2008. EBIT of the U.K. utilities in 2009 declined $91 million (27%) compared to 2008. The decline in EBIT reflects foreign currency exchange rate changes as well as higher depreciation expense and charges to write down certain exploration and development assets.
EBIT of the real estate brokerage business of $42 million in 2010 was relatively unchanged as compared to 2009. The real estate brokerage business incurred a loss of $45 million in 2008 that resulted from the weak U.S. housing markets.
EBIT from other activities increased in 2010 as compared to 2009 due primarily to stock-based compensation expense of $125 million in 2009, as a result of MidAmerican’s purchase of common stock upon the exercise of the last remaining stock
76
Table of Contents
Management’s Discussion (Continued)
Utilities and Energy (“MidAmerican”) (Continued)
options that had been granted to certain members of management at the time of Berkshire’s acquisition of MidAmerican in 2000. EBIT from other activities in 2008 includes approximately $1.1 billion related to our investment in Constellation Energy and a related breakup fee we received from Constellation Energy.
Manufacturing, Service and Retailing
A summary of revenues and earnings of our manufacturing, service and retailing businesses follows. Amounts are in millions.
| Revenues | Earnings | |||||||||||||||||||||||
| 2010 | 2009 | 2008 | 2010 | 2009 | 2008 | |||||||||||||||||||
| Marmon |
$ | 5,967 | $ | 5,067 | $ | 5,529 | $ | 813 | $ | 686 | $ | 733 | ||||||||||||
| McLane Company |
32,687 | 31,207 | 29,852 | 369 | 344 | 276 | ||||||||||||||||||
| Other manufacturing |
17,664 | 15,937 | 19,179 | 1,911 | 958 | 1,880 | ||||||||||||||||||
| Other service |
7,355 | 6,585 | 8,435 | 984 | (91 | ) | 971 | |||||||||||||||||
| Retailing |
2,937 | 2,869 | 3,104 | 197 | 161 | 163 | ||||||||||||||||||
| $ | 66,610 | $ | 61,665 | $ | 66,099 | |||||||||||||||||||
| Pre-tax earnings |
$ | 4,274 | $ | 2,058 | $ | 4,023 | ||||||||||||||||||
| Income taxes and noncontrolling interests |
1,812 | 945 | 1,740 | |||||||||||||||||||||
| $ | 2,462 | $ | 1,113 | $ | 2,283 | |||||||||||||||||||
Marmon
We acquired a 60% controlling interest in Marmon Holdings, Inc. (“Marmon”) on March 18, 2008 and as of December 31, 2010 we owned approximately 64% of its outstanding common stock. In the first quarter of 2011, we will acquire additional shares and increase our ownership interest to about 80.2%. Marmon’s revenues, costs and expenses are included in our Consolidated Financial Statements beginning as of the initial acquisition date in 2008. Through Marmon, we operate approximately 130 manufacturing and service businesses that operate independently within eleven diverse business sectors.
Marmon’s revenues in 2010 were $5,967 million, an increase of approximately 18% over 2009. About 40% of the revenues increase was the result of increased copper prices, the cost of which is passed to customers with little or no margin. The balance of the revenues increase in 2010 was associated with a gradual rebound in other sectors as Marmon’s end markets improved from 2009’s low levels. Earnings in 2010 increased $127 million (19%) to $813 million in comparison with 2009. Revenues in 2010 increased in all sectors, except Transportation Services & Engineered Products and Water Treatment sectors. With the exception of Distribution Services, all sectors had improvement in earnings in 2010. Earnings as a percent of revenues were 13.6% in 2010 and 13.5% in 2009. Operating margins in 2010 were negatively impacted by the increase in copper prices. The Transportation Services & Engineered Products and Building Wire sectors had the largest increases in earnings in 2010 compared to 2009. Earnings in 2010 also benefitted from lower interest expense.
Revenues in 2009 declined approximately 27% from 2008 (including periods in 2008 prior to our acquisition). The revenue decline in 2009 reflected the impact of the recession which led to lower customer demand across all sectors, and particularly in the Building Wire, Engineered Wire & Cable, Flow Products and Distribution Services sectors. Pre-tax earnings in 2009 declined approximately 26% from the full year of 2008 which reflects the decline in revenues, somewhat offset by a $160 million reduction in operating costs resulting from cost reduction efforts. In 2009, the Retail Store Fixtures, Food Service Equipment and Water Treatment sectors produced comparable or improved earnings with 2008 despite lower revenues. The remaining sectors experienced lower earnings in 2009 compared to 2008.
McLane Company
Through McLane, we operate a wholesale distribution business that provides grocery and non-food products to retailers, convenience stores and restaurants. McLane’s business is marked by high sales volume and very low profit margins, and the fact that about 30% of its annual revenues are from sales to Wal-Mart. A curtailment of purchasing by Wal-Mart could have a
77
Table of Contents
Management’s Discussion (Continued)
Manufacturing, Service and Retailing (Continued)
McLane Company (Continued)
material adverse impact on McLane’s earnings. In 2010, McLane acquired Empire Distributors, based in Georgia and North Carolina and Horizon Wine and Spirits Inc., based in Tennessee. Empire and Horizon are wholesale distributors of distilled spirits, wine and beer.
McLane’s revenues in 2010 were approximately $32.7 billion, representing an increase of $1.5 billion (5%) over 2009 reflecting an 11% increase in foodservice revenues (driven by increased unit volume) and a relatively minor increase in grocery revenues. Pre-tax earnings in 2010 of $369 million increased $25 million (7%) over 2009. The increase in earnings in 2010 reflected the favorable impact of the Empire and Horizon acquisitions and increased foodservice earnings, partially offset by lower earnings from the grocery unit. Earnings in 2009 included the impact of a substantial inventory price change gain in the grocery unit associated with an increase in federal excise taxes on cigarettes. Many tobacco manufacturers raised prices in anticipation of the tax increase, which allowed McLane to generate a one-time price change gain. The combined gross margin rate in 2010 was 5.75% versus 5.72% in 2009. McLane continues to maintain tight control over operating expenses.
Revenues were $31.2 billion in 2009, an increase of $1.4 billion (5%) compared to 2008. The increase in revenues in 2009 reflected an 8% increase in the grocery business, partially offset by an 11% decline from the foodservice business. The revenue increases in 2009 reflected additional grocery customers as well as manufacturer price increases and state excise tax increases. Pre-tax earnings in 2009 increased $68 million (25%) over 2008. Earnings in 2009 included the impact of the aforementioned inventory price change gain. The comparative increase in earnings in 2009 from the inventory price change gain was partially offset by a related one-time floor stock tax and by lower earnings from the foodservice business. Operating results in 2009 also benefited from lower fuel costs and operating expense control efforts.
Other manufacturing
Our other manufacturing businesses include a wide array of businesses. Included in this group are several manufacturers of building products (Acme Building Brands, Benjamin Moore, Johns Manville, Shaw and MiTek) and apparel (led by Fruit of the Loom which includes the Russell athletic apparel and sporting goods business and the Vanity Fair Brands women’s intimate apparel business). Among other businesses also included in this group are Forest River, a leading manufacturer of leisure vehicles, ISCAR Metalworking Companies (“IMC”), an industry leader in the metal cutting tools business with operations worldwide and CTB International (“CTB”), a manufacturer of equipment for the livestock and agricultural industry.
Revenues from our other manufacturing activities in 2010 were $17.7 billion, an increase of $1.7 billion (11%) over 2009. The increase was primarily due to volume driven revenue increases of Forest River (57%), IMC (41%), CTB (20%) and Johns Manville (12%). These operations rebounded in 2010 from slow business activity in 2009. Despite the increase in revenues by Johns Manville, our building products operations continue to be adversely affected by the overall soft residential and commercial real estate conditions.
Pre-tax earnings of our other manufacturing businesses in 2010 increased $953 million (99%) compared with earnings in 2009. The improvements in earnings in 2010 were driven by significant earnings increases at almost all of our manufacturing businesses, including our apparel and building products businesses. In particular, Fruit of the Loom’s operating results significantly improved primarily due to improved manufacturing efficiencies and cost management efforts. Increased earnings at IMC and Forest River were primarily a result of the aforementioned revenue growth. Overall, our manufacturing businesses benefitted in 2010 from higher customer demand and the impact of their cost containment efforts over the past two years.
Nearly all of the businesses in our manufacturing group experienced the adverse effects of the global economic recession in 2009 as consumers and customers cut purchases. Revenues in 2009 were $15.9 billion, a decrease of $3.2 billion (17%) from 2008. Revenues were lower for apparel (11%), building products (20%) and other businesses (16%) as compared to 2008. Pre-tax earnings of our other manufacturing businesses were $958 million in 2009, a decrease of $922 million (49%) versus 2008. The declines in earnings reflected the lower revenues as well as relatively higher costs resulting from lower manufacturing efficiencies.
Other service
Our other service businesses include NetJets, the world’s leading provider of fractional ownership programs for general aviation aircraft, and FlightSafety, a provider of high technology training to operators of aircraft. Among the other businesses
78
Table of Contents
Management’s Discussion (Continued)
Manufacturing, Service and Retailing (Continued)
Other service (Continued)
also included in this group are: TTI, a leading electronic components distributor; Business Wire, a leading distributor of corporate news, multimedia and regulatory filings; The Pampered Chef, a direct seller of high quality kitchen tools; International Dairy Queen, a licensor and service provider to about 6,000 stores that offer prepared dairy treats and food; The Buffalo News, a publisher of a daily and Sunday newspaper; and businesses that provide management and other services to insurance companies.
In 2010, revenues of our other service businesses were $7.4 billion, an increase of $770 million (12%) compared to 2009. Pre-tax earnings in 2010 were $984 million compared to a loss of $91 million in 2009. The improved results were significantly driven by improved operating results of NetJets and TTI.
In 2010, NetJets’ revenues increased 7% over 2009. The increase was due to higher worldwide flight revenue hours and increased pass through costs, partially offset by lower management fees due to fewer aircraft in the NetJets program. NetJets generated pre-tax earnings of $207 million in 2010 compared to a pre-tax loss of $711 million in 2009, which included $676 million of asset writedowns and other downsizing costs. The asset write downs were primarily related to excess aircraft that have been subsequently sold or are expected to be sold for cash consideration approximating their written down values. Such costs in 2010 were relatively minor. On January 1, 2010, we began charging NetJets a guarantee fee related to the level of its outstanding debt. The guarantee fee was $38 million in 2010. Had a similar fee been charged in 2009, NetJets’ pre-tax loss of $711 million would have increased by $69 million. The improvement in earnings was due to the increase in revenues and to an overall reduction in flight operations and administrative costs, partially offset by higher fuel costs. NetJets continues to own more aircraft than is required for present operations and we expect to continue to dispose of selected aircraft over time. NetJets’ operating cost structure has been reduced to better match customer demand and we believe that NetJets will continue to operate profitably in the future.
In 2010, revenues of TTI increased by approximately 45% over 2009 which was driven by very strong worldwide demand. We primarily attribute the revenue increase to strong consumer demand for electronic products, as well as to manufacturers replenishing depleted raw material inventories. We believe that the current strong market conditions will slow to more normalized levels and as a result, we anticipate that revenues growth will slow significantly from the extraordinary rate experienced in 2010. As a result of the increase in revenues, pre-tax earnings of TTI were significantly higher in 2010 compared to 2009.
Revenues in 2009 were $6.6 billion, a decrease of $1.9 billion (22%) compared to 2008. Substantially all of our service businesses generated lower revenues in 2009 as compared to 2008, particularly at NetJets and to a lesser degree at TTI. In 2009, NetJets’ revenues declined 32% versus 2008 due to a 77% decline in aircraft sales as well as lower flight operations revenues primarily due to a 19% decline in flight revenue hours. Revenues at TTI were 17% lower in 2009 compared to 2008 due to the economic recession. NetJets produced a pre-tax loss in 2009 of $711 million compared to pre-tax earnings of $213 million in 2008. The pre-tax loss at NetJets in 2009 included the aforementioned asset writedowns and other downsizing costs of $676 million compared to $54 million of such charges in 2008. Excluding the results of NetJets, our other service businesses produced pre-tax earnings of $620 million in 2009 compared to pre-tax earnings of $758 million in 2008. The negative impact of the global recession was evident at substantially all of our other service businesses.
Retailing
Our retailing operations consist of four home furnishings businesses (Nebraska Furniture Mart, R.C. Willey, Star Furniture and Jordan’s), three jewelry businesses (Borsheims, Helzberg and Ben Bridge) and See’s Candies. In 2010, revenues were $2.9 billion, an increase of 2% compared to 2009 and pre-tax earnings were $197 million, an increase of 22% compared to 2009. The increase in earnings in 2010 was due to the modest increase in sales and ongoing cost containment efforts. Retailing revenues in 2009 decreased 8% compared to 2008. Pre-tax earnings of $161 million in 2009 were relatively unchanged from 2008. Throughout 2008 as the impact of the economic recession in the U.S. worsened, consumer spending declined and these conditions continued in 2009.
79
Table of Contents
Management’s Discussion (Continued)
Finance and Financial Products
A summary of revenues and earnings from our finance and financial products businesses follows. Amounts are in millions.
| Revenues | Earnings | |||||||||||||||||||||||
| 2010 | 2009 | 2008 | 2010 | 2009 | 2008 | |||||||||||||||||||
| Manufactured housing and finance |
$ | 3,256 | $ | 3,257 | $ | 3,560 | $ | 176 | $ | 187 | $ | 206 | ||||||||||||
| Furniture/transportation equipment leasing |
660 | 661 | 773 | 53 | 14 | 87 | ||||||||||||||||||
| Other |
348 | 383 | 440 | 460 | 452 | 478 | ||||||||||||||||||
| $ | 4,264 | $ | 4,301 | $ | 4,773 | |||||||||||||||||||
| Pre-tax earnings |
689 | 653 | 771 | |||||||||||||||||||||
| Income taxes and noncontrolling interests |
248 | 242 | 302 | |||||||||||||||||||||
| $ | 441 | $ | 411 | $ | 469 | |||||||||||||||||||
Revenues in 2010 from our manufactured housing and finance business (Clayton Homes) of $3.3 billion were relatively unchanged from 2009. Sales of manufactured homes declined approximately $40 million in 2010 versus 2009, reflecting an increase in unit sales of approximately 6% which was more than offset by lower average selling prices primarily attributable to product mix. Unit sales in the first half of 2010 benefitted from the home buyer tax credit, which expired in the second quarter and as a result demand declined over the last half of the year. Interest and finance income increased in 2010 as a result of the adoption of a new accounting pronouncement, which required us to consolidate securitized loan portfolios we originated several years ago.
The operating results of Clayton Homes have been negatively affected by the economic recession as well as the credit crisis. In addition, our manufactured housing programs have been at a competitive disadvantage compared to traditional single family housing markets, which have been receiving significant interest rate subsidies from the U.S. government through government agency insured mortgages. For the most part, these subsidies are not available to factory built homes. As a result, manufactured housing construction, sales and related lending activities have been negatively impacted. Nevertheless, Clayton Homes remains the largest manufactured housing business in the United States and we believe that it will continue to operate profitably, even under the current conditions.
Pre-tax earnings of Clayton Homes in 2010 decreased $11 million (6%) versus 2009. Operating results in 2010 were negatively impacted by reduced earnings from manufactured home sales, partially offset by increased financial services earnings. Installment loan balances were approximately $13.5 billion as of December 31, 2010 (including about $1.3 billion related to securitized loans consolidated in 2010) versus $12.3 billion as of December 31, 2009.
Revenues in 2009 of Clayton Homes declined $303 million (9%) from 2008. The decrease was primarily due to a 16% decline in units sold, partially offset by higher average selling prices and a slight increase in installment loan interest and other investment income. Pre-tax earnings of Clayton Homes were $187 million in 2009, a decline of $19 million (9%) from 2008. Pre-tax earnings in 2009 were negatively impacted by a $79 million increase in estimated loan loss provisions, partially offset by improved margins from manufactured home sales and lower selling, general and administrative expenses arising from cost reduction efforts.
Revenues from our furniture and transportation equipment leasing activities in 2010 were relatively unchanged from 2009. Pre-tax earnings in 2010 were $53 million, an increase of $39 million over 2009. The earnings increase in 2010 was primarily attributable to cost containment efforts as well as improved transportation equipment utilization.
Revenues and pre-tax earnings from our furniture/transportation equipment leasing businesses in 2009 declined $112 million (14%) and $73 million (84%), respectively, compared to 2008. The declines primarily reflected lower rental income driven by relatively low utilization rates for over-the-road trailer and storage units, and lower furniture rentals. Significant cost components of this business are fixed (depreciation and facility expenses), so earnings declined disproportionately to revenues.
Other finance business earnings include investment income generated on fixed maturity and equity investments, including portions of our investments in Goldman Sachs and Wrigley securities as well as revenues and earnings from other miscellaneous activities. In addition, other activities include earnings from internal interest rate spreads charged to Clayton Homes on
80
Table of Contents
Management’s Discussion (Continued)
Finance and Financial Products (Continued)
Berkshire Hathaway Finance Corporation’s (“BHFC”) borrowings ($11.5 billion as of December 31, 2010), which are used in connection with Clayton Homes’ installment lending activities. A corresponding charge is reflected in the manufactured housing and finance earnings. Also included in other finance business activity is the guaranty fee of $38 million that was due from NetJets in 2010. As previously discussed, NetJets recorded a corresponding charge to its 2010 earnings.
Investment and Derivative Gains/Losses
A summary of investment and derivative gains and losses and other-than-temporary impairment losses on investments follows. Amounts are in millions.
| 2010 | 2009 | 2008 | ||||||||||
| Investment gains/losses |
||||||||||||
| Sales and other disposals of investments |
||||||||||||
| Insurance and other |
$ | 3,032 | $ | 277 | $ | 912 | ||||||
| Finance and financial products |
9 | 110 | 6 | |||||||||
| Other-than-temporary impairment losses on investments |
(1,973 | ) | (3,155 | ) | (1,813 | ) | ||||||
| Other |
1,017 | (69 | ) | 255 | ||||||||
| 2,085 | (2,837 | ) | (640 | ) | ||||||||
| Derivative gains/losses |
||||||||||||
| Credit default contracts |
250 | 789 | (1,774 | ) | ||||||||
| Equity index put option contracts |
172 | 2,713 | (5,028 | ) | ||||||||
| Other derivative contracts |
(161 | ) | 122 | (19 | ) | |||||||
| 261 | 3,624 | (6,821 | ) | |||||||||
| Gains/losses before income taxes and noncontrolling interests |
2,346 | 787 | (7,461 | ) | ||||||||
| Income taxes and noncontrolling interests |
472 | 301 | (2,816 | ) | ||||||||
| Net gains/losses |
$ | 1,874 | $ | 486 | $ | (4,645 | ) | |||||
Investment gains or losses are recognized upon the sales of investments or as otherwise required under GAAP. The timing of realized gains or losses from sales can have a material effect on periodic earnings. However, such gains or losses usually have little, if any, impact on total shareholders’ equity because most equity and fixed maturity investments are carried at fair value with any unrealized gains or losses included as components of accumulated other comprehensive income. In 2010, investment gains/losses on sales and other disposals of investments included a $1.3 billion gain with respect to the redemption of the Swiss Re 12% convertible capital instrument and other investment gains/losses included a one-time holding gain of $979 million in connection with our acquisition of BNSF (see Notes 2 and 5).
The recognition of other-than-temporary impairment losses results in reductions in the cost basis of the investments but not a reduction in fair value and the recognition of an other-than-temporary impairment loss has little if any impact on our shareholders’ equity and book value per share. Although we have recorded other-than-temporary impairment losses in earnings in each of the past three years, we continue to hold positions in many of these securities. The recognition of such losses does not necessarily indicate that sales are imminent or planned and sales ultimately may not occur. Furthermore, the recognition of other-than-temporary impairment losses does not necessarily indicate that the loss in value of the security is either permanent or that the market price of the security will not subsequently increase to and ultimately exceed our original cost by a substantial margin.
We collectively consider several factors in determining other-than-temporary impairment losses including the current and expected long-term business prospects of the issuer, our ability and intent to hold the investment until the price recovers and the length of time and relative magnitude of the price decline. We further recognize that stock prices may remain below intrinsic value for a period of time that is deemed excessive. As a result, other-than-temporary impairment losses may be recorded in these instances, even though we may strongly believe that the stock price will recover to at least its original cost and we currently possess the ability and intent to hold the security until, at least, that time.
Other-than-temporary impairment losses recorded in the fourth quarter of 2010 included unrealized losses on individual equity securities of $938 million (determined on a specific identification basis). Such losses averaged about 20% of the original cost of the impaired securities. In each case, the issuer has been profitable in recent periods and in some cases highly profitable.
81
Table of Contents
Management’s Discussion (Continued)
Investment and Derivative Gains/Losses (Continued)
Although we expect that these businesses will continue to remain profitable and that the market prices for these securities will eventually exceed our original cost, we could not establish sufficient objective evidence as to the timing or amount of the future recovery in market prices. We also recorded other-than-temporary impairment losses of about $1.0 billion on certain debt instruments where, after evaluation, we concluded that we would likely not receive all contractual cash flows when due.
Other-than-temporary impairment losses in 2009 predominantly relate to a loss with respect to our investment in ConocoPhillips common stock. The market price of ConocoPhillips shares declined sharply over the last half of 2008. In 2009, we sold over half of the ConocoPhillips position we held at the end of 2008. Sales in 2009 were in anticipation of other investment opportunities, to increase overall liquidity and to realize capital losses that were carried back to prior years for income tax purposes. We continue to hold over 29 million shares of ConocoPhillips and its market price as of December 31, 2010 was about 75% over its market price at the time we recorded the aforementioned other-than-temporary impairment loss. None of the subsequent recovery in the market price of ConocoPhillips currently held is reflected in our net earnings but it is reflected in accumulated other comprehensive income.
Other-than-temporary impairment losses recorded in 2008 were primarily related to investments in twelve equity securities. The unrealized losses in these securities generally ranged from 40% to 90% of cost. After reviewing these investments, we concluded that there was considerable uncertainty in the business prospects of these companies and thus uncertainty on the recoverability of the cost of the security.
Derivative gains/losses primarily represent the changes in fair value of our credit default and equity index put option contracts. Changes in the fair values of these contracts are reflected in earnings and can be significant, reflecting the volatility of equity and credit markets. We have not actively traded into and out of credit default and equity index put option contracts. Under many of the contracts, no settlements will occur until the contract expiration dates, many years from now. We reported pre-tax gains on our credit default contracts of $250 million in 2010, $789 million in 2009 and pre-tax losses of $1.8 billion in 2008. These gains and losses reflect the changes in the fair values of these contracts. The fair values of our credit default contracts are impacted by changes in credit default spreads, which have been volatile from period to period. The gains in 2010 reflected the overall narrowing of credit default spreads for corporate issuers and were somewhat offset by losses due to the widening of spreads for municipalities, particularly in the fourth quarter. There were no credit loss events on our contracts in 2010. The gains and losses from our credit default contracts in 2009 and 2008 derived primarily from changes in the fair value of our liabilities due to a significant widening of credit default spreads of corporate issuers in 2008 and the narrowing of spreads for corporate issuers in 2009. There were several credit loss events in the second half of 2008 and the beginning of 2009, primarily related to contracts involving non-investment grade (or high-yield) corporate issuers and during 2009 we paid losses of about $1.9 billion.
In 2010 and 2009, gains on equity index put option contracts were $172 million and $2.7 billion, respectively compared to losses of $5.0 billion in 2008. In the fourth quarter of 2010, we settled certain equity index put option contracts early at the request of the counterparty. The net gain in 2010 arising from these settled contracts was $561 million, which is represented by the difference between the recorded fair values of the contracts at December 31, 2009 and the settlement payment amounts. Otherwise, we recognized pre-tax losses of $389 million under our remaining equity index put option contracts reflecting generally lower interest rate assumptions and the effect of foreign currency exchange rate changes. The derivative contract gains in 2009 reflected increases in the underlying equity indexes ranging from approximately 19% to 23%, partially offset by the impact of a weaker U.S. Dollar on non-U.S. contracts and lower interest rates. These factors combined to produce a decrease in our estimated liabilities. The losses in 2008 reflected declines of between 30% and 45% in underlying equity indexes. Our ultimate payment obligations, if any, under our remaining equity index put option contracts will be determined as of the contract expiration dates, which begin in 2018. Except for the early settlements referred to previously, there have been no other cash settlements related to these contracts.
Financial Condition
Our balance sheet continues to reflect significant liquidity and a strong capital base. Our consolidated shareholders’ equity at December 31, 2010 was $157.3 billion, an increase of $26.2 billion from December 31, 2009. The increase in our shareholders’ equity included approximately $10.6 billion related to the issuance of Berkshire common stock in connection with the BNSF acquisition.
82
Table of Contents
Management’s Discussion (Continued)
Financial Condition (Continued)
Consolidated cash and investments of insurance and other businesses approximated $147.7 billion at December 31, 2010 including cash and cash equivalents of $34.8 billion. These assets are held predominantly in our insurance businesses. In February 2010, we acquired all of the outstanding shares of BNSF common stock that we did not already own for aggregate consideration of approximately $26.5 billion. The consideration paid included $15.9 billion in cash consisting of $8.0 billion in proceeds from newly issued parent company debt (which included $2.0 billion that matured in February 2011) and $7.9 billion of cash on hand, plus Berkshire Class A and B common stock with an aggregate value of approximately $10.6 billion.
Our railroad, utilities and energy businesses conducted by MidAmerican and BNSF maintain very large investments in property, plant and equipment and will regularly make significant capital expenditures in the normal course of business. Capital expenditures of MidAmerican in 2010 were approximately $2.6 billion. For the period between February 13, 2010 and December 31, 2010, BNSF’s capital expenditures were approximately $2.3 billion, including additions to other assets. MidAmerican’s forecasted capital expenditures for 2011 are approximately $3.1 billion. BNSF’s forecasted capital expenditures and commitments for 2011 are approximately $3.5 billion. Future capital expenditures are expected to be funded from cash flows from operations and debt proceeds. Aggregate borrowings of the railroad, utilities and energy businesses were about $31.6 billion as of December 31, 2010, including $12.0 billion of borrowings of BNSF. BNSF, MidAmerican, and their operating subsidiaries have debt and capital lease maturities in 2011 of approximately $2.2 billion. Berkshire has committed until February 28, 2011 to provide up to $3.5 billion of additional capital to MidAmerican to permit the repayment of its debt obligations or to fund its regulated utility subsidiaries. In 2010, the commitment was amended to extend the term of the commitment to February 28, 2014 and to reduce the commitment to $2 billion beginning on March 1, 2011. Berkshire does not intend to guarantee the repayment of debt by BNSF, MidAmerican or any of their subsidiaries.
Assets of the finance and financial products businesses, which consisted primarily of loans and finance receivables, fixed maturity securities, other investments and cash and cash equivalents, were approximately $25.7 billion as of December 31, 2010 and $25.1 billion at December 31, 2009. Liabilities were approximately $24.0 billion as of December 31, 2010 and 2009. As of December 31, 2010, notes payable and other borrowings of $14.5 billion included approximately $11.5 billion par amount of notes issued by BHFC. In 2010, BHFC issued at various dates, notes with aggregate par amounts of $1.5 billion and repaid maturing notes with aggregate par amounts of $2.0 billion. In January 2011, BHFC issued an additional $1.5 billion of notes and repaid $1.5 billion of maturing notes. BHFC notes are unsecured and mature at various dates from 2011 to 2040. The proceeds from the BHFC notes are used to finance originated and acquired loans of Clayton Homes. The full and timely payment of principal and interest on the BHFC notes is guaranteed by Berkshire. Other debt of our finance and financial products businesses increased in 2010 by approximately $1.2 billion to $2.9 billion primarily due to the adoption of ASU 2009-16 and ASU 2009-17, which eliminated the concept of qualifying special purpose entities (“QSPE’s”) and the exemption of QSPE’s from previous consolidation guidance and which amended the standards related to consolidation of variable interest entities. See Note 1(t) and 14 to the Consolidated Financial Statements.
During 2008 and continuing into the first part of 2009, access to credit markets became limited as a consequence of a worldwide credit crisis. However, management believes that the credit crisis has abated and as a result, interest rates for investment grade issuers relative to government obligations have declined. Nevertheless, restricted access to credit markets at affordable rates in the future could have a significant negative impact on our operations, particularly the railroad, utilities and energy and the finance and financial products operations. On July 21, 2010, President Obama signed into law financial regulatory reform legislation, known as the Dodd-Frank Wall Street Reform and Consumer Protection Act (the “Reform Act”). The Reform Act reshapes financial regulations in the United States by creating new regulators, regulating new markets and firms, and providing new enforcement powers to regulators. Virtually all major areas of the Reform Act will be subject to regulatory interpretation and implementation rules requiring rulemaking that may take several years to complete.
We are party to several equity put option and credit default contracts as described in Note 11 to the Consolidated Financial Statements. With limited exception, these contracts contain no collateral posting requirements under any circumstances, including changes in either the fair value or intrinsic value of the contracts or a downgrade in Berkshire’s credit ratings. Substantially all of these contracts were entered into prior to December 31, 2008. At December 31, 2010, the net liabilities recorded for such contracts were approximately $8.0 billion and our collateral posting requirements were $31 million. With respect to such collateral requirements, we receive the income attributable to such collateral or, in certain instances, interest credit from the counterparty. Although the ultimate outcome of the regulatory rulemaking proceedings described in the preceding paragraph cannot be predicted with certainty, we do not believe that the provisions of the Reform Act that concern collateral requirements apply to derivatives contracts that were entered into prior to the enactment of the Reform Act, as ours
83
Table of Contents
Management’s Discussion (Continued)
Financial Condition (Continued)
were. As such, although the Reform Act may affect some of our business activities, it is not expected to have a material impact on our consolidated financial results or financial condition.
Contractual Obligations
We are party to contracts associated with ongoing business and financing activities, which will result in cash payments to counterparties in future periods. Certain obligations reflected in our Consolidated Balance Sheets, such as notes payable, require future payments on contractually specified dates and in fixed and determinable amounts. Other obligations pertain to the acquisition of goods or services in the future, which are not currently reflected in the financial statements, such as minimum rentals under operating leases. Such obligations will be reflected in future periods as the goods are delivered or services provided. Amounts due as of the balance sheet date for purchases where the goods and services have been received and a liability incurred are not included to the extent that such amounts are due within one year of the balance sheet date.
The timing and/or amount of the payments of other obligations are contingent upon the outcome of future events. Actual payments will likely vary, perhaps significantly, from estimates reflected in our Consolidated Balance Sheet. The timing and amount of payments arising under property and casualty insurance and derivative contract obligations which are reported in other in the table below are contingent upon the outcome of claim settlement activities that will occur over many years. Obligations arising under life, annuity and health insurance benefits are estimated based on assumptions as to future premium payments, allowances, mortality, morbidity, expenses and policy lapse rates. The amounts presented in the following table are based on the liability estimates reflected in our Consolidated Balance Sheet as of December 31, 2010. Although certain insurance losses and loss adjustment expenses and life, annuity and health benefits are ceded to and recoverable from others under reinsurance contracts, such recoverables are not reflected in the table below.
A summary of contractual obligations as of December 31, 2010 follows. Amounts are in millions.
| Estimated payments due by period | ||||||||||||||||||||
| Total | 2011 | 2012-2013 | 2014-2015 | After 2015 | ||||||||||||||||
| Notes payable and other borrowings (1) |
$ | 91,947 | $ | 10,689 | $ | 18,846 | $ | 10,191 | $ | 52,221 | ||||||||||
| Operating leases |
9,121 | 1,156 | 1,953 | 1,556 | 4,456 | |||||||||||||||
| Purchase obligations |
34,906 | 9,816 | 8,640 | 5,619 | 10,831 | |||||||||||||||
| Losses and loss adjustment expenses (2) |
62,344 | 13,540 | 14,097 | 7,917 | 26,790 | |||||||||||||||
| Life, annuity and health insurance benefits (3) |
12,849 | 1,266 | (404 | ) | (404 | ) | 12,391 | |||||||||||||
| Other |
21,257 | 2,874 | 3,301 | 1,516 | 13,566 | |||||||||||||||
| Total |
$ | 232,424 | $ | 39,341 | $ | 46,433 | $ | 26,395 | $ | 120,255 | ||||||||||
| (1) | Includes interest. |
| (2) | Before reserve discounts of $2,269 million. |
| (3) | Amounts represent estimated undiscounted benefit obligations net of estimated future premiums. |
Critical Accounting Policies
Certain accounting policies require us to make estimates and judgments that affect the amounts reflected in the Consolidated Financial Statements. Such estimates are necessarily based on assumptions about numerous factors involving varying, and possibly significant, degrees of judgment and uncertainty. Accordingly, certain amounts currently recorded in the financial statements, with the benefit of hindsight, will likely be adjusted in the future based on additional information made available and changes in other facts and circumstances.
84
Table of Contents
Management’s Discussion (Continued)
Property and casualty losses
A summary of our consolidated liabilities for unpaid property and casualty losses is presented in the table below. Except for certain workers’ compensation reserves, liabilities for unpaid property and casualty losses (referred to in this section as “gross unpaid losses”) are reflected in the Consolidated Balance Sheets without discounting for time value, regardless of the length of the claim-tail. Amounts are in millions.
| Gross unpaid losses | Net unpaid losses * | |||||||||||||||
| Dec. 31, 2010 | Dec. 31, 2009 | Dec. 31, 2010 | Dec. 31, 2009 | |||||||||||||
| GEICO |
$ | 9,376 | $ | 8,561 | $ | 8,928 | $ | 8,211 | ||||||||
| General Re |
16,425 | 17,594 | 15,690 | 16,170 | ||||||||||||
| BHRG |
29,124 | 28,109 | 24,422 | 23,150 | ||||||||||||
| Berkshire Hathaway Primary Group |
5,150 | 5,152 | 4,802 | 4,774 | ||||||||||||
| Total |
$ | 60,075 | $ | 59,416 | $ | 53,842 | $ | 52,305 | ||||||||
| * | Net of reinsurance recoverable and deferred charges on reinsurance assumed and before foreign currency translation effects. |
We record liabilities for unpaid losses and loss adjustment expenses under property and casualty insurance and reinsurance contracts based upon estimates of the ultimate amounts payable under the contracts with respect to losses occurring on or before the balance sheet date. The timing and amount of loss payments is subject to a great degree of variability and is contingent upon, among other things, the timing of claim reporting from insureds and cedants and the determination of the ultimate amount through the loss adjustment process. A variety of techniques are used in establishing the liabilities for unpaid losses. Regardless of the techniques used, significant judgments and assumptions are necessary in projecting the ultimate amounts payable in the future. As a result, uncertainties are imbedded in and permeate the actuarial loss reserving techniques and processes used.
As of any balance sheet date, not all claims that have occurred have been reported and not all reported claims have been settled. Loss and loss adjustment expense reserves include provisions for reported claims (referred to as “case reserves”) and for claims that have not been reported (referred to as incurred but not yet reported (“IBNR”) reserves). The time period between the loss occurrence date and settlement payment date is referred to as the “claim-tail.” Property claims usually have fairly short claim-tails and, absent litigation, are reported and settled within a few years of occurrence. Casualty losses usually have very long claim-tails, occasionally extending for decades. Casualty claims are more susceptible to litigation and can be significantly affected by changing contract interpretations. The legal environment further contributes to extending claim-tails.
Receivables are recorded with respect to losses ceded to other reinsurers and are estimated in a manner similar to liabilities for insurance losses. In addition to the factors cited above, reinsurance recoverables may ultimately prove to be uncollectible if the reinsurer is unable to perform under the contract. Reinsurance contracts do not relieve the ceding company of its obligations to indemnify its own policyholders.
We utilize loss reserving techniques that are believed to best fit the particular business. Additional information regarding reserving processes of our significant insurance businesses (GEICO, General Re and BHRG) follows.
GEICO
GEICO’s gross unpaid losses and loss adjustment expense reserves as of December 31, 2010 were $9.4 billion. Gross reserves included $6.8 billion of reported average, case and case development reserves and $2.6 billion of IBNR reserves. GEICO predominantly writes private passenger auto insurance which has a relatively short claim-tail. The key assumptions affecting the setting of our reserves include projections of ultimate claim counts (“frequency”) and average loss per claim (“severity”), which includes loss adjustment expenses.
Our reserving methodologies produce reserve estimates based upon the individual claims (or a “ground-up” approach), which yields an aggregate estimate of the ultimate losses and loss adjustment expenses. Ranges of loss estimates are not determined in the aggregate.
Our actuaries establish and evaluate unpaid loss reserves using recognized standard actuarial loss development methods and techniques. The significant reserve components (and percentage of gross reserves as of December 31, 2010) are: (1) average reserves (15%), (2) case and case development reserves (60%) and (3) IBNR reserves (25%). Each component of loss reserves
85
Table of Contents
Management’s Discussion (Continued)
Property and casualty losses (Continued)
GEICO (Continued)
is affected by the expected frequency and average severity of claims. Such amounts are analyzed using statistical techniques on historical claims data and adjusted when appropriate to reflect perceived changes in loss patterns. Data is analyzed by policy coverage, rated state, reporting date and occurrence date, among other factors. A brief discussion of each reserve component follows.
We establish average reserve amounts for reported auto damage claims and new liability claims prior to the development of an individual case reserve. The average reserves are intended to represent a reasonable estimate for incurred claims for which our claims adjusters have insufficient time and information to make specific claim estimates and for a large number of minor physical damage claims that are paid within a relatively short time after being reported. Average reserve amounts are driven by the estimated average severity per claim and the number of new claims opened.
Our claims adjusters generally establish individual liability claim case loss and loss adjustment expense reserve estimates as soon as the specific facts and merits of each claim can be evaluated. Case reserves represent the amounts that in the judgment of the adjusters are reasonably expected to be paid in the future to completely settle the claim, including expenses. Individual case reserves are revised as more information becomes known.
For most liability coverages, case reserves alone are an insufficient measure of the ultimate cost due in part to the longer claim-tail, the greater chance of protracted litigation and the incompleteness of facts available at the time the case reserve is established. Therefore, we establish additional case development reserve estimates, which are usually percentages of the case reserve. As of December 31, 2010, case development reserves averaged approximately 25% of total established case reserves. In general, case development factors are selected by a retrospective analysis of the overall adequacy of historical case reserves. Case development factors are reviewed and revised periodically.
For unreported claims, IBNR reserve estimates are calculated by first projecting the ultimate number of claims expected (reported and unreported) for each significant coverage by using historical quarterly and monthly claim counts to develop age-to-age projections of the ultimate counts by accident quarter. Reported claims are subtracted from the ultimate claim projections to produce an estimate of the number of unreported claims. The number of unreported claims is multiplied by an estimate of the average cost per unreported claim to produce the IBNR reserve amount. Actuarial techniques are difficult to apply reliably in certain situations, such as to new legal precedents, class action suits or recent catastrophes. Consequently, supplemental IBNR reserves for these types of events may be established through the collaborative effort of actuarial, claims and other management.
For each significant coverage, we test the adequacy of the total loss reserves using one or more actuarial projections based on claim closure models, paid loss triangles and incurred loss triangles. Each type of projection analyzes loss occurrence data for claims occurring in a given period and projects the ultimate cost.
Loss reserve estimates recorded at the end of 2009 developed downward by $507 million when reevaluated through December 31, 2010, producing a corresponding increase to pre-tax earnings in 2010. These downward reserve developments represented approximately 3.6% of earned premiums in 2010 and approximately 5.9% of the prior year-end reserve amount. Reserving assumptions at December 31, 2010 were modified appropriately to reflect the most recent frequency and severity results. Future reserve development will depend on whether actual frequency and severity are more or less than anticipated.
Within the automobile line of business, reserves for liability coverages are more uncertain due to the longer claim-tails. Approximately 90% of GEICO’s reserves as of December 31, 2010 were for automobile liability, of which bodily injury (“BI”) coverage accounted for approximately 55%. We believe it is reasonably possible that the average BI severity will change by at least one percentage point from the severity used. If actual BI severity changes one percentage point from what was used in establishing the reserves, our reserves would develop up or down by approximately $132 million resulting in a corresponding decrease or increase in pre-tax earnings. Many of the same economic forces that would likely cause BI severity to be different from expected would likely also cause severities for other injury coverages to differ in the same direction.
Our exposure at GEICO to highly uncertain losses is believed to be limited to certain commercial excess umbrella policies written during a period from 1981 to 1984. Remaining reserves associated with such exposure are currently a relatively insignificant component of GEICO’s total reserves (approximately 2.1%) and there is minimal apparent asbestos or environmental liability exposure. Related claim activity over the past year was insignificant.
86
Table of Contents
Management’s Discussion (Continued)
Property and casualty losses (Continued)
General Re and BHRG
Property and casualty loss reserves of our General Re and BHRG underwriting units derive primarily from assumed reinsurance. Additional uncertainties are unique to loss reserving processes for reinsurance. The nature, extent, timing and perceived reliability of information received from ceding companies varies widely depending on the type of coverage, the contractual reporting terms (which are affected by market conditions and practices) and other factors. Due to the lack of standardization of contract terms and conditions, the wide variability of coverage needs of individual clients and the tendency for those needs to change rapidly in response to market conditions, the ongoing economic impact of such uncertainties, in and of themselves, cannot be reliably measured.
The nature and extent of loss information provided under many facultative, per occurrence excess or retroactive contracts may not differ significantly from the information received under a primary insurance contract. This occurs when company personnel either work closely with the ceding company in settling individual claims or manage the claims themselves. However, loss information from aggregate excess-of-loss contracts, including catastrophe losses and quota-share treaties, is often less detailed. Occasionally, loss information is reported in a summary format rather than on an individual claim basis. Loss data is usually provided through periodic reports and may include the amount of ceded losses paid where reimbursement is sought as well as case loss reserve estimates. Ceding companies infrequently provide IBNR estimates to reinsurers.
Each of our reinsurance businesses has established practices to identify and gather needed information from clients. These practices include, for example, comparison of expected premiums to reported premiums to help identify delinquent client reports and claim reviews to facilitate loss reporting and identify inaccurate or incomplete claim reporting. These practices are periodically evaluated and changed as conditions, risk factors and unanticipated areas of exposures are identified.
The timing of claim reporting to reinsurers is delayed in comparison with primary insurance. In some instances there are multiple reinsurers assuming and ceding parts of an underlying risk causing multiple contractual intermediaries between us and the primary insured. In these instances, the delays in reporting can be compounded. The relative impact of reporting delays on the reinsurer varies depending on the type of coverage, contractual reporting terms and other factors. Contracts covering casualty losses on a per occurrence excess basis may experience longer delays in reporting due to the length of the claim-tail as regards to the underlying claim. In addition, ceding companies may not report claims to the reinsurer until they believe it is reasonably possible that the reinsurer will be affected, usually determined as a function of its estimate of the claim amount as a percentage of the reinsurance contract retention. However, the timing of reporting large per occurrence excess property losses or property catastrophe losses may not vary significantly from primary insurance.
Under contracts where periodic premium and claims reports are required from ceding companies, such reports are generally required at quarterly intervals which in the U.S. range from 30 to 90 days after the end of the accounting period. Outside the U.S., reinsurance reporting practices vary. In certain countries clients report annually, often 90 to 180 days after the end of the annual period. The different client reporting practices generally do not result in a significant increase in risk or uncertainty as the actuarial reserving methodologies are adjusted to compensate for the delays.
Premium and loss data is provided to us through at least one intermediary (the primary insurer), so there is a risk that the loss data provided is incomplete, inaccurate or the claim is outside the coverage terms. Information provided by ceding companies is reviewed for completeness and compliance with the contract terms. Reinsurance contracts generally allow us to have access to the cedant’s books and records with respect to the subject business and provide us the ability to conduct audits to determine the accuracy and completeness of information. Audits are conducted as we deem them appropriate.
In the normal course of business, disputes with clients occasionally arise concerning whether certain claims are covered under our reinsurance policies. We resolve most coverage disputes through the involvement of our claims department personnel and the appropriate client personnel or by independent outside counsel. If disputes cannot be resolved, our contracts generally specify whether arbitration, litigation, or alternative dispute resolution will be invoked. There are no coverage disputes at this time for which an adverse resolution would likely have a material impact on our consolidated results of operations or financial condition.
In summary, the scope, number and potential variability of assumptions required in estimating ultimate losses from reinsurance contracts are more uncertain than primary property and casualty insurance due to the factors previously discussed.
87
Table of Contents
Management’s Discussion (Continued)
Property and casualty losses (Continued)
General Re
General Re’s gross and net unpaid losses and loss adjustment expenses and gross reserves by major line of business as of December 31, 2010 are summarized below. Amounts are in millions.
| Type |
Line of business |
|||||||||
| Reported case reserves |
$ | 8,516 | Workers’ compensation (1) |
$ | 3,049 | |||||
| IBNR reserves |
7,909 | Professional liability (2) |
946 | |||||||
| Gross reserves |
16,425 | Mass tort-asbestos/environmental |
1,677 | |||||||
| Ceded reserves and deferred charges |
(735 | ) | Auto liability |
3,059 | ||||||
| Net reserves |
$ | 15,690 | Other casualty (3) |
2,482 | ||||||
| Other general liability |
2,651 | |||||||||
| Property |
2,561 | |||||||||
| Total |
$ | 16,425 | ||||||||
| (1) | Net of discounts of $2,269 million. |
| (2) | Includes directors and officers and errors and omissions coverage. |
| (3) | Includes medical malpractice and umbrella coverage. |
The discussion that follows describes our process of establishing loss reserve estimates at General Re. Our loss reserve estimation process is based upon a ground-up approach, beginning with case estimates and supplemented by additional case reserves (“ACRs”) and IBNR reserves. Critical judgments in establishing loss reserves involve the establishment of ACRs by claim examiners, the expectation of ultimate loss ratios which drive IBNR reserve amounts and comparison of case reserve reporting trends to the expected loss reporting patterns. Recorded reserve amounts are subject to “tail risk” where reported losses develop beyond the maximum expected loss emergence pattern time period.
We do not routinely determine loss reserve ranges because we believe that the techniques necessary to make such determinations have not sufficiently developed and that the myriad of assumptions required render such resulting ranges to be unreliable. In addition, counts of claims or average amounts per claim are not utilized because clients do not consistently provide reliable data in sufficient detail.
Upon notification of a reinsurance claim from a ceding company, our claim examiners make independent evaluations of loss amounts. In some cases, examiners’ estimates differ from amounts reported by ceding companies. If the examiners’ estimates are significantly greater than the ceding company’s estimates, the claims are further investigated. If deemed appropriate, ACRs are established above the amount reported by the ceding company. As of December 31, 2010, ACRs aggregated approximately $2.7 billion before discounts and were concentrated in workers’ compensation reserves, and to a lesser extent in professional liability reserves. Our examiners also periodically conduct detailed claim reviews of individual clients and case reserves are often increased as a result. In 2010, we conducted 314 claim reviews.
Our actuaries classify all loss and premium data into segments (“reserve cells”) primarily based on product (e.g., treaty, facultative and program) and line of business (e.g., auto liability, property, etc.). For each reserve cell, premiums and losses are aggregated by accident year, policy year or underwriting year (depending on client reporting practices) and analyzed over time. We internally refer to these loss aggregations as loss triangles, which serve as the primary basis for our IBNR reserve calculations. We review over 300 reserve cells for our North American business and approximately 900 reserve cells with respect to our international business.
We use loss triangles to determine the expected case loss emergence patterns for most coverages and, in conjunction with expected loss ratios by accident year, loss triangles are further used to determine IBNR reserves. While additional calculations form the basis for estimating the expected loss emergence pattern, the determination of the expected loss emergence pattern is not strictly a mechanical process. In instances where the historical loss data is insufficient, we use estimation formulas along with reliance on other loss triangles and judgment. Factors affecting our loss development triangles include but are not limited to the following: changes in client claims practices, changes in claim examiners’ use of ACRs or the frequency of client company claim reviews, changes in policy terms and coverage (such as client loss retention levels and occurrence and aggregate
88
Table of Contents
Management’s Discussion (Continued)
Property and casualty losses (Continued)
General Re (Continued)
policy limits), changes in loss trends and changes in legal trends that result in unanticipated losses, as well as other sources of statistical variability. Collectively, these factors influence the selection of the expected loss emergence patterns.
We select expected loss ratios by reserve cell, by accident year, based upon reviewing forecasted losses and indicated ultimate loss ratios that are predicted from aggregated pricing statistics. Indicated ultimate loss ratios are calculated using the selected loss emergence pattern, reported losses and earned premium. If the selected emergence pattern is not accurate, then the indicated ultimate loss ratios may not be accurate, which can affect the selected loss ratios and hence the IBNR reserve. As with selected loss emergence patterns, selecting expected loss ratios is not a strictly mechanical process and judgment is used in the analysis of indicated ultimate loss ratios and department pricing loss ratios.
We estimate IBNR reserves by reserve cell, by accident year, using the expected loss emergence patterns and the expected loss ratios. The expected loss emergence patterns and expected loss ratios are the critical IBNR reserving assumptions and are updated annually. Once the annual IBNR reserves are determined, our actuaries calculate expected case loss emergence for the upcoming calendar year. These calculations do not involve new assumptions and use the prior year-end expected loss emergence patterns and expected loss ratios. The expected losses are then allocated into interim estimates that are compared to actual reported losses in the subsequent year. This comparison provides a test of the adequacy of prior year-end IBNR reserves and forms the basis for possibly changing IBNR reserve assumptions during the course of the year.
In 2010, for prior years’ workers’ compensation losses, our reported claims were less than expected claims by $148 million. However, further analysis of the workers’ compensation reserve cells by segment indicated the need for additional IBNR. These developments precipitated $123 million of a net increase in nominal IBNR reserve estimates for unreported occurrences. After deducting $123 million for the change in net reserve discounts during the year, the net increase in workers’ compensation losses from prior years’ occurrences reduced pre-tax earnings in 2010 by $98 million. To illustrate the sensitivity of changes in expected loss emergence patterns and expected loss ratios for our significant excess-of-loss workers’ compensation reserve cells, an increase of ten points in the tail of the expected emergence pattern and an increase of ten percent in the expected loss ratios would produce a net increase in our nominal IBNR reserves of approximately $723 million and $377 million on a discounted basis as of December 31, 2010. The increase in discounted reserves would produce a corresponding decrease in pre-tax earnings. We believe it is reasonably possible for the tail of the expected loss emergence patterns and expected loss ratios to increase at these rates.
Our other casualty and general liability reported losses (excluding mass tort losses) developed downwards in 2010 relative to expectations. Casualty losses tend to be long-tail and it should not be assumed that favorable loss experience in a given year means that loss reserve amounts currently established will continue to develop favorably. For our significant other casualty and general liability reserve cells (including medical malpractice, umbrella, auto and general liability), an increase of five points in the tails of the expected emergence patterns and an increase of five percent in expected loss ratios (one percent for large international proportional reserve cells) would produce a net increase in our nominal IBNR reserves and a corresponding reduction in pre-tax earnings of approximately $902 million. We believe it is reasonably possible for the tail of the expected loss emergence patterns and expected loss ratios to increase at these rates in any of the individual aforementioned reserve cells. However, given the diversification in worldwide business, more likely outcomes are believed to be less than $902 million.
Our property losses were lower than expected in 2010 but the nature of property loss experience tends to be more volatile because of the effect of catastrophes and large individual property losses. In response to favorable claim developments and another year of information, estimated remaining World Trade Center losses were reduced by $17 million.
In certain reserve cells within excess directors and officers and errors and omissions (“D&O and E&O”) coverages, IBNR reserves are based on estimated ultimate losses without consideration of expected emergence patterns. These cells often involve a spike in loss activity arising from recent industry developments making it difficult to select an expected loss emergence pattern. For our large D&O and E&O reserve cells an increase of ten points in the tail of the expected emergence pattern (for those cells where emergence patterns are considered) and an increase of ten percent in the expected loss ratios would produce a net increase in nominal IBNR reserves and a corresponding reduction in pre-tax earnings of approximately $190 million. We believe it is reasonably possible for the tail of the expected loss emergence patterns and expected loss ratios to increase at these rates.
89
Table of Contents
Management’s Discussion (Continued)
Property and casualty losses (Continued)
General Re (Continued)
Overall industry-wide loss experience data and informed judgment are used when internal loss data is of limited reliability, such as in setting the estimates for mass tort, asbestos and hazardous waste (collectively, “mass tort”) claims. Unpaid mass tort reserves at December 31, 2010 and 2009 were approximately $1.7 billion gross and $1.3 billion net of reinsurance. Mass tort net claims paid were about $89 million in 2010. In 2010, ultimate loss estimates for asbestos and environmental claims were increased by $70 million. In addition to the previously described methodologies, we consider “survival ratios” based on net claim payments in recent years versus net unpaid losses as a rough guide to reserve adequacy. The survival ratio based on claim payments made over the last three years was approximately 14 years as of December 31, 2010. The reinsurance industry’s comparable survival ratio for asbestos and pollution reserves was approximately 10 years. Estimating mass tort losses is very difficult due to the changing legal environment. Although such reserves are believed to be adequate, significant reserve increases may be required in the future if new exposures or claimants are identified, new claims are reported or new theories of liability emerge.
BHRG
BHRG’s unpaid losses and loss adjustment expenses as of December 31, 2010 are summarized as follows. Amounts are in millions.
| Property | Casualty | Total | ||||||||||
| Reported case reserves |
$ | 1,456 | $ | 2,791 | $ | 4,247 | ||||||
| IBNR reserves |
2,253 | 3,904 | 6,157 | |||||||||
| Retroactive |
— | 18,720 | 18,720 | |||||||||
| Gross reserves |
$ | 3,709 | $ | 25,415 | 29,124 | |||||||
| Deferred charges and ceded reserves |
(4,702 | ) | ||||||||||
| Net reserves |
$ | 24,422 | ||||||||||
In general, the methodologies we use to establish loss reserves vary widely and encompass many of the common methodologies employed in the actuarial field today. Certain traditional methodologies such as paid and incurred loss development techniques, incurred and paid loss Bornhuetter-Ferguson techniques and frequency and severity techniques are utilized as well as ground-up techniques where appropriate. Additional judgments must also be employed to consider changes in contract conditions and terms as well as the incidence of litigation or legal and regulatory change.
As of December 31, 2010, our gross loss reserves related to retroactive reinsurance policies were predominately for casualty or liability losses. Our retroactive policies include excess-of-loss contracts, in which losses (relating to loss events occurring before a specified date on or before the contract date) above a contractual retention are indemnified or contracts that indemnify all losses paid by the counterparty after the policy effective date. We paid retroactive reinsurance losses and loss adjustment expenses of approximately $1.8 billion in 2010. The classification “reported case reserves” has no practical analytical value with respect to retroactive policies since the amount is often derived from reports in bulk from ceding companies, who may have inconsistent definitions of “case reserves.” We review and establish loss reserve estimates, including estimates of IBNR reserves, in the aggregate by contract.
In establishing retroactive reinsurance reserves, we often analyze historical aggregate loss payment patterns and project losses into the future under various scenarios. The claim-tail is expected to be very long for many policies and may last several decades. We assign judgmental probability factors to these aggregate loss payment scenarios and an expectancy outcome is determined. We monitor claim payment activity and review ceding company reports and other information concerning the underlying losses. Since the claim-tail is expected to be very long for such contracts, we reassess expected ultimate losses as significant events related to the underlying losses are reported or revealed during the monitoring and review process. During 2010, retroactive reserves developed downward by $191 million.
BHRG’s liabilities for environmental, asbestos and latent injury losses and loss adjustment expenses were approximately $10.7 billion at December 31, 2010 and $9.1 billion at December 31, 2009 and were concentrated within retroactive reinsurance
90
Table of Contents
Management’s Discussion (Continued)
Property and casualty losses (Continued)
BHRG (Continued)
contracts. We paid losses in 2010 attributable to these exposures of approximately $800 million. BHRG, as a reinsurer, does not regularly receive reliable information regarding asbestos, environmental and latent injury claims from all ceding companies on a consistent basis, particularly with respect to multi-line treaty or aggregate excess-of-loss policies. Periodically, we conduct a ground-up analysis of the underlying loss data of the reinsured to make an estimate of ultimate reinsured losses. When detailed loss information is unavailable, our estimates can only be developed by applying recent industry trends and projections to aggregate client data. Judgments in these areas necessarily include the stability of the legal and regulatory environment under which these claims will be adjudicated. Potential legal reform and legislation could also have a significant impact on establishing loss reserves for mass tort claims in the future.
The maximum losses payable under our retroactive policies is not expected to exceed approximately $32 billion as of December 31, 2010. Absent significant judicial or legislative changes affecting asbestos, environmental or latent injury exposures, we currently believe it unlikely that gross unpaid losses as of December 31, 2010 ($18.7 billion) will develop upward to the maximum loss payable or downward by more than 15%.
A significant number of our reinsurance contracts are expected to have a low frequency of claim occurrence combined with a potential for high severity of claims. These include property losses from catastrophes, terrorism and aviation risks under catastrophe and individual risk contracts. Loss reserves related to catastrophe and individual risk contracts were approximately $1.3 billion at December 31, 2010, an increase of about $200 million from December 31, 2009. Loss reserves for prior years’ events declined by approximately $190 million in 2010, which produced a corresponding increase to pre-tax earnings. Reserving techniques for catastrophe and individual risk contracts generally rely more on a per-policy assessment of the ultimate cost associated with the individual loss event rather than with an analysis of the historical development patterns of past losses. Catastrophe loss reserves are provided when it is probable that an insured loss has occurred and the amount can be reasonably estimated. Absent litigation affecting the interpretation of coverage terms, the expected claim-tail is relatively short and thus the estimation error in the initial reserve estimates usually emerges within 24 months after the loss event.
Other reinsurance reserve amounts are generally based upon loss estimates reported by ceding companies and IBNR reserves that are primarily a function of reported losses from ceding companies and anticipated loss ratios established on an individual contract basis, supplemented by management’s judgment of the impact on each contract of major catastrophe events as they become known. Anticipated loss ratios are based upon management’s judgment considering the type of business covered, analysis of each ceding company’s loss history and evaluation of that portion of the underlying contracts underwritten by each ceding company, which are in turn ceded to BHRG. A range of reserve amounts as a result of changes in underlying assumptions is not prepared.
Derivative contract liabilities
Our Consolidated Balance Sheets include significant amounts of derivative contract liabilities that are measured at fair value. Our significant derivative contract exposures are concentrated in credit default and equity index put option contracts. These contracts were primarily entered into in over-the-counter markets and certain elements in the terms and conditions of such contracts are not standardized and are highly illiquid. In particular, we are not required to post collateral under most of our contracts. Furthermore, there is no source of independent data available to us showing trading volume and actual prices of completed transactions. As a result, the values of these liabilities are primarily based on valuation models, discounted cash flow models or other valuation techniques that are believed to be used by market participants. Such models or other valuation techniques may use inputs that are observable in the marketplace, while others are unobservable. Unobservable inputs require us to make certain projections and assumptions about the information that would be used by market participants in establishing prices. Considerable judgment may be required in making assumptions, including the selection of interest rates, default and recovery rates and volatility. Changes in assumptions may have a significant effect on values. For these reasons, we classify our credit default and equity index put option contracts using Level 3 measurements under GAAP.
The fair values of our high yield credit default contracts are primarily based on indications of bid/ask pricing data. The bid/ask data represents non-binding indications of prices for which similar contracts would be exchanged. Pricing data for the high yield index contracts is obtained from one to three sources depending on the particular index. For the single name and municipal
91
Table of Contents
Management’s Discussion (Continued)
Derivative contract liabilities (Continued)
issuer credit default contracts, our fair values are generally based on credit default spread information obtained from a widely used reporting source. We monitor and review pricing data for consistency as well as reasonableness with respect to current market conditions. We generally base estimated fair values on the ask prices (the average of such prices if more than one indication is obtained). We make no significant adjustments to the pricing data referred to above. Further, we make no significant adjustments to fair values for non-performance risk. We concluded that the values produced from this data (without adjustment) reasonably represented the values for which we could have transferred these liabilities. However, our contract terms (particularly the lack of collateral posting requirements) likely preclude any transfer of the contracts to third parties. Accordingly, prices in a current actual settlement or transfer could differ significantly from the fair values used in the financial statements. We do not operate as a derivatives dealer and currently we do not utilize offsetting strategies to hedge these contracts. We intend to allow our credit default contracts to run off to their respective expiration dates.
We determine the estimated fair value of equity index put option contracts based on the widely used Black-Scholes option valuation model. Inputs to the model include the current index value, strike price, discount rate, dividend rate and contract expiration date. The weighted average discount and dividend rates used as of December 31, 2010 were 3.7% and 2.9%, respectively, and were approximately 4.0% and 2.7%, respectively, as of December 31, 2009. The discount rates as of December 31, 2010 and 2009 were approximately 82 basis points and 55 basis points (on a weighted average basis), respectively, over benchmark interest rates and represented an estimate of the spread between our borrowing rates and the benchmark rates for comparable durations. The spread adjustments were based on spreads for our obligations and obligations for comparably rated issuers. We believe the most significant economic risks relate to changes in the index value component and to a lesser degree to the foreign currency component. For additional information, see our Market Risk Disclosures.
The Black-Scholes model also incorporates volatility estimates that measure potential price changes over time. The weighted average volatility used as of December 31, 2010 was approximately 21.5%, which was relatively unchanged from year end 2009. The weighted average volatilities are based on the volatility input for each equity index put option contract weighted by the notional value of each equity index put option contract as compared to the aggregate notional value of all equity index put option contracts. The volatility input for each equity index put option contract is based upon the implied volatility at the inception of each equity index put option contract. The impact on fair value as of December 31, 2010 ($6.7 billion) from changes in volatility is summarized below. The values of contracts in an actual exchange are affected by market conditions and perceptions of the buyers and sellers. Actual values in an exchange may differ significantly from the values produced by any mathematical model. Dollars are in millions.
| Hypothetical change in volatility (percentage points) |
Hypothetical fair value | |||
| Increase 2 percentage points |
$ | 7,221 | ||
| Increase 4 percentage points |
7,732 | |||
| Decrease 2 percentage points |
6,208 | |||
| Decrease 4 percentage points |
5,711 | |||
Other Critical Accounting Policies
We record deferred charges with respect to liabilities assumed under retroactive reinsurance contracts. At the inception of these contracts, the deferred charges represent the difference between the consideration received and the estimated ultimate liability for unpaid losses. Deferred charges are amortized using the interest method over an estimate of the ultimate claim payment period with the periodic amortization reflected in earnings as a component of losses and loss adjustment expenses. Deferred charge balances are adjusted periodically to reflect new projections of the amount and timing of loss payments. Adjustments to these assumptions are applied retrospectively from the inception of the contract. Unamortized deferred charges were approximately $3.8 billion at December 31, 2010. Significant changes in the estimated amount and payment timing of unpaid losses may have a significant effect on unamortized deferred charges and the amount of periodic amortization.
Our Consolidated Balance Sheet as of December 31, 2010 includes goodwill of acquired businesses of $49.0 billion, which includes $14.8 billion arising from our acquisition of BNSF in February 2010. We evaluate goodwill for impairment at least annually and conducted our most recent annual review in the fourth quarter of 2010. Such tests include determining the estimated fair values of our reporting units. There are several methods of estimating a reporting unit’s fair value,
92
Table of Contents
Management’s Discussion (Continued)
Other Critical Accounting Policies (Continued)
including market quotations, underlying asset and liability fair value determinations and other valuation techniques, such as discounted projected future net earnings or net cash flows and multiples of earnings. We primarily use discounted projected future earnings or cash flow methods. The key assumptions and inputs used in such methods may involve forecasting revenues and expenses, operating cash flows and capital expenditures as well as an appropriate discount rate. A significant amount of judgment is required in estimating the fair value of a reporting unit and performing goodwill impairment tests. Due to the inherent uncertainty in forecasting cash flows and earnings, actual future results may vary significantly from the forecasts. If the carrying amount of a reporting unit, including goodwill, exceeds the estimated fair value, then individual assets (including identifiable intangible assets) and liabilities of the reporting unit are estimated at fair value. The excess of the estimated fair value of the reporting unit over the estimated fair value of net assets would establish the implied value of goodwill. The excess of the recorded amount of goodwill over the implied value is then charged to earnings as an impairment loss.
Market Risk Disclosures
Our Consolidated Balance Sheets include a substantial amount of assets and liabilities whose fair values are subject to market risks. Our significant market risks are primarily associated with interest rates, equity prices, foreign currency exchange rates and commodity prices. The fair values of our investment portfolios and equity index put option contracts remain subject to considerable volatility. The following sections address the significant market risks associated with our business activities.
Interest Rate Risk
We regularly invest in bonds, loans or other interest rate sensitive instruments. Our strategy is to acquire securities that are attractively priced in relation to the perceived credit risk. Management recognizes and accepts that losses may occur with respect to assets. We strive to maintain high credit ratings so that the cost of debt is minimized. We utilize derivative products, such as interest rate swaps, to manage interest rate risks on a limited basis.
The fair values of our fixed maturity investments and notes payable and other borrowings will fluctuate in response to changes in market interest rates. Increases and decreases in prevailing interest rates generally translate into decreases and increases in fair values of those instruments. Additionally, fair values of interest rate sensitive instruments may be affected by the creditworthiness of the issuer, prepayment options, relative values of alternative investments, the liquidity of the instrument and other general market conditions. The fair values of fixed interest rate investments may be more sensitive to interest rate changes than variable rate investments.
93
Table of Contents
Management’s Discussion (Continued)
Interest Rate Risk (Continued)
The following table summarizes the estimated effects of hypothetical changes in interest rates on our assets and liabilities that are subject to interest rate risk. It is assumed that the changes occur immediately and uniformly to each category of instrument containing interest rate risk, and that no other significant factors change that determine the value of the instrument. The hypothetical changes in interest rates do not reflect what could be deemed best or worst case scenarios. Variations in interest rates could produce significant changes in the timing of repayments due to prepayment options available. For these reasons, actual results might differ from those reflected in the table. Dollars are in millions.
| Estimated Fair Value after Hypothetical Change in Interest Rates |
||||||||||||||||||||
| (bp=basis points) | ||||||||||||||||||||
| Fair Value | 100 bp decrease |
100 bp increase |
200 bp increase |
300 bp increase |
||||||||||||||||
| December 31, 2010 |
||||||||||||||||||||
| Investments in fixed maturity securities |
$ | 34,883 | $ | 35,710 | $ | 34,028 | $ | 33,169 | $ | 32,405 | ||||||||||
| Other investments (1) |
18,905 | 19,284 | 18,535 | 18,183 | 17,742 | |||||||||||||||
| Loans and finance receivables |
14,453 | 14,937 | 13,998 | 13,572 | 13,172 | |||||||||||||||
| Notes payable and other borrowings: |
||||||||||||||||||||
| Insurance and other |
12,705 | 12,995 | 12,436 | 12,191 | 11,964 | |||||||||||||||
| Railroad, utilities and energy |
33,932 | 36,924 | 31,377 | 29,192 | 27,303 | |||||||||||||||
| Finance and financial products |
15,191 | 15,662 | 14,760 | 14,363 | 13,994 | |||||||||||||||
| December 31, 2009 |
||||||||||||||||||||
| Investments in fixed maturity securities |
$ | 37,131 | $ | 38,155 | $ | 36,000 | $ | 34,950 | $ | 34,013 | ||||||||||
| Other investments (1) |
22,197 | 23,056 | 21,391 | 20,620 | 19,892 | |||||||||||||||
| Loans and finance receivables |
12,415 | 12,896 | 11,965 | 11,545 | 11,151 | |||||||||||||||
| Notes payable and other borrowings: |
||||||||||||||||||||
| Insurance and other |
4,669 | 4,824 | 4,532 | 4,409 | 4,299 | |||||||||||||||
| Railroad, utilities and energy |
20,868 | 22,841 | 19,217 | 17,792 | 16,564 | |||||||||||||||
| Finance and financial products |
14,426 | 14,819 | 14,049 | 13,692 | 13,351 | |||||||||||||||
| (1) | Includes other investments that are subject to a significant level of interest rate risk. |
Equity Price Risk
Historically, we have maintained large amounts of invested assets in exchange traded equity securities. Strategically, we strive to invest in businesses that possess excellent economics, with able and honest management and at sensible prices and prefer to invest a meaningful amount in each investee. Consequently, equity investments may be concentrated in relatively few investees. At December 31, 2010, approximately 58% of the total fair value of equity investments was concentrated in four investees.
We prefer to hold equity investments for very long periods of time so we are not troubled by short-term price volatility with respect to our investments provided that the underlying business, economic and management characteristics of the investees remain favorable. We strive to maintain above average levels of shareholder capital to provide a margin of safety against short-term equity price volatility.
Market prices for equity securities are subject to fluctuation and consequently the amount realized in the subsequent sale of an investment may significantly differ from the reported market value. Fluctuation in the market price of a security may result from perceived changes in the underlying economic characteristics of the investee, the relative price of alternative investments and general market conditions.
We are also subject to equity price risk with respect to our equity index put option contracts. While our ultimate potential loss with respect to these contracts is determined from the movement of the underlying stock index between the contract inception date and expiration date, the change in fair value resulting from current changes in the index values are also affected by changes in other factors such as interest rates, expected dividend rates and the remaining duration of the contract. These contracts expire between 2018 and 2026 and may not be unilaterally settled before their respective expiration dates.
94
Table of Contents
Management’s Discussion (Continued)
Equity Price Risk (Continued)
The following table summarizes our equity investments and derivative contract liabilities with equity price risk as of December 31, 2010 and 2009. The effects of a hypothetical 30% increase and a 30% decrease in market prices as of those dates is also shown. The selected 30% hypothetical change does not reflect what could be considered the best or worst case scenarios. Indeed, results could be far worse due both to the nature of equity markets and the aforementioned concentrations existing in our equity investment portfolio. Dollar amounts are in millions.
| Fair Value | Hypothetical Price Change |
Estimated Fair Value after Hypothetical Change in Prices |
Hypothetical Percentage Increase (Decrease) in Shareholders’ Equity |
|||||||||||||
| December 31, 2010 |
||||||||||||||||
| Equity securities |
$ | 61,513 | 30% increase | $ | 79,967 | 7.6 | ||||||||||
| 30% decrease | 43,059 | (7.6 | ) | |||||||||||||
| Other investments (1) |
8,668 | 30% increase | 11,260 | 1.1 | ||||||||||||
| 30% decrease | 5,956 | (1.1 | ) | |||||||||||||
| Equity index put option contracts |
(6,712 | ) | 30% increase | (4,687 | ) | 0.8 | ||||||||||
| 30% decrease | (9,859 | ) | (1.3 | ) | ||||||||||||
| December 31, 2009 |
||||||||||||||||
| Equity securities |
$ | 59,034 | 30% increase | $ | 76,744 | 8.7 | ||||||||||
| 30% decrease | 41,324 | (8.7 | ) | |||||||||||||
| Other investments (1) |
8,011 | 30% increase | 10,696 | 1.3 | ||||||||||||
| 30% decrease | 5,743 | (1.1 | ) | |||||||||||||
| Equity index put option contracts |
(7,309 | ) | 30% increase | (5,291 | ) | 1.0 | ||||||||||
| 30% decrease | (10,428 | ) | (1.5 | ) | ||||||||||||
| (1) | Includes other investments that possess significant equity price risk. Excludes investments accounted for under the equity method. |
Foreign Currency Risk
We generally do not use derivative contracts to hedge foreign currency price changes primarily because of the natural hedging that occurs between assets and liabilities denominated in foreign currencies in the Consolidated Financial Statements. Financial statements of subsidiaries that do not use the U.S. Dollar as their functional currency are translated into U.S. Dollars using period-end exchange rates for assets and liabilities and weighted-average exchange rates for revenues and expenses. Adjustments resulting from translating the financial statements of these subsidiaries are reported in accumulated other comprehensive income. Foreign currency transaction gains or losses are included in earnings primarily as a result of the translation of foreign currency denominated assets and liabilities held by our U.S. subsidiaries. In addition, we hold investments in major multinational companies that have significant foreign business and foreign currency risk of their own, such as The Coca-Cola Company.
Our net assets subject to translation are primarily in our insurance and utilities and energy businesses, and to a lesser extent in our manufacturing and services businesses. The translation impact is somewhat offset by transaction gains or losses on net reinsurance liabilities of certain U.S. subsidiaries that are denominated in foreign currencies as well as the equity index put option liabilities of U.S. subsidiaries relating to contracts that would be settled in foreign currencies.
Commodity Price Risk
Through our ownership of MidAmerican, we are subject to commodity price risk. Exposures include variations in the price of fuel to generate electricity, wholesale electricity that is purchased and sold and natural gas supply for customers. Commodity prices are subject to wide price swings as supply and demand are impacted by, among many other unpredictable items, weather, market liquidity, generating facility availability, customer usage, storage and transmission and transportation constraints. To mitigate a portion of the risk, MidAmerican uses derivative instruments, including forwards, futures, options, swaps and other agreements, to effectively secure future supply or sell future production generally at fixed prices. The settled cost of these contracts is generally recovered from customers in regulated rates. Accordingly, net unrealized gains and losses associated with interim price movements on such contracts are recorded as regulatory assets or liabilities. Financial results would be negatively
95
Table of Contents
Management’s Discussion (Continued)
Commodity Price Risk (Continued)
impacted if the costs of wholesale electricity, fuel or natural gas are higher than what is permitted to be recovered in rates. MidAmerican also uses futures, options and swap agreements to economically hedge gas and electric commodity prices for physical delivery to non-regulated customers. MidAmerican does not engage in a material amount of proprietary trading activities.
The table that follows summarizes our commodity price risk on energy derivative contracts of MidAmerican as of December 31, 2010 and 2009 and shows the effects of a hypothetical 10% increase and a 10% decrease in forward market prices by the expected volumes for these contracts as of each date. The selected hypothetical change does not reflect what could be considered the best or worst case scenarios. Dollars are in millions.
| Fair Value Net Assets (Liabilities) |
Hypothetical Price Change | Estimated Fair Value after Hypothetical Change in Price |
||||||||||
| December 31, 2010 |
$ | (613 | ) | 10% increase | $ | (546 | ) | |||||
| 10% decrease | (680 | ) | ||||||||||
| December 31, 2009 |
$ | (438 | ) | 10% increase | $ | (398 | ) | |||||
| 10% decrease | (478 | ) | ||||||||||
FORWARD-LOOKING STATEMENTS
Investors are cautioned that certain statements contained in this document, as well as some statements in periodic press releases and some oral statements of Berkshire officials during presentations about Berkshire, are “forward-looking” statements within the meaning of the Private Securities Litigation Reform Act of 1995 (the “Act”). Forward-looking statements include statements that are predictive in nature, that depend upon or refer to future events or conditions, that include words such as “expects,” “anticipates,” “intends,” “plans,” “believes,” “estimates,” or similar expressions. In addition, any statements concerning future financial performance (including future revenues, earnings or growth rates), ongoing business strategies or prospects, and possible future Berkshire actions, which may be provided by management, are also forward-looking statements as defined by the Act. Forward-looking statements are based on current expectations and projections about future events and are subject to risks, uncertainties, and assumptions about us, economic and market factors and the industries in which we do business, among other things. These statements are not guaranties of future performance and we have no specific intention to update these statements.
Actual events and results may differ materially from those expressed or forecasted in forward-looking statements due to a number of factors. The principal important risk factors that could cause our actual performance and future events and actions to differ materially from such forward-looking statements, include, but are not limited to, changes in market prices of our investments in fixed maturity and equity securities, losses realized from derivative contracts, the occurrence of one or more catastrophic events, such as an earthquake, hurricane or an act of terrorism that causes losses insured by our insurance subsidiaries, changes in insurance laws or regulations, changes in federal income tax laws, and changes in general economic and market factors that affect the prices of securities or the industries in which we do business.
96
Table of Contents
In June 1996, Berkshire’s Chairman, Warren E. Buffett, issued a booklet entitled “An Owner’s Manual*” to Berkshire’s Class A and Class B shareholders. The purpose of the manual was to explain Berkshire’s broad economic principles of operation. An updated version is reproduced on this and the following pages.
OWNER-RELATED BUSINESS PRINCIPLES
At the time of the Blue Chip merger in 1983, I set down 13 owner-related business principles that I thought would help new shareholders understand our managerial approach. As is appropriate for “principles,” all 13 remain alive and well today, and they are stated here in italics.
| 1. | Although our form is corporate, our attitude is partnership. Charlie Munger and I think of our shareholders as owner-partners, and of ourselves as managing partners. (Because of the size of our shareholdings we are also, for better or worse, controlling partners.) We do not view the company itself as the ultimate owner of our business assets but instead view the company as a conduit through which our shareholders own the assets. |
Charlie and I hope that you do not think of yourself as merely owning a piece of paper whose price wiggles around daily and that is a candidate for sale when some economic or political event makes you nervous. We hope you instead visualize yourself as a part owner of a business that you expect to stay with indefinitely, much as you might if you owned a farm or apartment house in partnership with members of your family. For our part, we do not view Berkshire shareholders as faceless members of an ever-shifting crowd, but rather as co-venturers who have entrusted their funds to us for what may well turn out to be the remainder of their lives.
The evidence suggests that most Berkshire shareholders have indeed embraced this long-term partnership concept. The annual percentage turnover in Berkshire’s shares is a fraction of that occurring in the stocks of other major American corporations, even when the shares I own are excluded from the calculation.
In effect, our shareholders behave in respect to their Berkshire stock much as Berkshire itself behaves in respect to companies in which it has an investment. As owners of, say, Coca-Cola or American Express shares, we think of Berkshire as being a non-managing partner in two extraordinary businesses, in which we measure our success by the long-term progress of the companies rather than by the month-to-month movements of their stocks. In fact, we would not care in the least if several years went by in which there was no trading, or quotation of prices, in the stocks of those companies. If we have good long-term expectations, short-term price changes are meaningless for us except to the extent they offer us an opportunity to increase our ownership at an attractive price.
| 2. | In line with Berkshire’s owner-orientation, most of our directors have a major portion of their net worth invested in the company. We eat our own cooking. |
Charlie’s family has 80% or more of its net worth in Berkshire shares; I have more than 98%. In addition, many of my relatives – my sisters and cousins, for example – keep a huge portion of their net worth in Berkshire stock.
Charlie and I feel totally comfortable with this eggs-in-one-basket situation because Berkshire itself owns a wide variety of truly extraordinary businesses. Indeed, we believe that Berkshire is close to being unique in the quality and diversity of the businesses in which it owns either a controlling interest or a minority interest of significance.
Charlie and I cannot promise you results. But we can guarantee that your financial fortunes will move in lockstep with ours for whatever period of time you elect to be our partner. We have no interest in large salaries or options or other means of gaining an “edge” over you. We want to make money only when our partners do and in exactly the same proportion. Moreover, when I do something dumb, I want you to be able to derive some solace from the fact that my financial suffering is proportional to yours.
| 3. | Our long-term economic goal (subject to some qualifications mentioned later) is to maximize Berkshire’s average annual rate of gain in intrinsic business value on a per-share basis. We do not measure the economic significance or performance of Berkshire by its size; we measure by per-share progress. We are certain that the rate of per-share progress will diminish in the future – a greatly enlarged capital base will see to that. But we will be disappointed if our rate does not exceed that of the average large American corporation. |
| 4. | Our preference would be to reach our goal by directly owning a diversified group of businesses that generate cash and consistently earn above-average returns on capital. Our second choice is to own parts of similar businesses, attained primarily through purchases of marketable common stocks by our insurance subsidiaries. The price and availability of businesses and the need for insurance capital determine any given year’s capital allocation. |
| * | Copyright © 1996 By Warren E. Buffett |
All Rights Reserved
97
Table of Contents
In recent years we have made a number of acquisitions. Though there will be dry years, we expect to make many more in the decades to come, and our hope is that they will be large. If these purchases approach the quality of those we have made in the past, Berkshire will be well served.
The challenge for us is to generate ideas as rapidly as we generate cash. In this respect, a depressed stock market is likely to present us with significant advantages. For one thing, it tends to reduce the prices at which entire companies become available for purchase. Second, a depressed market makes it easier for our insurance companies to buy small pieces of wonderful businesses – including additional pieces of businesses we already own – at attractive prices. And third, some of those same wonderful businesses, such as Coca-Cola, are consistent buyers of their own shares, which means that they, and we, gain from the cheaper prices at which they can buy.
Overall, Berkshire and its long-term shareholders benefit from a sinking stock market much as a regular purchaser of food benefits from declining food prices. So when the market plummets – as it will from time to time – neither panic nor mourn. It’s good news for Berkshire.
| 5. | Because of our two-pronged approach to business ownership and because of the limitations of conventional accounting, consolidated reported earnings may reveal relatively little about our true economic performance. Charlie and I, both as owners and managers, virtually ignore such consolidated numbers. However, we will also report to you the earnings of each major business we control, numbers we consider of great importance. These figures, along with other information we will supply about the individual businesses, should generally aid you in making judgments about them. |
To state things simply, we try to give you in the annual report the numbers and other information that really matter. Charlie and I pay a great deal of attention to how well our businesses are doing, and we also work to understand the environment in which each business is operating. For example, is one of our businesses enjoying an industry tailwind or is it facing a headwind? Charlie and I need to know exactly which situation prevails and to adjust our expectations accordingly. We will also pass along our conclusions to you.
Over time, the large majority of our businesses have exceeded our expectations. But sometimes we have disappointments, and we will try to be as candid in informing you about those as we are in describing the happier experiences. When we use unconventional measures to chart our progress – for instance, you will be reading in our annual reports about insurance “float” – we will try to explain these concepts and why we regard them as important. In other words, we believe in telling you how we think so that you can evaluate not only Berkshire’s businesses but also assess our approach to management and capital allocation.
| 6. | Accounting consequences do not influence our operating or capital-allocation decisions. When acquisition costs are similar, we much prefer to purchase $2 of earnings that is not reportable by us under standard accounting principles than to purchase $1 of earnings that is reportable. This is precisely the choice that often faces us since entire businesses (whose earnings will be fully reportable) frequently sell for double the pro-rata price of small portions (whose earnings will be largely unreportable). In aggregate and over time, we expect the unreported earnings to be fully reflected in our intrinsic business value through capital gains. |
We have found over time that the undistributed earnings of our investees, in aggregate, have been fully as beneficial to Berkshire as if they had been distributed to us (and therefore had been included in the earnings we officially report). This pleasant result has occurred because most of our investees are engaged in truly outstanding businesses that can often employ incremental capital to great advantage, either by putting it to work in their businesses or by repurchasing their shares. Obviously, every capital decision that our investees have made has not benefitted us as shareholders, but overall we have garnered far more than a dollar of value for each dollar they have retained. We consequently regard look-through earnings as realistically portraying our yearly gain from operations.
| 7. | We use debt sparingly and, when we do borrow, we attempt to structure our loans on a long-term fixed-rate basis. We will reject interesting opportunities rather than over-leverage our balance sheet. This conservatism has penalized our results but it is the only behavior that leaves us comfortable, considering our fiduciary obligations to policyholders, lenders and the many equity holders who have committed unusually large portions of their net worth to our care. (As one of the Indianapolis “500” winners said: “To finish first, you must first finish.”) |
The financial calculus that Charlie and I employ would never permit our trading a good night’s sleep for a shot at a few extra percentage points of return. I’ve never believed in risking what my family and friends have and need in order to pursue what they don’t have and don’t need.
Besides, Berkshire has access to two low-cost, non-perilous sources of leverage that allow us to safely own far more assets than our equity capital alone would permit: deferred taxes and “float,” the funds of others that our insurance business holds because it receives premiums before needing to pay out losses. Both of these funding sources have grown rapidly and now total about $100 billion.
98
Table of Contents
Better yet, this funding to date has often been cost-free. Deferred tax liabilities bear no interest. And as long as we can break even in our insurance underwriting the cost of the float developed from that operation is zero. Neither item, of course, is equity; these are real liabilities. But they are liabilities without covenants or due dates attached to them. In effect, they give us the benefit of debt – an ability to have more assets working for us – but saddle us with none of its drawbacks.
Of course, there is no guarantee that we can obtain our float in the future at no cost. But we feel our chances of attaining that goal are as good as those of anyone in the insurance business. Not only have we reached the goal in the past (despite a number of important mistakes by your Chairman), our 1996 acquisition of GEICO, materially improved our prospects for getting there in the future.
In our present configuration (2010) we expect additional borrowings to be concentrated in our utilities and railroad businesses, loans that are non-recourse to Berkshire. Here, we will favor long-term, fixed-rate loans. When we make a truly large purchase, as we did with BNSF, we will borrow money at the parent company level with the intent of quickly paying it back.
| 8. | A managerial “wish list” will not be filled at shareholder expense. We will not diversify by purchasing entire businesses at control prices that ignore long-term economic consequences to our shareholders. We will only do with your money what we would do with our own, weighing fully the values you can obtain by diversifying your own portfolios through direct purchases in the stock market. |
Charlie and I are interested only in acquisitions that we believe will raise the per-share intrinsic value of Berkshire’s stock. The size of our paychecks or our offices will never be related to the size of Berkshire’s balance sheet.
| 9. | We feel noble intentions should be checked periodically against results. We test the wisdom of retaining earnings by assessing whether retention, over time, delivers shareholders at least $1 of market value for each $1 retained. To date, this test has been met. We will continue to apply it on a five-year rolling basis. As our net worth grows, it is more difficult to use retained earnings wisely. |
I should have written the “five-year rolling basis” sentence differently, an error I didn’t realize until I received a question about this subject at the 2009 annual meeting.
When the stock market has declined sharply over a five-year stretch, our market-price premium to book value has sometimes shrunk. And when that happens, we fail the test as I improperly formulated it. In fact, we fell far short as early as 1971-75, well before I wrote this principle in 1983.
The five-year test should be: (1) during the period did our book-value gain exceed the performance of the S&P; and (2) did our stock consistently sell at a premium to book, meaning that every $1 of retained earnings was always worth more than $1? If these tests are met, retaining earnings has made sense.
| 10. | We will issue common stock only when we receive as much in business value as we give. This rule applies to all forms of issuance – not only mergers or public stock offerings, but stock-for-debt swaps, stock options, and convertible securities as well. We will not sell small portions of your company – and that is what the issuance of shares amounts to – on a basis inconsistent with the value of the entire enterprise. |
When we sold the Class B shares in 1996, we stated that Berkshire stock was not undervalued – and some people found that shocking. That reaction was not well-founded. Shock should have registered instead had we issued shares when our stock was undervalued. Managements that say or imply during a public offering that their stock is undervalued are usually being economical with the truth or uneconomical with their existing shareholders’ money: Owners unfairly lose if their managers deliberately sell assets for 80¢ that in fact are worth $1. We didn’t commit that kind of crime in our offering of Class B shares and we never will. (We did not, however, say at the time of the sale that our stock was overvalued, though many media have reported that we did.)
| 11. | You should be fully aware of one attitude Charlie and I share that hurts our financial performance: Regardless of price, we have no interest at all in selling any good businesses that Berkshire owns. We are also very reluctant to sell sub-par businesses as long as we expect them to generate at least some cash and as long as we feel good about their managers and labor relations. We hope not to repeat the capital-allocation mistakes that led us into such sub-par businesses. And we react with great caution to suggestions that our poor businesses can be restored to satisfactory profitability by major capital expenditures. (The projections will be dazzling and the advocates sincere, but, in the end, major additional investment in a terrible industry usually is about as rewarding as struggling in quicksand.) Nevertheless, gin rummy managerial behavior (discard your least promising business at each turn) is not our style. We would rather have our overall results penalized a bit than engage in that kind of behavior. |
We continue to avoid gin rummy behavior. True, we closed our textile business in the mid-1980’s after 20 years of struggling with it, but only because we felt it was doomed to run never-ending operating losses. We have not, however, given thought to selling operations that would command very fancy prices nor have we dumped our laggards, though we focus hard on curing the problems that cause them to lag.
99
Table of Contents
| 12. | We will be candid in our reporting to you, emphasizing the pluses and minuses important in appraising business value. Our guideline is to tell you the business facts that we would want to know if our positions were reversed. We owe you no less. Moreover, as a company with a major communications business, it would be inexcusable for us to apply lesser standards of accuracy, balance and incisiveness when reporting on ourselves than we would expect our news people to apply when reporting on others. We also believe candor benefits us as managers: The CEO who misleads others in public may eventually mislead himself in private. |
At Berkshire you will find no “big bath” accounting maneuvers or restructurings nor any “smoothing” of quarterly or annual results. We will always tell you how many strokes we have taken on each hole and never play around with the scorecard. When the numbers are a very rough “guesstimate,” as they necessarily must be in insurance reserving, we will try to be both consistent and conservative in our approach.
We will be communicating with you in several ways. Through the annual report, I try to give all shareholders as much value-defining information as can be conveyed in a document kept to reasonable length. We also try to convey a liberal quantity of condensed but important information in the quarterly reports we post on the internet, though I don’t write those (one recital a year is enough). Still another important occasion for communication is our Annual Meeting, at which Charlie and I are delighted to spend five hours or more answering questions about Berkshire. But there is one way we can’t communicate: on a one-on-one basis. That isn’t feasible given Berkshire’s many thousands of owners.
In all of our communications, we try to make sure that no single shareholder gets an edge: We do not follow the usual practice of giving earnings “guidance” or other information of value to analysts or large shareholders. Our goal is to have all of our owners updated at the same time.
| 13. | Despite our policy of candor, we will discuss our activities in marketable securities only to the extent legally required. Good investment ideas are rare, valuable and subject to competitive appropriation just as good product or business acquisition ideas are. Therefore we normally will not talk about our investment ideas. This ban extends even to securities we have sold (because we may purchase them again) and to stocks we are incorrectly rumored to be buying. If we deny those reports but say “no comment” on other occasions, the no-comments become confirmation. |
Though we continue to be unwilling to talk about specific stocks, we freely discuss our business and investment philosophy. I benefitted enormously from the intellectual generosity of Ben Graham, the greatest teacher in the history of finance, and I believe it appropriate to pass along what I learned from him, even if that creates new and able investment competitors for Berkshire just as Ben’s teachings did for him.
TWO ADDED PRINCIPLES
| 14. | To the extent possible, we would like each Berkshire shareholder to record a gain or loss in market value during his period of ownership that is proportional to the gain or loss in per-share intrinsic value recorded by the company during that holding period. For this to come about, the relationship between the intrinsic value and the market price of a Berkshire share would need to remain constant, and by our preferences at 1-to-1. As that implies, we would rather see Berkshire’s stock price at a fair level than a high level. Obviously, Charlie and I can’t control Berkshire’s price. But by our policies and communications, we can encourage informed, rational behavior by owners that, in turn, will tend to produce a stock price that is also rational. Our it’s-as-bad-to-be-overvalued-as-to-be-undervalued approach may disappoint some shareholders. We believe, however, that it affords Berkshire the best prospect of attracting long-term investors who seek to profit from the progress of the company rather than from the investment mistakes of their partners. |
| 15. | We regularly compare the gain in Berkshire’s per-share book value to the performance of the S&P 500. Over time, we hope to outpace this yardstick. Otherwise, why do our investors need us? The measurement, however, has certain shortcomings that are described in the next section. Moreover, it now is less meaningful on a year-to-year basis than was formerly the case. That is because our equity holdings, whose value tends to move with the S&P 500, are a far smaller portion of our net worth than they were in earlier years. Additionally, gains in the S&P stocks are counted in full in calculating that index, whereas gains in Berkshire’s equity holdings are counted at 65% because of the federal tax we incur. We, therefore, expect to outperform the S&P in lackluster years for the stock market and underperform when the market has a strong year. |
INTRINSIC VALUE
Now let’s focus on a term that I mentioned earlier and that you will encounter in future annual reports.
Intrinsic value is an all-important concept that offers the only logical approach to evaluating the relative attractiveness of investments and businesses. Intrinsic value can be defined simply: It is the discounted value of the cash that can be taken out of a business during its remaining life.
The calculation of intrinsic value, though, is not so simple. As our definition suggests, intrinsic value is an estimate rather than a precise figure, and it is additionally an estimate that must be changed if interest rates move or forecasts of future cash
100
Table of Contents
flows are revised. Two people looking at the same set of facts, moreover – and this would apply even to Charlie and me – will almost inevitably come up with at least slightly different intrinsic value figures. That is one reason we never give you our estimates of intrinsic value. What our annual reports do supply, though, are the facts that we ourselves use to calculate this value.
Meanwhile, we regularly report our per-share book value, an easily calculable number, though one of limited use. The limitations do not arise from our holdings of marketable securities, which are carried on our books at their current prices. Rather the inadequacies of book value have to do with the companies we control, whose values as stated on our books may be far different from their intrinsic values.
The disparity can go in either direction. For example, in 1964 we could state with certitude that Berkshire’s per-share book value was $19.46. However, that figure considerably overstated the company’s intrinsic value, since all of the company’s resources were tied up in a sub-profitable textile business. Our textile assets had neither going-concern nor liquidation values equal to their carrying values. Today, however, Berkshire’s situation is reversed: Now, our book value far understates Berkshire’s intrinsic value, a point true because many of the businesses we control are worth much more than their carrying value.
Inadequate though they are in telling the story, we give you Berkshire’s book-value figures because they today serve as a rough, albeit significantly understated, tracking measure for Berkshire’s intrinsic value. In other words, the percentage change in book value in any given year is likely to be reasonably close to that year’s change in intrinsic value.
You can gain some insight into the differences between book value and intrinsic value by looking at one form of investment, a college education. Think of the education’s cost as its “book value.” If this cost is to be accurate, it should include the earnings that were foregone by the student because he chose college rather than a job.
For this exercise, we will ignore the important non-economic benefits of an education and focus strictly on its economic value. First, we must estimate the earnings that the graduate will receive over his lifetime and subtract from that figure an estimate of what he would have earned had he lacked his education. That gives us an excess earnings figure, which must then be discounted, at an appropriate interest rate, back to graduation day. The dollar result equals the intrinsic economic value of the education.
Some graduates will find that the book value of their education exceeds its intrinsic value, which means that whoever paid for the education didn’t get his money’s worth. In other cases, the intrinsic value of an education will far exceed its book value, a result that proves capital was wisely deployed. In all cases, what is clear is that book value is meaningless as an indicator of intrinsic value.
THE MANAGING OF BERKSHIRE
I think it’s appropriate that I conclude with a discussion of Berkshire’s management, today and in the future. As our first owner-related principle tells you, Charlie and I are the managing partners of Berkshire. But we subcontract all of the heavy lifting in this business to the managers of our subsidiaries. In fact, we delegate almost to the point of abdication: Though Berkshire has about 260,000 employees, only 21 of these are at headquarters.
Charlie and I mainly attend to capital allocation and the care and feeding of our key managers. Most of these managers are happiest when they are left alone to run their businesses, and that is customarily just how we leave them. That puts them in charge of all operating decisions and of dispatching the excess cash they generate to headquarters. By sending it to us, they don’t get diverted by the various enticements that would come their way were they responsible for deploying the cash their businesses throw off. Furthermore, Charlie and I are exposed to a much wider range of possibilities for investing these funds than any of our managers could find in his or her own industry.
Most of our managers are independently wealthy, and it’s therefore up to us to create a climate that encourages them to choose working with Berkshire over golfing or fishing. This leaves us needing to treat them fairly and in the manner that we would wish to be treated if our positions were reversed.
As for the allocation of capital, that’s an activity both Charlie and I enjoy and in which we have acquired some useful experience. In a general sense, grey hair doesn’t hurt on this playing field: You don’t need good hand-eye coordination or well-toned muscles to push money around (thank heavens). As long as our minds continue to function effectively, Charlie and I can keep on doing our jobs pretty much as we have in the past.
On my death, Berkshire’s ownership picture will change but not in a disruptive way: None of my stock will have to be sold to take care of the cash bequests I have made or for taxes. Other assets of mine will take care of these requirements. All Berkshire shares will be left to foundations that will likely receive the stock in roughly equal installments over a dozen or so years.
101
Table of Contents
At my death, the Buffett family will not be involved in managing the business but, as very substantial shareholders, will help in picking and overseeing the managers who do. Just who those managers will be, of course, depends on the date of my death. But I can anticipate what the management structure will be: Essentially my job will be split into two parts. One executive will become CEO and responsible for operations. The responsibility for investments will be given to one or more executives. If the acquisition of new businesses is in prospect, these executives will cooperate in making the decisions needed, subject, of course, to board approval. We will continue to have an extraordinarily shareholder-minded board, one whose interests are solidly aligned with yours.
Were we to need the management structure I have just described on an immediate basis, our directors know my recommendations for both posts. All candidates currently work for or are available to Berkshire and are people in whom I have total confidence. Our managerial roster has never been stronger.
I will continue to keep the directors posted on the succession issue. Since Berkshire stock will make up virtually my entire estate and will account for a similar portion of the assets of various foundations for a considerable period after my death, you can be sure that the directors and I have thought through the succession question carefully and that we are well prepared. You can be equally sure that the principles we have employed to date in running Berkshire will continue to guide the managers who succeed me and that our unusually strong and well-defined culture will remain intact. As an added assurance that this will be the case, I believe it would be wise when I am no longer CEO to have a member of the Buffett family serve as the non-paid, non-executive Chairman of the Board. That decision, however, will be the responsibility of the then Board of Directors.
Lest we end on a morbid note, I also want to assure you that I have never felt better. I love running Berkshire, and if enjoying life promotes longevity, Methuselah’s record is in jeopardy.
Warren E. Buffett
Chairman
STOCK PERFORMANCE GRAPH
The following chart compares the subsequent value of $100 invested in Berkshire common stock on December 31, 2005 with a similar investment in the Standard and Poor’s 500 Stock Index and in the Standard and Poor’s Property—Casualty Insurance Index.**
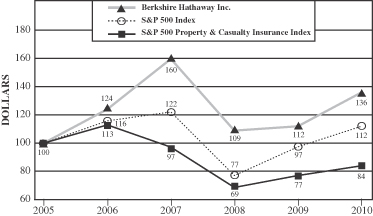
| * | Cumulative return for the Standard and Poor’s indices based on reinvestment of dividends. |
| ** | It would be difficult to develop a peer group of companies similar to Berkshire. The Corporation owns subsidiaries engaged in a number of diverse business activities of which the most important is the property and casualty insurance business and, accordingly, management has used the Standard and Poor’s Property—Casualty Insurance Index for comparative purposes. |
102
Table of Contents
COMMON STOCK
General
Berkshire has two classes of common stock designated Class A common stock and Class B common stock. Each share of Class A common stock is convertible, at the option of the holder, into 1,500 shares of Class B common stock. Shares of Class B common stock are not convertible into shares of Class A common stock.
Stock Transfer Agent
Wells Fargo Bank, N.A., P. O. Box 64854, St. Paul, MN 55164-0854 serves as Transfer Agent and Registrar for the Company’s common stock. Correspondence may be directed to Wells Fargo at the address indicated or at wellsfargo.com/shareownerservices. Telephone inquiries should be directed to the Shareowner Relations Department at 1-877-602-7411 between 7:00 A.M. and 7:00 P.M. Central Time. Certificates for re-issue or transfer should be directed to the Transfer Department at the address indicated.
Shareholders of record wishing to convert Class A common stock into Class B common stock may contact Wells Fargo in writing. Along with the underlying stock certificate, shareholders should provide Wells Fargo with specific written instructions regarding the number of shares to be converted and the manner in which the Class B shares are to be registered. We recommend that you use certified or registered mail when delivering the stock certificates and written instructions.
If Class A shares are held in “street name,” shareholders wishing to convert all or a portion of their holding should contact their broker or bank nominee. It will be necessary for the nominee to make the request for conversion.
Shareholders
Berkshire had approximately 4,000 record holders of its Class A common stock and 18,000 record holders of its Class B common stock at February 16, 2011. Record owners included nominees holding at least 480,000 shares of Class A common stock and 1,045,000,000 shares of Class B common stock on behalf of beneficial-but-not-of-record owners.
Price Range of Common Stock
Berkshire’s Class A and Class B common stock are listed for trading on the New York Stock Exchange, trading symbol: BRK.A and BRK.B. The following table sets forth the high and low sales prices per share, as reported on the New York Stock Exchange Composite List during the periods indicated:
| 2010 | 2009 | |||||||||||||||||||||||||||||||
| Class A | Class B | Class A | Class B * | |||||||||||||||||||||||||||||
| High | Low | High | Low | High | Low | High | Low | |||||||||||||||||||||||||
| First Quarter |
$ | 125,252 | $ | 97,205 | $ | 83.57 | $ | 64.72 | $ | 102,600 | $ | 70,050 | $ | 68.40 | $ | 44.82 | ||||||||||||||||
| Second Quarter |
122,908 | 102,751 | 81.95 | 68.48 | 95,500 | 83,957 | 63.10 | 54.82 | ||||||||||||||||||||||||
| Third Quarter |
128,730 | 113,622 | 85.86 | 75.62 | 108,450 | 84,600 | 71.38 | 54.66 | ||||||||||||||||||||||||
| Fourth Quarter |
126,568 | 118,201 | 84.45 | 78.72 | 105,980 | 97,870 | 70.00 | 64.22 | ||||||||||||||||||||||||
| * | Adjusted for the 50-for-1 Class B stock split that became effective on January 21, 2010. |
Dividends
Berkshire has not declared a cash dividend since 1967.
103
Table of Contents
| To: | Berkshire Hathaway Managers (“The All-Stars”) | |
| cc: | Berkshire Directors | |
| From: | Warren E. Buffett | |
| Date: | July 26, 2010 | |
This is my biennial letter to reemphasize Berkshire’s top priority and to get your help on succession planning (yours, not mine!).
The priority is that all of us continue to zealously guard Berkshire’s reputation. We can’t be perfect but we can try to be. As I’ve said in these memos for more than 25 years: “We can afford to lose money – even a lot of money. But we can’t afford to lose reputation – even a shred of reputation.” We must continue to measure every act against not only what is legal but also what we would be happy to have written about on the front page of a national newspaper in an article written by an unfriendly but intelligent reporter.
Sometimes your associates will say “Everybody else is doing it.” This rationale is almost always a bad one if it is the main justification for a business action. It is totally unacceptable when evaluating a moral decision. Whenever somebody offers that phrase as a rationale, in effect they are saying that they can’t come up with a good reason. If anyone gives this explanation, tell them to try using it with a reporter or a judge and see how far it gets them.
If you see anything whose propriety or legality causes you to hesitate, be sure to give me a call. However, it’s very likely that if a given course of action evokes such hesitation, it’s too close to the line and should be abandoned. There’s plenty of money to be made in the center of the court. If it’s questionable whether some action is close to the line, just assume it is outside and forget it.
As a corollary, let me know promptly if there’s any significant bad news. I can handle bad news but I don’t like to deal with it after it has festered for awhile. A reluctance to face up immediately to bad news is what turned a problem at Salomon from one that could have easily been disposed of into one that almost caused the demise of a firm with 8,000 employees.
104
Table of Contents
Somebody is doing something today at Berkshire that you and I would be unhappy about if we knew of it. That’s inevitable: We now employ more than 250,000 people and the chances of that number getting through the day without any bad behavior occurring is nil. But we can have a huge effect in minimizing such activities by jumping on anything immediately when there is the slightest odor of impropriety. Your attitude on such matters, expressed by behavior as well as words, will be the most important factor in how the culture of your business develops. Culture, more than rule books, determines how an organization behaves.
In other respects, talk to me about what is going on as little or as much as you wish. Each of you does a first-class job of running your operation with your own individual style and you don’t need me to help. The only items you need to clear with me are any changes in post-retirement benefits and any unusually large capital expenditures or acquisitions.
* * * * * * * * * * * *
I need your help in respect to the question of succession. I’m not looking for any of you to retire and I hope you all live to 100. (In Charlie’s case, 110.) But just in case you don’t, please send me a letter (at home if you wish) giving your recommendation as who should take over tomorrow if you should become incapacitated overnight. These letters will be seen by no one but me unless I’m no longer CEO, in which case my successor will need the information. Please summarize the strengths and weaknesses of your primary candidate as well as any possible alternates you may wish to include. Most of you have participated in this exercise in the past and others have offered your ideas verbally. However, it’s important to me to get a periodic update, and now that we have added so many businesses, I need to have your thoughts in writing rather than trying to carry them around in my memory. Of course, there are a few operations that are run by two or more of you – such as the Blumkins, the Merschmans, the pair at Applied Underwriters, etc. – and in these cases, just forget about this item. Your note can be short, informal, handwritten, etc. Just mark it “Personal for Warren.”
Thanks for your help on all of this. And thanks for the way you run your businesses. You make my job easy.
WEB/db
P.S. Another minor request: Please turn down all proposals for me to speak, make contributions, intercede with the Gates Foundation, etc. Sometimes these requests for you to act as intermediary will be accompanied by “It can’t hurt to ask.” It will be easier for both of us if you just say “no.” As an added favor, don’t suggest that they instead write or call me. Multiply 76 businesses by the periodic “I think he’ll be interested in this one” and you can understand why it is better to say no firmly and immediately.
105
Table of Contents
OPERATING COMPANIES
INSURANCE BUSINESSES
| Company |
Employees | Company |
Employees | |||||||
| Berkshire Hathaway Homestate Companies |
569 | General Re |
2,342 | |||||||
| Berkshire Hathaway Reinsurance Group |
573 | Kansas Bankers Surety |
14 | |||||||
| Boat America |
371 | Medical Protective |
400 | |||||||
| Central States Indemnity |
302 | National Indemnity Primary Group |
410 | |||||||
| GEICO |
24,805 | United States Liability Insurance Group |
558 | |||||||
| Insurance total | 30,344 | |||||||||
NON-INSURANCE BUSINESSES
| Company |
Employees | Company |
Employees | |||||||
| Acme |
1,845 | Kingston (1) |
67 | |||||||
| Adalet (1) |
211 | Kirby (1) |
507 | |||||||
| Altaquip (1) |
326 | Larson-Juhl |
1,644 | |||||||
| Applied Underwriters |
472 | The Marmon Group (4) |
15,987 | |||||||
| Ben Bridge Jeweler |
750 | McLane Company |
14,699 | |||||||
| Benjamin Moore |
2,283 | MidAmerican Energy (2) |
3,491 | |||||||
| Borsheims Jewelry |
165 | MidAmerican Energy Holdings (2) |
27 | |||||||
| Burlington Northern Santa Fe |
38,000 | MiTek Inc. |
1,796 | |||||||
| The Buffalo News |
755 | Nebraska Furniture Mart |
2,562 | |||||||
| Business Wire |
501 | NetJets |
6,238 | |||||||
| CalEnergy (2) |
353 | Northern Natural Gas (2) |
854 | |||||||
| Campbell Hausfeld (1) |
438 | Northern and Yorkshire Electric (2) |
2,289 | |||||||
| Carefree of Colorado (1) |
180 | Northland (1) |
53 | |||||||
| Clayton Homes |
10,439 | PacifiCorp (2) |
3,111 | |||||||
| Cleveland Wood Products (1) |
70 | Pacific Power (2) |
1,153 | |||||||
| CORT Business Services |
2,074 | The Pampered Chef |
760 | |||||||
| CTB International |
1,505 | Precision Steel Warehouse |
172 | |||||||
| Dairy Queen |
2,002 | Richline Group |
1,749 | |||||||
| Douglas/Quikut (1) |
57 | Rocky Mountain Power (2) |
2,078 | |||||||
| Fechheimer Brothers |
595 | Russell (3) |
1,321 | |||||||
| FlightSafety |
4,198 | Other Scott Fetzer Companies (1) |
155 | |||||||
| Forest River |
6,033 | See’s Candies |
3,000 | |||||||
| France (1) |
86 | Shaw Industries |
24,552 | |||||||
| Fruit of the Loom (3) |
30,065 | Stahl (1) |
73 | |||||||
| Garan |
4,330 | Star Furniture |
698 | |||||||
| H. H. Brown Shoe Group |
1,250 | TTI |
2,952 | |||||||
| Halex (1) |
87 | United Consumer Financial Services (1) |
199 | |||||||
| Helzberg’s Diamond Shops |
2,191 | Vanity Fair Brands (3) |
2,435 | |||||||
| HomeServices of America (2) |
2,270 | Wayne Water Systems (1) |
171 | |||||||
| Iscar |
10,393 | Wesco Financial Corp. |
13 | |||||||
| Johns Manville |
6,410 | Western Enterprises (1) |
271 | |||||||
| Jordan’s Furniture |
787 | R. C. Willey Home Furnishings |
2,270 | |||||||
| Justin Brands |
872 | World Book (1) |
177 | |||||||
| Kern River Gas (2) |
157 | XTRA |
480 | |||||||
| Non-insurance total | 230,154 | |||||||||
| Corporate Office | 21 | |||||||||
| 260,519 | ||||||||||
| (1) | A Scott Fetzer Company |
| (2) | A MidAmerican Energy Holdings Company |
| (3) | A Fruit of the Loom, Inc. Company |
| (4) | Approximately 130 manufacturing and service businesses that operate within 11 business sectors. |
106
Table of Contents
| DIRECTORS | OFFICERS | |
|
WARREN E. BUFFETT, Chairman and CEO of Berkshire |
WARREN E. BUFFETT, Chairman and CEO
CHARLES T. MUNGER, Vice Chairman
MARC D. HAMBURG, Senior Vice President and CFO
SHARON L. HECK, Vice President
DANIEL J. JAKSICH, Vice President, Controller
MARK D. MILLARD, Vice President
FORREST N. KRUTTER, Secretary
REBECCA K. AMICK, Director of Internal Auditing | |
|
CHARLES T. MUNGER, Vice Chairman of Berkshire |
||
|
HOWARD G. BUFFETT, President of Buffett Farms |
||
|
STEPHEN B. BURKE, Chief Executive Officer of NBCUniversal, a media and entertainment company. |
||
|
SUSAN L. DECKER, Former President of Yahoo! Inc., an internet company. |
||
|
WILLIAM H. GATES III, Co-Chair of the Bill and Melinda Gates Foundation |
||
|
DAVID S. GOTTESMAN, Senior Managing Director of First Manhattan Company, an investment advisory firm. |
||
|
CHARLOTTE GUYMAN, Former Chairman of the Board of Directors of UW Medicine, an academic medical center. |
||
|
DONALD R. KEOUGH, Chairman of Allen and Company Incorporated, an investment banking firm. |
||
|
THOMAS S. MURPHY, Former Chairman of the Board and CEO of Capital Cities/ABC |
||
|
RONALD L. OLSON, Partner of the law firm of Munger, Tolles & Olson LLP |
||
|
WALTER SCOTT, JR., Chairman of Level 3 Communications, a successor to certain businesses of Peter Kiewit Sons’ Inc. which is engaged in telecommunications and computer outsourcing. |
Letters from Annual Reports (1977 through 2010), quarterly reports, press releases and other information about Berkshire may be obtained on the Internet at www.berkshirehathaway.com.
Table of Contents
BERKSHIRE HATHAWAY INC.
Executive Offices — 3555 Farnam Street, Omaha, Nebraska 68131