Attached files
Table of Contents
UNITED STATES
SECURITIES AND EXCHANGE COMMISSION
Washington, D.C. 20549
FORM 10-K
(Mark One)
| x | ANNUAL REPORT PURSUANT TO SECTION 13 OR 15(d) OF THE SECURITIES EXCHANGE ACT OF 1934 |
For the fiscal year ended December 31, 2010
or
| ¨ | TRANSITION REPORT PURSUANT TO SECTION 13 OR 15(d) OF THE SECURITIES EXCHANGE ACT OF 1934 |
For the transition period from to
Commission File No. 001-32919
Ascent Solar Technologies, Inc.
(Exact name of registrant as specified in its charter)
| Delaware (State or other jurisdiction of |
20-3672603 (I.R.S. Employer | |
| 12300 Grant Street, Thornton, CO (Address of principal executive offices) |
80241 (Zip Code) | |
Registrant’s telephone number, including area code: 720-872-5000
Securities registered pursuant to Section 12(b) of the Act:
| Title of Each Class |
Name of Each Exchange on Which Registered | |
| Common Stock, $0.0001 par value per share Class B Warrants |
The NASDAQ Stock Market LLC |
Securities registered pursuant to Section 12(g) of the Act:
None
Indicate by check mark if the registrant is a well-known seasoned issuer, as defined in Rule 405 of the Securities Act. Yes ¨ No x
Indicate by check mark if the registrant is not required to file reports pursuant to Section 13 or 15(d) of the Exchange Act. Yes ¨ No x
Indicate by check mark whether the registrant (1) has filed all reports required to be filed by Section 13 or 15(d) of the Securities Exchange Act of 1934 during the preceding 12 months (or for such shorter period that the registrant was required to file such reports), and (2) has been subject to such filing requirements for the past 90 days. Yes x No ¨
Indicate by check mark whether the registrant has submitted electronically and posted on its corporate Web site, if any, every Interactive Data File required to be submitted and posted pursuant to Rule 405 of Regulation S-T (§232.405 of this chapter) during the preceding 12 months (or for such shorter period that the registrant was required to submit and post such files). Yes ¨ No ¨
Indicate by check mark if disclosure of delinquent filers pursuant to Item 405 of Regulation S-K (§229.405) is not contained herein, and will not be contained, to the best of registrant’s knowledge, in definitive proxy or information statements incorporated by reference in Part III of this Form 10-K or any amendment to this Form 10-K. ¨
Indicate by check mark whether the registrant is a large accelerated filer, an accelerated filer, a non-accelerated filer, or a smaller reporting company. See the definitions of “large accelerated filer,” “accelerated filer” and “smaller reporting company” in Rule 12b-2 of the Exchange Act.
| Large accelerated filer | ¨ | Accelerated filer | ¨ | |||
| Non-accelerated filer | ¨ (Do not check if a smaller reporting company) | Smaller reporting company | x | |||
Indicate by check mark whether the registrant is a shell company (as defined in Rule 12b-2 of the Act). Yes ¨ No x
As of June 30, 2010, the last business day of the registrant’s most recently completed second fiscal quarter, the aggregate market value of the registrant’s common stock held by non-affiliates was approximately $47.4 million based upon the last reported sale price of the registrant’s common stock on that date as reported by NASDAQ.
As of February 15, 2011, there were 32,291,837 shares of the Company’s common stock issued and outstanding.
DOCUMENTS INCORPORATED BY REFERENCE
Part III incorporates certain information by reference from the registrant’s definitive proxy statement for the 2011 annual meeting of stockholders, which will be filed no later than 120 days after the close of the registrant’s fiscal year ended December 31, 2010.
Table of Contents
ASCENT SOLAR TECHNOLOGIES, INC.
Form 10-K Annual Report
for the Fiscal Year ended December 31, 2010
| Page | ||||||
| 2 | ||||||
| Item 1. | Business | 2 | ||||
| Item 1A. | 11 | |||||
| Item 1B. | 26 | |||||
| Item 2. | 26 | |||||
| Item 3. | 26 | |||||
| Item 4. | 26 | |||||
| 26 | ||||||
| Item 5. | 26 | |||||
| Item 6. | 28 | |||||
| Item 7. | Management’s Discussion and Analysis of Financial Condition and Results of Operations |
28 | ||||
| Item 7A. | 40 | |||||
| Item 8. | 41 | |||||
| Item 9. | Changes in and Disagreements With Accountants on Accounting and Financial Disclosure |
41 | ||||
| Item 9A. | 42 | |||||
| Item 9B. | 42 | |||||
| 43 | ||||||
| Item 10. | 43 | |||||
| Item 11. | 43 | |||||
| Item 12. | Security Ownership of Certain Beneficial Owners and Management and Related Stockholder Matters |
43 | ||||
| Item 13. | Certain Relationships and Related Transactions, and Director Independence |
44 | ||||
| Item 14. | 44 | |||||
| 44 | ||||||
| Item 15. | 44 | |||||
| 45 | ||||||
i
Table of Contents
FORWARD-LOOKING STATEMENTS
This Annual Report on Form 10-K includes “forward-looking statements” that involve risks and uncertainties. Forward-looking statements include statements concerning our plans, objectives, goals, strategies, future events, future net sales or performance, capital expenditures, financing needs, plans or intentions relating to acquisitions, business trends and other information that is not historical information and, in particular, appear under headings including “Management’s Discussion and Analysis of Financial Condition and Results of Operations” and “Business.” When used in this Annual Report, the words “estimates,” “expects,” “anticipates,” “projects,” “plans,” “intends,” “believes,” “forecasts,” “foresees,” “likely,” “may,” “should,” “goal,” “target” and variations of such words or similar expressions are intended to identify forward-looking statements. All forward-looking statements are based upon information available to us on the date of this Annual Report.
These forward-looking statements are subject to risks, uncertainties and other factors, many of which are outside of our control, that could cause actual results to differ materially from the results discussed in the forward-looking statements, including, among other things, the matters discussed in this Annual Report in the sections captioned “Risk Factors” and “Management’s Discussion and Analysis of Financial Condition and Results of Operations.” Factors you should consider that could cause these differences are:
| • | Our limited operating history and lack of profitability; |
| • | Our ability to secure equity or debt or other financing necessary to fund our operations and the acquisition of additional operating capacity; |
| • | Our ability to meet the cost and performance metrics and to implement the production capacity that we have forecasted; |
| • | Our ability to develop demand for, and sales of, our photovoltaic modules and establish strategic relationships with key distribution partners, including original equipment manufacturers, system integrators and distributors; |
| • | Our ability to obtain necessary or desired certifications for our photovoltaic modules; |
| • | Whether we receive timely delivery of production tools from our equipment suppliers; |
| • | Our ability to design, purchase, install, qualify and operate production tools pursuant to our business plan and within budgeted amounts; |
| • | The extent to which we are able to reduce the per watt manufacturing costs of our photovoltaic modules, and the extent to which our competitors are able to do the same with their photovoltaic modules; |
| • | Global demand for electricity and the market for renewable energy, including solar energy; |
| • | The cost-effectiveness of photovoltaic-generated energy relative not only to that generated from conventional sources such as fossil fuels, but also to that generated from other renewable sources which include wind, biomass, geothermal and tidal power; |
| • | The availability of, or changes to, government policies, subsidies and incentives that affect the use or cost of renewable energy; |
| • | The emergence of disruptive or competing technologies in the energy industry; |
| • | Our competitive position and that of our photovoltaic modules relative to others in the photovoltaic and thin-film markets; |
| • | The extent to which our interests align with or deviate from that of Norsk Hydro Produksjon AS, our largest stockholder, and its affiliates; |
| • | Foreign currency exchange fluctuations, political instability in certain foreign markets or the general state of geopolitical affairs; |
1
Table of Contents
| • | The supply and price of equipment, components and raw materials; |
| • | The status of our relationship with ITN Energy Systems, Inc.; |
| • | Our ability to attract and retain key executives and employees; |
| • | Our continued investment in research and development, and our ability to remain competitive through development of new technologies; |
| • | The extent to which we are able to manage the expansion of our operations effectively, both domestically and abroad; |
| • | Commencement of legal proceedings against us or by us, including proceedings relating to environmental matters or intellectual property rights; |
| • | Our ability to expand and protect the intellectual property portfolio that relates to our photovoltaic modules and processes; |
| • | The extent to which we qualify to perform research and development under the federal government’s Small Business Innovation Research program; and |
| • | General economic and business conditions. |
There may be other factors that could cause our actual results to differ materially from the results referred to in the forward-looking statements. We undertake no obligation to publicly update or revise forward-looking statements to reflect subsequent events or circumstances after the date made or to reflect the occurrence of unanticipated events, except as required by law.
References to “we,” “us,” “our,” “Ascent,” “Ascent Solar” or the “Company” in this Annual Report mean Ascent Solar Technologies, Inc.
| Item 1. | Business |
Business Overview
We are a development stage company formed in October 2005 to commercialize flexible photovoltaic (“PV”) modules using proprietary technology. Our technology was initially developed at ITN Energy Systems, Inc. (“ITN”) by our founder and core scientific team beginning in 1994 and subsequently assigned and licensed to us. Our proprietary manufacturing process deposits multiple layers of materials, including a thin-film of highly efficient copper-indium-gallium-diselenide (“CIGS”) semiconductor material, on a flexible, lightweight, plastic substrate and then laser patterns the layers to create interconnected PV cells, or PV modules, in a process known as monolithic integration. We believe that our technology and manufacturing process provides us with significant advantages over both the crystalline silicon (“c-Si”) based PV manufacturers that currently lead the PV market, as well as other thin-film PV manufacturers that use rigid and/or heavier substrate materials such as glass, stainless steel or other metals.
We believe that our technology will provide us advantages in serving the building applied photovoltaic (“BAPV”) and building integrated photovoltaic (“BIPV”) markets, which we expect will be our largest target market, as well as specialty markets like defense and portable power, transportation, and electronic integrated photovoltaic (“EIPV”).
Our thin-film PV modules require less than 1% of the semiconductor material to achieve comparable power output as a c-Si-based PV device. Consequently, we do not face the supply constraints and raw material costs that may affect silicon-based PV manufacturers. Also, we believe that our use of CIGS on a flexible, durable,
2
Table of Contents
lightweight, high-tech plastic substrate will allow for integration of our PV modules into a variety of building materials, electronic products, defense, transportation and space applications, as well as other products and applications that may emerge. We believe that the unique attributes of our materials and manufacturing process flow will enable a reduction in the overall system and installation cost-per-watt ratios. For markets that place a high premium on weight, such as rooftop, defense, space and near-space markets, we believe our materials should provide attractive increases in power-to-weight ratio, and we believe that our materials have higher power-to-area ratios and voltage-to-area ratios than competing flexible PV thin-film technologies. These metrics will be critical as we position ourselves to compete in commercial rooftop applications and high value added markets like defense, transportation, space and EIPV solar module applications where weight is a key consideration. We believe that, when employed on a sufficiently large commercial scale, our large format, roll-to-roll manufacturing process and proprietary monolithic integration techniques will allow us to achieve a per watt manufacturing cost lower than most of our flexible, lightweight, thin-film competitors. At sufficiently large commercial scale production, we believe overall grid parity is possible—i.e., the point at which the system level cost of our PV-generated power is equal to that of retail power distributed from the electric utility grid—in certain geographic markets in the future.
While focused on speed to market, we believe that quality and consistency of our product is paramount to our success in the marketplace. Consequently, we follow a highly disciplined, staged progression based upon the achievement of key milestones and supported by over sixteen years of concerted research and development activity by our scientists. Our progression also takes into account market conditions, as well as financing options. In keeping with our philosophy, we completed construction of our first production line (“FAB1”) in December 2007. In March 2008, we demonstrated initial operating capability (“IOC”) of the FAB1 production line by initiating production trials as an end-to-end integrated process. Early IOC production trials resulted in average thin-film device efficiencies of 9.5% and small area monolithically integrated module efficiencies of over 7.0%. During 2008, optimization trials resulted in thin-film device efficiencies in the 9.5% to 11.5% range and corresponding module efficiencies in the 7.0% to 9.0% range. The test modules measured approximately 15 centimeters wide by 30 centimeters long. During 2008, we focused on testing and qualifying our FAB1 production line in anticipation of commencing production.
During the first quarter of 2009, we began limited production of monolithically integrated flexible CIGS modules on our FAB1 production line and continued to provide sample modules to potential customers and development partners to explore integration of our products into new applications. In June 2009, we announced the fabrication of a five meter long CIGS module, which we believe is the largest monolithically interconnected CIGS module ever produced on polyimide and possibly the largest CIGS module ever produced regardless of construction. Based on internal test and evaluation, this five meter long module weighed approximately two kilograms and produced 123 watts (under standard test conditions) with an aperture area efficiency of 9.1%.
In July 2009, we obtained independent verification by the U.S. Department of Energy’s National Renewable Energy Laboratory (“NREL”) that the modules produced from FAB1 measured 10.4% in conversion efficiency. The modules tested at NREL were approximately 15 centimeters wide by 30 centimeters long and were produced from our FAB1 production line. In October 2009, NREL verified our achievement of a manufacturing milestone of 14.0% cell efficiency from FAB1. We also announced a peak efficiency of 11.7% for CIGS modules manufactured at FAB1. In December 2010, we achieved 12.1% module efficiency on the same form factor.
In August 2009, we completed internal qualification testing of a flexible packaging solution which successfully passed the rigorous standard of one thousand (1,000) hours of damp heat testing (85% relative humidity and 85° C temperature) guideline set forth by IEC 61646 standards for performance and long term reliability of thin-film solar modules. In February 2010, three of our product configurations were certified by an independent laboratory on a variety of United States Department of Defense (“DOD”) rugged standards known as MIL-STD-810G. In October 2010, we completed full external certification under IEC 61646 at an independent laboratory of a two meter long module for BAPV applications. Achieving this certification is required for BIPV/BAPV applications used in commercial, industrial and residential rooftop markets. We also have submitted
3
Table of Contents
two meter and five meter modules for testing under IEC 61646, IEC 61730, and UL 1703, which are certifications of safety standards for flat-plate PV modules intended for installation on or integrated with buildings, or to be freestanding (that is, not attached to buildings), in accordance with applicable electrical and building codes. Certification activities will continue as required as we introduce new products and make significant improvements to our already certified products.
In June 2010, we announced that the Defense Advanced Research Projects Agency (“DARPA”) selected us for an award under the Low-Cost Lightweight Portable Photovoltaics (“PoP”) solicitation. The Company led program, entitled “Flexible High-performance Tandem-junction PV Array”, consists of three gated phases that extend over 54 months. The total contract value is approximately $3.8 million. The goal of PoP is to demonstrate low-cost, lightweight PV that can stand up to battle conditions and environmental extremes while delivering a power conversion efficiency of 20% or greater by the end of the program.
In 2008 we began placing purchase orders for equipment to be installed in our second production facility (“FAB2”) and purchased an existing building in Thornton, Colorado. During 2008 and early 2009, the building was renovated to accommodate our manufacturing requirements. In 2009, we began receiving production equipment in FAB2 and started qualification of the equipment. Throughout 2010, we continued qualification of the equipment in FAB2 and began production of PV modules.
Commercialization and Manufacturing Expansion Plan
We intend to be the first company to manufacture in commercial quantities large, roll-format, PV modules that use CIGS on a flexible, plastic substrate. Our manufacturing expansion plan entails the design, installation, qualification, testing and operation of additional production tools to increase our rated production capacity. In 2010, we had product sales of $811,906.
Approximately 75% of the total equipment planned for delivery into FAB2 had been delivered by December 31, 2010. We exited 2010 at an annual run rate of approximately 2 MW on equipment with a nameplate or nominal capacity of 8 MW per year. Additional equipment deliveries are planned during 2011. We are targeting 6 MW to 10 MW of production in 2011 based on market demand.
During 2010 we applied for funding under the U.S. Department of Energy (“DOE”) Loan Guarantee Program for our planned third production facility (“FAB3”) with a nameplate capacity of 150 MW per year. The DOE reviewed our Part I submission under the Loan Guarantee Application—Innovative Energy Efficiency, Renewable Energy and Advanced Transmission and Distribution Technologies Solicitation No. DE-FOA-0000140, and deemed it responsive to the initial threshold requirements. We completed our Part II submission under the program in December 2010. If our project is approved by the DOE, ground breaking must occur by the federally mandated deadline of September 30, 2011. On February 23, 2011, the DOE informed us that our submission was selected for due diligence review by the DOE. We have no assurances that our project will be approved by the DOE.
We are evaluating the timing of further expansion based on many factors that include demand, market conditions, product certification, availability of financing, technical advances, strategic partnerships and other factors.
Advantages of CIGS on a Flexible Plastic Substrate
Thin-film PV solutions differ based on the type of semiconductor material chosen to act as a sunlight absorbing layer, and also on the type of substrate on which the sunlight absorbing layer is affixed. We believe that we are the only company currently focused on commercial scale production of PV modules using CIGS on a flexible, plastic substrate with monolithic integration. We utilize CIGS as a semiconductor material because, at
4
Table of Contents
the laboratory level, it has a higher demonstrated cell conversion efficiency than amorphous silicon (“a-Si”) and cadmium telluride (“CdTe”). We also believe that CIGS offers other compelling advantages over both a-Si and CdTe, including:
| • | CIGS versus a-Si: Although a-Si, like CIGS, can be deposited on a flexible substrate, its conversion efficiency, which already is generally much lower than that of CIGS, measurably degrades when it is exposed to ultraviolet light, including natural sunlight. To mitigate such degradation, manufacturers of a-Si solar cells are required to implement measures that add cost and complexity to their manufacturing processes. |
| • | CIGS versus CdTe: Although CdTe modules have achieved conversion efficiencies that are generally comparable to CIGS in production, we believe that CdTe has never been successfully applied to a flexible substrate on a commercial scale. We believe that the use of CdTe on a rigid, transparent substrate, such as glass, makes CdTe unsuitable for a number of the applications that we are targeting in the BIPV/BAPV and other markets. We also believe that CIGS can achieve higher conversion efficiencies than CdTe. |
Our choice of substrate material further differentiates us from other thin-film PV manufacturers. We believe that the use of a flexible, lightweight, insulating substrate which is easier to install provides clear advantages for commercial rooftops, higher value-added BIPV/BAPV markets, and other markets where rigid substrates are unsuitable for many applications. We also believe that our use of a flexible, plastic substrate provides us significant cost advantages because it enables us to employ monolithic integration techniques on larger components that we believe are unavailable to manufacturers who use flexible, metal substrates. Accordingly, we are able to significantly reduce part count, thereby eliminating the need for costly back-end assembly of inter-cell connections. As the only company, to our knowledge, focused on the commercial production of PV modules using CIGS on a flexible, plastic substrate with monolithic integration, we believe we have the opportunity to penetrate the BIPV/BAPV, defense, transportation, EIPV, space and other markets with high quality, value-added products.
Competitive Strengths
We believe we possess a number of competitive strengths that provide us with an advantage over our competitors.
| • | We are an early mover in CIGS technology with a proprietary, flexible, lightweight, high efficiency PV thin-film product that positions us to penetrate a wide range of attractive high value-added markets such as BIPV/BAPV, defense, transportation, EIPV, space and other markets. By applying CIGS to a flexible plastic substrate, we have developed a PV module that is efficient, lightweight and flexible, providing unique opportunities for integration into building material products (such as roofing membranes, shingles, siding and facades, metal and composite panels). Commercial rooftops alone are a major segment of the world solar market. The market for electronic components (such as electronic packages, casings, and accessories as well as defense portable power systems and space and near-space solar power application solutions) also may prove to be a significant premium market. Relative to our thin-film competitors, we believe that our early mover advantage in thin-film CIGS on plastic technology provides us with a superior product offering for these strategic market segments. |
| • | We have the ability to manufacture PV modules for different markets and for customized applications without altering our production processes. Our ability to produce PV modules in customized shapes and sizes, or in a variety of shapes and sizes simultaneously, without interrupting our production flow provides us with flexibility in determining target markets and product applications, and allows us to respond quickly to changing market conditions. Many of our competitors are limited by their technology and/or their manufacturing processes to a more restricted set of product opportunities. |
5
Table of Contents
| • | Our integrated, roll-to-roll manufacturing process and proprietary monolithic integration techniques provide us a cost advantage over our competitors. Historically, manufacturers have formed PV modules by manufacturing individual solar cells and then interconnecting them. Our large format, roll-to-roll manufacturing process allows for integrated production. In addition, our proprietary monolithic integration techniques allow us to utilize laser patterning to create interconnects, thereby creating PV modules at the same time we create PV cells. In so doing, we are able to eliminate an entire back end processing step, saving time as well as labor and manufacturing costs relative to our competitors. |
| • | Our strategic relationship with Norsk Hydro provides us with direct access to a potentially large customer base in the global BIPV/BAPV market. Norsk Hydro is a major global supplier of aluminum based building systems, and our relationship provides us with a strong, established development and marketing partner for accessing the BIPV/BAPV market in an accelerated manner. Together with Norsk Hydro, we are developing a product line that would incorporate our PV modules into various Norsk Hydro products such as sun-shading systems, wall systems and facades which generate electricity. |
| • | Our proven research and development capabilities position us to continue the development of next-generation PV modules and technologies. Our ability to produce CIGS-based PV modules on a flexible plastic substrate is the result of a concerted research and development effort that began more than sixteen years ago. We continue to pursue research and development in an effort to drive efficiency improvements in our current PV modules and to work toward next-generation technologies and additional applications. |
| • | Our manufacturing process can be differentiated into two distinct functions, a front end module manufacturing process and a back end packaging process. Our ability to produce finished un-packaged low cost rolls of CIGS material for shipment worldwide to customers for encapsulation and integration into various products enhances our ability to work with partners worldwide. |
Markets and Marketing Strategy
Our target markets include BIPV/BAPV, defense and portable power, transportation, EIPV, and space and near-space.
Both BIPV and BAPV products share a significant advantage over traditional PV systems in that their use results in a significant reduction in balance-of-system (“BOS”) cost. In BIPV applications, solar modules are incorporated directly into building and construction materials at the time of manufacture or by an on-site integrator, whereas in BAPV applications, solar modules are attached to surfaces of existing structures. For BIPV/BAPV applications, we intend to be the supplier of choice by offering high-performance, lightweight, durable and flexible PV modules that can be integrated directly into building material products such as roofing membranes, roofing shingles, siding, facades, shading devices, parking structures, and metal and composite panels. We anticipate that when integrated with our solar modules, traditional building materials will produce electricity from the integrated PV. Commercial rooftop applications may become an important market for the Company’s laminated solar products where we are cooperating with several important strategic partners.
Rooftop applications are particularly attractive for the introduction of PV to grid-tied and off-grid applications as it involves use of underutilized space and results in distributed power that represents a more theft and vandal-resistant power solution. Distributed power solutions promote national security by eliminating centralized power generation systems that provide a high-value target. Rooftop applications do present certain restrictions, however, such as the prohibition of roof penetrations that can result in warranty and liability issues during the life of the roof. Manufacturers of crystalline PV modules and rigid thin-film modules must rely on their balance of systems (i.e., bracketing, ballast in lieu of roof-penetrating fasteners, tracking) to interface to the building. However, many potential sites for rooftop PV systems cannot accommodate either the weight of rigid
6
Table of Contents
glass modules, or the combined weight of these modules with ballast to prevent damage from wind. Thus, by virtue of our reduced weight, high efficiency, and flexible form factor, we can approach this market with a simple, safe, and secure power solution.
The defense and portable power markets are attractive because the value proposition of our products, such as lightweight and power density, provides new solutions into solar blankets and solar tents that can be field deployed for powering the increasing energy requirements for defense applications. By displacing conventional fuels, these customers can reduce cost by utilizing our PV materials where there is no reliably operating electric grid. We intend to continue to develop the existing defense portable power market by developing relationships with key strategic players currently serving this market of existing large defense and governmental contractors. We envision the defense market as one of the key markets for our lightweight portable power products.
We began development of the transportation market segment during 2009, and we believe it could be of high value to the Company. We believe the greatest area for growth is in commercial vehicles and trains. We view the market opportunity in transportation as one that is emerging rapidly and could grow significantly in the coming years. A significant requirement for participation in this market is lightweight and flexible modules that can easily fit to the contours of vehicles. During 2010, we worked closely with several integrators to develop solutions in which we can populate the roof space on vehicles and become a value-added solution to the commercial transportation market.
In EIPV applications, solar modules are either stand alone or are incorporated directly into portable electronic devices or the surface of their accessories. For EIPV, we intend to supply relatively high voltages in small spaces for PV integration directly into electronic packages, casings, and accessories in the consumer electronics market.
In space and near-space market applications, solar PV modules are incorporated into satellites, aircraft and/or high altitude air ships. In the space and near-space markets we believe that our power producing modules are uniquely suited for applications requiring mobility, durability and lightweight. For these markets, we intend to use our durable and lightweight technology to provide both higher value and more capable solutions at cost effective system prices. We hope to develop customers in these markets based upon strategic relationships with both small and large players in those application areas. We expect the space satellite and the near-space markets to evolve more gradually than the terrestrial market principally due to the higher degree of product qualifications and flight testing that will be required. We anticipate that our pathway to the space and near-space markets will be through development of modules for experimental space qualification tests and then actual flight experiments with governmental customers, followed by full scale flight arrays on operational systems once the technology and arrays have been fully space qualified. We intend to pursue these opportunities because we believe that the space and near-space markets place a premium on performance and offer a correspondingly high-value opportunity for our technology.
Our marketing and distribution strategy is based on the formation of strategic relationships with key partners, including original equipment manufacturers (“OEMs”), system integrators, and resellers and distributors, who deal directly with manufacturers, installers, contractors or end-users in our target markets.
We continue to supply our strategic partners with PV modules to support our partners’ development, testing and certification of new integrated PV products. This should enable them to identify and cultivate promising market segments. By cooperating with our strategic partners in this way, we hope to create sufficient and consistent demand for our PV modules. We envision that we ultimately will serve as a provider of high value thin-film solar components to our strategic partners and resellers or integrators, who will be solely responsible for the marketing, sales and distribution of their integrated building, defense, transportation, electronics or space applications. We intend to position ourselves as a leading manufacturer and supplier of high value lightweight, durable, and flexible PV components to these unique markets. By capitalizing on the lightweight features of our thin-film PV products, we believe that we can reduce overall system installation and logistics costs, making our PV solutions more attractive to our strategic partners and channels, and their customers.
7
Table of Contents
Although we intend to target a number of markets concurrently, our emphasis will depend on various factors that include, demand, market conditions, product certification, availability of financing, and technical advances. We believe that we will be well positioned, for the reasons contained in this Annual Report, to compete in the BIPV/BAPV market in the longer term after external certification of our product, as we strive to expand production capacity and reduce production costs.
Manufacturing and Manufacturing Strategy
We manufacture our products by affixing a thin CIGS layer to a flexible, plastic substrate, and we use proprietary monolithic integration techniques that enable us to form complete PV modules without engaging in costly back end assembly of inter-cell connections. Traditional PV manufacturers assemble PV modules by bonding or soldering discrete PV cells together. This manufacturing step typically increases manufacturing costs and at times proves detrimental to the overall yield and reliability of the finished product. By eliminating this added step using our proprietary monolithic integration techniques, we believe that we can achieve cost savings in, and increase the reliability of, our PV modules. We also use a large format, roll-to-roll manufacturing process that permits us to fabricate our flexible PV modules in an integrated sequential operation.
During the first quarter of 2009, we began limited production of monolithically integrated flexible CIGS modules from our FAB1 production line. In mid 2010 we began initial production of monolithically integrated flexible CIGS modules from our FAB2 production plant in Thornton, Colorado.
The timing and amount of our production capacity and actual output will depend on a number of technical factors such as module efficiency, production yield and throughput. Our projections of annual rated production capacity have been and continue to be based on assumptions about these and other factors and we periodically revisit and revise these assumptions to account for realized rates and measurements on our production lines. To date, our realized module efficiencies have exceeded expectations. Future production yield and throughput in FAB2 will depend on our continuing efforts to successfully ramp up the production equipment.
We are continuing the process of qualifying the remaining production tools that have been delivered into FAB2. We have additional tools on order that have not been delivered into FAB2. The output of FAB2 in 2011 will depend on product demand, market conditions, technical factors, and the timing of the final qualification and delivery of tools into FAB2. We currently expect to bring approximately 20 MW of rated capacity online in 2011. We intend to continue to optimize our manufacturing processes including throughput, efficiency and yield to improve product performance and reduce manufacturing costs. We also intend to identify and evaluate suitable locations for new production lines for future expansion, domestically and abroad, that we believe will best serve our target markets and customers for future expansion.
Competition
The landscape of thin-film manufacturers encompasses a broad mix of technology platforms at various stages of development, and consists of a large and growing number of medium and small companies. Some of the established c-Si manufacturers have also pursued thin-film technologies, either in conjunction with their crystalline efforts, or more recently as a way to diversify their technology portfolios and insulate themselves from silicon supply shocks.
Two of the largest thin-film PV manufacturers are First Solar, Inc. (“First Solar”) and Energy Conversion Devices, Inc. (“Energy Conversion”). First Solar manufactures PV modules by depositing CdTe onto rigid glass plates using monolithic integration techniques similar to ours. Relative to our lightweight, flexible plastic substrates, PV modules using glass substrates are rigid and heavy, and as a result, their size is limited to a form factor that can easily be handled by installers. First Solar therefore primarily serves commodity module markets such as large scale, grid-connected solar power projects where their weight and form factor can more easily be accommodated. Energy Conversion manufactures thin-film a-Si cells on flexible metal foil. These cells must be
8
Table of Contents
individually assembled in series and parallel to form an integrated module similar to how c-Si products are manufactured. We believe the additional integration steps required to produce such a-Si modules add significant weight and cost and that a-Si does not offer the same efficiency potential as CIGS. Both Energy Conversion and First Solar are established market leaders in the manufacture of thin-film photovoltaic technologies and have access to more capital and resources than us.
Competitors currently developing or selling CIGS-based PV modules include AVANCIS GmbH & Co. KG, Global Solar Energy, Inc., HelioVolt Corporation, MiaSolé, NanoSolar, Inc., Solyndra, Solarion, Solar Frontier, SoloPower, Inc., Showa Shell and Würth Solar GmbH & Co. A number of manufacturers that traditionally have manufactured and sold c-Si-based modules have entered, or in the future may enter, the market for thin-film PV modules, and potentially, CIGS-based PV modules. These efforts have been initiated both through internal development and the acquisition of external companies or the purchase of turnkey solutions offered by PV equipment providers.
The market for PV products is dominated by large manufacturers of c-Si technology. In 2009, the five largest of these manufacturers included: Q-cells SE (Germany), Suntech Power Holdings Co., Ltd. (China), Yingli Green Energy Holding Co. Ltd. (China), Sharp (Japan), and JA Solar Holdings Co., Ltd. (China). We anticipate that while these leaders may continue to dominate the market for several years with their silicon-based products, thin-film manufacturers will begin to capture an increasingly larger share of the market. In 2010, the largest manufacturer of PV modules was First Solar, a thin-film manufacturer.
We believe that our modules offer unique advantages. Our modules have no glass, thus have potentially lower installed balance of systems costs. We use monolithic integration which does not require the expensive back end process of wiring cells into modules. We believe that our features combine low cost and flexibility for monolithically integrated lightweight flexible modules suitable for many market sectors with particular application to rooftops.
Research and Development and Intellectual Property
We intend to continue to invest in research and development in order to provide near-term improvements to our manufacturing process and products, as well as to identify next-generation technologies relevant to both our existing and potential new markets. During 2010, 2009 and 2008 we incurred approximately $24.4 million, $15.5 million and $10.1 million, respectively, in research and development costs.
Our technology was initially developed at ITN by our founder and core scientific team beginning in 1994. In early 2006, ITN assigned to us certain CIGS PV-specific technologies, and granted to us a perpetual, exclusive, royalty-free, worldwide license to use, in connection with the manufacture, development, marketing and commercialization of CIGS PV to produce solar power, certain of ITN’s existing and future proprietary process and control technologies that, although non-specific to CIGS PV, we believe will be useful in our production of PV modules for our target markets. ITN retained the right to conduct research and development activities in connection with PV materials, and we agreed to grant a license back to ITN of improvements to the licensed technologies and intellectual property that are outside of the CIGS PV field.
We protect our intellectual property through a combination of trade secrets and patent protections. We own the following patents and published patent applications:
| 1. | “Apparatus and method of production of thin-film photovoltaic modules” (US Patent No. 7,271,333) (issued September 18, 2007) |
| 2. | “Flexible Photovoltaic Array With Integrated Wiring And Control Circuitry, And Associated Methods” (US Patent No. 7,812,247) (issued—October 12, 2010) (co-owned with PermaCity Corporation) |
| 3. | “Flexible High-Voltage Adaptable Current Photovoltaic Modules and Associated Methods” (US—11/877,632) (filed October 23, 2007) (co-owned with PermaCity Corporation) |
9
Table of Contents
| 4. | “Array of Monolithically Integrated Thin-film Photovoltaic Cells and Associated Methods” (PCT/US08/67772; US—12/143,713) (filed June 20, 2008) |
| 5. | “Methods for Fabricating p-Type Cadmium Selenide” (PCT/US08/70240) (filed July 16, 2008) |
| 6. | “Hybrid Multi-Junction Photovoltaic Cells and Associated Methods” (PCT/US08/70239; US—12/174,626) (filed July 16, 2008) |
In addition, we have five unpublished patent applications in related areas.
We have a non-exclusive, royalty-bearing license from the University of Delaware’s Institute of Energy Conversion for U.S. Patent Nos. 6,310,281, 6,372,538, 6,537,845 and 6,562,405, as well as U.S. patent application serial No. 60/620,352. The agreement requires us to use commercially reasonable efforts to practice the licensed patents, and we agree not to assert any rights in our improvements to the licensed patents against the University of Delaware and its other licensees and their customers. These patents and patent applications relate to the fabrication of CIGS on flexible plastic substrates, the use of laser patterning and thin-film deposition during the fabrication of flexible monolithically integrated CIGS PV devices and certain process steps that we may use during the manufacturing process.
Suppliers
We rely on several unaffiliated companies to supply certain raw materials used during the fabrication of our PV modules. We acquire these materials on a purchase order basis and do not have long term contracts with the suppliers, although we may enter into such contracts in the future. We currently acquire all of our high temperature plastic from one supplier, although alternative suppliers of similar materials exist. We purchase component molybdenum, copper, indium, gallium, selenium and indium tin oxides from a variety of suppliers. We also currently are in the process of identifying and negotiating arrangements with alternative suppliers of materials in the United States and Asia. The manufacturing equipment and tools used in our production process have been purchased from various suppliers in Europe, the United States and Asia. Although we have had good relations with our existing equipment and tools suppliers, we intend to monitor and explore opportunities for developing alternative sources to drive our manufacturing costs down.
Employees
As of December 31, 2010, we had 117 employees.
Company History
We were formed in October 2005 from the separation by ITN of its Advanced Photovoltaic Division and all of that division’s key personnel and core technologies. ITN, a private company incorporated in 1994, is an incubator dedicated to the development of thin-film, PV, battery, fuel cell and nano technologies. Through its work on research and development contracts for private and government entities, ITN developed proprietary processing and manufacturing know-how applicable to PV products generally, and to CIGS PV products in particular. ITN established the Company to commercialize its investment in CIGS PV technologies. In January 2006, ITN assigned to us all its CIGS PV technologies and trade secrets and granted to us a perpetual, exclusive, royalty-free worldwide license to use certain of ITN’s proprietary process, control and design technologies in the production of CIGS PV modules. Upon receipt of the necessary government approvals in January 2007, ITN assigned government funded research and development contracts to us and also transferred the key personnel working on the contracts to us. Today, ITN still provides us with a very limited amount of technical services. ITN is wholly owned by Inica, Inc. (“Inica”). Dr. Mohan Misra, former Chairman of our Board of Directors and formerly our Chief Strategy Officer, and an immediate family member own all of the outstanding shares of Inica.
10
Table of Contents
Corporate Information
We were incorporated under the laws of Delaware in October 2005. Our principal business office is located at 12300 Grant Street, Thornton, Colorado 80241, and our telephone number is (720) 872-5000. Our website address is www.ascentsolar.com. Information contained on our website or any other website does not constitute, and should not be considered, part of this Annual Report.
Available Information
We file with the Securities and Exchange Commission (“SEC”) our annual report on Form 10-K, quarterly reports on Form 10-Q, current reports on Form 8-K and all amendments to those reports, proxy statements and registration statements. You may read and copy any material we file with the SEC at the SEC’s Public Reference Room at 100 F Street, NE, Washington, D.C. 20549. You may also obtain information on the operation of the Public Reference Room by calling the SEC at 1-800-SEC-0330. In addition, the SEC maintains an internet site at http://www.sec.gov that contains reports, proxy and information statements, and other information regarding issuers, including us, that file electronically. We make available free of charge on or through our website at www.ascentsolar.com our annual reports on Form 10-K, quarterly reports on Form 10-Q, current reports on Form 8-K and amendments to these reports filed or furnished pursuant to Section 13(a) or 15(d) of the Exchange Act as soon as reasonably practicable after we file these materials with the SEC.
| Item 1A. | Risk Factors |
The risks included here are not exhaustive or exclusive. Other sections of this Annual Report may include additional factors which could adversely affect our business, results of operations and financial performance. We operate in a very competitive and rapidly changing environment. New risk factors emerge from time to time, and it is not possible for management to predict all such risk factors, nor can it assess the impact of all such risk factors on our business or the extent to which any factor, or combination of factors, may cause actual results to differ materially from those contained in any forward-looking statements. Given these risks and uncertainties, investors should not place undue reliance on forward-looking statements as a prediction of actual results.
Risks Relating to Our Business
We have a limited history of operations, have not generated significant revenue from operations and have had limited production of our PV modules.
We have a limited operating history and have generated limited revenue from operations. Our plans call for expansion of production capacity, but we do not expect to achieve large scale production from FAB2 until the second half of 2011. Our ability to achieve our business, commercialization and expansion objectives will depend on a number of factors, including whether:
| • | we successfully ramp up commercial production on the equipment installed and to be installed in FAB2; |
| • | our products are successfully and timely certified for use in our target markets; |
| • | we successfully qualify production tools to achieve the efficiencies, throughput and yield necessary to reach our cost targets as we expand our rated production capacity; |
| • | the cost models on which we intend to rely for the manufacture of our PV modules prove accurate; |
| • | we raise sufficient capital to expand our total rated capacity to a level that will enable us to reach the economies of scale we believe necessary to achieve profitability; |
| • | we receive timely delivery of production tools from our equipment suppliers; |
11
Table of Contents
| • | we effectively manage the planned expansion of our operations; and |
| • | we successfully develop and maintain strategic relationships with key partners, including OEMs, system integrators and distributors, who deal directly with end-users in our target markets. |
Each of these factors is critical to our success, and accomplishing each of these tasks may take longer or cost more than expected, or may never be accomplished. It also is likely that problems that we cannot now anticipate will arise. If we cannot overcome these problems, our business, results of operations and financial condition could be materially and adversely affected.
We have to date incurred net losses and may be unable to generate sufficient sales in the future to become profitable.
We incurred a net loss of $31.2 million for the year ended December 31, 2010 and reported an accumulated deficit of $77.3 million as of December 31, 2010. We expect to incur net losses for the foreseeable future. Our ability to achieve profitability depends on a number of factors, including the growth rate of the solar energy industry, market acceptance of thin-film and other PV modules, the competitiveness of our PV modules and our ability to increase production volumes. If we are unable to generate sufficient revenue to achieve profitability and positive cash flows, we might be unable to satisfy our commitments and may have to discontinue operations.
Our business is based on a new and unproven technology, and if our PV modules or processes fail to achieve the performance and cost metrics that we expect, then we may be unable to develop demand for our PV modules and generate sufficient revenue to support our operations.
Our CIGS on flexible plastic substrate technology is a new and unproven technology in commercial scale production. Our business plan and strategies assume that we will be able to achieve certain milestones and metrics in terms of throughput, uniformity of cell efficiencies, yield, encapsulation, packaging, cost and other production parameters. We cannot assure you that our technology will prove to be commercially viable in accordance with our plan and strategies. Further, we may experience operational problems with such technology after its commercial introduction that could delay or defeat the ability of such technology to generate revenue or operating profits. If we are unable to achieve our targets on time and within our planned budget, then we may not be able to develop adequate demand for our PV modules, and our business, results of operations and financial condition could be materially and adversely affected.
Our failure to further refine our technology and develop and introduce improved PV products could render our PV modules uncompetitive or obsolete and reduce our net sales and market share.
Our success requires that we invest significant financial resources in research and development to keep pace with technological advances in the solar energy industry. However, research and development activities are inherently uncertain, and we could encounter practical difficulties in commercializing our research results. Our expenditures on research and development may not be sufficient to produce the desired technological advances, or they may not produce corresponding benefits. Our PV modules may be rendered obsolete by the technological advances of our competitors, which could harm our results of operations and adversely impact our net sales and market share.
Failure to expand our manufacturing capacity successfully would adversely impact our ability to sell PV modules into our target markets and would materially and adversely affect our business, results of operations and financial condition.
Our growth plan calls for the installation and operation of additional production tools to achieve the manufacturing capacities and cost efficiencies necessary to compete in our target markets. The successful completion and operation of future production tools will require substantial engineering resources and is subject to significant risks, including risks of cost overruns and delays, risks that we may not be able to successfully acquire, install, combine or operate the equipment needed, or the possibility that one or more of the production
12
Table of Contents
tools may never be qualified or become operational. Furthermore, we may never be able to operate our production processes in high volume or at the volumes projected, make planned process and equipment improvements, attain projected manufacturing yields or desired annual capacity, obtain timely delivery of production tools, obtain on reasonable terms adequate facilities in which to install the production tools, or hire and train the additional employees and management needed to operate and maintain the production tools. Failure to meet these objectives on time and within our planned budget could materially and adversely affect our business, results of operations and financial condition.
We may be unable to manage the expansion of our operations effectively.
We will need to significantly expand our operations in order to reduce the incremental manufacturing costs of our PV modules through economies of scale, secure contracts of commercially material amounts with reputable customers and capture a meaningful share of our target markets. To manage the rapid expansion of our operations, we will be required to improve our operational and financial systems, procedures and controls and expand, train and manage our growing employee base. Our management team will also be required to maintain and cultivate our relationships with customers, suppliers and other third parties and attract new customers and suppliers. In addition, our current and planned operations, personnel, facility size and configuration, systems and internal procedures and controls might be inadequate or insufficient to support our future growth. If we cannot manage our growth effectively, we may be unable to take advantage of market opportunities, execute our business strategies or respond to competitive pressures, resulting in a material and adverse effect to our business, results of operations and financial condition.
Failure to receive timely delivery of production tools from our equipment suppliers could delay our planned expansion of manufacturing capacity and materially and adversely affect our results of operations and financial condition.
Although a significant amount of the production tools for FAB2 have been delivered, our planned expansion of manufacturing capacity depends on the timely delivery of production tools from our equipment suppliers and our good working relations with those suppliers. We cannot be certain that the equipment orders we place with these suppliers will be fulfilled as we expect or in a timely manner, or that we can preserve good working relationships, especially as we adjust delivery of outstanding orders. If delivery of the remaining production tools is not made on schedule or at all, then we might be unable to carry out our manufacturing expansion plans, produce PV modules in the volumes and at the times that we expect or generate sufficient revenue from operations, and our business, results of operations and financial condition could be materially and adversely affected. In addition, the production tools set for FAB2 are an enhanced version of the FAB1 tools. There are differences in the tools and these differences may cause additional qualification time which could affect the timing of the production from FAB2. In addition, certain process steps in our manufacturing process have machinery that is currently purchased from a single vendor. If we are unable to purchase certain equipment from a single source vendor, our operations or our expansion plans could be negatively affected.
Our plans for an additional production facility, FAB3, contemplate the incorporation of additional advances in equipment design. If the planned changes to this equipment are not achievable by our equipment suppliers or take longer to implement than planned, our timing for FAB3 could be delayed or may not occur at all.
We depend on a limited number of third party suppliers for key raw materials, and their failure to perform could cause manufacturing delays and impair our ability to deliver PV modules to customers in the required quality and quantity and at a price that is profitable to us.
Our failure to obtain raw materials and components that meet our quality, quantity and cost requirements in a timely manner could interrupt or impair our ability to manufacture our PV modules or increase our manufacturing cost. Most of our key raw materials are either sole-sourced or sourced by a limited number of third party suppliers. As a result, the failure of any of our suppliers to perform could disrupt our supply chain and
13
Table of Contents
impair our operations. Many of our suppliers are small companies that may be unable to supply our increasing demand for raw materials as we implement our planned expansion. We may be unable to identify new suppliers in a timely manner or on commercially reasonable terms. Raw materials from new suppliers may also be less suited for our technology and yield PV modules with lower conversion efficiencies, higher failure rates and higher rates of degradation than PV modules manufactured with the raw materials from our current suppliers.
Our planned capacity expansion and continuing operations will likely require additional capital which we may not be able to obtain on favorable terms, if at all or without dilution to our stockholders.
Our planned capacity expansion and continuing operations will likely require additional capital. We currently are unable to determine what forms of financing, if any, will be available to us. If we raise additional funds through the issuance of equity or convertible debt securities, the percentage ownership of our existing stockholders could be significantly diluted, and these newly issued securities may have rights, preferences or privileges senior to those of existing stockholders. If we raise additional funds through debt financing, which may involve restrictive covenants, our ability to operate our business may be restricted. We cannot assure you that additional financing will be available on terms favorable to us, or at all. If adequate funds are not available or are not available on acceptable terms, if and when needed, our ability to fund our operations, take advantage of unanticipated opportunities, develop or enhance our products, expand capacity or otherwise respond to competitive pressures could be significantly limited, and our business, results of operations and financial condition could be materially and adversely affected.
In addition, the terms of a loan we obtained from the Colorado Housing and Finance Authority (“CHFA”) in connection with our purchase and improvement of our Thornton, Colorado facility contain covenants that limit our ability, without the consent of CHFA, to create or incur additional indebtedness (other than obligations created or incurred in the ordinary course of business); merge or consolidate with any other entity; or make loans or advances to our officers, shareholders, directors or employees. The presence of these negative covenants gives CHFA the ability to bar us from engaging in certain transactions in the future that we may determine are necessary or advisable to meet our business objectives, including debt offerings and acquisitions of or by other companies. If CHFA were to withhold its written consent under these or other circumstances, we could be forced to prepay such loans at a premium, which could adversely affect our business, results of operations and financial condition.
Future sales or the potential for future sales of our securities may cause the trading price of our common stock to decline and could impair our ability to raise capital.
Sales of a substantial number of shares of our common stock or other securities in the public markets, or the perception that these sales may occur, could cause the market price of our common stock or other securities to decline and could materially impair our ability to raise capital through the sale of additional securities. A large number of our outstanding shares are not registered under the Securities Act of 1933, as amended. If and when these shares are registered or become eligible for sale to the public market, the market price of our common stock could decline.
We currently have certified a limited number BIPV/BAPV PV modules and have recorded limited sales of such products; further, we expect that significant PV module sales will not occur for some time.
In 2010 an independent laboratory certified certain one of our prototype products under the IEC61646 standards. The successful conclusion of this testing established the viability of a flexible packaging solution that will endure over a long period of time. Certain BIPV/BAPV applications require certification as a prerequisite to sales of the product. We are in the process of obtaining certifications where required on our products and product families. Delays or obstacles in achieving these certifications could negatively impact our revenue of profitability. In addition, as we develop new products and product families, new certifications will be required. Delays in obtaining these certifications could have a negative impact on our financial results.
14
Table of Contents
Because we do not expect to achieve large scale commercial production in FAB2 until the second half of 2011 and because we believe additional PV modules will need to be certified in order for them to be commercially viable for sales into the BIPV/BAPV markets, it will be months, if ever, before we record major BIPV/BAPV module sales. We expect that it will be some time before we can determine whether our expectations relating to our products and their acceptance into BIPV/BAPV markets are confirmed. Further, because we will be required to invest substantial resources in pursuing our target markets in advance of any major revenue stream that may result from such investments, an unanticipated or longer than expected delay of revenue ramp-up could put a strain on our resources, adversely affecting our business, results of operations and financial condition, and could require us to seek additional capital.
If we are unable to find technologically satisfactory and economically viable packaging solutions for our products for use in target applications or markets, our business and results of operations may be materially and adversely affected.
In order to be used for a particular application or in a particular market, our PV modules must be packaged in a way that satisfies the environmental and usage demands or certification requirements of the application or market. For example, the BIPV/BAPV market typically requires certain independent certifications, and a demonstration that the product can survive designated adverse weather and other environmental conditions for an anticipated lifecycle of twenty to twenty-five years. We have several types of packaging that are in various states of testing, but until such time as cost-effective and technologically satisfactory solutions have been demonstrated over a period of time, our sales and revenue into those affected markets may be materially limited or negatively affected.
A failure or unanticipated delay in securing any necessary or desired certification for our PV modules from government or regulatory organizations could impair sales of our PV modules and materially and adversely affect our results of operations and financial condition.
In order for our PV modules to be commercially sold for use in certain target markets, particularly BIPV/BAPV, they must first be certified by certain government or regulatory organizations, such as Underwriters Laboratory (“UL”) and Technischer Überwachungs-Verein (“TÜV”). We believe that in most cases, these certifications would be sought by us and, in other cases, by our customers. A failure or unanticipated delay in securing any necessary or desired certification for our PV modules could impair sales of our PV modules and materially and adversely affect our business, results of operations and financial condition.
Our PV modules may never gain sufficient market acceptance, in which case we would be unable to sell our PV modules or achieve profitability.
Demand for our PV modules may never develop sufficiently, and our PV modules may never gain market acceptance, if we fail to produce PV modules that compare favorably against competing products on the basis of cost, quality, weight, efficiency and performance. Demand for our PV modules also will depend on our ability to develop and maintain successful relationships with key partners, including OEMs, system integrators, value added resellers and distributors. If our PV modules fail to gain market acceptance as quickly as we envision or at all, our business, results of operations and financial condition could be materially and adversely affected.
We are targeting emerging markets for a significant portion of our planned product sales. These markets are new and may not develop as rapidly as we expect, or may not develop at all.
Our target markets include BIPV/BAPV, defense and portable power, transportation, EIPV, and space and near-space. Although certain areas of the BIPV/BAPV market have started to develop, we believe this market, as well as the markets for portable power, transportation and EIPV applications are in their infancy. We believe these markets have significant long term potential, however, some or all of these markets may not develop and emerge as we expect. If the markets do develop as expected, there may be other PV products that could provide a
15
Table of Contents
superior product or a comparable product at lower prices than our products. If these markets do not develop as we expect, or if competitors are better able to capitalize on these markets our revenues and product margins may be negatively affected.
Large scale BIPV/BAPV may require third party financing. Third party financing often requires certain “bankability” standards for the PV supplier. We may be unable to meet these standards.
Banks and other entities providing financing for solar energy projects endeavor to reduce risk on these projects by evaluating solar product quality, completion likelihood, power purchaser credit worthiness, project model quality, and environmental factors. Solar panels are typically the highest cost and most important components of the project cost. For most financing models, the solar modules must have strong power output for 20 years or longer. Companies providing traditional solar modules, or companies with a longer track record with their products may be deemed the lowest risk, whereas, thin-film products, with the exception of First Solar’s product may be deemed higher risk due to product immaturity. In some cases, third party insurance indemnification can be used to address this risk. Our limited operating history, the newness of our products, or our financial strength may not be as strong as our potential competitors, which may reduce the likelihood of project finance support from banks for projects involving our products resulting in our inability to sell our products into certain solar installations, which would negatively affect our revenue and profitability.
Failure to consummate strategic relationships with key partners in our various target market segments, such as portable power applications for defense and governmental agencies or space and near-space high value added solar applications markets as well as the BIPV/BAPV, transportation, and EIPV markets, and the respective implementations of the right strategic partnerships to enter these various specified markets, could adversely affect our projected sales, growth and revenues.
We intend to sell thin-film PV modules for use in BIPV/BAPV, defense and portable power systems, transportation, EIPV, and space and near-space solar panel applications. Our marketing and distribution strategy is to form strategic relationships with distributors and value added resellers to provide a foothold in these target markets. If we are unable to successfully establish working relationships with such market participants or if, due to cost, technical or other factors, our PV modules prove unsuitable for use in such applications; our projected revenues and operating results could be adversely affected. Further, to the extent that we are able to establish strategic relationships with key partners and distributors, those relationships may be on a non-exclusive basis (for example, our strategic relationship with Norsk Hydro is non-exclusive), which means that our partners are not obligated to use us as their sole source of PV modules, and may instead choose to use the products of our competitors. Any such reduction in demand for our PV modules may have a material adverse effect on our revenues, results of operations and financial condition.
If sufficient demand for PV solutions does not develop or takes longer to develop than we anticipate, we may be unable to grow our business, generate sufficient revenue to attain profitability or continue operations.
The solar energy industry is at a relatively early stage of development, and the extent to which PV modules, including our own, will be widely adopted is uncertain. If PV technology proves unsuitable for widespread adoption or if demand for PV modules fails to develop sufficiently, we may be unable to grow our business, generate sufficient sales to attain profitability or continue operations. Many factors, many of which are outside of our control, may affect the viability of widespread adoption of PV technology and demand for PV modules, including:
| • | the cost effectiveness of PV modules and installed PV systems relative to other renewable energy sources, such as wind, geothermal, tidal power and other PV technologies; |
| • | the cost effectiveness of PV modules and installed PV systems relative to conventional carbon based and other energy sources, such as coal, oil, natural gas and nuclear, and whether the levelized cost of PV can approach that of these conventional energy sources; |
16
Table of Contents
| • | whether PV-generated power reaches grid parity in the geographic markets where our products will be used; |
| • | the availability and amount of government subsidies and incentives to support development of the solar energy industry; |
| • | the deregulation of the electric power industry and the broader energy industry; |
| • | the emergence of other disruptive technologies in the energy industry; |
| • | the ease with which PV solutions can penetrate and adapt to existing energy industry infrastructure; |
| • | the availability of raw materials used in the manufacture of PV products; and |
| • | availability of capital to fund development of technology in the solar energy market. |
We face intense competition from manufacturers of c-Si-based PV modules, other manufacturers of thin-film PV modules and other companies in the solar energy industry.
The solar energy and renewable energy industries are both highly competitive and continually evolving as participants strive to distinguish themselves within their markets and compete with the larger electric power industry. We believe that our main sources of competition are c-Si PV manufacturers, other thin-film PV manufacturers and companies developing other solar solutions, such as solar thermal and concentrated PV technologies.
The thin-film component of the industry is largely made up of a broad mix of technology platforms at various stages of development, and consists of a large and growing number of medium and small companies. Two of the largest thin-film PV manufacturers are First Solar and Energy Conversion. First Solar manufactures PV modules using CdTe affixed to glass. Energy Conversion manufactures PV modules using a-Si affixed to flexible metal foil. Competitors currently developing or selling CIGS-based PV modules include AVANCIS GmbH & Co. KG, Global Solar Energy, Inc., HelioVolt Corporation, Honda Soltec Co. Ltd., MiaSolé, NanoSolar, Inc., Solibro GmbH, Solyndra, Inc., Solar Frontier, SoloPower, Inc. and Würth Solar GmbH & Co. We believe that a number of manufacturers that traditionally have manufactured and sold c-Si-based modules have entered, or in the future may enter, the market for thin-film PV modules and, potentially, CIGS-based PV modules.
Many of our existing and potential competitors have substantially greater financial, technical, manufacturing and other resources than we do. A competitor’s greater size provides them with a competitive advantage because they often can realize economies of scale and purchase certain raw materials at lower prices. Many of our competitors also have greater brand name recognition, established distribution networks and large customer bases. In addition, many of our competitors have well-established relationships with our current and potential partners and distributors and have extensive knowledge of our target markets. As a result of their greater size, these competitors may be able to devote more resources to the research, development, promotion and sale of their products or respond more quickly to evolving industry standards and changes in market conditions than we can. Our failure to adapt to changing market conditions and to compete successfully with existing or future competitors could materially and adversely affect our business, results of operations and financial condition.
A significant decrease in the price of c-Si-based PV modules could lead to pricing pressures on PV modules generally and force us to reduce the sales price of our PV modules.
During 2010 there was a significant decrease in the prices of c-Si-based PV modules. This led to pricing pressures on PV modules generally. In the face of such current and future downward pricing pressures, we might be forced to reduce the sales prices of our PV modules, which, absent a commensurate decrease in our manufacturing costs, could materially and adversely affect our results of operations and financial condition and prevent us from achieving profitability.
17
Table of Contents
Problems with product quality or performance may cause us to incur warranty expenses, damage our market reputation and prevent us from maintaining or increasing our market share.
We do not have sufficient life cycle data for our thin-film PV modules to reliably predict their lifespan in the field. Pending collection of such data over time, we may not be able to offer customers warranty terms equivalent to those of our competitors, which may adversely impact sales or market acceptance of our PV modules. Further, even if we offer warranty terms equivalent to those of our competitors, at this time we cannot guarantee that our PV modules will perform as expected during the lifespan that our customers will expect. If our PV modules fail to perform as expected while under warranty, or if we are unable to support the warranties, sales of our PV modules may be adversely affected or our costs may increase, and our business, results of operations and financial condition could be materially and adversely affected.
We may also be subject to warranty or product liability claims against us that are not covered by insurance or are in excess of our available insurance limits. In addition, quality issues can have various other ramifications, including delays in the recognition of revenue, loss of revenue, loss of future sales opportunities, increased costs associated with repairing or replacing products, and a negative impact on our goodwill and reputation. The possibility of future product failures could cause us to incur substantial expenses to repair or replace defective products. Furthermore, widespread product failures may damage our market reputation and reduce our market share and cause sales to decline.
If the supply of PV modules exceeds the demand for those modules, then we may be forced to reduce the price of our PV modules in order to compete effectively.
Some industry reports forecast overcapacity in the PV module market in ensuing years. In an overcapacity scenario, the supply of PV modules by manufacturers would outstrip demand for those products. If either the overall PV module market or our target markets encounter an overcapacity scenario, we may be forced to scale back production or reduce the price of our PV modules in order to generate sales. In either case, our business, results of operations and financial condition could be materially and adversely affected.
Reduced growth in or the reduction, elimination, modification or expiration of government subsidies and economic incentives for solar electricity applications could reduce demand for our products and solar PV products generally.
National, regional and local governmental bodies in many countries, most notably Germany, Italy, Spain, France, South Korea, Japan, Canada and the United States, have provided support in the form of feed-in tariffs, rebates, tax write-offs and other incentives to end-users, distributors, system integrators and manufacturers of PV products. If any of these subsidies or incentives are discontinued, reduced or substantially modified, if growth in any such subsidies or incentives is reduced, or if renewable portfolio standards or similar production requirements are changed or eliminated, demand for our PV modules in the affected country or countries could decline or never develop, and our results of operations and financial condition could be materially and adversely affected as a result.
The recent financial crisis and ensuing recession and the debt crisis in Europe could negatively affect our business, results of operations, and financial condition.
The recent financial crisis and ensuing recession affecting the banking system and financial markets has resulted in a tightening in the credit markets; a low level of liquidity in many financial markets; and extreme volatility in credit, fixed income, and equity markets. There could be a number of follow-on effects from the credit crisis on our business, including increased expense or inability to obtain debt financing or raise additional capital; insolvency of key suppliers, resulting in product delays; inability of customers to obtain credit to finance purchases of our products; decreased discretionary spending on BIPV/BAPV products; less new construction and building improvement projects, and/or customer insolvencies. The continued economic uncertainty increases the risk that the actual amounts realized in the future on our assets will differ significantly from the fair values currently assigned to them.
18
Table of Contents
The recent solvency concerns in Greece, Ireland and Spain could have an impact on the existence and magnitude of government sponsored initiatives related to solar installations and projects in Europe. Our success in the BIPV/BAPV markets can be affected by governmental subsidies for PV installations. Any reduction in existing or planned subsidies could negatively impact our future revenues in these market segments.
The interests of our largest stockholder, Norsk Hydro, may conflict with our interests or your interests now or in the future.
Norsk Hydro currently owns approximately 25% of all issued and outstanding shares of our common stock. As a result of its large holding of our shares, Norsk Hydro may have the ability to prevent any transaction that requires the approval of stockholders regardless of whether other stockholders believe that any such transaction is in their own best interests. Hydro also has certain preemptive and registration rights that could impact shareholders. Additionally, Norsk Hydro currently holds one seat on our Board of Directors, which affords Norsk Hydro greater control and influence over matters affecting our business.
Norsk Hydro may from time to time acquire and hold interests in businesses that compete directly or indirectly with us. Norsk Hydro also may pursue opportunities (including by acquisition) that may be adverse to, or be in direct or indirect competition with us. Additionally, our potential customers may be competitors of Norsk Hydro and our interests in selling to those customers could be divergent from Norsk Hydro’s competitive interests. So long as Norsk Hydro continues to own a significant amount of the outstanding shares of our common stock, Norsk Hydro may be able to strongly influence or effectively control our decisions.
Currency translation risk may negatively affect our net sales, cost of equipment, cost of sales, gross margin or profitability and could result in exchange losses.
Although our reporting currency is the U.S. dollar, we may conduct business and incur costs in the local currencies of other countries in which we operate, make sales or buy equipment or materials. As a result, we are subject to currency translation risk. We continue to be exposed to Japanese Yen-based currency risk. The majority of our equipment contracts in 2008 and 2009 were hedged to protect us against fluctuations in currency exchange rates. However, our future contracts and obligations may be exposed to fluctuations in currency exchange rates; and, as a result, our capital expenditures or other costs may exceed what we have budgeted. Further, changes in exchange rates between foreign currencies and the U.S. dollar could affect our net sales and cost of sales and could result in exchange losses. We cannot accurately predict future exchange rates or the overall impact of future exchange rate fluctuations on our business, results of operations and financial condition.
A significant increase in the price of our raw materials could lead to higher overall costs of production, which would negatively affect our planned product margins, or make our products uncompetitive in the PV market.
Our raw materials include high temperature plastics and various metals. Significant increases in the costs of these raw materials may impact our ability to compete in our target markets at a price sufficient to produce a profit.
Our intellectual property rights or our means of enforcing those rights may be inadequate to protect our business, which may result in the unauthorized use of our products or reduced sales or otherwise reduce our ability to compete.
Our business and competitive position depends upon our ability to protect our intellectual property rights and proprietary technology, including any PV modules that we develop. We attempt to protect our intellectual property rights, primarily in the United States, through a combination of patent, trade secret and other intellectual property laws, as well as licensing agreements and third party nondisclosure and assignment agreements. Because of the differences in foreign patent and other laws concerning intellectual property rights, our intellectual property rights may not receive the same degree of protection in foreign countries as they would in
19
Table of Contents
the United States. Our failure to obtain or maintain adequate protection of our intellectual property rights for any reason could have a material adverse effect on our business, results of operations and financial condition. Further, any patents issued in connection with our efforts to develop new technology for PV modules may not be broad enough to protect all of the potential uses of our technology.
We have applied for patent protection in the United States relating to certain existing and proposed technologies and processes and services. We may not accurately predict all of the countries where patent protection would be important or desirable. If we fail to timely file a patent application in foreign countries, we may be precluded from doing so at a later date. Furthermore, we cannot assure you that any foreign patent applications will be approved. We also cannot assure you that the patents issued as a result of our foreign patent applications will have the same scope of coverage as our U.S. patents. The patents we own could be challenged, invalidated or circumvented by others and may not be of sufficient scope or strength to provide us with any meaningful protection or commercial advantage. Further, we cannot assure you that competitors will not infringe our patents, or that we will have adequate resources to enforce our patents.
Many patent applications in the United States are maintained in secrecy for a period of time after they are filed, and since publication of discoveries in the scientific or patent literature tends to lag behind actual discoveries by several months, we cannot be certain that we will be the first creator of inventions covered by any patent application we make or that we will be the first to file patent applications on such inventions. Because some patent applications are maintained in secrecy for a period of time, there is also a risk that we could adopt a technology without knowledge of a pending patent application, which technology would infringe a third party patent once that patent is issued.
We also rely on unpatented proprietary technology. It is possible that others will independently develop the same or similar technology or otherwise obtain access to our unpatented technology. To protect our trade secrets and other proprietary information, we require our employees, consultants and advisors to execute proprietary information and invention assignment agreements when they begin working for us. We cannot assure you that these agreements will provide meaningful protection of our trade secrets, know-how or other proprietary information in the event of any unauthorized use, misappropriation or disclosure of any such trade secrets, know-how or other proprietary information. Despite our efforts to protect this information, unauthorized parties may attempt to obtain and use information that we regard as proprietary. If we are unable to maintain the proprietary nature of our technologies, we could be materially adversely affected.
Although we rely on copyright laws to protect the works of authorship created by us, we do not register the copyrights in all of our copyrightable works. Copyrights of U.S. origin must be registered before the copyright owner may bring an infringement suit in the United States. Furthermore, if a copyright of U.S. origin is not registered within three months of publication of the underlying work, the copyright owner is precluded from seeking statutory damages or attorneys’ fees in any United States enforcement action, and is limited to seeking actual damages and lost profits. Accordingly, if one of our unregistered copyrights of U.S. origin is infringed by a third party, we will need to register the copyright before we can file an infringement suit in the United States, and our remedies in any such infringement suit may be limited.
In addition, when others control the prosecution, maintenance and enforcement of certain important intellectual property, such as technology licensed to us, the protection and enforcement of the intellectual property rights may be outside of our control. If the entity that controls intellectual property rights that are licensed to us does not adequately protect those rights, our rights may be impaired, which may impact our ability to develop, market and commercialize our products. Further, if we breach the terms of any license agreement pursuant to which a third party licenses us intellectual property rights, our rights under that license may be affected and we may not be able to continue to use the licensed intellectual property rights, which could adversely affect our ability to develop, market and commercialize our products. Some of our license agreements are not assignable by us without the licensor’s consent, which may impair our ability to transfer our business or our assets in connection with a merger, acquisition or otherwise.
20
Table of Contents
Further, some of our patents and related know how and other technology may cover inventions that were conceived or first reduced to practice under, or in connection with, U.S. government contracts or other federal funding agreements. Although we retain ownership of intellectual property developed by us during the performance of government contracts, the U.S. government typically has a nonexclusive, non-transferable, irrevocable, paid-up license to practice or have practiced for or on behalf of the U.S. the invention throughout the world. Further, the federal government may retain the right to impose a compulsory license in certain circumstances through the exercise of “march-in” rights under which it can compel us to license the intellectual property. If the government were to exercise “march-in” rights, we could be forced to license intellectual property developed by us on terms unfavorable to us, and our business could be materially and adversely affected. Furthermore, our ability to exclusively license or assign the intellectual property developed under these federal funding agreements to third parties may be limited or subject to the U.S. government’s approval or oversight. These limitations could have a significant impact on the commercial value of the developed intellectual property in the U.S., and similar rights may be present in other countries. If one or more governments should exercise such rights, our ability to achieve profitability could be compromised and our business prospects harmed. Some U.S. government funding and/or license agreements require that products made using the subject intellectual property for use or sale in the United States be substantially manufactured in the United States. This may impair our ability to lower manufacturing costs or otherwise take advantage of opportunities to manufacture products outside of the United States.
Our means of protecting our intellectual property rights may not be adequate. Our competitors may independently develop substantially equivalent proprietary information, products and techniques; or otherwise gain access to our proprietary information or design around our patents or other intellectual property, which could result in significant costs or substantial damages to our business and our inability to manufacture, market or sell our products. Furthermore, policing unauthorized use of our patented or proprietary technology can be difficult and expensive. Litigation may be necessary to enforce our intellectual property rights, protect our trade secrets or determine the validity and scope of the proprietary rights of others. We cannot assure you that the outcome of such potential litigation will be in our favor. Such litigation may be costly and may divert management attention and other resources away from our business. An adverse determination in any such litigation will impair our intellectual property rights and may harm our business, prospects and reputation. In addition, we have no insurance coverage against litigation costs and would have to bear all costs arising from such litigation to the extent we are unable to recover them from other parties.
If third parties claim that we are infringing or misappropriating their intellectual property rights, we could be prohibited from selling our PV modules, be required to obtain licenses from third parties or be forced to develop non-infringing alternatives, and we could be subject to substantial monetary damages and injunctive relief.
The PV industry is characterized by the existence of a large number of patents and frequent litigation based on allegations of patent infringement. We are aware of numerous issued patents and pending patent applications owned by third parties that may relate to current and future generations of solar energy. The owners of these patents may assert that the manufacture, use or sale of any of our products infringes one or more claims of their patents. Moreover, because patent applications can take many years to issue, there may be currently pending applications, unknown to us, which may later result in issued patents that materially and adversely affect our business. Third parties could also assert claims against us that we have infringed or misappropriated their intellectual property rights. Whether or not such claims are valid, we cannot be certain that we have not infringed the intellectual property rights of such third parties. Any infringement or misappropriation claim could result in significant costs or substantial damages to our business or an inability to manufacture, market or sell any of our PV modules that are found to infringe or misappropriate. Even if we were to prevail in any such action, the litigation could result in substantial cost and diversion of resources that could materially and adversely affect our business. The large number of patents, the rapid rate of new patent issuances, the complexities of the technology involved and uncertainty of litigation increase the risk of business assets and management’s attention being diverted to patent litigation. Even if obtaining a license were feasible, it could be costly and time consuming. We
21
Table of Contents
might be forced to obtain additional licenses from our existing licensors in the event that the scope of the intellectual property we have licensed is too narrow to cover our activities, or in the event that the licensor did not have sufficient rights to grant us the license(s) purported granted. Also, some of our licenses may restrict or limit our ability to grant sublicenses and/or assign rights under the licenses to third parties, which may limit our ability to pursue business opportunities.
Our future success depends on retaining our Chief Executive Officer and existing management team and hiring and assimilating new key employees and our inability to attract or retain key personnel would materially harm our business and results of operations.
Our success depends on the continuing efforts and abilities of our executive officers, including Dr. Farhad Moghadam, our President and Chief Executive Officer, our other executive officers, and key technical personnel. Dr. Mohan Misra, founder, Chief Strategy Officer, and Chairman of the Board retired from the Company on December 31, 2010. Our future success also will depend on our ability to attract and retain highly skilled employees, including management, technical and sales personnel and may be impacted by the retirement of Dr. Misra. The loss of any of our key personnel, the inability to attract, retain or assimilate key personnel in the future, or delays in hiring required personnel could materially harm our business, results of operations and financial condition.
Our PV modules contain limited amounts of cadmium sulfide, and claims of human exposure or future regulations could have a material adverse effect on our business, results of operations and financial condition.
Our PV modules contain limited amounts of cadmium sulfide, which is regulated as a hazardous material due to the adverse health effects that may arise from human exposure, and is banned in certain countries. We cannot assure you that human or environmental exposure to cadmium sulfide used in our PV modules will not occur. Any such exposure could result in third party claims against us, damage to our reputation and heightened regulatory scrutiny of our PV modules. Future regulation relating to the use of cadmium in various products could force us to seek regulatory exemptions or impact the manufacture and sale of our PV modules and could require us to incur unforeseen environmental-related costs. The occurrence of future events such as these could limit our ability to sell and distribute our PV modules, and could have a material adverse effect on our business, results of operations and financial condition.
Environmental obligations and liabilities could have a substantial negative impact on our financial condition, cash flows and profitability.
We are subject to a variety of federal, state, local and foreign laws and regulations relating to the protection of the environment, including those governing the use, handling, generation, processing, storage, transportation and disposal of, or human exposure to, hazardous and toxic materials (such as the cadmium used in our products), the discharge of pollutants into the air and water, and occupational health and safety. We are also subject to environmental laws which allow regulatory authorities to compel, or seek reimbursement for, cleanup of environmental contamination at sites now or formerly owned or operated by us and at facilities where our waste is or has been disposed. We may incur significant costs and capital expenditures in complying with these laws and regulations. In addition, violations of, or liabilities under, environmental laws or permits may result in restrictions being imposed on our operating activities or in our being subjected to substantial fines, penalties, criminal proceedings, third party property damage or personal injury claims, cleanup costs or other costs. Also, future developments such as more aggressive enforcement policies, the implementation of new, more stringent laws and regulations, or the discovery of presently unknown environmental conditions or non-compliance may require expenditures that could have a material adverse effect on our business, results of operations and financial condition. Further, greenhouse gas emissions have increasingly become the subject of international, national, state and local attention. Although future regulations could potentially lead to an increased use of alternative energy, there can be no guarantee that such future regulations will encourage solar technology. Given our limited history of operations, it is difficult to predict future environmental expenses.
22
Table of Contents
Any change to our relationship with ITN could disrupt certain aspects of our business operations, including our research and development activities.
ITN provides us with technical services at an agreed upon cost. We have relied on these services to conduct a portion of our research and development activities, including those related to development and improvements of new PV technologies that may affect the viability of our products in the future. If we are unable to continue our arrangement with ITN, it could materially affect our ability to deliver on our plan.
We currently anticipate having substantial international operations that will subject us to a number of risks, including potential unfavorable political, regulatory, labor and tax conditions in foreign countries.
We expect to expand our operations abroad in the future and, as a result, we may be subject to the legal, political, social and regulatory requirements and economic conditions of foreign jurisdictions. Risks inherent to international operations, include, but are not limited to, the following:
| • | difficulty in procuring supplies and supply contracts abroad; |
| • | difficulty in enforcing agreements in foreign legal systems; |
| • | foreign countries imposing additional withholding taxes or otherwise taxing our foreign income, imposing tariffs or adopting other restrictions on foreign trade and investment, including currency exchange controls; |
| • | inability to obtain, maintain or enforce intellectual property rights; |
| • | risk of nationalization; |
| • | changes in general economic and political conditions in the countries in which we may operate, including changes in the government incentives we might rely on; |
| • | unexpected adverse changes in foreign laws or regulatory requirements, including those with respect to environmental protection, export duties and quotas; |
| • | difficulty with staffing and managing widespread operations; |
| • | trade barriers such as export requirements, tariffs, taxes and other restrictions and expenses, which could increase the prices of our products and make us less competitive in some countries; and |
| • | difficulty of and costs relating to compliance with the different commercial and legal requirements of the international markets in which we plan to offer and sell our PV modules. |
Our business in foreign markets will require us to respond to rapid changes in market conditions in these countries. Our overall success as an international business depends, in part, on our ability to succeed in differing legal, regulatory, economic, social and political conditions. If we are not able to develop and implement policies and strategies that are effective in each location where we will do business, then our business, results of operations and financial condition could be materially and adversely affected.
Our failure to qualify for Small Business Innovation Research funding could adversely impact our revenues from research and development contracts.
We currently receive funding for research and development under the Small Business Innovation Research (“SBIR”) program. In 2010, our revenues generated from performance of these contracts totaled approximately $0.3 million. In order to continue to qualify for this funding, we must, among other things, remain American owned and independently operated and our size must remain under 500 employees. As a result of our relationship with Norsk Hydro and our planned expansion plans, we cannot guarantee that we will be able to continue to qualify for SBIR funding. If we fail to qualify for SBIR funding, our revenues from research and development could decline or cease, and our net income and financial condition could be materially and adversely affected.
23
Table of Contents
Our failure to secure proper sites and facilities in which to install manufacturing equipment could adversely affect our business and results of operations.
We intend to install manufacturing equipment both domestically and abroad. Selecting suitable locations for this equipment requires consideration of a variety of factors, including availability of a skilled workforce, size and configuration of facilities, proximity to customers, transportation and infrastructure, cost of land and facilities, currency exchange rates and the prevailing political and regulatory environment. A variety of factors related to the location and selection of such sites and facilities could cause our operations to miss our expectations, and adversely affect our business, results of operations and financial condition.
If the U.S. government terminates or delays any of our revenue-generating contracts with it, then the reduced funding could materially and adversely affect our results of operations and financial condition.
To date, we have relied heavily upon contracts with the U.S. government and federal agencies for our revenues and to fund our research and development activities. The U.S. government, as a counterparty to our agreements, generally has the right to unilaterally terminate or modify these contracts. If the U.S. government terminates or delays any of our contracts with it—for example, because of changed government priorities, budgets or appropriations—then our ability to perform or adequately fund ongoing research and development activities may be adversely affected. Further, such termination or delay could materially and adversely affect our results of operations and financial condition.
Existing regulations and policies and changes to these regulations and policies may present technical, regulatory and economic barriers to the purchase and use of PV products, which may significantly reduce demand for our PV modules.
The market for electricity generation products is heavily influenced by foreign, U.S., state and local government regulations and policies concerning the electric utility industry, as well as policies promulgated by electric utilities. These regulations and policies often relate to electricity pricing and technical interconnection of customer-owned electricity generation. In the United States and in a number of other countries, these regulations and policies have been modified in the past and may be modified again in the future. These regulations and policies could deter end-user purchases of PV products and investment in the research and development of PV technology. For example, without a mandated regulatory exception for PV systems, utility customers are often charged interconnection or standby fees for putting distributed power generation on the electric utility grid. These fees could increase the cost to our end-users of using PV systems and make them less desirable, thereby harming our business, prospects, results of operations and financial condition. In addition, electricity generated by PV systems mostly competes with expensive peak hour electricity, rather than the less expensive average price of electricity. Modifications to the peak hour pricing policies of utilities, such as to a flat rate, would require PV systems to achieve lower prices in order to compete with the price of electricity from other sources.
We anticipate that our PV modules and their use in installations will be subject to oversight and regulation in accordance with national and local ordinances relating to building codes, safety, environmental protection, utility interconnection and metering and related matters. It is difficult to track the requirements of individual states and design equipment to comply with the varying standards. Any new government regulations or utility policies pertaining to PV modules may result in significant additional expenses to us, our business partners and their customers and, as a result, could cause a significant reduction in demand for our PV modules.
As a public company we are subject to complex legal and accounting requirements that require us to incur substantial expenses, and our financial controls and procedures may not be sufficient to ensure timely and reliable reporting of financial information, which, as a public company, could materially harm our stock price and listing on the NASDAQ Global Market.
As a public company, we are subject to numerous legal and accounting requirements that do not apply to private companies. The cost of compliance with many of these requirements is substantial, not only in absolute terms
24
Table of Contents
but, more importantly, in relation to the overall scope of the operations of a small company. Failure to comply with these requirements can have numerous adverse consequences including, but not limited to, our inability to file required periodic reports on a timely basis, loss of market confidence, delisting of our securities and/or governmental or private actions against us. We cannot assure you that we will be able to comply with all of these requirements or that the cost of such compliance will not prove to be a substantial competitive disadvantage vis-à-vis our privately held and larger public competitors.
The Sarbanes-Oxley Act of 2002 (“Sarbanes-Oxley”) requires, among other things, that we maintain effective internal control over financial reporting and disclosure controls and procedures. In particular, we must perform system and process evaluation and testing of our internal control over financial reporting to allow management to report on the effectiveness of our internal control over financial reporting, as required by Section 404 of Sarbanes-Oxley. Our compliance with Section 404 of Sarbanes-Oxley will require that we incur substantial accounting expense and expend significant management efforts. The effectiveness of our controls and procedures may in the future be limited by a variety of factors, including:
| • | faulty human judgment and simple errors, omissions or mistakes; |
| • | fraudulent action of an individual or collusion of two or more people; |
| • | inappropriate management override of procedures; and |
| • | the possibility that any enhancements to controls and procedures may still not be adequate to assure timely and accurate financial information. |
If we are not able to comply with the requirements of Section 404 in a timely manner, or if we or our independent registered public accounting firm identifies deficiencies in our internal control over financial reporting that are deemed to be material weaknesses, we may be subject to NASDAQ delisting, investigations by the U.S. Securities and Exchange Commission and civil or criminal sanctions.
Our ability to successfully implement our business plan and comply with Section 404 requires us to be able to prepare timely and accurate financial statements. We expect that we will need to continue to improve existing, and implement new operational, financial and accounting systems, procedures and controls to manage our business effectively.
Any delay in the implementation of, or disruption in the transition to, new or enhanced systems, procedures or controls may cause our operations to suffer, and we may be unable to conclude that our internal control over financial reporting is effective as required under Section 404 of Sarbanes-Oxley. If we are unable to complete the required Section 404 assessment as to the adequacy of our internal control over financial reporting, if we fail to maintain or implement adequate controls, our ability to obtain additional financing could be impaired. In addition, investors could lose confidence in the reliability of our internal control over financial reporting and in the accuracy of our periodic reports filed under the Securities Exchange Act of 1934, as amended (“Exchange Act”). A lack of investor confidence in the reliability and accuracy of our public reporting could cause our stock price to decline.
The price of our common stock may continue to be volatile.
Our common stock is currently traded on the NASDAQ Global Market. The trading price of our common stock from time to time has fluctuated widely and may be subject to similar volatility in the future. For example, in the fiscal years ended December 31, 2010, our common stock traded as low as $2.00 and as high as $6.19, and in 2009, traded as low as $2.19 and as high as $8.83. The trading price of our common stock in the future may be affected by a number of factors, including events described in these “Risk Factors.” In recent years, broad stock market indices, in general, and smaller capitalization and PV companies, in particular, have experienced substantial price fluctuations. In a volatile market, we may experience wide fluctuations in the market price of our common stock. These fluctuations may have a negative effect on the market price of our common stock
25
Table of Contents
regardless of our operating performance. In the past, following periods of volatility in the market price of a company’s securities, securities class action litigation has often been instituted. A securities class action suit against us could result in substantial costs, potential liabilities and the diversion of management’s attention and resources, and could have a material adverse effect on our financial condition.
| Item 1B. | Unresolved Staff Comments |
None.
| Item 2. | Properties |
On February 8, 2008, the Company acquired an approximately 120,000 square foot manufacturing and office facility in Thornton, Colorado, for approximately $5.5 million. The facility has been renovated, reconfigured and expanded by approximately 18,000 square feet to accommodate our FAB2 production line. The building purchase, improvements and expansion were partially financed by a $7.5 million loan from the Colorado Housing and Financing Authority. The total cost for the acquisition and renovation of our facility in Thornton, Colorado was approximately $19 million.
Our FAB1 production line is located in Littleton, Colorado. We currently lease approximately 19,380 square feet of office and manufacturing space from the Fontana Family Trust. The lease expires in June 2011 and we are currently negotiating an extension.
| Item 3. | Legal Proceedings |
None.
| Item 4. | (Removed and Reserved) |
| Item 5. | Market For Registrant’s Common Equity, Related Stockholder Matters and Issuer Purchases of Equity Securities |
Market Information
Our Common Stock is traded on the NASDAQ Global Market under the symbol “ASTI.” The following table sets forth the high and low sales price information per share for our Common Stock for the last two completed fiscal years.
Price Range of Common Stock
| High | Low | |||||||
| Fiscal 2009 |
||||||||
| First Quarter |
$ | 4.64 | $ | 2.19 | ||||
| Second Quarter |
$ | 8.83 | $ | 3.80 | ||||
| Third Quarter |
$ | 8.58 | $ | 5.10 | ||||
| Fourth Quarter |
$ | 6.59 | $ | 4.37 | ||||
| Fiscal 2010 |
||||||||
| First Quarter |
$ | 6.19 | $ | 3.20 | ||||
| Second Quarter |
$ | 4.40 | $ | 2.57 | ||||
| Third Quarter |
$ | 3.28 | $ | 2.00 | ||||
| Fourth Quarter |
$ | 6.14 | $ | 3.01 | ||||
26
Table of Contents
Holders
As of December 31, 2010, the number of record holders of our Common Stock was 37, and there were no holders of Preferred Stock. The vast majority of our publicly traded shares are held in street name, and we believe that the number of beneficial owners of our stock was approximately 11,564 as of December 31, 2010.
Dividends
The holders of Common Stock are entitled to receive such dividends as may be declared by our Board of Directors. During the years ended December 31, 2010 and 2009, we did not pay any dividends, and we do not expect to declare or pay any dividends in the foreseeable future. Payment of future dividends will be within the discretion of our Board of Directors and will depend on, among other factors, our retained earnings, capital requirements, and operating and financial condition.
Stock Performance Graph
The following graph compares the cumulative 41 month return provided shareholders on Ascent Solar Technologies, Inc. Common Stock relative to the cumulative total returns of the Russell 2000 Index (market index that tracks small cap companies) and the NASDAQ Clean Edge Green Energy U.S. Index (industry index covering five major sub-sectors; Renewable Electricity Generation, Renewable Fuels, Energy Storage & Conversion, Energy Intelligence and Advanced Energy-Related Materials).
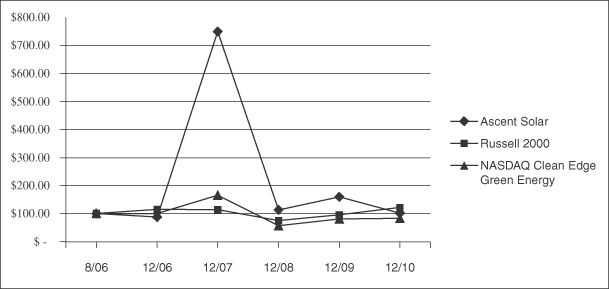
| 8/10/06 | 12/31/06 | 12/31/07 | 12/31/08 | 12/31/09 | 12/31/10 | |||||||||||||||||||
| Ascent Solar |
$ | 100.00 | $ | 87.35 | $ | 748.80 | $ | 113.25 | $ | 159.64 | $ | 101.20 | ||||||||||||
| Russell 2000 |
$ | 100.00 | $ | 115.37 | $ | 113.57 | $ | 75.20 | $ | 95.63 | $ | 121.31 | ||||||||||||
| NASDAQ Clean Edge Green Energy* |
$ | 100.00 | $ | 100.00 | $ | 165.50 | $ | 56.62 | $ | 80.59 | $ | 82.77 | ||||||||||||
| * First date of index is 2/14/07 |
|
|||||||||||||||||||||||
Assumptions:
| • | The graph covers the period from August 10, 2006, the first trading day of our Common Stock, through December 31, 2010; the last trading day of our most recently completed fiscal year. |
27
Table of Contents
| • | The graph assumes that $100 was invested in our Common Stock on August 11, 2006 at the closing price on that date of $3.32 per share, in the Russell 2000 Index and the NASDAQ Clean Edge Energy Index, and that all dividends, if any, were reinvested. No cash dividends have been declared or paid on our Common Stock. |
| • | Stockholder returns over the indicated period should not be considered indicative of future stockholder returns. |
| Item 6. | Selected Financial Data |
The following tables include selected financial data for each of our last five fiscal years. The statement of operations data for the years ended December 31, 2010, 2009 and 2008 and balance sheet data as of December 31, 2010 and 2009 have been derived from the audited financial statements appearing elsewhere in this report. The statement of operations data for the years ended December 31, 2007 and 2006 and the balance sheet data as of December 31, 2008, 2007 and 2006 have been derived from our audited financial statements appearing in our previous reports filed with the SEC. This data should be read in conjunction with the financial statements and notes therein, with the “Management’s Discussion and Analysis of Financial Condition and Results of Operations” in Item 7 of this report and with the other financial data set forth elsewhere in this report. Our historical results of operations are not necessarily indicative of results of operations to be expected for future periods.
| Statements of Operations Data |
Year Ended December 31, | |||||||||||||||||||
| In thousands except per share data | 2010 | 2009 | 2008 | 2007 | 2006 | |||||||||||||||
| Research and Development Revenue |
$ | 2,481 | $ | 1,464 | $ | 1,500 | $ | 1,003 | $ | — | ||||||||||
| Research and Development Expense |
24,354 | 15,508 | 10,066 | 4,803 | 833 | |||||||||||||||
| Selling, General and Administrative Expense |
7,454 | 7,694 | 5,670 | 4,126 | 2,542 | |||||||||||||||
| Impairment Loss |
1,769 | — | — | — | — | |||||||||||||||
| Loss from Operations |
(31,096 | ) | (21,738 | ) | (14,236 | ) | (7,926 | ) | (3,375 | ) | ||||||||||
| Net Loss |
(31,234 | ) | (20,923 | ) | (13,215 | ) | (6,503 | ) | (4,181 | ) | ||||||||||
| Basic and diluted net loss per share |
$ | (1.14 | ) | $ | (0.93 | ) | $ | (0.78 | ) | $ | (0.70 | ) | $ | (1.45 | ) | |||||
| Balance Sheet Data |
Year Ended December 31, | |||||||||||||||||||
| In thousands | 2010 | 2009 | 2008 | 2007 | 2006 | |||||||||||||||
| Cash and investments |
$ | 44,790 | $ | 60,506 | $ | 87,350 | $ | 37,701 | $ | 10,671 | ||||||||||
| Working capital |
41,489 | 50,229 | 80,889 | 37,079 | 10,412 | |||||||||||||||
| Total Assets |
160,021 | 172,661 | 154,212 | 49,817 | 11,290 | |||||||||||||||
| Long-Term Obligations |
7,279 | 7,095 | 7,050 | — | — | |||||||||||||||
| Stockholders’ Equity |
146,566 | 154,315 | 139,618 | 48,622 | 10,901 | |||||||||||||||
| Item 7. | Management’s Discussion and Analysis of Financial Condition and Results of Operations |
The following discussion of our financial condition and results of operations should be read in conjunction with our audited financial statements and the notes to those financial statements appearing elsewhere in this Form 10-K. This discussion and analysis contains statements of a forward-looking nature relating to future events or our future financial performance. As a result of many factors, our actual results may differ materially from those anticipated in these forward-looking statements. These statements involve known and unknown risks, uncertainties and other factors that may cause our actual results, levels of activity, performance or achievements to be materially different from any future results, levels of activity, performance or achievements expressed or implied by these forward-looking statements.
Overview
We are a development stage company formed to commercialize flexible PV modules using our proprietary technology. For the year ended December 31, 2010, we generated approximately $2.5 million of revenue. Our
28
Table of Contents
revenue from government research and development contracts was $1.7 million and our revenue from product sales was $0.8 million. As of December 31, 2010, we had an accumulated deficit of approximately $77.3 million. Currently our FAB2 production line is ramping up production on qualified equipment. We are qualifying additional equipment that has been delivered and additional equipment is scheduled for delivery in 2011. Under our current business plan, we expect losses to continue until production reaches an annual rated capacity of approximately 30 MW or more. To date, we have financed our operations primarily through public and private equity financings. On November 16, 2010, we completed a public offering of 5,250,000 shares of common stock. The offering price was $4.15 per share resulting in total net proceeds of approximately $20.4 million. The proceeds from the stock sales are being utilized to fund equipment purchases for FAB2 in Thornton, Colorado, as well as the funding of negative operating cash flows as we ramp up production levels.
While focused on speed to market, we believe that quality and consistency of product will be paramount to our success in the marketplace. Consequently, we follow a highly disciplined, staged progression based upon the achievement of key milestones and supported by over sixteen years of concerted research and development activity by our scientists. Our progression also takes into account market conditions, as well as financing options. In keeping with our philosophy, we completed construction of our FAB1 production line in December 2007. In March 2008, we demonstrated IOC of the FAB1 production line by initiating production trials as an end-to-end integrated process. Early IOC production trials resulted in average thin-film device efficiencies of 9.5% and small area monolithically integrated module efficiencies of over 7.0%. During 2008, optimization trials resulted in thin-film device efficiencies in the 9.5% to 11.5% range and corresponding module efficiencies in the 7.0% to 9.0% range. The test modules measured approximately 15 centimeters wide by 30 centimeters long. During 2008, we focused on testing and qualifying our FAB1 production line in anticipation of commencing production.
During the first quarter of 2009, we began limited production of monolithically integrated flexible CIGS modules on our FAB1 production line and continued to provide sample modules to potential customers and development partners to explore integration of our products into new applications. In June 2009, we announced the fabrication of a five meter long CIGS module, which we believe is the largest monolithically interconnected CIGS module ever produced on polyimide and possibly the largest CIGS module ever produced regardless of construction. Based on internal test and evaluation, this five meter long module weighed approximately two kilograms and produced 123 watts (under standard test conditions) with an aperture area efficiency of 9.1%. In July 2009, we obtained independent verification by NREL that the modules produced from FAB1 measured 10.4% in conversion efficiency. The modules tested at NREL were approximately 15 centimeters wide by 30 centimeters long and were produced on the Company’s FAB1 production line. In October 2009, NREL verified our achievement of a manufacturing milestone of 14.0% cell efficiency from FAB1. We also announced a peak efficiency of 11.7% for CIGS modules manufactured at FAB1. In December 2010, we achieved 12.1% module efficiency on the same 15 by 30 form factor.
In August 2009, we completed internal qualification testing of a flexible packaging solution which successfully passed the rigorous standard of one thousand (1,000) hours of damp heat testing (85% relative humidity and 85° C temperature) guideline set forth by IEC 61646 standards for performance and long term reliability of thin-film solar modules. In February 2010, three product configurations were certified by an independent laboratory on a variety of DOD rugged standards known as MIL-STD-810G. In October 2010, we completed full external certification under IEC 61646 at an independent laboratory of a two meter module for BAPV applications. Achieving this certification is required for BIPV/BAPV applications used in commercial, industrial and residential rooftop markets. We have submitted two meter and five meter modules for testing under IEC 61646, IEC 61730, and UL 1703 for BAPV applications. These certifications are performance and safety standards for flat-plate PV modules intended for installation on or integrated with buildings, or to be freestanding (that is, not attached to buildings), in accordance with applicable electrical and building codes. Certification activities will continue as required as we introduce new products and make significant improvements to our already certified products.
29
Table of Contents
In June 2010, we announced that DARPA selected Ascent Solar for an award under the Low-Cost Lightweight PoP solicitation. The Ascent Solar led program, entitled “Flexible High-performance Tandem-junction PV Array”, consists of three gated phases that extend over 54 months. The total contract value is approximately $3.8 million. The goal of PoP is to demonstrate low-cost, lightweight PV that can stand up to battle conditions and environmental extremes while delivering a power conversion efficiency of 20% or greater by the end of the program.
Commercialization and Manufacturing Expansion Plan
In 2010, we had product sales of $811,906 which was not considered sufficient to exit development stage. We intend to be the first company to commercialize the manufacture of large, roll-format, PV modules that use CIGS on a flexible, plastic substrate. Our manufacturing expansion plan entails the design, installation, qualification, testing and operation of additional production tools to increase our rated production capacity.
Approximately 75% of the total equipment planned for delivery into FAB2 had been delivered by December 31, 2010. We exited 2010 at an annual run rate of approximately 2 MW on equipment with a nameplate or nominal capacity of 8 MW per year. Additional equipment deliveries are planned during 2011. We are targeting 6 MW to 10 MW of production in 2011 based on market demand for our products.
During 2010, we applied for funding under the DOE Loan Guarantee Program for our planned FAB3 production line with a nameplate capacity of 150 MW per year. The DOE reviewed our Part I submission under the Loan Guarantee Application—Innovative Energy Efficiency, Renewable Energy and Advanced Transmission and Distribution Technologies Solicitation No. DE-FOA-0000140, and deemed it responsive to the initial threshold requirements. We completed our Part II submission under the program in December 2010. On February 23, 2011, the DOE informed us that our submission was selected for due diligence review by the DOE. If our project is approved by the DOE, ground breaking must occur by the federally mandated September 30, 2011 deadline. We have no assurances that our project will be approved by the DOE.
We are evaluating the timing of further expansion based on many factors that include demand, market conditions, product certification, availability of financing, technical advances, strategic partnerships and other factors.
Capital Equipment Expenditures and Manufacturing Costs
Since our formation in October 2005, the majority of our cash outlays have gone toward the investment in capital equipment necessary to develop our manufacturing capabilities for producing the commercial products we envision and for research and development. We expect this trend to continue into 2012 as we incrementally expand our rated capacity. We recently applied for funding under the U.S. Department of Energy Loan Guarantee Program for our FAB3 production line with a nameplate capacity of 150 MW per year.
We currently expect the capital expenditures for FAB2 to total approximately $102 million to $107 million for manufacturing and development equipment. We invested approximately $19 million for the acquisition and renovation of the FAB2 manufacturing facility in Thornton, Colorado. We also expect capital expenditures of approximately $6.0 million for installation and qualification of the FAB2 equipment. As of December 31, 2010, we have made actual cash payments of approximately $84.1 million for the FAB2 equipment including installation costs and deposits on undelivered equipment. During 2011 we expect to make the remaining payments of approximately $3.6 million on the FAB2 manufacturing equipment already delivered to our FAB2 location, of which payments in the amount of approximately $2.6 million have been secured by a letter of credit. We expect to make payments on equipment for FAB2 of approximately $10.7 million during 2011.
During the first quarter of 2009, we began limited production of monolithically integrated flexible CIGS modules from our FAB1 production line. In mid 2010 we began initial production of monolithically integrated flexible CIGS modules from our FAB2 production plant. We are continuing the process of qualifying the
30
Table of Contents
remaining production tools that have been delivered into FAB2. During 2011, we will be focused on ramping up the equipment already in production and qualification of the equipment in house and to be delivered in 2011.
The timing and amount of our production capacity and actual output will depend on a number of technical factors such as module efficiency, production yield and throughput. Our projections of annual rated production capacity have been and continue to be based on assumptions about these and other factors. We periodically revisit and revise these assumptions to account for realized rates and measurements on our production lines. Future production yield and throughput in FAB2 will depend on our continuing efforts to successfully ramp up the production equipment.
We are continuing the process of qualifying the remaining production tools that have been delivered into FAB2. We have additional tools on order that have not been delivered into FAB2. The output of FAB2 in 2011 will depend on product demand, market conditions, technical factors, and the timing of the final qualification and delivery of tools into FAB2. We intend to continue to optimize our manufacturing processes including throughput, efficiency and yield to improve product performance and reduce manufacturing costs. We also intend to identify and evaluate suitable locations for new production lines for future expansion, domestically and abroad, that we believe will best serve our target markets and customers for future expansion.
Significant Trends, Uncertainties and Challenges
We believe that the significant trends, uncertainties and challenges that directly or indirectly affect our financial performance and results of operations include:
| • | Our ability to qualify production tools to achieve desired production yields, throughput, module efficiencies and other performance targets, and to obtain necessary or desired certifications for our PV modules, in a timely manner; |
| • | Our ability to expand production in accordance with our plans set forth above under “Commercialization and Manufacturing Expansion Plan”; |
| • | Our ability to achieve projected operational performance and cost metrics; |
| • | Our ability to consummate strategic relationships with key partners, including OEMs, customers, system integrators, value added resellers and distributors who deal directly with manufacturers and end-users in the BIPV/BAPV, portable power, EIPV and government/defense solar panel markets; |
| • | Consumer acceptance of our products; |
| • | The effect that currency fluctuations may have on our capital equipment purchases, manufacturing costs and the price of our planned PV modules; |
| • | Changes in the supply and demand for PV modules as well as fluctuations in selling prices for PV modules worldwide; |
| • | Our ability to raise additional capital on terms favorable to us; |
| • | Our ability to manage the planned expansion of our manufacturing facilities, operations and personnel; |
| • | Our ability and the ability of our distributors, suppliers and customers to manage operations and orders and timely delivery of production tools; and |
| • | Availability of raw materials. |
Basis of Presentation: Our activities to date have consisted substantially of raising capital, research and development, establishment of our FAB1 production plant and the development of our FAB2 expansion plant. Revenues to date have been generated primarily from our governmental research and development (R&D) contracts and have not been significant. Our planned principal operations to commercialize flexible PV modules
31
Table of Contents
have commenced, but have generated limited revenue to date. Accordingly, we are considered to be in the development stage and have presented our financial statements under the provisions of ASC Topic 915—Development Stage Entities which requires additional disclosure of inception to date activity in our Statements of Operations, Statements of Stockholder’s Equity and Comprehensive Income (Loss) and Statements of Cash Flows.
Cash Equivalents: We classify all highly liquid debt securities purchased with an original maturity of three months or less to be cash equivalents. We maintain cash balances which may exceed federally insured limits. We do not believe that this results in significant credit risk.
Restricted Cash: We classify all cash or cash items that are legally restricted to usage or withdrawal as restricted cash. If such funds are to be used to acquire non-current assets or to liquidate long-term liabilities, they shall be classified as long-term in the Balance Sheets. Funds restricted for the payment of interest, current maturities of debt or other current liabilities shall be classified as current.
Investments: We classify our investments as “available-for-sale.” Such investments are carried at fair value, based on quoted market prices with the unrealized holding gains and losses reported as “Accumulated other comprehensive income (loss)” in the stockholders’ equity section of the Balance Sheets. Realized gains and losses on sales of securities are computed using the specific identification method. The Company evaluates declines in market value for potential impairment. If the decline results in a value below cost and is determined to be other than temporary, the investment is written down to its impaired value and a new cost basis is established.
Fair Value Estimates: The fair value of an asset or liability is the amount at which it could be exchanged or settled in a current transaction between willing parties. We have recorded investments at fair value and have classified them as Level 1, 2 or 3 within the fair value hierarchy. Fair values determined by Level 1 inputs utilize quoted prices in active markets for identical assets or liabilities. Fair values determined by Level 2 inputs utilize data points that are observable such as quoted prices and other inputs that can be corroborated by observable market data. Fair values determined by Level 3 inputs utilize unobservable data points for the asset or liability. The carrying value for cash and cash equivalents, restricted cash, accounts receivable, accounts payable, accrued property plant, and equipment, accrued expenses and other assets and liabilities approximate their fair values due to their short maturities.
Foreign Currency Translation: Bank account balances related to our foreign currencies are translated to U.S. dollars utilizing the period end exchange rate. Gains or losses on foreign currency translation adjustments in connection with our forward contracts are recorded within realized gain (loss) on forward contracts in “Other Income/(Expense)” on the Statements of Operations.
Revenue Recognition: Revenue from governmental research and development contracts is generated under terms that are cost plus fee or firm fixed price. Revenue from cost plus fee contracts is recognized as costs are incurred on the basis of direct costs plus allowable indirect costs and an allocable portion of the fixed fee. Revenue from firm fixed price contracts is recognized under the percentage-of-completion method of accounting, with costs and estimated profits included in contract revenue as work is performed. If actual and estimated costs to complete a contract indicate a loss, provision is made currently for the loss anticipated on the contract. Revenue from commercial sales of flexible PV modules is recognized as modules are delivered and title has transferred to the customer. Product revenue through December 31, 2010 is included in research and development revenue as the Company is in the development stage and such revenues (totaling $811,906 for the year ended December 31, 2010) were generated from a limited number of customers as the product is being brought to market.
Shipping and Handling Costs: We classify shipping and handling costs for solar modules shipped to our customers as a component of “Research and development costs.” Customer payments of shipping and handling costs are recorded as a component of “Revenues.”
32
Table of Contents
Deferred Contract Revenue: Deferred contract revenue is generated from governmental research and development contracts. The amount deferred represents billings in excess of costs incurred on firm fixed price deliverables. As of December 31, 2010 and 2009, deferred contract revenue was $250,705 and $0, respectively. Amounts classified in deferred contract revenue are expected to be recognized within one year of the Balance Sheet date.
Receivables and Allowance for Doubtful Accounts: Trade accounts receivable are recorded at the invoiced amount as the result of transactions with customers. We maintain allowances for doubtful accounts for estimated losses resulting from the inability of our customers to make required payments. We estimate the collectability of our accounts receivable using analysis of historical bad debts, customer credit-worthiness and current economic trends. Necessary reserves are established on an account-by-account basis. Account balances are written off against the allowance in the period in which we determine that it is probable that the receivable will not be recovered.
Product Warranties: We provide a limited warranty to the original purchaser of our product against defective materials and workmanship. We also guarantee modules will achieve and maintain the stated conversion efficiency rating. Warranty accruals are recorded at the time of sale and are estimated based upon product warranty terms, historical experience and analysis of peer company product returns. We assess the adequacy of our liabilities and will make adjustments as necessary based on known or anticipated warranty claims, or as new information becomes available.
Patents: At such time as we are awarded patents, patent costs are amortized on a straight-line basis over the legal life, or over their estimated useful lives, whichever is shorter. As of December 31, 2010, we had $259,439 of net patent costs, of which $42,110 represent costs net of amortization incurred for awarded patents, and the remaining $217,329 represents costs incurred for patent applications to be filed. Amortization expense was $5,675 for the year ending December 31, 2010 and $5,116 for each of the years ended December 31, 2009 and 2008.
Inventories: All inventories are stated at the lower of cost or market, with cost determined using the weighted average method. Elements of cost include raw material acquisition and conversion costs, an allocated portion of indirect production costs, inventory maintenance costs and depreciation and amortization. When plant capacity is significantly underutilized, allocated costs included in inventories are based on a normal level of activity, with the excess costs charged to expense in the period incurred.
Inventory balances are frequently evaluated to ensure they exceed net realizable value. The computation for net realizable value takes into account many factors, including expected demand, product lifecycle and development plans, module efficiency, quality issues, obsolescence and others. If actual demand and market conditions are less favorable than those estimated by management, additional inventory write-downs may be required. Our inventories have a long life cycle and obsolescence is not a significant factor in their valuation.
Property, Plant and Equipment: Property, plant and equipment are recorded at the original cost to the Company. Assets are depreciated over estimated useful lives of three to forty years using the straight-line method, as presented in the table below, commencing when the asset is placed in service. Leasehold improvements are depreciated over the shorter of the remainder of the lease term or the life of the improvements. Upon retirement or disposal, the cost of the asset disposed of and the related accumulated depreciation are removed from the accounts and any gain or loss is reflected in income. Expenditures for repairs and maintenance are expensed as incurred.
| Useful Lives in Years | ||
| Buildings |
40 | |
| Manufacturing machinery and equipment |
5 - 10 | |
| Furniture, fixtures, computer hardware/software |
3 - 7 | |
| Leasehold improvements |
life of lease |
33
Table of Contents
Interest Capitalization: We capitalize interest cost as part of the historical cost of acquiring or constructing certain assets during the period of time required to get the asset ready for its intended use. During 2009 and 2010, these assets consisted of property, plant and equipment. We capitalize interest to the extent that expenditures to acquire or construct an asset have occurred and interest cost has been incurred.
Long-lived assets: We analyze long-lived tangible assets (property, plant and equipment) and definitive-lived intangible assets (patents) for impairment by assessing if the asset cost will be recoverable. Events that might cause impairment would include significant current period operating or cash flow losses associated with the use of a long-lived asset or group of assets combined with a history of such losses, significant changes in the manner of use of assets and significant negative industry or economic trends.
Net loss per Common Share: Basic earnings per share include no dilution and are computed by dividing income available to common stockholders by the weighted-average number of shares outstanding during the period. Diluted earnings per share reflect the potential of securities that could share in our earnings, similar to fully diluted earnings per share. Common stock equivalents consisting of Class B warrants, IPO warrants (representative warrants), and stock options and unvested restricted stock outstanding as of December 31, 2010 of approximately 12.7 million shares, have been omitted from loss per share because they are anti-dilutive. Net Loss per share was the same for both basic and diluted for the periods ended December 31, 2010, 2009 and 2008.
Research and Development Costs: Research and development costs are incurred during the process of researching and developing new products and enhancing our manufacturing processes and consist primarily of compensation and related costs for personnel, materials, supplies and equipment depreciation. We expense these costs as incurred until the resulting product has been completed and tested and is ready for commercial manufacturing. We also incur research and development expenses on federal government research and development contracts and expense as incurred.
Income Taxes: Deferred income taxes are provided using the liability method whereby deferred tax assets are recognized for deductible temporary differences and operating loss and tax credit carry forwards and deferred tax liabilities are recognized for taxable temporary differences. Temporary differences are the differences between the reported amounts of assets and liabilities and their tax bases. Deferred tax assets are reduced by a valuation allowance when, in the opinion of management, it is more likely than not that some portion or all of the deferred tax assets will not be realized. Deferred tax assets and liabilities are adjusted for the effects of the changes in tax laws and rates as of the date of enactment. Interest and penalties, if applicable, would be recorded in operations.
We have analyzed filing positions in all of the federal and state jurisdictions where we are required to file income tax returns, as well as all open tax years (2006-2010) in these jurisdictions. We believe that our income tax filing positions and deductions will be sustained on audit and do not anticipate any adjustments that will result in a material adverse effect on our financial condition, results of operations, or cash flows. Therefore, no reserves for uncertain income tax positions have been recorded.
Share-Based Compensation: We measure and recognize compensation expense for all share-based payment awards made to employees, officers, directors, and consultants based on estimated fair values. We estimate the fair value of share-based payment awards on the date of grant using an option-pricing model. The value of the portion of the award that is ultimately expected to vest is recognized as expense over the requisite service period in our Statements of Operations. Share-based compensation is based on awards ultimately expected to vest and is reduced for estimated forfeitures. Forfeitures are estimated at the time of grant and revised, as necessary, in subsequent periods if actual forfeitures differ from those estimates. For purposes of determining estimated fair value of share-based payment awards on the date of grant, we use the Black-Scholes option-pricing model (“Black-Scholes Model”) for option awards. The Black-Scholes Model requires the input of highly subjective assumptions. Because our employee stock options may have characteristics significantly different from those of traded options, and because changes in the subjective input assumptions can materially
34
Table of Contents
affect the fair value estimate, in management’s opinion, the existing models may not provide a reliable single measure of the fair value of our employee stock options. Management will continue to assess the assumptions and methodologies used to calculate estimated fair value of share-based compensation. Circumstances may change and additional data may become available over time, which result in changes to these assumptions and methodologies, which could materially impact our fair value determination. We estimate the fair value of our restricted stock awards at our stock price on the grant date.
The accounting guidance for share-based compensation may be subject to further interpretation and refinement over time. There are significant differences among option valuation models, and this may result in a lack of comparability with other companies that use different models, methods and assumptions. If factors change and we employ different assumptions in the accounting for share-based compensation in future periods, or if we decide to use a different valuation model, the compensation expense that we record in the future may differ significantly from what it has recorded in the current period and could materially affect our loss from operations, net loss and net loss per share.
Comprehensive income (loss): Our comprehensive income (loss) consists of net income (loss) and changes in unrealized gains or losses on available-for-sale investments, the impact of which has been excluded from net loss. We present comprehensive income (loss) in the Statements of Stockholders’ Equity and Comprehensive Income (Loss). Our accumulated other comprehensive income (loss) is presented as a component of equity in the Balance Sheets and consists of the cumulative amount of unrealized gains or losses on available-for-sale investments that have been incurred since the inception of our business.
Reclassifications: Certain reclassifications have been made to the 2008 and 2009 financial information to conform to the 2010 presentation.
Use of Estimates: The preparation of financial statements in conformity with generally accepted accounting principles requires management to make estimates and assumptions that affect the reported amounts of assets and liabilities and disclosure of contingent assets and liabilities at the date of financial statements and the reported amounts of revenues and expenses during the reporting period. Actual results could differ from those estimates.
Recent Accounting Pronouncements: In January 2010, the FASB issued ASU 2010-06, Fair Value Measurements and Disclosures (Topic 820)—Improving Disclosures about Fair Value Measurements. This ASU requires new disclosures and clarifies certain existing disclosure requirements about fair value measurements. ASU 2010-06 requires a reporting entity to disclose significant transfers in and out of Level 1 and Level 2 fair value measurements, to describe the reasons for the transfers and to present separately information about purchases, sales, issuances and settlements for fair value measurements using significant unobservable inputs. ASU 2010-06 is effective for interim and annual reporting periods beginning after December 15, 2009, except for the disclosures about purchases, sales, issuances and settlements in the roll forward of activity in Level 3 fair value measurements, which are effective for interim and annual reporting periods beginning after December 15, 2010; early adoption is permitted. The adoption of ASU 2010-06 did not have a material impact on our financial position, results of operations or cash flows.
In April 2010, the FASB issued ASU 2010-17, Revenue Recognition—Milestone Method (Topic 605). This ASU requires new disclosures and provides a consistent framework for applying the milestone method of revenue recognition. ASU 2010-17 states that a vendor may recognize consideration that is contingent upon achievement of a milestone in its entirety as revenue in the period in which the milestone is achieved only if the milestone meets all criteria to be considered substantive. Determining whether a milestone is substantive is a matter of judgment made at the inception of the arrangement. ASU 2010-17 is effective on a prospective basis for milestones achieved in fiscal years, and interim periods within those years, beginning on or after June 15, 2010; early adoption is permitted. We do not anticipate the adoption of ASU 2010-17 to have a material impact on our financial position, results of operations or cash flows.
35
Table of Contents
In August 2010, the FASB issued ASU 2010-21, Accounting for Technical Amendments to Various SEC Rules and Schedules. This ASU amends various SEC paragraphs pursuant to the issuance of Release No. 33-9026: Technical Amendments to Rules, Forms, Schedules and Codification of Financial Reporting Policies. The adoption of ASU 2010-21 did not have any impact on our financial position, results of operations or cash flows.
In August 2010, the FASB issued ASU 2010-22, Technical Corrections to SEC Paragraphs—An Announcement made by the Staff of the SEC. This ASU amends various SEC paragraphs based on external comments received and the issuance of SAB 112, which amends or rescinds portions of certain SAB topics. SAB 112 was issued to bring existing SEC guidance into conformity with ASC 805, Business Combination, and ASC 810, Consolidation. The adoption of ASU 2010-22 did not have any impact on our financial position, results of operations or cash flows.
Results of Operations
Comparison of the Years Ended December 31, 2010 and 2009
Our activities to date have substantially consisted of raising capital, business and product development, research and development and the development of our FAB1 and FAB2 production lines.
Research and Development Revenues. Our revenues were $2,481,489 for the year ended December 31, 2010 compared to $1,464,346 for the year ended December 31, 2009, an increase of $1,017,143. Revenues for the year ended December 31, 2010 included $811,906 of product sales, which constitutes the majority of the increase. Revenues earned on our government R&D contracts increased by $288,515 during 2010 as a result of two new government contracts that were entered into and began generating revenue in June 2010.
Research and Development. R&D costs were $24,354,224 for the year ended December 31, 2010 compared to $15,508,209 for the year ended December 31, 2009, an increase of $8,846,015. R&D costs include the costs incurred for pre-production and production activities in FAB1 and FAB2 and facility and equipment infrastructure costs. R&D costs also include costs related to our governmental contracts. Costs related to pre-production and production activities increased approximately $8,319,000. The pre-production cost increases were comprised of materials and equipment related costs of approximately $1,444,000, depreciation and amortization of approximately $3,875,000, personnel related costs of approximately $1,583,000, facility related costs of approximately $706,000, and consulting and contract services of approximately $588,000, offset by a decrease in stock compensation expense of approximately $85,000. Governmental R&D expenditures increased by approximately $527,000. The R&D cost increases were comprised of materials and equipment related costs of approximately $225,000, facilities related costs of approximately $165,000, and depreciation and amortization of approximately $140,000, offset by decreases in stock option expense of approximately $48,000 and personnel costs of approximately $16,000.
Selling, General and Administrative. S, G&A expenses were $7,453,830 for the year ended December 31, 2010 compared to $7,694,566 for the year ended December 31, 2009, a decrease of $240,736. This decrease is the result of reductions in consulting and contract services of approximately $501,000 and approximately $124,000 in legal expense, offset by increases of approximately $68,000 in facility costs, approximately $170,000 in stock compensation expense and approximately $146,000 in personnel related costs associated with increased headcount.
Interest Expense. Interest costs of $479,898 and $456,534 were incurred and capitalized into our property, plant and equipment for the years ended December 31, 2010 and 2009, respectively. Interest incurred relates to our CHFA loan utilized for our FAB2 production facility expansion in Thornton, Colorado.
Interest Income. Interest income was $42,756 for the year ended December 31, 2010 compared to $531,697 for the year ended December 31, 2009, a decrease of $488,941. Interest income represents interest on
36
Table of Contents
cash and short term investments. The decrease in interest income is due to significantly lower interest rates in 2010 as compared to 2009 as well as a lower average cash balance.
Impairment Loss. During the fourth quarter of 2010, there was a significant change in the planned usage of two manufacturing tools which impaired their value. Impairment loss incurred on the write-down of manufacturing tools was $1,769,480 for the year ended December 31, 2010 compared to $0 for the year ended December 31, 2009.
Realized Gain (Loss) on Investments. Realized gains on investments were $192 for the year ended December 31, 2010 compared to $59,383 for the year ended December 31, 2009, a decrease of $59,191.
Realized Loss on Forward Contracts. Realized loss on forward contracts includes losses incurred when forward contracts mature and adjustments calculated on cash held in foreign currencies to reflect the current exchange rate. For the year ended December 31, 2010 the realized loss on forward contracts was $180,621 compared to $541,771 for the year ended December 31, 2009, a decrease of $361,150.
Unrealized Gain (Loss) on Forward Contracts. Unrealized gain (loss) on forward contracts reflects the difference between the spot rate and the forward rate on our forward contracts. Unrealized gains (losses) on forward contracts are reversed when the contracts are settled. For the year ended December 31, 2010, the unrealized gain on forward contracts was $0 compared to $766,403 for the year ended December 31, 2009, the year in which all contracts matured.
Net Loss. Our Net Loss was $31,233,718 for the year ended December 31, 2010 compared to a Net Loss of $20,922,717 for the year ended December 31, 2009, an increase in Net Loss of $10,311,001. The increase in Net Loss in 2010 can be summarized in variances in significant account activity as follows:
| (Increase) decrease to Net Loss For the Year Ended December 31, 2010 Compared to the Year Ended December 31, 2009 |
||||
| Research and development revenues |
$ | 1,017,143 | ||
| Research and development costs |
||||
| Manufacturing R&D |
(8,406,423 | ) | ||
| Government R&D |
(572,710 | ) | ||
| Non-cash stock based compensation |
133,118 | |||
| General and administrative expenses |
||||
| Corporate G&A |
410,365 | |||
| Non-cash stock based compensation |
(169,629 | ) | ||
| Impairment loss |
(1,769,480 | ) | ||
| Interest expense |
— | |||
| Interest income |
(488,941 | ) | ||
| Realized Gain on investments |
(59,191 | ) | ||
| Realized Loss on forward contract |
361,150 | |||
| Unrealized Gain on forward contracts |
(766,403 | ) | ||
| Increase to Net Loss |
$ | (10,311,001 | ) | |
Comparison of the Years Ended December 31, 2009 and 2008
Research and Development Revenues. Our R&D revenues were $1,464,346 for the year ended December 31, 2009 compared to $1,499,729 for the year ended December 31, 2008, a decrease of $35,383. The majority of our R&D revenues during the years ended December 31, 2009 and 2008 were revenues earned on our government R&D contracts.
37
Table of Contents
Research and Development. R&D costs were $15,508,209 for the year ended December 31, 2009 compared to $10,066,055 for the year ended December 31, 2008, an increase of $5,442,154. R&D costs include the costs incurred for pre-production activities on our FAB1 production line and facility and equipment infrastructure costs on our FAB2 production line. R&D costs also include costs related to our governmental contracts. Costs related to pre-production activities increased approximately $5,439,000. The pre-production cost increases were comprised of materials and equipment related costs of approximately $1,128,000, depreciation and amortization of approximately $600,000, personnel related costs of approximately $2,361,000, facility related costs of approximately $992,000, and consulting and contract services of approximately $380,000 offset by a decrease in stock compensation expense of approximately $22,000. Governmental R&D expenditures decreased by approximately $40,000 which corresponds to the decrease in research and development revenues of approximately $35,000 during 2009.
Selling, General and Administrative. S, G&A expenses were $7,694,566 for the year ended December 31, 2009 compared to $5,669,746 for the year ended December 31, 2008, an increase of $2,024,820. This increase is comprised of costs associated with increased headcount of approximately $488,000, offset by a $166,000 reduction in bonuses, increases in facilities costs of approximately $467,000 and an increase in stock compensation expense of approximately $1,213,000.
Interest Expense. Interest costs of $456,534 were incurred and capitalized into our property, plant and equipment for the year ended December 31, 2009. Interest expense was $3,438 for the year ended December 31, 2008. Interest incurred relates to our CHFA loan utilized for our FAB2 production facility expansion in Thornton, Colorado.
Interest Income. Interest income was $531,697 for the year ended December 31, 2009 compared to $2,145,370 for the year ended December 31, 2008, a decrease of $1,613,673. Interest income represents interest on cash and short term investments. The decrease in interest income is due to significantly lower interest rates in 2009 as compared to 2008 as well as a lower average cash balance.
Realized Gain (Loss) on Investments. Realized gain (loss) on investments reflects changes in investment market value. Realized gains on investments were $59,383 for the year ended December 31, 2009 compared to realized losses of $32,103 for the year ended December 31, 2008, an increase of $91,486.
Realized Loss on Forward Contracts. Realized loss on forward contracts include losses incurred when forward contracts mature and adjustments calculated on cash held in foreign currencies to reflect the current exchange rate. For the year ended December 31, 2009 the realized loss on forward contracts was $541,771 compared to $322,430 for the year ended December 31, 2008, an increase of $219,341.
Unrealized Gain (Loss) on Forward Contracts. Unrealized gain (loss) on forward contracts reflects the difference between the spot rate and the forward rate on our forward contracts. Unrealized gains (losses) on forward contracts are reversed when the contracts are settled. For the year ended December 31, 2009, the unrealized gain on forward contracts was $766,403 which offset the unrealized loss of $766,403 for the year ended December 31, 2008 resulting in an increase of $1,532,806 from prior year. As of December 31, 2009 all forward contracts were settled resulting in the reversal of all unrealized losses.
38
Table of Contents
Net Loss. Our Net Loss was $20,922,717 for the year ended December 31, 2009 compared to a Net Loss of $13,215,076 for the year ended December 31, 2008, an increase in Net Loss of $7,707,641. The increase in Net Loss in 2009 can be summarized in variances in significant account activity as follows:
| (Increase) decrease to Net Loss For the Year Ended December 31, 2009 Compared to the Year Ended December 31, 2008 |
||||
| Research and development revenues |
$ | (35,383 | ) | |
| Research and development costs |
||||
| Manufacturing R&D |
(5,503,311 | ) | ||
| Government R&D |
39,379 | |||
| Non-cash stock based compensation |
21,778 | |||
| General and administrative expenses |
||||
| Corporate G&A |
(811,926 | ) | ||
| Non-cash stock based compensation |
(1,212,894 | ) | ||
| Interest expense |
3,438 | |||
| Interest income |
(1,613,673 | ) | ||
| Realized Loss on investments |
91,486 | |||
| Realized Loss on forward contract |
(219,341 | ) | ||
| Unrealized Loss on forward contracts |
1,532,806 | |||
| Increase to Net Loss |
$ | (7,707,641 | ) | |
Liquidity and Capital Resources
For the year ended December 31, 2010, our cash used in operations was approximately $21.5 million compared to approximately $14.2 million for the year ended December 31, 2009. For the year ended December 31, 2010 approximately $11.0 million was expended for payments on property, plant and equipment and deposits on equipment.
As of December 31, 2010, we had approximately $44.8 million in cash and investments. We also had $3.2 million in restricted cash securing equipment purchases which is included in “Other Assets” on the Balance Sheets. On November 16, 2010, we completed a public offering of 5,250,000 shares of common stock, yielding total net proceeds of approximately $20.4 million. We currently expect the cost of FAB2 will total approximately $102 million to $107 million for manufacturing and development equipment. We invested approximately $19 million for the acquisition of the building and renovation the FAB2 manufacturing facility in Thornton, Colorado. We also expect capital expenditures of approximately $6.0 million for installation and qualification of the FAB2 equipment. As of December 31, 2010, we have made actual cash payments of approximately $84.1 million for the FAB2 equipment including installation costs and deposits on undelivered equipment. During 2011 we expect to make the remaining payments of approximately $3.6 million on the FAB2 manufacturing equipment already delivered to our FAB2 location of which approximately $2.6 million have been secured by a letter of credit. We expect to make payments on equipment for FAB2 of approximately $10.7 million during 2011.
During the year ended December 31, 2010, the use of cash for operational expenses averaged approximately $1.8 million per month and was primarily related to pre-manufacturing activities, research and development, business development and general corporate expenses. A significant component of our costs for the year ended December 31, 2010 related to the hiring of additional personnel for operations along with company infrastructure costs to support our expansion. Our operational expenditures will increase in 2011 as production increases. As of December 31, 2010, we had 117 full-time employees and approximately 50 contractors provided through an employment services provider.
39
Table of Contents
We expect our current cash balance to be sufficient to cover its planned capital and operational expenditures for at least the next 12 months based on currently known factors and limited projected revenues. We expect that we may need to raise additional capital to cover our operating losses and future manufacturing capacity expansion. The capital markets are currently volatile and there is no assurance that we will be able to raise additional capital on acceptable terms or at all. We currently are pursuing various avenues to obtain additional capital for further expansion and have submitted materials in connection with a loan guarantee program sponsored by the U.S. Department of Energy for our FAB3 production line with nameplate capacity of 150 MW per year, and may explore raising money in the equity markets.
On January 9, 2009, we filed a “shelf” Registration Statement on Form S-3 with the SEC for the sale of up to $150 million of our securities. The SEC declared the registration statement effective on January 16, 2009. The shelf registration was utilized in connection with our public offering of approximately 5.3 million shares that closed on November 16, 2010 with gross proceeds of approximately $20.4 million. With the shelf registration, we may from time to time sell common stock, preferred stock, warrants or some combination in one or more offerings for up to $98 million, the remaining amount available.
On February 28, 2011, we entered into an At-The-Market Equity Offering Sales Agreement pursuant to which we may issue and sell through an agent up to $25,000,000 of our common stock from time to time at prevailing market prices on the NASDAQ stock exchange. There is no assurance we will be able to sell shares of our common stock under this agreement at acceptable prices or at all.
Contractual Obligations
The following table presents our contractual obligations as of December 31, 2010. Our long-term obligation is related to our building loan reflecting both principal and interest. Our purchase obligations include orders for equipment, inventory and operating expenses.
| Payments Due by Year (in thousands) | ||||||||||||||||||||
| Contractual Obligations |
Total | Less Than 1 Year |
1-3 Years | 3-5 Years | More Than 5 Years |
|||||||||||||||
| Long-term debt obligations |
$ | 11,850 | $ | 694 | $ | 2,081 | $ | 2,081 | $ | 6,994 | ||||||||||
| Operating lease obligations |
145 | 145 | — | — | — | |||||||||||||||
| Purchase obligations |
17,639 | 17,063 | 576 | — | — | |||||||||||||||
| Total |
$ | 29,634 | $ | 17,902 | $ | 2,657 | $ | 2,081 | $ | 6,994 | ||||||||||
Off Balance Sheet Transactions
As of December 31, 2010, we did not have any off balance sheet arrangements as defined in Item 303(a)(4)(ii) of Regulation S-K.
| Item 7A. | Quantitative and Qualitative Disclosures About Market Risk |
Foreign Currency Exchange Risk
The Company is actively engaged in purchasing manufacturing equipment internationally and is exposed to foreign currency risk.
In July 2008 and March 2009, the Company entered into fair value hedges utilizing forward contracts designed to match scheduled contractual payments to equipment suppliers which are denominated in Euros and Yen. The total notional value of the Euro forward contracts was €6.4 million with various contract settlement dates beginning September 15, 2008 through July 31, 2009. The total notional value of the Yen forward contracts
40
Table of Contents
was ¥521.4 million with contract settlement dates of March and April 2009. Those forward contracts had been settled as of December 31, 2009 and the currencies contracted for were delivered to us, however, not all payments have been made to our equipment suppliers and we continue to have foreign currency risk. Included in cash and cash equivalents is $2,693,226 related to €2,032,217 held as of December 31, 2010 in our bank account for future payments to equipment suppliers. Based on our overall currency rate exposure as of December 31, 2010, a near-term 10% appreciation or depreciation in the U.S Dollar, relative to our foreign currencies on deposit, would have a positive or negative impact of approximately $0.3 million on our results of operations.
Although our reporting currency is the U.S. Dollar, we may conduct business and incur costs in the local currencies of other countries in which we may operate, make sales and buy materials. As a result, we are subject to currency translation risk. Further, changes in exchange rates between foreign currencies and the U.S. Dollar could affect our future net sales and cost of sales and could result in exchange losses.
Our objective is to fix the dollar amount of our foreign currency denominated manufacturing equipment purchases at the time of order. Although our hedging activity described below is designed to fix the dollar amount to be expended, the asset purchased is recorded at the spot foreign currency rate in effect as of the date of the payment to the supplier. The difference between the spot rate and the forward rate has been reported as a loss on forward contract.
We currently have unhedged open purchase orders to an equipment supplier denominated in Yen for approximately ¥475.8 million. A 10% appreciation or depreciation in the U.S. Dollar, relative to this purchase obligation, would have a positive or negative impact range of approximately $0.5 million to $0.7 million on our future cash flows. As of December 31, 2010 the Company held two forward currency option contracts hedging approximately $1.7 million in equipment payments to be remitted in Yen. We cannot accurately predict future exchange rates or the overall impact of future exchange rate fluctuations on our business, results of operations and financial condition.
Interest Rate Risk
Our exposure to market risks for changes in interest rates relates primarily to our cash equivalents and investment portfolio. As of December 31, 2010, our cash equivalents consisted of money market funds, investments in U.S. government securities and high quality corporate securities. The primary objective of our investment activities is to preserve principal and provide liquidity on demand, while at the same time maximizing the income we receive from our investments without significantly increasing risk. The direct risk to us associated with fluctuating interest rates is limited to our investment portfolio and we do not believe that a change in interest rates will have a significant impact on our financial position, results of operations or cash flows.
Credit Risk
We have certain financial and derivative instruments that potentially subject us to credit risk. These consist primarily of cash, cash equivalents, restricted cash, investments, and forward foreign currency option contracts. We are exposed to credit losses in the event of nonperformance by the counter parties to our financial and derivative instruments. We place cash, cash equivalents, investments and forward foreign currency option contracts with various high-quality financial institutions, and exposure is limited at any one institution. We continuously evaluate the credit standing of our counter party financial institutions.
| Item 8. | Financial Statements and Supplementary Data |
The Financial Statements and Supplementary Data required by this item are included in Part IV, Item 15(a)(1) and are presented beginning on Page F-1.
| Item 9. | Changes in and Disagreements With Accountants on Accounting and Financial Disclosure |
None.
41
Table of Contents
| Item 9A. | Controls and Procedures |
Evaluation of Disclosure Controls and Procedures
We maintain disclosure controls and procedures that are designed to ensure that information required to be disclosed in our reports filed or submitted under the Securities Exchange Act of 1934, as amended (the “Exchange Act”) is recorded, processed, summarized and reported within the time periods specified in Securities and Exchange Commission rules and forms. Our disclosure controls and procedures include, without limitation, controls and procedures designed to ensure that information required to be disclosed in our reports filed under the Exchange Act is accumulated and communicated to management as appropriate to allow timely decisions regarding required disclosures. Our management conducted an evaluation required by Rules 13a-15 and 15d-15 under the Exchange Act of the effectiveness of our disclosure controls and procedures as defined in Rules 13a-15 and 15d-15 under the Exchange Act as of December 31, 2010. Based on this evaluation, our management concluded that the design and operation of our disclosure controls and procedures were effective as of December 31, 2010.
Management’s Report on Internal Control over Financial Reporting
Our management is responsible for establishing and maintaining adequate internal control over financial reporting, as defined in Rules 13a-15(f) and 15d-15(f) under the Exchange Act. Our system of internal control over financial reporting is designed to provide reasonable assurance regarding the reliability of financial reporting and the preparation of financial statements for external purposes in accordance with generally accepted accounting principles in the United States of America and includes those policies and procedures that:
| • | pertain to the maintenance of records that, in reasonable detail, accurately and fairly reflect the transactions and dispositions of our assets; |
| • | provide reasonable assurance that transactions are recorded as necessary to permit preparation of financial statements in accordance with generally accepted accounting principles, and that our receipts and expenditures are being made only in accordance with authorizations of our management and directors; and |
| • | provide reasonable assurance regarding prevention or timely detection of unauthorized acquisition, use or disposition of our assets that could have a material effect on our financial statements. |
Our management conducted an evaluation of the effectiveness of our internal control over financial reporting as of December 31, 2010 based on the framework in Internal Control—Integrated Framework issued by the Committee of Sponsoring Organizations of the Treadway Commission. Based on this evaluation, our management concluded that our internal control over financial reporting was effective as of December 31, 2010. Our management reviewed the results of its assessment with the Audit Committee.
This annual report does not include an attestation report from our independent registered public accounting firm regarding internal control over financial reporting. Management’s report was not subject to attestation by our registered public accounting firm pursuant to Sarbanes-Oxley Rule 404(c).
Changes in Internal Control over Financial Reporting
There were no changes in our internal control over financial reporting (as defined in Rules 13a-15(f) and 15d-15(f) under the Exchange Act) that occurred during the quarter ended December 31, 2010 that have materially affected, or are reasonably likely to materially affect, our internal control over financial reporting.
| Item 9B. | Other Information |
On February 28, 2011, the Company entered into an At-The-Market Equity Offering Sales Agreement (the “Sales Agreement”) with Stifel, Nicolaus & Company, Incorporated, as sales agent (“Stifel Nicolaus”), pursuant
42
Table of Contents
to which the Company may issue and sell such number of shares of its common stock having an aggregate offering price of up to $25,000,000. Sales of the common stock, if any, will be made by Stifel Nicolaus as sales agent of the Company at prevailing market prices on the NASDAQ stock exchange or any other trading market for the common stock. Stifel Nicolaus may also sell the common stock in privately negotiated transactions in accordance with the terms of the Sales Agreement. The Company has agreed to pay Stifel Nicolaus a commission of 3% of the proceeds from the sale of common stock. In addition, the Sales Agreement provides that the Company will indemnify Stifel Nicolaus against certain liabilities, including liabilities under the Securities Act of 1933, as amended, or contribute to payments that the Stifel Nicolaus may be required to make because of such liabilities.
The Sales Agreement terminates upon the sale of all of the common stock subject to the Sales Agreement or termination of the Sales Agreement by the Company or Stifel Nicolaus. Either of the Company or Stifel Nicolaus may terminate the Sales Agreement at any time upon written notice to the other.
The Shares are being offered and sold pursuant to a prospectus supplement dated February 28, 2011 and an accompanying base prospectus dated January 9, 2009, pursuant to the Company’s existing shelf registration statement on Form S-3 (File No. 333-156665) that was declared effective by the Securities and Exchange Commission on January 16, 2009.
The foregoing description of the Sales Agreement is not complete and is qualified in its entirety by reference to the full text of the Sales Agreement, a copy of which is filed as Exhibit 10.39 to this Annual Report on Form 10-K and is incorporated by reference herein.
| Item 10. | Directors, Executive Officers and Corporate Governance |
Incorporated by reference from the definitive proxy statement for our 2011 annual meeting of stockholders, which will be filed no later than 120 days after the close of our fiscal year ended December 31, 2010.
| Item 11. | Executive Compensation |
Incorporated by reference from the definitive proxy statement for our 2011 annual meeting of stockholders, which will be filed no later than 120 days after the close of our fiscal year ended December 31, 2010.
| Item 12. | Security Ownership of Certain Beneficial Owners and Management and Related Stockholder Matters |
Incorporated by reference from the definitive proxy statement for our 2011 annual meeting of stockholders, which will be filed no later than 120 days after the close of our fiscal year ended December 31, 2010.
43
Table of Contents
Securities Authorized for Issuance under Equity Compensation Plans
The following table sets forth information as of December 31, 2010 relating to all of our equity compensation plans:
| Number of securities to be issued upon exercise of outstanding options, warrants and rights (3) |
Weighted-average exercise price of outstanding options, warrants and rights |
Number of securities remaining available for future issuance under equity compensation plans |
||||||||||
| Equity compensation plans approved by security holders (1) |
1,315,501 | $ | 4.74 | 2,660,013 | ||||||||
| Equity compensation plans not approved by security holders (2) |
200,000 | $ | 6.35 | — | ||||||||
| Total: |
1,515,501 | 2,660,013 | ||||||||||
| (1) | Weighted-average exercise price of outstanding options includes weighted average price of 200,000 shares to be issued upon exercise of securities not approved by security holders. |
| (2) | In March 2008, the Board of Directors granted 40,000 restricted stock awards in connection with an executive employment agreement, of which 10,000 remain unvested as of December 31, 2010. In July 2009, the Board of Directors granted an inducement award (as defined in NASDAQ Rule 5635(c)(4)) made outside of our existing Stock Option Plan for stock options to purchase 200,000 shares. |
| (3) | This column does not include 245,750 restricted stock awards or units. |
| Item 13. | Certain Relationships and Related Transactions, and Director Independence |
Incorporated by reference from the definitive proxy statement for our 2011 annual meeting of stockholders, which will be filed no later than 120 days after the close of our fiscal year ended December 31, 2010.
| Item 14. | Principal Accounting Fees and Services |
Incorporated by reference from the definitive proxy statement for our 2011 annual meeting of stockholders, which will be filed no later than 120 days after the close of our fiscal year ended December 31, 2010.
| Item 15. | Exhibits and Financial Statement Schedules |
(a) The following documents are filed as part of this Annual Report on Form 10-K:
| (1) | Financial Statements—See Index to Financial Statements at Item 8 of the Annual Report on Form 10-K. |
| (2) | Financial Statement Schedules—Supplemental schedules are not provided because of the absence of conditions under which they are required or because the required information is given in the financial statements or notes thereto. |
| (3) | Exhibits: See Item 15(b) below. |
(b) Exhibits: The exhibits listed on the accompanying Index to Exhibits on this Form 10-K are filed or incorporated into this Form 10-K by reference.
44
Table of Contents
ASCENT SOLAR TECHNOLOGIES, INC.
SIGNATURES
Pursuant to the requirements of Section 13 or 15(d) of the Securities Exchange Act of 1934, the registrant has duly caused this report to be signed on its behalf by the undersigned, thereunto duly authorized on the 28th day of February, 2011.
| ASCENT SOLAR TECHNOLOGIES, INC. | ||
| By: | /S/ FARHAD MOGHADAM | |
| Farhad Moghadam, Ph.D. Chief Executive Officer | ||
Pursuant to the requirements of the Securities Exchange Act of 1934, this report has been signed below by the following persons on behalf of the registrant in the capacities and on the dates indicated.
| Signature |
Capacities |
Date | ||||
| /S/ FARHAD MOGHADAM Farhad Moghadam, Ph.D. |
President & Chief Executive Officer (Principal executive officer) |
February 28, 2011 | ||||
| /S/ GARY GATCHELL Gary Gatchell |
Chief Financial Officer (Principal financial and accounting officer) | February 28, 2011 | ||||
| /S/ AMIT KUMAR Amit Kumar, Ph.D. |
Chairman of the Board of Directors | February 28, 2011 | ||||
| /S/ RICHARD SWANSON Richard Swanson |
Director | February 28, 2011 | ||||
| /S/ RON ELLER Ron Eller |
Director | February 28, 2011 | ||||
| /S/ G. THOMAS MARSH G. Thomas Marsh |
Director | February 28, 2011 | ||||
| /S/ KIM J. HUNTLEY Kim J. Huntley |
Director | February 28, 2011 | ||||
| /S/ HANS OLAV KVALVAAG Hans Olav Kvalvaag |
Director | February 28, 2011 | ||||
45
Table of Contents
Index to Financial Statements
Report of Independent Registered Public Accounting Firm
Financial Statements
| Page | ||||
| F-3 | ||||
| F-4 | ||||
| F-5 | ||||
| F-7 | ||||
| F-8 | ||||
F-1
Table of Contents
REPORT OF INDEPENDENT REGISTERED PUBLIC ACCOUNTING FIRM
To the Board of Directors
Ascent Solar Technologies, Inc.
Thornton, Colorado
We have audited the accompanying balance sheets of Ascent Solar Technologies, Inc. (a Development Stage Company) as of December 31, 2010 and 2009 and the related statements of operations, stockholders’ equity and comprehensive income (loss) and cash flows for the years ended December 31, 2010, 2009 and 2008 and for the period from inception (October 18, 2005) through December 31, 2010. These financial statements are the responsibility of the Company’s management. Our responsibility is to express an opinion on these financial statements based on our audits.
We conducted our audits in accordance with the standards of the Public Company Accounting Oversight Board (United States). Those standards require that we plan and perform the audit to obtain reasonable assurance about whether the financial statements are free of material misstatement. The Company is not required to have, nor were we engaged to perform, an audit of its internal control over financial reporting. Our audit included consideration of internal control over financial reporting as a basis for designing audit procedures that are appropriate in the circumstances, but not for the purposes of expressing an opinion on the effectiveness of the Company’s internal control over financial reporting. Accordingly, we express no such opinion. An audit also includes examining, on a test basis, evidence supporting the amounts and disclosures in the financial statements. An audit also includes assessing the accounting principles used and significant estimates made by management, as well as evaluating the overall financial statement presentation. We believe that our audits provide a reasonable basis for our opinion.
In our opinion, the financial statements referred to above present fairly, in all material respects, the financial position of Ascent Solar Technologies, Inc. as of December 31, 2010 and 2009, and the results of its operations and its cash flows for the years ended December 31, 2010, 2009 and 2008 and for the period from inception (October 18, 2005) through December 31, 2010 in conformity with U.S. generally accepted accounting principles.
| /s/ HEIN & ASSOCIATES LLP |
| Denver, Colorado |
| February 28, 2011 |
F-2
Table of Contents
ASCENT SOLAR TECHNOLOGIES, INC.
(A Development Stage Company)
BALANCE SHEETS
| December 31, 2010 |
December 31, 2009 |
|||||||
| ASSETS | ||||||||
| Current Assets: |
||||||||
| Cash and cash equivalents |
$ | 27,303,217 | $ | 21,717,215 | ||||
| Investments |
17,486,409 | 38,788,671 | ||||||
| Trade receivables |
485,026 | 133,846 | ||||||
| Related party receivable |
2,524 | 21,570 | ||||||
| Inventories |
1,876,834 | 238,809 | ||||||
| Prepaid expenses and other current assets |
510,348 | 578,820 | ||||||
| Total current assets |
47,664,358 | 61,478,931 | ||||||
| Property, Plant and Equipment: |
110,709,320 | 106,726,525 | ||||||
| Less accumulated depreciation and amortization |
(10,706,478 | ) | (4,095,762 | ) | ||||
| 100,002,842 | 102,630,763 | |||||||
| Other Assets: |
||||||||
| Restricted cash |
3,259,350 | — | ||||||
| Deposits on manufacturing equipment |
8,770,693 | 8,316,193 | ||||||
| Patents, net of amortization of $17,186 and $11,511, respectively |
259,439 | 167,030 | ||||||
| Other non-current assets |
64,062 | 67,812 | ||||||
| 12,353,544 | 8,551,035 | |||||||
| Total Assets |
$ | 160,020,744 | $ | 172,660,729 | ||||
| LIABILITIES AND STOCKHOLDERS’ EQUITY | ||||||||
| Current Liabilities: |
||||||||
| Accounts payable |
$ | 1,092,449 | $ | 692,557 | ||||
| Related party payables |
54,037 | 195,954 | ||||||
| Accrued expenses |
1,810,851 | 2,151,875 | ||||||
| Accrued property, plant and equipment |
2,385,301 | 7,992,479 | ||||||
| Deferred contract revenue |
250,705 | — | ||||||
| Current portion of long-term debt |
232,257 | 217,463 | ||||||
| Current portion of long-term debt—related party |
350,000 | — | ||||||
| Total current liabilities |
6,175,600 | 11,250,328 | ||||||
| Long-Term Debt |
6,863,129 | 7,095,386 | ||||||
| Long-Term Debt—Related Party |
400,000 | — | ||||||
| Accrued Warranty Liability |
15,900 | — | ||||||
| Commitments and Contingencies (Notes 4, 11 & 17) |
||||||||
| Stockholders’ Equity: |
||||||||
| Preferred stock, $0.0001 par value, 25,000,000 shares authorized, no shares outstanding |
— | — | ||||||
| Common stock, $0.0001 par value, 75,000,000 shares authorized; 32,265,587 and 26,583,845 shares issued and outstanding at December 31, 2010 and 2009, respectively |
3,226 | 2,658 | ||||||
| Additional paid -in capital |
223,826,191 | 200,344,727 | ||||||
| Deficit accumulated during the development stage |
(77,263,076 | ) | (46,029,358 | ) | ||||
| Accumulated other comprehensive income (loss) |
(226 | ) | (3,012 | ) | ||||
| Total stockholders’ equity |
146,566,115 | 154,315,015 | ||||||
| Total Liabilities and Stockholders’ Equity |
$ | 160,020,744 | $ | 172,660,729 | ||||
The accompanying notes are an integral part of these financial statements.
F-3
Table of Contents
ASCENT SOLAR TECHNOLOGIES, INC.
(A Development Stage Company)
STATEMENTS OF OPERATIONS
| For the Years Ended December 31, | For the Period from inception (October 18, 2005) through December 31, 2010 |
|||||||||||||||
| 2010 | 2009 | 2008 | ||||||||||||||
| Research and Development Revenues |
$ | 2,481,489 | $ | 1,464,346 | $ | 1,499,729 | $ | 6,448,238 | ||||||||
| Costs and Expenses |
||||||||||||||||
| Research and development |
24,354,224 | 15,508,209 | 10,066,055 | 55,563,918 | ||||||||||||
| Selling, general and administrative |
7,453,830 | 7,694,566 | 5,669,746 | 28,691,500 | ||||||||||||
| Impairment loss |
1,769,480 | — | — | 1,769,480 | ||||||||||||
| Total Costs and Expenses |
33,577,534 | 23,202,775 | 15,735,801 | 86,024,898 | ||||||||||||
| Loss from Operations |
(31,096,045 | ) | (21,738,429 | ) | (14,236,072 | ) | (79,576,660 | ) | ||||||||
| Other Income/(Expense) |
||||||||||||||||
| Interest expense |
— | — | (3,438 | ) | (1,087,293 | ) | ||||||||||
| Interest income |
42,756 | 531,697 | 2,145,370 | 4,418,226 | ||||||||||||
| Realized gain (loss) on investments |
192 | 59,383 | (32,103 | ) | 27,473 | |||||||||||
| Realized loss on forward contracts |
(180,621 | ) | (541,771 | ) | (322,430 | ) | (1,044,822 | ) | ||||||||
| Unrealized gain (loss) on forward contracts |
— | 766,403 | (766,403 | ) | — | |||||||||||
| (137,673 | ) | 815,712 | 1,020,996 | 2,313,584 | ||||||||||||
| Net Loss |
$ | (31,233,718 | ) | $ | (20,922,717 | ) | $ | (13,215,076 | ) | $ | (77,263,076 | ) | ||||
| Net Loss Per Share (Basic and diluted) |
$ | (1.14 | ) | $ | (0.93 | ) | $ | (0.78 | ) | |||||||
| Weighted Average Common Shares Outstanding (Basic and diluted) |
27,506,007 | 22,432,803 | 16,895,179 | |||||||||||||
The accompanying notes are an integral part of these financial statements.
F-4
Table of Contents
ASCENT SOLAR TECHNOLOGIES, INC.
(A Development Stage Company)
STATEMENTS OF STOCKHOLDERS’ EQUITY AND COMPREHENSIVE INCOME (LOSS)
For the Period from Inception (October 18, 2005) through December 31, 2010
| Common Stock | Preferred Stock | Additional Paid-In Capital |
Accumulated Deficit |
Accumulated Other Comprehensive Income |
Total Stockholders’ Equity |
|||||||||||||||||||||||||||
| Shares | Amount | Shares | Amount | |||||||||||||||||||||||||||||
| Balance at inception, October 18, 2005 |
— | $ | — | — | $ | — | $ | — | $ | — | $ | — | $ | — | ||||||||||||||||||
| Proceeds from sale of common stock (11/05 @ $.04 per share) |
972,000 | 97 | — | — | 38,783 | — | — | 38,880 | ||||||||||||||||||||||||
| Stock based compensation: |
||||||||||||||||||||||||||||||||
| Founders stock |
— | — | — | — | 933,120 | — | — | 933,120 | ||||||||||||||||||||||||
| Stock options |
— | — | — | — | 26,004 | — | — | 26,004 | ||||||||||||||||||||||||
| Net loss |
— | — | — | — | — | (1,207,234 | ) | — | (1,207,234 | ) | ||||||||||||||||||||||
| Balance, December 31, 2005 |
972,000 | $ | 97 | — | $ | — | $ | 997,907 | $ | (1,207,234 | ) | $ | — | $ | (209,230 | ) | ||||||||||||||||
| Transfer of assets at historical cost (1/06 @ $0.03 per share) |
1,028,000 | 103 | — | — | 31,097 | — | — | 31,200 | ||||||||||||||||||||||||
| Proceeds from IPO (7/06 @ $5.50 per unit) |
3,000,000 | 300 | — | — | 16,499,700 | — | — | 16,500,000 | ||||||||||||||||||||||||
| IPO costs |
— | — | — | — | (2,392,071 | ) | — | — | (2,392,071 | ) | ||||||||||||||||||||||
| Stock issued to bridge loan lenders (7/06 @ $2.75 per share) |
290,894 | 29 | — | — | 799,971 | — | — | 800,000 | ||||||||||||||||||||||||
| Exercise of stock options (9/06 & 12/06 @ $0.10 per share) |
31,200 | 3 | — | — | 3,117 | — | — | 3,120 | ||||||||||||||||||||||||
| Stock based compensation—stock options |
— | — | — | — | 348,943 | — | — | 348,943 | ||||||||||||||||||||||||
| Net loss |
— | — | — | — | — | (4,180,912 | ) | — | (4,180,912 | ) | ||||||||||||||||||||||
| Balance, December 31, 2006 |
5,322,094 | $ | 532 | — | $ | — | $ | 16,288,664 | $ | (5,388,146 | ) | $ | — | $ | 10,901,050 | |||||||||||||||||
| Exercise of stock options (1/07 -12/07 @ $.10) (7/07 - 12/07 @ $4.25) (9/07 - 12/07 @ $2.51 -$2.76) |
169,963 | 17 | — | — | 346,417 | — | — | 346,434 | ||||||||||||||||||||||||
| Conversion of Class A public warrants at $6.60 |
3,098,382 | 310 | — | — | 20,449,011 | — | — | 20,449,321 | ||||||||||||||||||||||||
| Redemption of Class A public warrants at $0.25 per share |
— | — | — | — | (48,128 | ) | — | — | (48,128 | ) | ||||||||||||||||||||||
| Conversion of Class B public warrants at $11.00 per share |
11,000 | 1 | — | — | 120,999 | — | — | 121,000 | ||||||||||||||||||||||||
| Stock based compensation—stock options |
— | — | — | — | 1,734,879 | — | — | 1,734,879 | ||||||||||||||||||||||||
| Proceeds from private placement: |
||||||||||||||||||||||||||||||||
| Common stock (3/07 @ $5.77 and 8/07 @ $7.198) |
2,534,462 | 254 | — | — | 15,962,003 | — | — | 15,962,257 | ||||||||||||||||||||||||
| Class B public warrants (8/07 @ $1.91) |
— | — | — | — | 3,754,468 | — | — | 3,754,468 | ||||||||||||||||||||||||
| Private placement costs |
— | — | — | — | (75,807 | ) | — | — | (75,807 | ) | ||||||||||||||||||||||
| Exercise of representative’s warrants (9/07 - 11/07 @ $6.60 per unit) |
300,000 | 30 | — | — | 1,979,970 | — | — | 1,980,000 | ||||||||||||||||||||||||
| Net loss |
— | — | — | — | — | (6,503,419 | ) | — | (6,503,419 | ) | ||||||||||||||||||||||
| Balance, December 31, 2007 |
11,435,901 | $ | 1,144 | — | $ | — | $ | 60,512,476 | $ | (11,891,565 | ) | $ | — | $ | 48,622,055 | |||||||||||||||||
F-5
Table of Contents
ASCENT SOLAR TECHNOLOGIES, INC.
(A Development Stage Company)
STATEMENTS OF STOCKHOLDERS’ EQUITY AND COMPREHENSIVE INCOME (LOSS)
(Continued)
For the Period from Inception (October 18, 2005) through December 31, 2010
| Common Stock | Preferred Stock | Additional Paid-In Capital |
Accumulated Deficit |
Accumulated Other Comprehensive Income |
Total Stockholders’ Equity |
|||||||||||||||||||||||||||
| Shares | Amount | Shares | Amount | |||||||||||||||||||||||||||||
| Balance, December 31, 2007 |
11,435,901 | $ | 1,144 | — | $ | — | $ | 60,512,476 | $ | (11,891,565 | ) | $ | — | $ | 48,622,055 | |||||||||||||||||
| Components of comprehensive loss |
||||||||||||||||||||||||||||||||
| Unrealized gain on investments |
— | — | — | — | — | — | 331,068 | 331,068 | ||||||||||||||||||||||||
| Net loss |
— | — | — | — | — | (13,215,076 | ) | — | (13,215,076 | ) | ||||||||||||||||||||||
| Total comprehensive loss |
(12,884,008 | ) | ||||||||||||||||||||||||||||||
| Exercise of stock options (1/08 - 12/08 @ $0.10, $2.73, $2.90 & $4.25) |
133,137 | 13 | — | — | 120,520 | — | — | 120,533 | ||||||||||||||||||||||||
| Issuance of Restricted Stock |
69,846 | 7 | — | — | (7 | ) | — | — | — | |||||||||||||||||||||||
| Conversion of Class B public warrants at $11.00 per share |
98,800 | 10 | — | — | 1,086,790 | — | — | 1,086,800 | ||||||||||||||||||||||||
| Stock based compensation |
— | — | — | — | 1,881,399 | — | — | 1,881,399 | ||||||||||||||||||||||||
| Proceeds from private placement: |
||||||||||||||||||||||||||||||||
| Common stock (3/08 @ $9.262 & 10/08 @ $6.176) |
4,763,698 | 476 | — | — | 36,647,217 | — | — | 36,647,693 | ||||||||||||||||||||||||
| Class B public warrants (3/08 @ $3.954) |
— | — | — | — | 6,681,884 | — | — | 6,681,884 | ||||||||||||||||||||||||
| Exercise of representative’s warrants (1/08 @ $6.60 per unit) |
75,000 | 8 | — | — | 494,992 | — | — | 495,000 | ||||||||||||||||||||||||
| Proceeds from shareholder under Section 16(b) |
— | — | — | — | 148,109 | — | — | 148,109 | ||||||||||||||||||||||||
| Proceeds from secondary public offering (5/08 @ $14.00) |
4,370,000 | 437 | — | — | 61,179,563 | — | — | 61,180,000 | ||||||||||||||||||||||||
| Costs of secondary public offering |
— | — | — | — | (4,361,358 | ) | — | — | (4,361,358 | ) | ||||||||||||||||||||||
| Balance, December 31, 2008 |
20,946,382 | $ | 2,095 | — | $ | — | $ | 164,391,585 | $ | (25,106,641 | ) | $ | 331,068 | $ | 139,618,107 | |||||||||||||||||
| Components of comprehensive loss |
||||||||||||||||||||||||||||||||
| Unrealized loss on investments |
— | — | — | — | — | — | (334,080 | ) | (334,080 | ) | ||||||||||||||||||||||
| Net loss |
— | — | — | — | — | (20,922,717 | ) | — | (20,922,717 | ) | ||||||||||||||||||||||
| Total comprehensive loss |
— | (21,256,797 | ) | |||||||||||||||||||||||||||||
| Exercise of stock options (1/09 - 12/09 @ $0.10, $2.76 & $4.25) |
105,169 | 10 | — | — | 339,606 | — | — | 339,616 | ||||||||||||||||||||||||
| Issuance of Restricted Stock |
147,679 | 15 | — | — | (15 | ) | — | — | — | |||||||||||||||||||||||
| Stock based compensation |
— | — | — | — | 2,676,957 | — | — | 2,676,957 | ||||||||||||||||||||||||
| Proceeds from private placement: |
||||||||||||||||||||||||||||||||
| Common stock (10/09 @ $6.50) |
769,230 | 77 | — | — | 4,999,918 | — | — | 4,999,995 | ||||||||||||||||||||||||
| Proceeds from public offering (10/09 @ $6.50) |
4,615,385 | 461 | — | — | 29,999,542 | — | — | 30,000,003 | ||||||||||||||||||||||||
| Costs of public offering |
— | — | — | — | (2,062,866 | ) | — | — | (2,062,866 | ) | ||||||||||||||||||||||
| Balance, December 31, 2009 |
26,583,845 | $ | 2,658 | — | $ | — | $ | 200,344,727 | $ | (46,029,358 | ) | $ | (3,012 | ) | $ | 154,315,015 | ||||||||||||||||
| Components of comprehensive loss |
||||||||||||||||||||||||||||||||
| Unrealized loss on investments |
— | — | — | — | — | — | 2,786 | 2,786 | ||||||||||||||||||||||||
| Net loss |
— | — | — | — | — | (31,233,718 | ) | — | (31,233,718 | ) | ||||||||||||||||||||||
| Total comprehensive loss |
(31,230,932 | ) | ||||||||||||||||||||||||||||||
| Proceeds from public offering (11/11 @ $4.15) |
5,250,000 | 525 | — | — | 21,786,975 | — | — | 21,787,500 | ||||||||||||||||||||||||
| Costs of public offering |
— | — | — | — | (1,409,937 | ) | — | — | (1,409,937 | ) | ||||||||||||||||||||||
| Exercise of stock options (1/10 - 12/10 @ $0.10, $2.90, $2.73, $2.76 & $3.17) |
161,330 | 16 | — | — | 390,985 | — | — | 391,001 | ||||||||||||||||||||||||
| Issuance of Restricted Stock |
270,412 | 27 | — | — | (27 | ) | — | — | — | |||||||||||||||||||||||
| Stock based compensation |
— | — | — | — | 2,713,468 | — | — | 2,713,468 | ||||||||||||||||||||||||
| Balance, December 31, 2010 |
32,265,587 | $ | 3,226 | — | $ | — | $ | 223,826,191 | $ | (77,263,076 | ) | $ | (226 | ) | $ | 146,566,115 | ||||||||||||||||
The accompanying notes are an integral part of these financial statements.
F-6
Table of Contents
ASCENT SOLAR TECHNOLOGIES, INC.
(A Development Stage Company)
STATEMENTS OF CASH FLOWS
| For the Years Ended December 31, |
For the Period from inception (October 18, 2005) through December 31, 2010 |
|||||||||||||||
| 2010 | 2009 | 2008 | ||||||||||||||
| Operating Activities: |
||||||||||||||||
| Net loss |
$ | (31,233,718 | ) | $ | (20,922,717 | ) | $ | (13,215,076 | ) | $ | (77,263,076 | ) | ||||
| Adjustments to reconcile net loss to cash used in operating activities: |
||||||||||||||||
| Depreciation and amortization |
6,690,601 | 2,582,706 | 1,415,424 | 10,805,062 | ||||||||||||
| Stock based compensation |
2,713,468 | 2,676,957 | 1,881,399 | 10,314,770 | ||||||||||||
| Realized loss on forward contract |
180,621 | 541,771 | 322,430 | 1,044,822 | ||||||||||||
| Unrealized loss (gain) on forward contracts |
— | (766,403 | ) | 766,403 | — | |||||||||||
| Charge off of deferred financing costs to interest expense |
— | — | — | 198,565 | ||||||||||||
| Charge off of bridge loan discount to interest expense |
— | — | — | 800,000 | ||||||||||||
| Impairment loss |
1,769,480 | — | — | 1,769,480 | ||||||||||||
| Forfeited down payments on equipment |
74,766 | — | — | 74,766 | ||||||||||||
| Changes in operating assets and liabilities: |
||||||||||||||||
| Accounts receivable |
(351,180 | ) | 202,389 | (131,885 | ) | (485,026 | ) | |||||||||
| Related party receivables |
19,046 | (21,570 | ) | — | (2,524 | ) | ||||||||||
| Inventories |
(1,638,025 | ) | (238,809 | ) | — | (1,876,834 | ) | |||||||||
| Prepaid expenses and other current assets |
68,472 | 167,868 | (397,625 | ) | (510,348 | ) | ||||||||||
| Accounts payable |
399,893 | 427,143 | 7,885 | 1,092,449 | ||||||||||||
| Related party payable |
(141,917 | ) | (67,327 | ) | (1,517 | ) | 54,037 | |||||||||
| Accrued expenses |
(341,024 | ) | 1,205,431 | 273,900 | 1,810,851 | |||||||||||
| Deferred contract revenue |
250,705 | — | — | 250,705 | ||||||||||||
| Warranty reserve |
15,900 | — | — | 15,900 | ||||||||||||
| Net cash used in operating activities |
(21,522,912 | ) | (14,212,561 | ) | (9,078,662 | ) | (51,906,401 | ) | ||||||||
| Investing Activities: |
||||||||||||||||
| Purchases of available-for-sale-securities |
(38,601,173 | ) | (143,989,514 | ) | (552,312,954 | ) | (878,264,434 | ) | ||||||||
| Maturities and sales of available for-sale securities |
59,906,220 | 157,003,665 | 537,627,120 | 860,777,800 | ||||||||||||
| Purchase of property, plant and equipment |
(5,586,336 | ) | (7,049,400 | ) | (16,522,290 | ) | (38,899,289 | ) | ||||||||
| Deposits on manufacturing equipment |
(5,453,464 | ) | (38,566,459 | ) | (34,189,688 | ) | (79,948,708 | ) | ||||||||
| Restricted cash for manufacturing equipment |
(3,259,350 | ) | 2,300,000 | (2,300,000 | ) | (3,259,350 | ) | |||||||||
| Patent activity costs |
(98,084 | ) | (34,365 | ) | (51,682 | ) | (251,668 | ) | ||||||||
| Deposit on Building |
— | — | — | (100,000 | ) | |||||||||||
| Net cash provided by (used in) investing activities |
6,907,813 | (30,336,073 | ) | (67,749,494 | ) | (139,945,649 | ) | |||||||||
| Financing Activities: |
||||||||||||||||
| Proceeds from bridge loan financing |
— | — | — | 1,600,000 | ||||||||||||
| Repayment of bridge loan financing |
— | — | — | (1,600,000 | ) | |||||||||||
| Payment of debt financing costs |
— | — | (75,000 | ) | (273,565 | ) | ||||||||||
| Payment of equity offering costs |
(1,409,937 | ) | (2,062,866 | ) | (4,361,358 | ) | (10,302,040 | ) | ||||||||
| Proceeds from debt |
— | 262,948 | 7,237,052 | 7,700,000 | ||||||||||||
| Repayment of debt |
(217,463 | ) | (187,151 | ) | — | (604,614 | ) | |||||||||
| Repayment of debt—related party |
(350,000 | ) | — | — | (350,000 | ) | ||||||||||
| Proceeds from shareholder under Section 16(b) |
— | — | 148,109 | 148,109 | ||||||||||||
| Proceeds from issuance of stock and warrants |
22,178,501 | 35,339,614 | 106,211,911 | 222,885,505 | ||||||||||||
| Redemption of Class A warrants |
— | — | — | (48,128 | ) | |||||||||||
| Net cash provided by financing activities |
20,201,101 | 33,352,545 | 109,160,714 | 219,155,267 | ||||||||||||
| Net change in cash and cash equivalents |
5,586,002 | (11,196,089 | ) | 32,332,558 | 27,303,217 | |||||||||||
| Cash and cash equivalents at beginning of period |
21,717,215 | 32,913,304 | 580,746 | — | ||||||||||||
| Cash and cash equivalents at end of period |
$ | 27,303,217 | $ | 21,717,215 | $ | 32,913,304 | $ | 27,303,217 | ||||||||
| Supplemental Cash Flow Information: |
||||||||||||||||
| Cash paid for interest |
$ | — | $ | — | $ | — | $ | 424 | ||||||||
| Cash paid for income taxes |
$ | — | $ | — | $ | — | $ | — | ||||||||
| Non-Cash Transactions: |
||||||||||||||||
| Note with ITN and related capital expenditures |
$ | 1,100,000 | $ | — | $ | — | $ | 1,100,000 | ||||||||
| ITN initial contribution of assets for equity |
$ | — | $ | — | $ | — | $ | 31,200 | ||||||||
The accompanying notes are an integral part of these financial statements.
F-7
Table of Contents
ASCENT SOLAR TECHNOLOGIES, INC.
(A Development Stage Company)
NOTES TO FINANCIAL STATEMENTS
NOTE 1. ORGANIZATION
Ascent Solar Technologies, Inc. (“Ascent” or the “Company”) was incorporated on October 18, 2005 from the separation by ITN of its Advanced Photovoltaic Division and all of that division’s key personnel and core technologies. ITN, a private company incorporated in 1994, is an incubator dedicated to the development of thin-film, PV, battery, fuel cell and nano technologies. Through its work on research and development contracts for private and governmental entities, ITN developed proprietary processing and manufacturing know-how applicable to PV products generally, and to CIGS PV products in particular. ITN formed Ascent to commercialize its investment in CIGS PV technologies. In January 2006, in exchange for 1,028,000 shares of common stock of Ascent, ITN assigned to Ascent certain CIGS PV technologies and trade secrets and granted to Ascent a perpetual, exclusive, royalty-free worldwide license to use in connection with the manufacture, development, marketing and commercialization of CIGS PV to produce solar power, certain of ITN’s existing and future proprietary and control technologies that, although non-specific to CIGS PV, Ascent believes will be useful in its production of PV modules for its target markets. Upon receipt of the necessary government approvals and pursuant to novation in early 2007, ITN assigned government-funded research and development contracts to Ascent and also transferred the key personnel working on the contracts to Ascent. Today, ITN still provides Ascent a limited amount of technical services.
NOTE 2. BASIS OF PRESENTATION
The Company’s activities to date have consisted substantially of raising capital, research and development, establishment of our FAB1 production plant and the development of our FAB2 expansion plant. Revenues to date have been primarily generated from the Company’s governmental research and development (R&D) contracts and have not been significant. The Company’s planned principal operations to commercialize flexible PV modules have commenced, but have generated limited revenue to date. Accordingly, the Company is considered to be in the development stage and has presented its financial statements under the provisions of ASC Topic 915—Development Stage Entities which requires additional disclosure of inception to date activity in our Statements of Operations, Statements of Stockholders’ Equity and Comprehensive Income (Loss) and Statements of Cash Flows.
NOTE 3. SUMMARY OF SIGNIFICANT ACCOUNTING POLICIES
Cash Equivalents: The Company classifies all highly liquid debt securities purchased with an original maturity of three months or less to be cash equivalents. The Company maintains cash balances which may exceed federally insured limits. The Company does not believe that this results in significant credit risk.
Restricted Cash: The Company classifies all cash or cash items that are legally restricted to usage or withdrawal as restricted cash. If such funds are to be used to acquire non-current assets or to liquidate long-term liabilities, they shall be classified as long-term in the Balance Sheets. Funds restricted for the payment of interest, current maturities of debt or other current liabilities shall be classified as current.
Investments: The Company has classified its investments as “available-for-sale.” Such investments are carried at fair value, based on quoted market prices with the unrealized holding gains and losses reported as “Accumulated other comprehensive income (loss)” in the stockholders’ equity section of the Balance Sheets. Realized gains and losses on sales of securities are computed using the specific identification method. The Company evaluates declines in market value for potential impairment. If the decline results in a value below cost and is determined to be other than temporary, the investment is written down to its impaired value and a new cost basis is established.
F-8
Table of Contents
Fair Value Estimates: The fair value of an asset or liability is the amount at which it could be exchanged or settled in a current transaction between willing parties. The Company has recorded investments at fair value and has classified them as Level 1, 2 or 3 within the fair value hierarchy. Fair values determined by Level 1 inputs utilize quoted prices in active markets for identical assets or liabilities. Fair values determined by Level 2 inputs utilize data points that are observable such as quoted prices and other inputs that can be corroborated by observable market data. Fair values determined by Level 3 inputs utilize unobservable data points for the asset or liability. The carrying value for cash and cash equivalents, restricted cash, accounts receivable, accounts payable, accrued property plant, and equipment, accrued expenses and other assets and liabilities approximate their fair values due to their short maturities.
Foreign Currency Translation: Bank account balances related to the Company’s foreign currencies are translated to U.S. dollars utilizing the period end exchange rate. Gains or losses on foreign currency translation adjustments in connection with the Company’s forward contracts are recorded within realized gain (loss) on forward contracts in “Other Income/(Expense)” on the Statements of Operations.
Revenue Recognition: Revenue from governmental research and development contracts is generated under terms that are cost plus fee or firm fixed price. Revenue from cost plus fee contracts is recognized as costs are incurred on the basis of direct costs plus allowable indirect costs and an allocable portion of the fixed fee. Revenue from firm fixed price contracts is recognized under the percentage-of-completion method of accounting, with costs and estimated profits included in contract revenue as work is performed. If actual and estimated costs to complete a contract indicate a loss, provision is made currently for the loss anticipated on the contract. Revenue from commercial sales of flexible PV modules is recognized as modules are delivered and title has transferred to the customer. Product revenue through December 31, 2010 is included in research and development revenue as the Company is in the development stage and such revenues (totaling $811,906 for the year ended December 31, 2010) were generated from a limited number of customers as the product is being brought to market.
Shipping and Handling Costs: The Company classifies shipping and handling costs for solar modules shipped to our customers as a component of “Research and development costs” on the Company’s Statements of Operations. Customer payments of shipping and handling costs are recorded as a component of “Revenues.”
Deferred Contract Revenue: Deferred contract revenue is generated from governmental research and development contracts. The amount deferred represents billings in excess of costs incurred on firm fixed price deliverables. As of December 31, 2010 and 2009, deferred contract revenue was $250,705 and $0, respectively. Amounts classified in deferred contract revenue are expected to be recognized within one year of the Balance Sheet date.
Receivables and Allowance for Doubtful Accounts: Trade accounts receivable are recorded at the invoiced amount as the result of transactions with customers. The Company maintains allowances for doubtful accounts for estimated losses resulting from the inability of its customers to make required payments. The Company estimates the collectability of accounts receivable using analysis of historical bad debts, customer credit-worthiness and current economic trends. Necessary reserves are established on an account-by-account basis. Account balances are written off against the allowance in the period in which the Company determines that is it probable that the receivable will not be recovered.
Product Warranties: The Company provides a limited warranty to the original purchaser of products against defective materials and workmanship. The Company also guarantees modules will achieve and maintain the stated conversion efficiency rating. Warranty accruals are recorded at the time of sale and are estimated based upon product warranty terms, historical experience and analysis of peer company product returns. The Company assesses the adequacy of its liabilities and makes adjustments as necessary based on known or anticipated warranty claims, or as new information becomes available.
F-9
Table of Contents
Patents: At such time as the Company is awarded patents, patent costs are amortized on a straight-line basis over the legal life on the patents, or over their estimated useful lives, whichever is shorter. As of December 31, 2010, the Company had $259,439 of net patent costs, of which $42,110 represents costs net of amortization incurred for awarded patents, and the remaining $217,329 represents costs incurred for patent applications to be filed. Amortization expense was $5,675 for the year ended December 31, 2010 and $5,116 for each of the years ended December 31, 2009 and 2008.
Inventories: All inventories are stated at the lower of cost or market, with cost determined using the weighted average method. Elements of cost include raw material acquisition and conversion costs, an allocated portion of indirect production costs, inventory maintenance costs and depreciation and amortization. When plant capacity is significantly underutilized, allocated costs included in inventories are based on a normal level of activity, with the excess costs charged to expense in the period incurred.
Inventory balances are frequently evaluated to ensure they exceed net realizable value. The computation for net realizable value takes into account many factors, including expected demand, product lifecycle and development plans, module efficiency, quality issues, obsolescence and others. If actual demand and market conditions are less favorable than those estimated by management, additional inventory write-downs may be required. The Company’s inventories have a long life cycle and obsolescence is not a significant factor in their valuation.
Property, Plant and Equipment: Property, plant and equipment are recorded at the original cost to the Company. Assets are being depreciated over estimated useful lives of three to forty years using the straight-line method, as presented in the table below, commencing when the asset is placed in service. Leasehold improvements are depreciated over the shorter of the remainder of the lease term or the life of the improvements. Upon retirement or disposal, the cost of the asset disposed of and the related accumulated depreciation are removed from the accounts and any gain or loss is reflected in income. Expenditures for repairs and maintenance are expensed as incurred.
| Useful Lives in Years | ||
| Buildings |
40 | |
| Manufacturing machinery and equipment |
5 - 10 | |
| Furniture, fixtures, computer hardware/software |
3 - 7 | |
| Leasehold improvements |
life of lease |
Interest Capitalization: The Company capitalizes interest cost as part of the historical cost of acquiring or constructing certain assets during the period of time required to get the asset ready for its intended use. During 2009 and 2010, these assets consisted of property, plant and equipment. The Company capitalizes interest to the extent that expenditures to acquire or construct an asset have occurred and interest cost has been incurred.
Long-lived assets: The Company analyzes its long-lived tangible assets (property, plant and equipment) and definitive-lived intangible assets (patents) for impairment by assessing if the asset cost will be recoverable. Events that might cause impairment would include significant current period operating or cash flow losses associated with the use of a long-lived asset or group of assets combined with a history of such losses, significant changes in the manner of use of assets and significant negative industry or economic trends.
Net loss per Common Share: Basic earnings per share include no dilution and are computed by dividing income available to common stockholders by the weighted-average number of shares outstanding during the period. Diluted earnings per share reflect the potential of securities that could share in the earnings of the Company, similar to fully diluted earnings per share. Common stock equivalents consisting of Class B warrants, IPO warrants (representative warrants), and stock options and unvested restricted stock outstanding as of December 31, 2010 of approximately 12.7 million shares, have been omitted from loss per share because they are anti-dilutive. Net Loss per share was the same for both basic and diluted for the periods ended December 31, 2010, 2009 and 2008.
F-10
Table of Contents
Research and Development Costs: Research and development costs are incurred during the process of researching and developing new products and enhancing the Company’s manufacturing processes and consist primarily of compensation and related costs for personnel, materials, supplies and equipment depreciation. The Company expenses these costs as incurred until the resulting product has been completed and tested and is ready for commercial manufacturing. The Company also incurs research and development expenses on its federal government research and development contracts, which the Company expenses as incurred.
Income Taxes: Deferred income taxes are provided using the liability method whereby deferred tax assets are recognized for deductible temporary differences and operating loss and tax credit carry forwards and deferred tax liabilities are recognized for taxable temporary differences. Temporary differences are the differences between the reported amounts of assets and liabilities and their tax bases. Deferred tax assets are reduced by a valuation allowance when, in the opinion of management, it is more likely than not that some portion or all of the deferred tax assets will not be realized. Deferred tax assets and liabilities are adjusted for the effects of the changes in tax laws and rates as of the date of enactment. Interest and penalties, if applicable, would be recorded in operations.
The Company has analyzed filing positions in all of the federal and state jurisdictions where it is required to file income tax returns, as well as all open tax years (2006-2010) in these jurisdictions. The Company believes that its income tax filing positions and deductions will be sustained on audit and does not anticipate any adjustments that will result in a material adverse effect on the Company’s financial condition, results of operations, or cash flows. Therefore, no reserves for uncertain income tax positions have been recorded.
Share-Based Compensation: The Company measures and recognizes compensation expense for all share-based payment awards made to employees, officers, directors, and consultants based on estimated fair values. The company estimates the fair value of share-based payment awards on the date of grant using an option-pricing model for option awards. The value of the portion of the award that is ultimately expected to vest is recognized as expense over the requisite service period in the Company’s Statements of Operations. Share-based compensation is based on awards ultimately expected to vest and is reduced for estimated forfeitures. Forfeitures are estimated at the time of grant and revised, as necessary, in subsequent periods if actual forfeitures differ from those estimates. For purposes of determining estimated fair value of share-based payment awards on the date of grant the Company uses the Black-Scholes option-pricing model (“Black-Scholes Model”) for option awards. The Black-Scholes Model requires the input of highly subjective assumptions. Because the Company’s employee stock options may have characteristics significantly different from those of traded options, and because changes in the subjective input assumptions can materially affect the fair value estimate, in management’s opinion, the existing models may not provide a reliable single measure of the fair value of the Company’s employee stock options. Management will continue to assess the assumptions and methodologies used to calculate estimated fair value of share-based compensation. Circumstances may change and additional data may become available over time, which result in changes to these assumptions and methodologies, which could materially impact the Company’s fair value determination. The Company estimates the fair value of its restricted stock awards as its stock price on the grant date.
The accounting guidance for share-based compensation may be subject to further interpretation and refinement over time. There are significant differences among option valuation models, and this may result in a lack of comparability with other companies that use different models, methods and assumptions. If factors change and the Company employs different assumptions in the accounting for share-based compensation in future periods, or if the Company decides to use a different valuation model, the compensation expense that the Company records in the future may differ significantly from what it has recorded in the current period and could materially affect its loss from operations, net loss and net loss per share.
Comprehensive income (loss): The Company’s comprehensive income (loss) consists of its net income (loss) and changes in unrealized gains or losses on available-for-sale investments, the impact of which has been excluded from net loss. The Company presents its comprehensive income (loss) in the Statements of
F-11
Table of Contents
Stockholders’ Equity and Comprehensive Income (Loss). The Company’s accumulated other comprehensive income (loss) is presented as a component of equity in the Balance Sheets and consists of the cumulative amount of unrealized gains or losses on available-for-sale investments that have been incurred since the inception of the Company’s business.
Reclassifications: Certain reclassifications have been made to the 2008 and 2009 financial information to conform to the 2010 presentation.
Use of Estimates: The preparation of financial statements in conformity with generally accepted accounting principles requires management to make estimates and assumptions that affect the reported amounts of assets and liabilities and disclosure of contingent assets and liabilities at the date of financial statements and the reported amounts of revenues and expenses during the reporting period. Actual results could differ from those estimates.
Recent Accounting Pronouncements: In January 2010, the FASB issued ASU 2010-06, Fair Value Measurements and Disclosures (Topic 820)—Improving Disclosures about Fair Value Measurements. This ASU requires new disclosures and clarifies certain existing disclosure requirements about fair value measurements. ASU 2010-06 requires a reporting entity to disclose significant transfers in and out of Level 1 and Level 2 fair value measurements, to describe the reasons for the transfers and to present separately information about purchases, sales, issuances and settlements for fair value measurements using significant unobservable inputs. ASU 2010-06 is effective for interim and annual reporting periods beginning after December 15, 2009, except for the disclosures about purchases, sales, issuances and settlements in the roll forward of activity in Level 3 fair value measurements, which are effective for interim and annual reporting periods beginning after December 15, 2010; early adoption is permitted. The adoption of ASU 2010-06 did not have a material impact on the Company’s financial position, results of operations or cash flows.
In April 2010, the FASB issued ASU 2010-17, Revenue Recognition—Milestone Method (Topic 605). This ASU requires new disclosures and provides a consistent framework for applying the milestone method of revenue recognition. ASU 2010-17 states that a vendor may recognize consideration that is contingent upon achievement of a milestone in its entirety as revenue in the period in which the milestone is achieved only if the milestone meets all criteria to be considered substantive. Determining whether a milestone is substantive is a matter of judgment made at the inception of the arrangement. ASU 2010-17 is effective on a prospective basis for milestones achieved in fiscal years, and interim periods within those years, beginning on or after June 15, 2010; early adoption is permitted. The Company does not anticipate the adoption of ASU 2010-17 will have a material impact on its financial position, results of operations or cash flows.
In August 2010, the FASB issued ASU 2010-21, Accounting for Technical Amendments to Various SEC Rules and Schedules. This ASU amends various SEC paragraphs pursuant to the issuance of Release No. 33-9026: Technical Amendments to Rules, Forms, Schedules and Codification of Financial Reporting Policies. The adoption of ASU 2010-21 did not have any impact on the Company’s financial position, results of operations or cash flows.
In August 2010, the FASB issued ASU 2010-22, Technical Corrections to SEC Paragraphs—An Announcement made by the Staff of the SEC. This ASU amends various SEC paragraphs based on external comments received and the issuance of SAB 112, which amends or rescinds portions of certain SAB topics. SAB 112 was issued to bring existing SEC guidance into conformity with ASC 805, Business Combination, and ASC 810, Consolidation. The adoption of ASU 2010-22 did not have any impact on the Company’s financial position, results of operations or cash flows.
NOTE 4. LIQUIDITY AND CONTINUED OPERATIONS
As of December 31, 2010, the Company had approximately $44.8 million in cash and investments. As discussed in Note 2, the Company is in the development stage and is currently incurring significant losses from
F-12
Table of Contents
operations as it continues to ramp up production. The Company made cash payments of approximately $11.0 million in 2010 for property, plant and equipment and deposits on equipment. We expect to make payments on equipment for FAB2 of approximately $10.7 million during 2011.
The Company commenced limited production on its FAB1 production line in the first quarter of 2009 and the FAB2 production line in 2010. The Company does not expect that sales revenue and cash flows from the FAB1 and FAB2 production lines will be sufficient to support operations and cash requirements until actual full production capacity on the FAB2 production line is achieved.
The Company expects current cash and investments will be sufficient to fund operations and capital expenditures for the next twelve months. Changes in the level of expected operating losses, the timing of planned capital expenditures or other factors may negatively impact cash flows and reduce current cash and investments faster than anticipated. The Company may need to raise additional capital in the future. The capital markets are currently volatile and there is no assurance that we will be able to raise additional capital on acceptable terms or at all.
NOTE 5. RESTRICTED CASH
In October 2010, the Company established a $3,259,350 irrevocable letter of credit with its bank in favor of an equipment vendor. The letter of credit is collateralized by an interest bearing account and the funds are expected to be released for payment in June 2011. This amount is reflected as “Restricted cash” under “Other Assets” on the Balance Sheet as of December 31, 2010.
NOTE 6. FAIR VALUE MEASUREMENTS
Fair value is defined as the exchange price that would be received for an asset or paid to transfer a liability (an exit price) in the principal or most advantageous market for the asset or liability in an orderly transaction between market participants on the measurement date. Valuation techniques used to measure fair value must maximize the use of observable inputs and minimize the use of unobservable inputs. The Company uses fair value hierarchy based on three levels of inputs, of which the first two are considered observable and the last unobservable, to measure fair value:
| • | Level 1—Quoted prices in active markets for identical assets or liabilities. |
| • | Level 2—Inputs other than Level 1 that are observable, either directly or indirectly, such as quoted prices for similar assets or liabilities; quoted prices in markets that are not active; or other inputs that are observable or can be corroborated by observable market data for substantially the full term of the assets or liabilities. |
| • | Level 3—Unobservable inputs that are supported by little or no market activity and that are significant to the fair value of the assets or liabilities. |
The following table represents the Company’s fair value hierarchy for its financial assets measured at fair value on a recurring basis and its classification on the balance sheet as of December 31, 2010:
| Level 1 | Level 2 | Level 3 | Total | Cash Equivalents |
Investments | |||||||||||||||||||
| Financial Assets: |
||||||||||||||||||||||||
| U.S. government securities |
$ | — | $ | 16,905,184 | $ | — | $ | 16,905,184 | $ | 6,316,406 | $ | 10,588,778 | ||||||||||||
| Money market funds |
762,421 | — | — | 762,421 | 762,421 | — | ||||||||||||||||||
| Corporate securities |
— | 23,991,115 | — | 23,991,115 | 17,093,484 | 6,897,631 | ||||||||||||||||||
| $ | 762,421 | $ | 40,896,299 | $ | — | $ | 41,658,720 | $ | 24,172,311 | $ | 17,486,409 | |||||||||||||
F-13
Table of Contents
As of the balance sheet date, the Company held securities issued by U.S. government agencies (AAA/Aaa ratings) and A-1A-1+ rated corporate notes. Approximately $40.9 million of these securities are classified as Level 2 because the Company does not believe that it is possible to obtain a firm, up-to-date price of such securities from, for example, a major exchange; and as a result, the Company relies on its brokerage firm and investment manager to report its fair value of such securities at the end of each month. Investments have not been transferred between levels.
NOTE 7. INVESTMENTS
Securities held by the Company as of December 31, 2010 are classified as available-for-sale and consisted of U.S. government securities and corporate securities. Such investments are carried at fair value, based on quoted market prices with the unrealized holding gains and losses reported as Accumulated other comprehensive income (loss) in the stockholders’ equity section of the Balance Sheet. Realized gains and losses on sales of securities are computed using the specific identification method. The Company evaluates declines in market value for potential impairment. If the decline results in a value below cost and is determined to be other than temporary, the investment is written down to its impaired value and a new cost basis is established. A summary of available-for-sale securities as of December 31, 2010 is as follows:
| Amortized Cost |
Gross Unrealized Gains |
Gross Unrealized Losses |
Estimated Fair Value |
|||||||||||||
| U.S. government securities |
$ | 10,588,590 | $ | 1,345 | $ | (1,157 | ) | $ | 10,588,778 | |||||||
| Corporate securities |
6,897,540 | 91 | — | 6,897,631 | ||||||||||||
| Total |
$ | 17,486,130 | $ | 1,436 | $ | (1,157 | ) | $ | 17,486,409 | |||||||
Contractual maturities of available-for-sale investments as of December 31, 2010 were all one year or less as follows:
| Amortized Cost |
Gross Unrealized Gains |
Gross Unrealized Losses |
Estimated Fair Value |
|||||||||||||
| One year or less |
$ | 17,486,130 | $ | 1,436 | $ | (1,157 | ) | $ | 17,486,409 | |||||||
The Company typically invests in highly rated securities with low probabilities of default. The Company’s investment policy specifies minimum investment grade criteria, types of acceptable investments, concentration limitations and duration guidelines.
All securities having an unrealized loss as of December 31, 2010 have been in a loss position for less than twelve months.
NOTE 8. ACCOUNTS RECEIVABLE
Accounts receivable consist of amounts generated from government contracts and sales of PV modules. Unbilled receivables represent costs incurred but not yet billed, including retainage amounts by the government on contracts that have not been closed out at the end of the period. All accounts receivable as of December 31, 2010 are deemed collectible.
The following table summarizes components of accounts receivable as of December 31, 2010 and 2009:
| As of December 31, | ||||||||
| 2010 | 2009 | |||||||
| Billed receivables |
$ | 485,026 | $ | 115,474 | ||||
| Unbilled receivables |
— | 18,372 | ||||||
| Accounts receivable, gross |
$ | 485,026 | $ | 133,846 | ||||
F-14
Table of Contents
Provisional Indirect Cost Rates—During 2008, 2009 and 2010, the Company billed the government under cost-based R&D contracts at provisional billing rates which permit the recovery of indirect costs. These rates are subject to audit on an annual basis by the government agencies’ cognizant audit agency. The cost audit will result in the negotiation and determination of the final indirect cost rates. In the opinion of management, re-determination of any cost-based contracts will not have a material effect on the Company’s financial position or results of operations.
Contract Status—The Company has authorized but not completed contracts on which work is in process as follows as of December 31, 2010 and 2009:
| As of December 31, | ||||||||
| 2010 | 2009 | |||||||
| Total contract price of initial contract awards, including exercised options and approved change orders (modifications) |
$ | 11,426,858 | $ | 7,262,134 | ||||
| Completed to date |
(7,289,426 | ) | (5,688,064 | ) | ||||
| Authorized backlog |
$ | 4,137,432 | $ | 1,574,070 | ||||
NOTE 9. PROPERTY, PLANT AND EQUIPMENT
The following table summarizes property, plant and equipment as of December 31, 2010 and 2009:
| As of December 31, | ||||||||
| 2010 | 2009 | |||||||
| Building |
$ | 19,506,814 | $ | 19,336,263 | ||||
| Furniture, fixtures, computer hardware and computer software |
1,151,745 | 1,057,240 | ||||||
| Manufacturing machinery and equipment |
72,111,366 | 27,824,678 | ||||||
| Leasehold improvements |
884,709 | 840,729 | ||||||
| Net depreciable property, plant and equipment |
93,654,634 | 49,058,910 | ||||||
| Manufacturing machinery and equipment in progress |
17,054,686 | 57,667,615 | ||||||
| Property, plant and equipment |
110,709,320 | 106,726,525 | ||||||
| Less: Accumulated depreciation and amortization |
(10,706,478 | ) | (4,095,762 | ) | ||||
| Net property, plant and equipment |
$ | 100,002,842 | $ | 102,630,763 | ||||
As of December 31, 2010, approximately $17.1 million of equipment for the FAB2 production line is reflected above as “Manufacturing machinery and equipment in progress” until the Company completes qualification of the equipment. Depreciation and amortization expense for the years ended December 31, 2010, 2009 and 2008 was $6,681,176, $2,580,044 and $1,406,871, respectively. Depreciation and amortization expense is recorded under “Research and development” expense and “General and administrative” expense in the Statements of Operations.
During the fourth quarter of 2010, there was a significant change in the planned usage of two manufacturing tools which impaired the value of the equipment. The two tools had an installed cost of $2,823,880 and were considered unusable after the development of a more efficient or different manufacturing process. Due to the uniqueness and complexity of these tools, the market for these tools is very limited. Salvage value of the tools has been determined internally by members of management with substantial experience in valuation of manufacturing equipment. The salvage value for the two tools as of December 31, 2010 was determined to be $983,939. The total impairment loss incurred for the write-down of these tools totaled $1,769,480, net of accumulated depreciation of $70,460, and is included in the Statement of Operations for the year ended December 31, 2010 under the caption “Impairment loss.”
F-15
Table of Contents
The Company incurred and capitalized interest costs related to the FAB2 building loan as follows during the years ended December 31, 2010 and 2009.
| For the Years Ended December 31, |
||||||||
| 2010 | 2009 | |||||||
| Interest cost incurred |
$ | 479,898 | $ | 456,534 | ||||
| Interest cost capitalized |
(479,898 | ) | (456,534 | ) | ||||
| Interest expense, net |
$ | — | $ | — | ||||
NOTE 10. INVENTORIES
Inventories consisted of the following at December 31, 2010 and 2009:
| As of December 31, | ||||||||
| 2010 | 2009 | |||||||
| Raw materials |
$ | 1,468,425 | $ | 238,809 | ||||
| Work in process |
317,468 | — | ||||||
| Finished goods |
90,941 | — | ||||||
| Total |
$ | 1,876,834 | $ | 238,809 | ||||
NOTE 11. DEPOSITS ON MANUFACTURING EQUIPMENT
As of December 31, 2010, deposits on manufacturing equipment related to the purchase of equipment not yet delivered to the FAB2 production line were approximately $8.8 million, all of which is expected to be delivered in 2011. The equipment purchase agreements are conditional purchase obligations that have milestone-based deliverables, such as the Company’s acceptance of design requirements and successful installation and commissioning of the equipment.
NOTE 12. DEBT
On February 8, 2008, the Company acquired an approximately 120,000 square foot manufacturing and office facility in Thornton, Colorado, for approximately $5.5 million. The purchase was financed by a promissory note, deed of trust and construction loan agreement (the “Construction Loan”) with the Colorado Housing and Finance Authority (“CHFA”), which provided the Company borrowing availability of up to $7.5 million for the building and building improvements. The Company paid approximately $1.3 million in cash and was advanced approximately $4.2 million from CHFA to fund the initial acquisition of the property. The Construction Loan terms required payments of interest at 6.6% on the outstanding balance. On January 29, 2009, the Construction Loan was converted to a permanent loan pursuant to a Loan Modification Agreement between the Company and CHFA (the “Permanent Loan”). The Permanent Loan has an interest rate of 6.6% and the principal will be amortized over a period of approximately 19 years and one month consistent with a maturity date of 20 years after the incurrence of the promissory note and Construction Loan. A loan commitment fee of $75,000 was paid in 2008 and is reflected on the balance sheet in non-current assets. This fee is being amortized into interest expense over the 20 year life of the Loan. The Company will incur a prepayment penalty if the Permanent Loan is prepaid prior to December 31, 2015 equal to the sum of (i) the present value of the total principal and interest payments due under the Note from the prepayment date to December 31, 2015, and (ii) the present value of the remaining principal balance of the Note that would have been due as of December 31, 2015, less the principal amount of the Note outstanding. Further, pursuant to certain negative covenants contained in the deed of trust associated with the Permanent Loan, until the Permanent Loan is repaid and all of the Company’s secured obligations are performed in full, the Company may not, among other things, without CHFA’s prior written consent (which by the terms of the deed of trust is subject to a reasonableness requirement): create or incur
F-16
Table of Contents
additional indebtedness (other than obligations created or incurred in the ordinary course of business); merge or consolidate with any other entity; or make loans or advances to the Company’s officers, shareholders, directors or employees.
The outstanding balance of the Permanent Loan was $7,095,386 as of December 31, 2010. Future principal payments are due as follows:
| 2011 |
$ | 232,257 | ||
| 2012 |
248,059 | |||
| 2013 |
264,935 | |||
| 2014 |
282,960 | |||
| 2015 |
302,210 | |||
| Thereafter |
5,764,965 | |||
| $ | 7,095,386 | |||
NOTE 13. DERIVATIVE FINANCIAL INSTRUMENTS
The Company is actively engaged in purchasing manufacturing equipment internationally and is exposed to foreign currency risk. In July 2008 and March 2009, the Company entered into fair value hedges utilizing forward contracts designed to match scheduled contractual payments to equipment suppliers which are denominated in Euros and Yen. The total notional value of the Euro forward contracts was approximately €6.4 million with various contract settlement dates beginning September 15, 2008 through July 31, 2009. The total notional value of the Yen forward contracts was approximately ¥521.4 million with contract settlement dates of March and April 2009. The Company elected not to use hedge accounting and accordingly, the unrealized gain and loss on each forward contract was determined at each balance sheet date based upon current market rates and is reported as an Unrealized gain or loss on forward contracts in the Statements of Operations. Upon settlement of the forward contracts, a realized gain or loss is reported in the Statements of Operations as Realized gain (loss) on forward contracts. For the years ended December 31, 2010 and 2009, the realized loss was $180,621 and $541,771 respectively.
Although the hedging activity is designed to fix the dollar amount to be expended, the asset purchased is recorded at the spot rate in effect as of the date of the payment to the supplier. The difference between the spot rate and the forward rate has been reported as a loss on forward contracts. During 2009, forward contracts for delivery of €4.8 million and ¥521.4 million were settled. Included in cash and cash equivalents at December 31, 2010 is $2.7 million related to €2.0 million. As of December 31, 2010, the Company held two forward currency option contracts hedging approximately $1.7 million in equipment payments to be remitted in Yen. Accounts denominated in Yen and Euros are held in the Company’s bank account for future payments to equipment suppliers. Period end foreign currency translation adjustments related to the Euros on deposit in the Company’s bank account are reflected as Realized gain (loss) on forward contracts in the Statements of Operations. Derivative financial instruments are not used for speculative or trading purposes.
NOTE 14. STOCKHOLDERS’ EQUITY
The Company’s authorized capital stock consists of 75,000,000 shares of common stock, $0.0001 par value, and 25,000,000 shares of preferred stock, $0.0001 par value. Each share of common stock has the right to one vote.
Preferred stock, $0.0001 par value per share, may be issued in classes or series. Designations, powers, preferences, rights, qualifications, limitations and restrictions are determined by the Company’s Board of Directors.
F-17
Table of Contents
Initial Public Offering: The Company completed its initial public offering (“IPO”) of 3,000,000 units on July 14, 2006. Each unit consisted of one share of common stock, one redeemable Class A warrant and two non-redeemable Class B warrants. The IPO price was $5.50 per unit. The gross proceeds of the offering were $16,500,000. Ascent’s net proceeds from the offering, after deducting the underwriter’s discount of $1,097,250 and other fees and expenses, aggregated approximately $14,000,000.
The common stock and Class A and Class B warrants traded only as a unit through August 9, 2006, after which the common stock, the Class A warrants and the Class B warrants began trading separately.
Class A warrants. On May 24, 2007, the Company publicly announced that it intended to redeem its outstanding Class A warrants. The Class A warrants became eligible for redemption by the Company at $0.25 per warrant on April 16, 2007, when the last reported sale price of the Company’s common stock had equaled or exceeded $9.35 for five consecutive trading days. There were 3,290,894 Class A warrants issued in connection with the Company’s IPO, including the warrants issued to the Bridge Noteholders. The Class A warrants were exercisable at a price of $6.60 per share.
The exercise period ended June 22, 2007. During the exercise period, 3,098,382 Class A warrants (94.1% of the total outstanding) were exercised for an equal number of shares of common stock, and the Company received $20,449,321 in proceeds from the warrant exercises. At the end of the exercise period, 192,512 Class A warrants remained outstanding. The Company has set aside funds with its warrant transfer agent to redeem the outstanding warrants for $0.25 per warrant, or a total cost of $48,128. As of December 31, 2010, 9,090 Class A warrants remained unredeemed.
Class B warrants. The Class B warrants included in the units became exercisable on August 10, 2006. The exercise price of a Class B public warrant is $11.00. The Class B warrants expire on July 10, 2011. The Company does not have the right to redeem the Class B warrants. During the years ended December 31, 2008 and 2007, 98,800 and 11,000 Class B warrants, respectively, were exercised resulting in proceeds to the Company of approximately $1.09 million and $121,000 respectively. As of December 31, 2010, 10,502,583 Class B warrants were outstanding.
IPO warrants. Warrants to purchase 300,000 units at $6.60 were issued to underwriters of the Company’s IPO in July 2006 (representative’s warrants). A unit consists of one share of common stock, one Class A redeemable warrant and two Class B non-redeemable warrants. The warrants expire on July 10, 2011. Upon exercise of the representative’s warrants, holders will be forced to choose whether to exercise the underlying Class A warrants or hold them for redemption. As noted above, on June 25, 2007, any Class A warrants then outstanding expired and became redeemable.
Representative’s warrants to purchase 150,000 units have been exercised as of December 31, 2007, as have the 150,000 underlying Class A warrants resulting in an issuance of 300,000 shares of common stock and 300,000 Class B warrants for total proceeds to the Company of $1.98 million. During the year ended December 31, 2008 an additional 37,500 units were exercised, as have the 37,500 underlying Class A warrants, resulting in an issuance of 75,000 shares of common stock and 75,000 Class B warrants for total proceeds to the Company of $495,000. To the extent that holders of representative’s warrants are entitled to receive Class A warrants upon exercise of the representative’s warrants, those warrants will be immediately subject to call for redemption at $0.25 per warrant. The holders will then have to decide whether to exercise their Class A warrants or hold them for redemption. As of December 31, 2010, 112,500 representative’s warrants remained unexercised.
Private Placement of Securities: The Company completed a private placement of securities with Norsk Hydro Produksjon AS (“Hydro”) in March 2007. Hydro is a subsidiary of Norsk Hydro ASA. Hydro purchased 1,600,000 shares of the Company’s common stock (representing 23% of the Company’s then outstanding common stock post transaction) for an aggregate purchase price of $9,236,000. The Company recorded $75,807 of costs associated with the private placement as a reduction to Additional paid in capital on the Company’s Balance Sheets. In connection with the private placement, Hydro was granted options to purchase additional shares and warrants.
F-18
Table of Contents
In August 2007, Hydro acquired an additional 934,462 shares of the Company’s common stock and 1,965,690 Class B warrants through the exercise of an option previously granted to Hydro and approved by Ascent’s stockholders in June 2007. Gross proceeds to the Company were $10.48 million, and reflected per share and per warrant purchase prices equal to the average of the closing bids of each security, as reported by NASDAQ, for the five consecutive trading days preceding exercise. After acquiring these additional shares, Hydro again held 23% of the then outstanding common shares, after its holdings were diluted as the result of the redemption of Class A warrants and 23% of total outstanding Class B warrants. Pursuant to a second option that was approved by Ascent’s stockholders in June 2007, beginning December 13, 2007, Hydro was entitled to purchase additional shares and Class B warrants up to a maximum of 35% of each class of security.
In March 2008, Hydro acquired an additional 2,341,897 shares of the Company’s common stock and 1,689,905 Class B warrants through the exercise of the second option previously granted to Hydro and approved by Ascent’s stockholders in June 2007, resulting in Hydro ownership of approximately 35% of each class of security. Gross proceeds to the Company were $28.4 million, and reflected per share and per warrant purchase prices were equal to the average of the closing bids of each security, as reported by NASDAQ, for the five consecutive trading days preceding exercise. As a result of the Company’s Secondary Public Offering in May 2008, Hydro’s holdings were diluted to approximately 27% of the then outstanding common stock.
On October 8, 2008, Hydro acquired an additional 2,421,801 shares of the Company’s common stock. The purchase resulted in a return to Hydro’s ownership of approximately 35% of the Company’s then outstanding common stock. Gross proceeds to the Company from the follow on investment were approximately $15 million, and reflect per share purchase prices equal to the average of the closing bids of each security, as reported by NASDAQ, for the five consecutive trading days preceding the purchase. Until June 15, 2009, the second option entitles Hydro to purchase from the Company additional restricted shares of common stock and Class B warrants to maintain ownership of up to 35% of issued and outstanding common stock and Class B warrants.
On September 29, 2009, the Company entered into a securities purchase agreement with Hydro under which the Company agreed to sell, and Hydro agreed to purchase, 769,230 restricted shares of the Company’s common stock for approximately $5.0 million in a private placement exempt from registration under the Securities Act. The restricted shares were sold to Hydro at a per share price equal to $6.50. The private placement closed on October 6, 2009, at which time the Company and Hydro executed a Registration Rights Agreement, pursuant to which Hydro was granted demand and piggy-back registration rights.
Secondary Public Offerings: On May 15, 2008, the SEC declared effective the Company’s Registration Statement on Form S-3 (Reg. No. 333-149740), and the Company completed a secondary public offering of 4,370,000 shares of common stock, which included 570,000 shares issued upon the underwriter’s exercise of their overallotment in full. The offering price of $14.00 per share resulted in proceeds of $61.2 million. After deducting underwriting discounts and commissions and offering expenses of approximately $4.4 million, net proceeds to the Company were approximately $56.8 million.
On October 1, 2009, the Company entered into an underwriting agreement with Barclays Capital Inc. providing for the sale in a firm commitment offering of 4,615,385 shares of the Company’s common stock at a price to the public of $6.50 per share. The offer and sale of the shares were registered under the Securities Act of 1933, as amended, pursuant to the Company’s Registration Statement on Form S-3 (File No. 333-156665), which became effective with the SEC on January 16, 2009. The offering closed on October 6, 2009 with net proceeds to the Company of approximately $27.9 million.
On November 11, 2010, the Company entered into an underwriting agreement with Cowen and Company, LLC, Rodman & Renshaw LLC and ThinkEquity LLC providing for the sale in a firm commitment offering of 5,250,000 shares of the Company’s common stock at a price to the public of $4.15 per share. The offer and sale of the shares were registered under the Securities Act of 1933, as amended, pursuant to the Company’s Registration Statement on Form S-3 (File No. 333-156665), which became effective with the SEC on January 16, 2009. The offering closed on November 16, 2010 with net proceeds to the Company of approximately $20.4 million.
F-19
Table of Contents
Other Proceeds: During the three months ended March 31, 2008, the Company received proceeds from a greater than 10% stockholder equal to the profits realized by such stockholder on the sale of the Company’s stock that was purchased by such stockholder within six months of such sale. Under Section 16(b) of the Securities Exchange Act of 1934, as amended, the profit realized from this transaction by the greater than 10% stockholder was required to be disgorged to the Company. The Company recorded the proceeds received on this transaction of $148,109 as Additional paid in capital and is reflected on the Statements of Stockholders’ Equity.
As of December 31, 2010, the Company had 32,265,587 shares of common stock and no shares of preferred stock outstanding. The Company has not declared or paid any dividends through December 31, 2010.
NOTE 15. EQUITY PLANS AND SHARE-BASED COMPENSATION
Stock Option Plan: The Company’s 2005 Stock Option Plan, as amended (the “Stock Option Plan”) provides for the grant of incentive or non-statutory stock options to the Company’s employees, directors and consultants. Upon recommendation of the Board of Directors, the stockholders approved an increase in the total shares of common stock reserved for issuance under the Stock Option Plan at various times from 1,000,000 to 3,700,000 currently.
Restricted Stock Plan: The Company’s 2008 Restricted Stock Plan, as amended (the “Restricted Stock Plan”) was adopted by the Board of Directors and was approved by the stockholders on July 1, 2008. The Restricted Stock Plan initially reserved up to 750,000 shares of the Company’s common stock for restricted stock awards and restricted stock units to eligible employees, directors and consultants of the Company. Upon recommendation of the Board of Directors, the stockholders approved an increase in the total shares of common stock reserved for issuance under the Restricted Stock Plan from 750,000 to 1,550,000 shares.
The Stock Option Plan and the Restricted Stock Plan are administered by the Compensation Committee of the Board of Directors, which determines the terms of the option and share awards, including the exercise price, expiration date, vesting schedule and number of shares. Equity compensation awards to executive officers and directors are also subject to approval by the Board of Directors. The term of any incentive stock option granted under the Stock Option Plan may not exceed ten years, or five years for options granted to an optionee owning more than 10% of the Company’s voting stock. The exercise price of an incentive stock option granted under the Option Plan must be equal to or greater than the fair market value of the shares of the Company’s common stock on the date the option is granted. An incentive stock option granted to an optionee owning more than 10% of the Company’s voting stock must have an exercise price equal to or greater than 110% of the fair market value of the Company’s common stock on the date the option is granted. The exercise price of a non-statutory option granted under the Option Plan must be equal to or greater than 85% of the fair market value of the shares of the Company’s common stock on the date the option is granted.
Grants Outside Existing Equity Plans: Prior to the adoption of the Restricted Stock Plan, the Board of Directors granted 40,000 restricted stock awards in connection with an executive employment agreement. In July 2009, the Board of Directors granted an inducement award (as defined in NASDAQ Rule 5635(c) (4)) made outside of the existing Stock Option Plan for 200,000 stock options.
Share-Based Compensation: The Company measures share-based compensation cost at the grant date based on the fair value of the award and recognizes this cost as an expense over the grant recipients’ requisite service periods for all awards made to employees, officers, directors and consultants.
F-20
Table of Contents
The share-based compensation expense recognized in the Statements of Operations for the years ended December 31, 2010, 2009 and 2008 were as follows:
| For the years ended December 31, | ||||||||||||
| 2010 | 2009 | 2008 | ||||||||||
| Share-based compensation cost included in: |
||||||||||||
| Research and development |
$ | 630,944 | $ | 764,062 | $ | 785,840 | ||||||
| Selling, general and administrative |
2,082,524 | 1,912,895 | 1,095,559 | |||||||||
| Total share-based compensation cost |
$ | 2,713,468 | $ | 2,676,957 | $ | 1,881,399 | ||||||
The following table presents share-based compensation expense by type of award for the years ended December 31, 2010, 2009 and 2008:
| For the years ended December 31, | ||||||||||||
| 2010 | 2009 | 2008 | ||||||||||
| Type of Award: |
||||||||||||
| Stock Options |
$ | 1,252,732 | $ | 1,366,969 | $ | 1,489,839 | ||||||
| Restricted Stock Units and Awards |
1,460,736 | 1,309,988 | 391,560 | |||||||||
| Total share-based compensation cost |
$ | 2,713,468 | $ | 2,676,957 | $ | 1,881,399 | ||||||
Stock Options:
The Company recognized share-based compensation expense for stock options of approximately $1,253,000 ($1,251,000 to officers, directors and employees, and $2,000 to outside providers) for the year ended December 31, 2010 related to stock option awards ultimately expected to vest and reduced for estimated forfeitures. The weighted average estimated fair value of employee stock options granted for the years ended December 31, 2010 and 2009 was $2.81 and $6.17 per share, respectively. Fair value was calculated using the Black-Scholes Model with the following assumptions:
| For the Years Ended December 31, | ||||||
| 2010 | 2009 | 2008 | ||||
| Expected volatility |
100.84% | 103.9-108.9% | 103.4-108.9% | |||
| Risk free interest rate |
2.21% | 1.9-2.7% | 1.5-3.3% | |||
| Expected dividends |
— | — | — | |||
| Expected life (in years) |
6.03 | 5.7-6.5 | 5.1-6.1 | |||
Expected volatility is based on the historical volatility of the Company’s stock. The risk-free rate of return is based on the yield of U.S. Treasury bonds with a maturity equal to the expected term of the award. Historical data is used to estimate forfeitures within the Company’s valuation model. The Company’s expected life of stock option awards is derived from historical experience and represents the period of time that awards are expected to be outstanding.
F-21
Table of Contents
As of December 31, 2010, total compensation cost related to non-vested stock options not yet recognized was approximately $2,555,000 ($2,513,000 to officers, directors and employees, and $42,000 to outside providers), which is expected to be recognized over a weighted average period of approximately 2.02 years. As of December 31, 2010, approximately 881,000 shares were vested or expected to vest in the future at a weighted average exercise price of $4.57. The following schedule summarizes stock option activity for grants made within the Stock Option Plan and outside the plan (shares in thousands):
| Stock Option Shares |
Stock Options Weighted Average Exercise Price |
Weighted Average Remaining Contractual Life in Years |
Aggregate Intrinsic Value |
|||||||||||||
| Outstanding at December 31, 2007 |
687 | $ | 5.07 | |||||||||||||
| Granted |
577 | 3.91 | ||||||||||||||
| Exercised |
(133 | ) | (0.91 | ) | $ | 1,684,874 | ||||||||||
| Canceled |
(39 | ) | (5.80 | ) | ||||||||||||
| Outstanding at December 31, 2008 |
1,092 | $ | 4.94 | 8.89 | $ | 894,198 | ||||||||||
| Granted |
380 | 7.59 | ||||||||||||||
| Exercised |
(105 | ) | (3.23 | ) | $ | 305,730 | ||||||||||
| Canceled |
(180 | ) | (6.21 | ) | ||||||||||||
| Outstanding at December 31, 2009 |
1,187 | $ | 5.74 | 8.41 | $ | 1,847,222 | ||||||||||
| Granted |
666 | 3.51 | ||||||||||||||
| Exercised |
(161 | ) | (2.42 | ) | $ | 349,135 | ||||||||||
| Canceled |
(176 | ) | (5.52 | ) | ||||||||||||
| Outstanding at December 31, 2010 |
1,516 | $ | 5.14 | 8.32 | $ | 527,463 | ||||||||||
| Exercisable at December 31, 2010 |
558 | $ | 6.19 | 7.24 | $ | 295,983 | ||||||||||
As of December 31, 2010, approximately 1,784,000 shares remained available for future grants under the Option Plan.
F-22
Table of Contents
Restricted Stock:
In addition to the stock options discussed above, the Company recognized share-based compensation expense related to restricted stock grants of approximately $1,461,000 ($1,395,000 to officers, directors and employees, and $66,000 to outside providers) for the year ended December 31, 2010. The weighted average estimated fair value of restricted stock options granted for the years ended December 31, 2010 and 2009 was $3.74 and $5.83 per share, respectively.
Total unrecognized share-based compensation expense from unvested restricted stock as of December 31, 2010 was approximately $832,000 ($779,000 to officers, directors and employees, and $53,000 to outside providers) which is expected to be recognized over a weighted average period of approximately 1.76 years. As of December 31, 2010, approximately 230,000 shares were expected to vest in the future. The following table summarizes non-vested restricted stock and the related activity as of December 31, 2010 and for the years ended December 31, 2009 and 2010 (shares in thousands):
| Shares | Weighted
Average Grant-Date Fair-Value |
|||||||
| Non-vested at January 1, 2009 |
43 | $ | 14.51 | |||||
| Granted |
390 | 5.83 | ||||||
| Vested |
(170 | ) | ||||||
| Forfeited |
(63 | ) | 5.65 | |||||
| Non-vested at December 31, 2009 |
200 | $ | 6.85 | |||||
| Granted |
325 | 3.74 | ||||||
| Vested |
(270 | ) | ||||||
| Forfeited |
(9 | ) | 4.37 | |||||
| Non-vested at December 31, 2010 |
246 | $ | 5.48 | |||||
As of December 31, 2010, approximately 876,000 shares remained available for future grants under the Restricted Stock Plan.
NOTE 16. INCOME TAXES
The Company records income taxes using the liability method. Under this method, deferred tax assets and liabilities are computed for the expected future impact of temporary differences between the financial statement and income tax bases of assets and liabilities using current income tax rates and for the expected future tax benefit to be derived from tax loss and tax credit carryforwards.
At December 31, 2010, the Company had approximately $65,590,000 in net operating loss carryforwards that will expire beginning in 2025. Approximately $2,100,000 of the net operating loss carryover is not included in the calculation of the deferred tax asset since it is related to excess tax deductions from the exercise of stock options and vested restricted stock. Under the Internal Revenue Code, the future utilization of net operating losses may be limited in certain circumstances where there is a significant ownership change. There were no significant ownership changes in 2010 that would affect utilization of the Company’s net operating losses.
F-23
Table of Contents
Deferred income taxes reflect an estimate of the cumulative temporary differences recognized for financial reporting purposes from that recognized for income tax reporting purposes. At December 31, 2010 and 2009, the components of these temporary differences and the deferred tax asset were as follows:
| As of December 31, | ||||||||
| 2010 | 2009 | |||||||
| Deferred Tax Asset |
||||||||
| Current: |
||||||||
| Accrued Expenses |
$ | 81,000 | $ | 62,000 | ||||
| Total Current |
81,000 | 62,000 | ||||||
| Non-current: |
||||||||
| Stock Based Compensation-Stock Options and Restricted Stock |
1,100,000 | 710,000 | ||||||
| Tax effect of NOL carryforward |
24,109,000 | 13,095,000 | ||||||
| Depreciation |
880,000 | 336,000 | ||||||
| Warranty reserve |
6,000 | — | ||||||
| Start-up costs |
216,000 | 439,000 | ||||||
| Capital losses |
12,000 | — | ||||||
| Capitalized manufacturing costs & property taxes on P,P&E |
1,353,000 | 1,353,000 | ||||||
| Total Non-current |
27,676,000 | 15,933,000 | ||||||
| Net deferred tax asset |
27,757,000 | 15,995,000 | ||||||
| Less valuation allowance |
(27,757,000 | ) | (15,995,000 | ) | ||||
| Net deferred tax asset |
$ | — | $ | — | ||||
In assessing the realizability of deferred tax assets, management considers whether it is more likely than not that some portion or all of the deferred tax assets will be realized. Based upon the level of historical losses and projections of future taxable income over the periods in which the deferred tax assets are deductible, a full valuation allowance has been provided due to the uncertainty surrounding the timing and the amount of future revenues. The Company’s deferred tax valuation allowance of $27,757,000 reflected above is an increase of $11,762,000 from the valuation allowance reflected as of December 31, 2009 of $15,995,000. The Company’s effective tax rate for the years ending December 31, 2010 and 2009 differs from the statutory rate due to the following (expressed as a percentage of pre-tax income):
| 2010 | 2009 | |||||||
| Federal statutory rate |
(35 | )% | (35 | )% | ||||
| State statutory rate |
(3 | )% | (3 | )% | ||||
| Permanent tax differences |
0 | % | 1 | % | ||||
| Other |
0 | % | 1 | % | ||||
| Increase in valuation allowance |
38 | % | 36 | % | ||||
| 0 | % | 0 | % | |||||
NOTE 17. RELATED PARTY TRANSACTIONS
Included in “Selling, general and administrative expenses” for the years ended December 31, 2010, 2009 and 2008 are $390,824, $815,196, and $1,270,720, respectively, are expenditures to ITN for facility sublease costs and administrative support expenses. Included in “Research and development expense” for the years ended December 31, 2010, 2009 and 2008 are $618,765, $1,861,609, and $1,585,519, respectively, are expenditures to ITN for supporting research and development and manufacturing activity, including charges for the use of
F-24
Table of Contents
research and development equipment. Related party payables of $54,037 and $195,954 as of December 31, 2010 and 2009, respectively, represent costs remaining to be paid to ITN for these expenditures. Related party receivables of $2,524 and $21,570 as of December 31, 2010 and 2009, respectively, represent pass-through costs for employee benefit insurance.
“Property, plant and equipment” as of December 31, 2010 and 2009 includes $2,296,118 paid to ITN for the construction of manufacturing and research and development equipment and installation labor costs for the Company’s FAB1 and FAB2 production lines.
On January 7, 2010, the Company and ITN entered into an equipment purchase agreement whereby the Company purchased seven research and development vacuum and deposition chambers for $1,100,000 from ITN. An initial payment in the amount of $350,000 was paid in January 2010 and additional payments without interest of $350,000 and $400,000 are due on January 15, 2011 and January 15, 2012, respectively.
NOTE 18. COMMITMENTS
Lease Agreement: On June 25, 2010, the Company entered into a lease agreement for the FAB1 facility in Littleton, Colorado. As of December 31, 2010, future minimum payments totaling $145,350 are due through June 2011.
The Company is also responsible for payment of pass-through expenses such as property taxes, insurance, water and utilities. Rent expense for the years ended December 31, 2010, 2009 and 2008 was $295,769 and $232,359 and $232,380, respectively.
Patent License Agreements: In 2006, the Company entered into two non-exclusive patent license agreements, one of which was terminated in 2010. In consideration for the right to license certain inventions, the Company is required to pay annual royalty payments based on net sales of products manufactured using the licensed technology. If there are no net sales of products manufactured using the licensed technology, then a minimum royalty payment is required. The Company has made payments for the annual minimum royalties due associated with these patent license agreements. These payments are insignificant in amount and are recorded under “Research and development” expense in the Statements of Operations.
NOTE 19. RETIREMENT PLAN
On July 1, 2006, the Company adopted a qualified 401(k) plan which provides retirement benefits for all of its eligible employees. Under the plan, employees become eligible to participate at the first entry date, provided that they are at least 21 years of age. The participants may elect through salary reduction to contribute up to ceilings established in the Internal Revenue Code. The Company will match 100% of the first six percent of employee contributions. In addition, the Company may make discretionary contributions to the Plan as determined by the Board of Directors. Employees are immediately vested in all salary reduction contributions. Rights to benefits provided by the Company’s discretionary and matching contributions vest 100% after the first year of service for all employees hired before January 1, 2010. For employees hired after January 1, 2010, matching contributions vest over a three year period, one-third per year. Payments for 401(k) matching totaled $340,087, $247, 904 and $193,104 for the years ended December 31, 2010, 2009 and 2008, respectively, and are recorded under “Research and development expense” and “Selling, general and administrative expense” in the Statements of Operations.
NOTE 20. SUBSEQUENT EVENT
In February 2011, the Company established an irrevocable letter of credit with its bank in favor of an equipment vendor in the amount of approximately $3.0 million. The letter of credit is collateralized by an interest bearing account.
F-25
Table of Contents
NOTE 20. SELECTED QUARTERLY FINANCIAL DATA (unaudited)
The following table presents selected unaudited Statements of Operations and Balance Sheet information for each of the quarters in the years ended December 31, 2010 and 2009 (in thousands, except per share data):
Selected Statements of Operations information:
| For the Quarter Ended | ||||||||||||||||
| Year Ended December 31, 2010 |
December 31 | September 30 | June 30 | March 31 | ||||||||||||
| Research and Development Revenue |
$ | 1,196 | $ | 623 | $ | 446 | $ | 216 | ||||||||
| Research and Development Expense |
7,450 | 6,418 | 5,928 | 4,558 | ||||||||||||
| Selling, General and Administrative Expense |
1,650 | 1,754 | 1,919 | 2,131 | ||||||||||||
| Impairment Loss |
1,769 | — | — | — | ||||||||||||
| Loss from Operations |
(9,673 | ) | (7,549 | ) | (7,401 | ) | (6,473 | ) | ||||||||
| Net Loss |
(9,757 | ) | (7,181 | ) | (7,692 | ) | (6,604 | ) | ||||||||
| Basic and diluted loss per share |
$ | (0.33 | ) | $ | (0.27 | ) | $ | (0.29 | ) | $ | (0.25 | ) | ||||
| Selected Balance Sheet information: |
||||||||||||||||
| For the Quarter Ended | ||||||||||||||||
| Year Ended December 31, 2010 |
December 31 | September 30 | June 30 | March 31 | ||||||||||||
| Current Assets |
$ | 47,664 | $ | 37,560 | $ | 42,968 | $ | 52,470 | ||||||||
| Total Assets |
160,021 | 148,020 | 154,498 | 164,510 | ||||||||||||
| Current Liabilities |
6,176 | 5,647 | 5,493 | 8,440 | ||||||||||||
| Working Capital |
41,488 | 31,913 | 37,475 | 44,030 | ||||||||||||
| Long-Term Obligations |
7,279 | 7,323 | 7,381 | 7,439 | ||||||||||||
| Stockholders’ Equity |
146,566 | 135,051 | 141,624 | 148,632 | ||||||||||||
| Selected Statements of Operations information: |
||||||||||||||||
| For the Quarter Ended | ||||||||||||||||
| Year Ended December 31, 2009 |
December 31 | September 30 | June 30 | March 31 | ||||||||||||
| Research and Development Revenue |
$ | 268 | $ | 417 | $ | 263 | $ | 516 | ||||||||
| Research and Development Expense |
5,089 | 3,859 | 3,364 | 3,196 | ||||||||||||
| Selling, General and Administrative Expense |
1,972 | 2,519 | 1,623 | 1,581 | ||||||||||||
| Loss from Operations |
(6,793 | ) | (5,961 | ) | (4,724 | ) | (4,261 | ) | ||||||||
| Net Loss |
(6,710 | ) | (5,270 | ) | (4,530 | ) | (4,413 | ) | ||||||||
| Basic and diluted loss per share |
$ | (0.25 | ) | $ | (0.25 | ) | $ | (0.22 | ) | $ | (0.21 | ) | ||||
| Selected Balance Sheet information: |
||||||||||||||||
| For the Quarter Ended | ||||||||||||||||
| Year Ended December 31, 2009 |
December 31 | September 30 | June 30 | March 31 | ||||||||||||
| Current Assets |
$ | 61,479 | $ | 37,536 | $ | 49,255 | $ | 72,372 | ||||||||
| Total Assets |
172,661 | 140,101 | 144,499 | 150,386 | ||||||||||||
| Current Liabilities |
11,250 | 5,513 | 5,307 | 7,704 | ||||||||||||
| Working Capital |
50,229 | 32,023 | 43,948 | 64,668 | ||||||||||||
| Long-Term Obligations |
7,095 | 7,151 | 7,206 | 7,260 | ||||||||||||
| Stockholders’ Equity |
154,315 | 127,431 | 131,978 | 135,411 | ||||||||||||
F-26
Table of Contents
INDEX TO EXHIBITS
Set forth below is a list of exhibits that are being filed or incorporated by reference into this Annual Report on Form 10-K:
| Exhibit |
Description | |
| 3.1 | Amended and Restated Certificate of Incorporation (incorporated by reference to Exhibit 3.2 to our Registration Statement on Form SB-2 filed on January 23, 2006 (Reg. No. 333-131216)) | |
| 3.2 | Second Amended and Restated Bylaws (incorporated by reference to Exhibit 3.2 to our Current Report on Form 8-K filed on February 17, 2009) | |
| 3.3 | First Amendment to Second Amended and Restated Bylaws (incorporated by reference to Exhibit 3.3 to our Quarterly Report on Form 10-Q for the quarter ended September 30, 2009) | |
| 4.1 | Form of Common Stock Certificate (incorporated by reference to Exhibit 4.1 to our Registration Statement on Form SB-2 filed on January 23, 2006 (Reg. No. 333-131216)) | |
| 4.2 | Form of Class B Warrant (incorporated by reference to Exhibit 4.3 to our Registration Statement on Form SB-2 filed on January 23, 2006 (Reg. No. 333-131216)) | |
| 4.3 | Form of Warrant Agreement between the Company and Computershare Trust Company, Inc. (incorporated by reference to Exhibit 4.5 to our Registration Statement on Form SB-2/A filed on April 20, 2006 (Reg. No. 333-131216)) | |
| 4.4 | Form of Representative’s Purchase Warrant (incorporated by reference to Exhibit 4.6 to our Registration Statement on Form SB-2/A filed on July 10, 2006 (Reg. No 333-131216)) | |
| 4.5 | Stockholders’ Agreement, dated March 13, 2007, between the Company and Norsk Hydro Produksjon AS (incorporated by reference to Exhibit 99.2 to our Current Report on Form 8-K filed on March 13, 2007) | |
| 4.6 | Registration Rights Agreement, dated March 13, 2007, between the Company and Norsk Hydro Produksjon AS (incorporated by reference to Exhibit 99.3 to our Current Report on Form 8-K filed on March 13, 2007) | |
| 4.7 | Registration Rights Agreement, dated October 6, 2009, between the Company and Norsk Hydro Produksjon AS (incorporated by reference to Exhibit 10.2 to our Current Report on Form 8-K filed on October 1, 2009) | |
| 5.1 | Opinion of Faegre & Benson LLP relating to the At-the-Market Equity Offering* | |
| 10.1 | Executive Employment Agreement, dated April 30, 2007, between the Company and Mohan S. Misra (incorporated by reference to Exhibit 10.1 to our Current Report on Form 8-K filed on April 27, 2007)† | |
| 10.2 | Executive Employment Agreement, dated April 30, 2007, between the Company and Ashutosh Misra (incorporated by reference to Exhibit 10.2 to our Current Report on Form 8-K filed on April 27, 2007)† | |
| 10.3 | Executive Employment Agreement, dated March 31, 2008, between the Company and Gary Gatchell (incorporated by reference to Exhibit 99.1 to our Current Report on Form 8-K filed on March 31, 2008)† | |
| 10.4 | Amendment to Executive Employment Agreement, dated July 1, 2008, between the Company and Mohan Misra (incorporated by reference to Exhibit 10.44 to our Quarterly Report on Form 10-Q for the quarter ended June 30, 2008)† | |
| 10.5 | Amended and Restated Executive Employment Agreement, dated August 3, 2009, between the Company and Farhad Moghadam (incorporated by reference to Exhibit 10.1 to our Quarterly Report on Form 10-Q for the quarter ended June 30, 2009)† | |
Table of Contents
| Exhibit |
Description | |
| 10.6 | Restricted Stock Unit Agreement, dated August 3, 2009, between the Company and Farhad Moghadam (incorporated by reference to Exhibit 10.3 to our Quarterly Report on Form 10-Q for the quarter ended June 30, 2009)† | |
| 10.7 | Stock Option Agreement, dated August 3, 2009, between the Company and Farhad Moghadam (incorporated by reference to Exhibit 10.4 to our Quarterly Report on Form 10-Q for the quarter ended June 30, 2009)† | |
| 10.8 | Inducement Award Agreement, dated August 3, 2009, between the Company and Farhad Moghadam (incorporated by reference to Exhibit 10.5 to our Quarterly Report on Form 10-Q for the quarter ended June 30, 2009)† | |
| 10.9 | Restricted Stock Award Agreement, dated March 31, 2008, between the Company and Gary Gatchell (incorporated by reference to Exhibit 10.43 to our Quarterly Report on Form 10-Q for the quarter ended March 31, 2008)† | |
| 10.10 | Ascent Solar Technologies, Inc. Second Amended and Restated 2008 Restricted Stock Plan (including Form of Restricted Stock Award Agreement and Form of Restricted Stock Unit Agreement) (incorporated by reference to Exhibit 10.2 to our Current Report on Form 8-K filed on June 17, 2010)† | |
| 10.11 | Ascent Solar Technologies, Inc. Fourth Amended and Restated 2005 Stock Option Plan (incorporated by reference to Exhibit 10.1 to our Current Report on Form 8-K filed on June 17, 2010)† | |
| 10.12 | Securities Purchase Agreement, dated January 17, 2006, between the Company and ITN Energy Systems, Inc. (incorporated by reference to Exhibit 10.1 to our Registration Statement on Form SB-2 filed on January 23, 2006 (Reg. No. 333-131216))CTR | |
| 10.13 | Invention and Trade Secret Assignment Agreement, dated January 17, 2006, between the Company and ITN Energy Systems, Inc. (incorporated by reference to Exhibit 10.2 to our Registration Statement on Form SB-2 filed on January 23, 2006 (Reg. No. 333-131216))CTR | |
| 10.14 | Patent Application Assignment Agreement, dated January 17, 2006, between the Company and ITN Energy Systems, Inc. (incorporated by reference to Exhibit 10.3 to our Registration Statement on Form SB-2 filed on January 23, 2006 (Reg. No. 333-131216)) | |
| 10.15 | License Agreement, dated January 17, 2006, between the Company and ITN Energy Systems, Inc. (incorporated by reference to Exhibit 10.4 to our Registration Statement on Form SB-2 filed on January 23, 2006 (Reg. No. 333-131216))CTR | |
| 10.17 | Service Center Agreement, dated January 17, 2006, between the Company and ITN Energy Systems, Inc., as amended (incorporated by reference to Exhibit 10.6 to our Registration Statement on Form SB-2 filed on January 23, 2006 (Reg. No. 333-131216)) | |
| 10.19 | Administrative Services Agreement, dated January 17, 2006, between the Company and ITN Energy Systems, Inc., as amended (incorporated by reference to Exhibit 10.8 to our Registration Statement on Form SB-2 filed on January 23, 2006 (Reg. No. 333-131216)) | |
| 10.20 | Letter Agreement, dated November 23, 2005, among the Company, ITN Energy Systems, Inc. and the University of Delaware (incorporated by reference to Exhibit 10.16 to our Registration Statement on Form SB-2/A filed on May 26, 2006 (Reg. No. 333-131216)) | |
| 10.21 | License Agreement, dated November 21, 2006, between the Company and UD Technology Corporation (incorporated by reference to Exhibit 10.1 to our Current Report on Form 8-K filed on November 29, 2006)CTR | |
| 10.22 | Novation Agreement, dated January 1, 2007, among the Company, ITN Energy Systems, Inc. and the United States Government (incorporated by reference to Exhibit 10.23 to our Annual Report on Form 10-KSB for the year ended December 31, 2006) | |
Table of Contents
| Exhibit |
Description | |
| 10.23 | Securities Purchase Agreement, dated March 13, 2007, between the Company and Norsk Hydro Produksjon AS (incorporated by reference to Exhibit 99.1 to our Current Report on Form 8-K filed on March 13, 2007) | |
| 10.24 | Amendment No. 1 to Securities Purchase Agreement, dated March 3, 2008, between the Company and Norsk Hydro Produksjon AS (incorporated by reference to Exhibit 10.41 to our Annual Report on Form 10-K for the year ended December 31, 2007) | |
| 10.26 | Contract to Buy and Sell Real Estate, dated November 26, 2007, between the Company and JN Properties (incorporated by reference to Exhibit 10.36 to our Annual Report on Form 10-K for the year ended December 31, 2007) | |
| 10.27 | Construction Loan Agreement, dated February 8, 2008, between the Company and the Colorado Housing and Finance Authority (incorporated by reference to Exhibit 10.37 to our Annual Report on Form 10-K for the year ended December 31, 2007) | |
| 10.28 | Promissory Note, dated February 8, 2008, issued to the Colorado Housing and Finance Authority (incorporated by reference to Exhibit 10.38 to our Annual Report on Form 10-K for the year ended December 31, 2007) | |
| 10.29 | Loan Modification Agreement, dated January 29, 2009, between the Company and the Colorado Housing and Finance Authority (incorporated by reference to Exhibit 10.52 to our Annual Report on Form 10-K for the year ended December 31, 2008) | |
| 10.30 | Cooperation Agreement, dated December 18, 2007, between the Company and Norsk Hydro Produksjon AS (incorporated by reference to Exhibit 10.1 to our Current Report on Form 8-K filed on December 19, 2007) | |
| 10.34 | Photovoltaic Module Supply Agreement, dated September 21, 2009, between the Company and Turtle Energy LLC (incorporated by reference to Exhibit 10.1 to our Current Report on Form 8-K filed on September 23, 2009)CTR | |
| 10.35 | Securities Purchase Agreement, dated September 29, 2009, between the Company and Norsk Hydro Produksjon AS (incorporated by reference to Exhibit 10.1 to our Current Report on Form 8-K filed on October 1, 2009) | |
| 10.36 | Separation Agreement and General Release, dated December 18, 2009, between the Company and Prem Nath (incorporated by reference to Exhibit 10.44 to our Annual Report on Form 10-K for the year ended December 31, 2009) | |
| 10.37 | Consultant Agreement, dated December 18, 2009, between the Company and Prem Nath (incorporated by reference to Exhibit 10.45 to our Annual Report on Form 10-K for the year ended December 31, 2009) | |
| 10.38 | Equipment Purchase Agreement, dated January 7, 2010, between the Company and ITN Energy Systems, Inc. (incorporated by reference to Exhibit 10.46 to our Annual Report on Form 10-K for the year ended December 31, 2009) | |
| 10.39 | At-the-Market Equity Offering Sales Agreement between the Company and Stifel, Nicolaus & Company, Incorporated dated February 28, 2011* | |
| 23.1 | Consent of Hein & Associates LLP* | |
| 31.1 | Chief Executive Officer Certification pursuant to section 302 of the Sarbanes-Oxley Act of 2002* | |
| 31.2 | Chief Financial Officer Certification pursuant to section 302 of the Sarbanes-Oxley Act of 2002* | |
| 32.1 | Chief Executive Officer Certification pursuant to section 906 of the Sarbanes-Oxley Act of 2002* | |
| 32.2 | Chief Financial Officer Certification pursuant to section 906 of the Sarbanes-Oxley Act of 2002* | |
| * | Filed herewith |
| CTR | Portions of this exhibit have been omitted pursuant to a request for confidential treatment. |
| † | Denotes management contract or compensatory plan or arrangement. |