Attached files
Table of Contents
UNITED STATES
SECURITIES AND EXCHANGE COMMISSION
WASHINGTON, D.C. 20549
FORM 10-K
(Mark One)
| x | ANNUAL REPORT PURSUANT TO SECTION 13 or 15(d) OF THE SECURITIES EXCHANGE ACT OF 1934 |
For the Fiscal Year Ended January 2, 2011
| ¨ | TRANSITIONAL REPORT PURSUANT TO SECTION 13 OR 15(d) OF THE SECURITIES EXCHANGE ACT OF 1934 |
For the transition period from to
Commission File Number: 001-32843
TIM HORTONS INC.
(Exact name of Registrant as specified in its charter)
| Canada | 98-0641955 | |
| (State or other jurisdiction of incorporation or organization) |
(I.R.S. Employer Identification Number) | |
| 874 Sinclair Road, Oakville, ON, Canada | L6K 2Y1 | |
| (Address of principal executive offices) | (Zip Code) | |
Registrant’s telephone number, including area code 905-845-6511
Securities registered pursuant to Section 12(b) of the Act:
| Title of each class |
Name of each exchange on which registered | |
| Common Shares, without par value | New York Stock Exchange | |
| Associated Share Purchase Rights | Toronto Stock Exchange |
Securities registered pursuant to Section 12(g) of the Act: None
Indicate by check mark if the Registrant is a well-known seasoned issuer, as defined in Rule 405 of the Securities Act. YES x NO ¨.
Indicate by check mark if the Registrant is not required to file reports pursuant to Section 13 or Section 15(d) of the Act. YES ¨ NO x.
Indicate by check mark whether the Registrant (1) has filed all reports required to be filed by Section 13 or 15(d) of the Securities Exchange Act of 1934 during the preceding 12 months (or for such shorter period that the Registrant was required to file such reports) and (2) has been subject to such filing requirements for the past 90 days. YES x NO ¨.
Indicate by check mark whether the Registrant has submitted electronically and posted on its corporate Website, if any, every Interactive Data File required to be submitted and posted pursuant to Rule 405 of Regulation S-T during the preceding 12 months (or for such shorter period that the Registrant was required to submit and post such files). YES x NO ¨.
Indicate by check mark if disclosure of delinquent filers pursuant to Item 405 of Regulation S-K is not contained herein, and will not be contained, to the best of Registrant’s knowledge, in definitive proxy or information statements incorporated by reference in Part III of this Form 10-K or any amendment to this Form 10-K. x
Indicate by check mark whether the Registrant is a large accelerated filer, an accelerated filer, a non-accelerated filer, or a smaller reporting company. See the definitions of “large accelerated filer,” “accelerated filer” and “smaller reporting company” in Rule 12b-2 of the Exchange Act.
| Large accelerated filer x | Accelerated filer ¨ | |
| Non-accelerated filer ¨ (Do not check if a smaller reporting company) |
Smaller reporting company ¨ | |
Indicate by check mark whether the Registrant is a shell company (as defined in Rule 12b-2 of the Exchange Act). YES ¨ NO x.
The aggregate market value of the common shares held by non-affiliates of the Registrant computed by reference to the price at which such shares were last sold, as of July 4, 2010, was Cdn.$5,923,576,430 (US$5,558,138,401).
Number of common shares outstanding as of February 22, 2011: 167,532,579
DOCUMENTS INCORPORATED BY REFERENCE:
Exhibit index on pages 183-186.
Table of Contents
EXPLANATORY NOTE
Tim Hortons Inc., a corporation incorporated under the Canada Business Corporations Act (the “Company”), qualifies as a foreign private issuer in the U.S. for purposes of the Securities Exchange Act of 1934, as amended (the “Exchange Act”). Although as a foreign private issuer the Company is no longer required to do so, the Company currently continues to file annual reports on Form 10-K, quarterly reports on Form 10-Q, and current reports on Form 8-K with the Securities and Exchange Commission (“SEC”) instead of filing the reporting forms available to foreign private issuers.
The Company prepares and files a management proxy circular and related material under Canadian requirements. As the Company’s management proxy circular is not filed pursuant to Regulation 14A, the Company may not incorporate by reference information required by Part III of this Form 10-K from its management proxy circular. Accordingly, in reliance upon and as permitted by Instruction G(3) to Form 10-K, the Company will be filing an amendment to this Form 10-K containing the Part III information no later than 120 days after the end of the fiscal year covered by this Form 10-K.
Table of Contents
2010 FORM 10-K ANNUAL REPORT
TABLE OF CONTENTS
The noon buying rate in New York City for cable transfers in foreign currencies as certified for customs purposes by the Federal Reserve Bank of New York, were:
| (US$) |
At End of Fiscal Year |
Year Average |
High | Low | ||||||||||||
| December 31, 2006 |
0.8582 | 0.8849 | 0.9100 | 0.8528 | ||||||||||||
| December 30, 2007 |
1.0221 | 0.9419 | 1.0908 | 0.8437 | ||||||||||||
| December 28, 2008 |
0.8192 | 0.9399 | 1.0291 | 0.7710 | ||||||||||||
| January 3, 2010 |
0.9559 | 0.8834 | 0.9719 | 0.7695 | ||||||||||||
| January 2, 2011 |
0.9991 | 0.9663 | 1.0040 | 0.9280 | ||||||||||||
On February 22, 2011, the noon buying rate in New York City for cable transfers in foreign currencies as certified for customers purposes by the Federal Reserve Bank of New York was US$0.9827 for Cdn.$1.00.
3
Table of Contents
PART I
| Item 1. | Business |
The Company
We are the fourth largest publicly-traded quick service restaurant chain in North America based on market capitalization and the largest in Canada. We appeal to a broad range of consumer tastes, with a menu that includes premium coffee, flavoured cappuccinos, specialty teas, home-style soups, fresh sandwiches, wraps, hot breakfast sandwiches and fresh baked goods, including our trademark donuts.
The first Tim Hortons® was opened in May, 1964 by Tim Horton, a National Hockey League All-Star defenseman. In 1967, Ron Joyce, then the operator of three Tim Hortons restaurants, became partners with Tim Horton and together they opened 37 restaurants over the next seven years. After Tim Horton’s death in 1974, Mr. Joyce continued to expand the chain, becoming its sole owner in 1975. In the early 1990s, Tim Hortons and Wendy’s International, Inc., now wholly-owned by Wendy’s/Arby’s Group, Inc. (“Wendy’s”), entered into a partnership to develop real estate and combination restaurant sites with Wendy’s® and Tim Hortons restaurants under the same roof. In 1995, Wendy’s purchased Mr. Joyce’s interest in the Tim Hortons system and incorporated the company known as Tim Hortons Inc., a Delaware corporation (“THI USA”), as a wholly-owned subsidiary. In 2006, we became a standalone public company pursuant to an initial public offering and a subsequent spin-off of our common stock to Wendy’s stockholders through a stock dividend on September 29, 2006.
At a special meeting of stockholders held on September 22, 2009, THI USA’s stockholders voted to approve the reorganization of THI USA. As a result of the reorganization, Tim Hortons Inc., a corporation incorporated under the Canada Business Corporations Act (the “Company”), became the publicly held parent company of the group of companies previously controlled by THI USA, and each outstanding share of THI USA’s common stock automatically converted into one common share of the Canadian public company. The issuance of common shares (and the associated share purchase rights) of the Canadian public company was registered under the Securities Act of 1933, as amended (the “Securities Act”). The common shares of the Canadian public company, like the common stock of THI USA previously, are traded on both the Toronto Stock Exchange and the New York Stock Exchange under the symbol “THI.”
Our primary business model is to identify and franchise restaurant locations. As of January 2, 2011, 99.5% of our systemwide restaurants were franchised or run by independent operators. We also own and operate a small number of corporate-run locations. Our business model also includes vertically-integrated businesses, including warehouse and distribution operations that supply goods to a substantial majority of our Canadian restaurants. In the United States, we supply similar products to our restaurants through third-party distributors. We currently operate four distribution centres that supply paper and dry goods to Canadian restaurants, and one facility that also provides frozen and some refrigerated products, as well as paper and dry goods to most of our Ontario locations. We are currently constructing a replacement distribution centre for our Kingston facility, expected to be operational in 2011, that will increase the distribution of frozen and refrigerated products to our Ontario restaurants and begin to provide this service to certain of our restaurants in Quebec. Our operations also include coffee roasting plants in Rochester, New York and Hamilton, Ontario, and a fondant and fills manufacturing facility in Oakville, Ontario. In 2010, we sold our 50% joint venture interest in Maidstone Bakeries, which provides certain bread, pastries, donuts and Timbits™ to our system restaurants. Pursuant to our supply agreement with Maidstone Bakeries, our obligations to purchase supply of donuts and Timbits extend until early 2016, and we have supply rights until late 2017, at our option, allowing us sufficient flexibility to secure alternative means of supply, if necessary.
References to “we,” “our,” “us” or the “Company” refer to THI USA and its subsidiaries for periods on or before September 27, 2009 and to Tim Hortons Inc., a corporation incorporated under the Canada Business Corporations Act and its subsidiaries, for periods on or after September 28, 2009, unless specifically noted otherwise.
4
Table of Contents
All dollar amounts referenced in this Form 10-K are in Canadian dollars, unless otherwise expressly stated.
Business Overview and 2011 Objectives
We seek to grow our business by executing strategic and operational plans and initiatives designed to help us achieve both annual and longer-term goals that create shareholder value. We have a unique, layered business model that adds to the scale and success of our system.
Unique business model
Key aspects of our business include:
| • | our effective restaurant model is more than 99% franchised and we have a long-standing history of collaborating with our restaurant owners to grow our business and build positive relationships. Our restaurant owners typically operate an average of 3 to 4 restaurants and have a significant stake in the success of the restaurants they operate; |
| • | maintaining a controlling interest in the real estate in our restaurant system in North America to ensure brand integrity and control of development; |
| • | operating with a “we fit anywhere” concept that allows us to adapt our brand presence to take advantage of both standard and non-standard development opportunities; and |
| • | leveraging significant levels of vertical integration that exist in our system and continuing to explore additional system benefits through further vertical integration opportunities. |
Increasing same-store sales through daypart, marketing and menu opportunities
Increasing same-store sales is an important measure of success in the restaurant sector. We view same-store sales growth as vital to the ongoing health of our franchise system and the Company. Our strategies to increase same-store sales include:
| • | continuing to create menu and product innovation to expand our market share across various dayparts and product categories, responding to customer needs and trends; |
| • | we continue to place particular focus on morning and afternoon/evening snacking dayparts, as well as extending lunch opportunities in the Canadian segment; |
| • | in the U.S., we plan to test and roll-out menu items that help differentiate our cafe and bake shop brand identity; |
| • | we plan to grow our market share in both hot and cold beverage categories; and |
| • | leveraging our marketing strengths and advantages. In Canada, we will leverage our scale as one of the country’s largest advertisers to reinforce our attractive price to value position and to reinforce our brand equity, and continue to focus on our hospitality initiatives. In the United States, we plan to significantly increase our marketing and advertising spending in all markets, and in particular in our core, more developed growth markets, to increase awareness of our brand. In addition, we will continue to seek other marketing means, such as community involvement, sponsorships, and other forms of communication, to supplement traditional advertising to reinforce our brand position with customers and to broaden our brand awareness as a cafe and bake shop destination. |
Investing to build our scale and brand in new and existing markets
Restaurant development in new and existing markets has historically contributed significantly to the Company’s growth. In 2011, our specific development plans include:
| • | continued active development of both standard and non-standard restaurants in Canadian growth markets: |
5
Table of Contents
| • | focusing development primarily in Quebec, western Canada, Ontario and major urban markets; |
| • | evaluating flexible new restaurant designs tailored to urban and rural markets; |
| • | based on results from our initial pilot new restaurant format for standard restaurants, broaden the pilot in Canada to include varying regions and adaptations from test results; |
| • | working to accelerate the time it takes to create critical mass for convenience and advertising scale in our most developed U.S. markets; |
| • | prioritizing and accelerating our U.S. restaurant development capital in our core growth markets which are most developed, while continuing to develop, to a lesser extent, in other emerging markets for longer-term growth; |
| • | applying successful elements of our new concept restaurants, including exterior and interior design treatments, menu items, equipment and fixtures, in new restaurants in the U.S., and seeking opportunities to introduce these elements in renovations; and |
| • | complementing our standard restaurant development activity in both Canada and the U.S. with non-standard formats and location. |
Growing differently in ways we have not grown before
Our strategic growth plan includes initiatives that are designed to complement our core growth strategies with additional opportunities to grow our business. These initiatives include:
| • | extending our competitive advantage for service excellence in Canada through a hospitality strategy; |
| • | expanding the Cold Stone Creamery© co-branding concept in Canada, where we have exclusive development rights, and to a lesser extent in the U.S., where we already have a significant co-branded presence; |
| • | testing new restaurant formats in Canada, as mentioned above; |
| • | pursuing, as part of a broader international restaurant development strategy, development of approximately five restaurants in 2011 in Gulf Cooperation Council markets through master licensee, The Apparel Group FZCO (“Apparel Group”), based in Dubai; |
| • | opportunistically pursuing strategic alliances and partnerships to take our brand to markets where we have not yet established a presence, to complement our existing presence, or to increase average unit volumes in existing locations. This may include co-branding or other initiatives; and |
| • | opening up to 75 co-branded Cold Stone Creamery locations in North America in 2011, with a primary focus on Canada. |
Leveraging our core business strengths and franchise system
As one of the most franchised systems in the restaurant industry, we focus extensively on our relationships with our restaurant owners and the success of our system. We also seek to leverage our strengths and capabilities to grow our business in ways that benefit us and our system. In 2011, our focus includes:
| • | continuing to work collaboratively with our restaurant owners across a wide range of initiatives and business matters; |
| • | pursuing additional vertical integration and supply chain opportunities to create value for our restaurant owners and shareholders, including completion of our new replacement distribution centre in Kingston, Ontario; and |
| • | selectively assessing acquisition opportunities that leverage our core strengths and capabilities. |
6
Table of Contents
The Company’s 2011 operational objectives (See Accompanying Notes Below)
In support of the initiatives outlined above for 2011, we have established the following objectives:
| • | we are targeting same-store sales growth of 3% to 5% in both Canada and the U.S.; and |
| • | we expect to open a total of 230 to 270 restaurant locations. Of these openings, we are planning to open 160 to 180 restaurants in Canada. In the U.S., we plan to open 70 to 90 locations, which will be split approximately equally between standard and non-standard full serve locations. |
2011 Financial Outlook (See Accompanying Notes Below)
Based on our strategic and operational plans, we have established the following 2011 financial targets:
| • | Earnings per share (EPS) of $2.30 to $2.40; |
| • | U.S. segment operating income of US$13 million to US$16 million; |
| • | Effective tax rate of approximately 30%; and |
| • | Capital expenditures of $180 million to $200 million. |
Long-Term Aspirations (See Accompanying Notes Below)
| • | EPS: long-term aspirational EPS compounded annual growth from 2011 through to the end of 2013 is expected to be between 12% to 15% (excluding the 2010 impact of the disposition of our 50% joint venture interest in Maidstone Bakeries and the U.S. asset impairment and related closure costs); |
| • | New restaurant development from 2010 to the end of 2013: |
| • | Canada: approximately 600; |
| • | U.S.: approximately 300; |
| • | Total North America: approximately 900; and |
| • | Annual operating income growth of 8% to 10% to the end of 2013 (excluding the 2010 impact of the disposition of our 50% joint venture interest in Maidstone Bakeries and the U.S. asset impairment and related closure costs). |
Notes :
The operational objectives, financial outlook, and aspirational goals (collectively, “targets”) established for 2011 and longer-term are based on the accounting, tax, and other legislative rules in place at the time the targets were issued and on the continuation of share repurchase programs relatively consistent with historical levels. The impact of future changes in accounting; tax and/or other legislative rules that may or may not become effective in fiscal 2010, 2011 and/or future years, changes to our share repurchase activities; and other matters not contemplated at the time the targets were established that could affect our business (such as, for example, the impact of disposition of our 50% joint venture interest in Maidstone Bakeries and other significant matters), were not included in the determination of these targets. In addition, the targets are forward-looking and are based on our expectations and outlook on, and shall be effective only as of, the date the targets were originally issued. Except as required by applicable securities laws, we do not intend to update these targets. You should refer to the Company’s public filings for any reported updates. These targets and our performance generally are subject to various risks and uncertainties and are based on certain underlying assumptions, set forth in Item 1A. Risk Factors of this Annual Report on Form 10-K (the “Annual Report”), which may impact future performance and our achievement of these targets.
7
Table of Contents
Operations
Our primary business model is to identify potential restaurant locations, develop suitable sites, and make these new restaurants available to approved restaurant owners. As of January 2, 2011, restaurant owners, including operators, operated 99.5% of our systemwide restaurants. We directly own and operate (without restaurant owners) only a small number of company restaurants in Canada and the U.S. We also have warehouse and distribution operations that supply paper and dry goods to a substantial majority of our Canadian restaurants, and supply frozen baked goods and some refrigerated products to most of our Ontario restaurants. In the U.S., we supply similar products to system restaurants through third-party distributors. Our operations also include coffee roasting plants in Rochester, New York, and Hamilton, Ontario, and a fondant and fills manufacturing facility in Oakville, Ontario. Until we sold our 50% interest in the Maidstone Bakeries joint venture to our former partner on October 29, 2010, our operations also included a bakery joint venture. See “Manufacturing” below. These vertically integrated manufacturing and distribution capabilities provide important benefits to our restaurant owners and systemwide restaurants, while allowing us to: improve product quality and consistency; protect proprietary interests; facilitate the expansion of our product offerings; control availability and timely delivery of products; provide economies of scale and labour efficiencies; and generate additional sources of income for the Company.
Our business model results in several distinct sources of revenues and corresponding income, consisting of distribution sales, franchise rent and royalties revenues, equity income (which is included in operating income), manufacturing income, and, to a much lesser extent, sales from Company-operated restaurants. Franchise royalties are typically collected weekly based on a percentage of gross sales. Rental income results from our controlling interest (i.e., lease or ownership) in the real estate for approximately 79% of franchised restaurants, generating base rent and, for most sites, percentage rent, which results in higher rental income as same-store sales increase. Historically, as we have opened new restaurants and made them available to restaurant owners, our operating income base has expanded. In addition, our product distribution and warehouse operations have generated consistent positive operating income.
Our segments for financial reporting purposes are Canada and the U.S. Financial information about these segments is set forth in Items 6 and 7 of this Form 10-K. We recently announced that we have entered into a master license agreement with Apparel Group to develop up to 120 multi-format restaurants in markets in the Gulf Cooperation Council. We will manage this expansion corporately and, accordingly, operating income from our international operations, which currently are insignificant, will continue to be included in Corporate charges in our segmented operating results. In addition, reference should be made to the Consolidated Financial Statements and Supplementary Data in Item 8 of this Annual Report for further information regarding revenues, segment operating profit and loss, total assets attributable to our segments, and for financial information attributable to certain geographic areas.
Restaurant formats. Tim Hortons restaurants operate in a variety of formats. From start to finish, the development process for each individual standard restaurant location, typically averaging 1,400 to 3,090 square feet, usually takes between 12 to 18 months. Development of non-standard sites and self-serve kiosks typically requires much less time. See Item 2. Properties of this Annual Report for additional information regarding our restaurants.
Our non-standard development growth includes small, full-service restaurants and/or self-serve kiosks in offices, hospitals, colleges, airports, grocery stores, gas and convenience locations and drive-thru-only units on smaller pieces of property. In 2010, we piloted a new restaurant format in Canada, and based on our early test results, we intend to broaden the pilot to include varying formats, regions and adaptations. Our self-serve kiosks typically have single-serve hot and cold beverage offerings and a limited selection of donuts, muffins, Danishes, and other pastries, although the product offering varies with the size of the kiosk and is generally more limited in the U.S. The primary format for our self-serve kiosks is the self-pour brewed coffee model. In Canada, these kiosks are located mainly in Esso® convenience locations, as a result of our relationship with Imperial Oil*. In the U.S., the majority of kiosks are located in Tops Friendly Markets®. Our financial arrangements for self-serve
8
Table of Contents
locations vary and may not be consistent with arrangements for other non-standard restaurants. In addition, self-serve kiosks typically generate much smaller average unit sales compared to non-standard, full-serve restaurants that have staff, larger locations, and more expansive beverage and food product offerings. Average unit volumes at self-serve kiosks are highly variable, depending upon the location, size of the site, product offerings, and hours of operation. In the U.S., self-serve kiosks only contribute nominal amounts to our distribution sales, royalty revenues and consolidated operating income at this time. Self-serve kiosks, however, complement our core growth strategy by increasing customer convenience and frequency of visits, and allowing for additional market penetration of our brand, including in areas where we may not be as well known or where an alternative model for unit growth and development is appropriate. Additionally, in Canada, we have used self-serve kiosks in locations where existing full-service locations are at capacity.
The development of co-branded locations is also increasing in our system. Based on positive results and customer response to the introduction of co-branded Cold Stone Creamery® locations opened in Canada during 2009, we entered into an agreement with Kahala Franchise Corp., the franchisor of the Cold Stone Creamery brand, for exclusive development rights in Canada, in order to provide us flexibility for future expansion. During 2010, we opened 78 co-branded restaurants in Canada and our co-branding initiative with Cold Stone Creamery in Canada contributed slightly to same-store sales growth in spite of relatively few locations relative to the entire system.
In the U.S., we opened 24 Cold Stone Creamery co-branded restaurants in 2010 and closed 13 locations as part of the New England restaurant closures, and our co-branding relationship had a slightly positive impact on same-store sales. Although the pace of our co-branding activity in the U.S. decreased during 2010, we also complemented our core standard restaurant development activity in the U.S. with non-traditional formats and locations, as described above, and we began testing a new concept restaurant in certain U.S. markets to differentiate our brand and customer menu offerings as a cafe and bake shop destination. We had four new concept restaurants open in 2010. Successful elements of our new concept restaurants, including exterior and interior design treatments, menu items, equipment and fixtures, will be incorporated in new restaurants in the U.S., and we will further consider these new applications in connection with the ongoing renovation program.
See also “Combination restaurants, an ongoing relationship with Wendy’s” below for information regarding restaurants that offer Tim Hortons and Wendy’s® products at one location.
Restaurant development. We oversee and direct all aspects of restaurant development for system restaurants, from an initial review of a location’s demographics, site access, visibility, traffic counts, mix of residential/retail/commercial surroundings, competitive activity, and proposed rental/ownership structure, to considerations of the performance of nearby Tim Hortons locations, projections of the selected location’s ability to meet financial return targets, restaurant owner identification, and physical land development and restaurant construction costs. We typically retain a controlling interest in the real estate for system restaurants by either owning the land and building, leasing the land and owning the building, or leasing both the land and building. While we have a standard, and highly recognizable, standalone restaurant design, we may vary the design to fit into local architecture and municipal requirements. Ultimately, we control the design and building of our restaurants to cater to the market and the neighbourhood in which the restaurants are located.
In Canada, we believe we have opportunity for future development for up to at least 4,000 locations. In 2011, we plan to slightly accelerate development in Canada. Our Canadian development is primarily focused in continuing to build our core growth markets of Quebec, western Canada, Ontario and major urban locations. As part of our broader development strategy, we are also targeting new areas, including urban and rural communities, and locations as part of our broader development strategy, through utilizing new, flexible restaurant formats and designs. For example, in 2010, we opened three self-serve kiosks in Nunavut.
As of January 2, 2011, the number of Tim Hortons restaurants across Canada, both standard and non-standard locations, which for this purpose includes self-serve kiosks, totaled 3,148. Standard restaurants constitute approximately 72% of this total. Also as of January 2, 2011, our restaurant owners operated substantially all of our Canadian restaurants. In the U.S., as of January 2, 2011, we have a regional presence with 602 restaurants in 9 states, concentrated in the Northeast in New York and Maine, and in the Midwest in
9
Table of Contents
Michigan and Ohio. We own, rather than lease, the land underlying a higher percentage of our standard system restaurants in the U.S. than in Canada. As of January 2, 2011, restaurant owners, including operators (See “Franchise and Other Arrangements—Other Arrangements” below for a description of “operators”), operated substantially all of the restaurants in the U.S. See Item 2. Properties of this Annual Report for a description of the number and type of restaurants by province/territory in Canada and by state in the U.S. owned or operated by our restaurant owners and owned by the Company.
During 2010, we continued to develop our growing regional presence in certain markets in the Midwest and certain markets in the Northeastern U.S., focusing primarily on our existing major regional markets such as New York, Ohio and Michigan. We continued adjusting certain elements of in our standard restaurant development, including right-sizing our restaurants, which we believe will better meet the needs of our customers while also creating efficiencies for our restaurant owners and us.
During the third quarter of 2010, an impairment review was initiated for markets in the New England region, the performance of which continued to fall below our expectations. These markets included: Portland, Maine; Providence, Rhode Island; and Hartford, Connecticut. Upon completion of such review, it was determined that the future expected cash flows of these markets were insufficient to recover the carrying value of the long-lived assets in these markets. As a result, we recorded a non-cash asset impairment charge of $20.9 million in our U.S. operating segment in the third quarter of 2010. Additionally, during the fourth quarter of 2010, we closed 34 restaurants and 18 self-serve kiosks in the Hartford and Providence markets and two restaurants in the Portland market. The closure of these restaurants resulted in closure costs of $7.4 million, net of a reversal of $2.5 million in asset impairment charges reflecting changes in estimates from the third quarter of 2010, which will primarily be in cash when ultimately settled. Combined, the asset impairment and related closure costs totaled $28.3 million. These markets represent a relatively small portion of our overall system in the U.S., but historically had a disproportionately negative impact on earnings, average unit volumes and same-store sales growth in the U.S. segment. We believe that these closures will allow us to focus on and reinvest our savings realized from the closed restaurants into core growth markets in the U.S. Northeast and Midwest by increasing our advertising and marketing scale. We expect this decision to contribute directly to operating income improvement in the U.S. segment in 2011.
In 2011, our development strategy will focus on working to establish a greater density of restaurants in our most developed U.S. markets to accelerate the time it takes to create critical mass for convenience and advertising scale in those markets, while continuing to develop other emerging markets for long-term growth. We will also continue to test a new concept restaurant in certain U.S. markets, adopting elements of those concepts to significantly differentiate our brand and customer offerings as a café and bake shop destination. It is also our plan to support our key markets through additional marketing and advertising investments in our growth and core markets to build increased awareness and to support the development focus in these targeted markets.
As a result of a broader international restaurant development strategy, we have entered into a master license agreement with a licensee for the development of Tim Hortons restaurants in the Gulf Cooperation Council pursuant to which approximately five restaurants will be developed in 2011 and up to an aggregate of 120 multi-format restaurants may be developed over a five-year period pursuant to the agreement. See “Franchise and Other Arrangements—Master License Agreements” and “International Operations” below.
The importance of restaurant owners and their employees. Finding exceptional restaurant owner candidates is critical to the system’s successful growth and development, and we have implemented a comprehensive restaurant owner screening and recruitment process that employs multi-level interviews with our senior operations management and requires candidates to work two to three different shifts in an existing restaurant owner’s restaurant. Each new restaurant owner typically participates in a mandatory eight-week intensive training program to learn all aspects of operating a Tim Hortons restaurant in accordance with our standards. Management-level employees of restaurant owners have the opportunity to become certified at our training centre after completion of an eight-week training program. We also provide ongoing training and education to restaurant owners and their staff after completion of the initial training programs. To further assist restaurant owners, we have standardized our restaurant management software with an application service provider to give
10
Table of Contents
our restaurants the ability to manage a variety of the day-to-day operations and management functions. The Company has also allocated $30 million in connection with the sale of its 50% joint venture interest in Maidstone Bakeries with the intent of supporting our key relationship with restaurant owners to help to partially mitigate anticipated rising operating costs.
Restaurant owner financing. Despite the challenging economic climate and credit conditions, our restaurant owners continue to have access to lending programs with third-party lenders, although processing may take longer and costs may be higher, consistent with prevailing market conditions. Currently, a significant portion of our notes are past-due under our franchise incentive program. In many cases, we have also chosen to hold the note for longer periods of time than we have historically done to ensure the restaurant has achieved certain profitability targets. In the event a restaurant owner cannot repay the note, we may take back ownership of the restaurant and equipment, which effectively collateralizes the note and, therefore, minimizes our risk. Initially, we are also entering into operator agreements more frequently in the U.S. than full franchise agreements, and once the restaurant is established and reaches certain profitability measures, we may convert it to a full franchise agreement. See “Franchise and Other Arrangements” below for additional information regarding the franchise incentive program.
Distribution. The Company is a distributor to Tim Hortons restaurants. We have five distribution centres located in Langley, British Columbia; Calgary, Alberta; Kingston, Ontario; Guelph, Ontario; and Debert, Nova Scotia. The Guelph facility is unique in our distribution system in that it distributes frozen and refrigerated products in addition to dry goods and shelf-stable products, known as one-stop delivery. The Guelph facility serves approximately 85% of our Ontario restaurants, which represents approximately 44% of restaurants in Canada. We are in the process of constructing a replacement distribution centre in Kingston, Ontario which also will have capability and capacity for frozen and refrigerated products in addition to dry goods to our restaurant owners. Total planned capital expenditures on this facility are currently estimated to be approximately $45.0 million, with approximately $10.3 million incurred in 2010. The facility is expected to be fully operational during the second half of 2011 and serve more than 650 restaurants in eastern Ontario, and Quebec, responding to continued projected growth in that market. As with other vertical integration initiatives, we expect this new facility will deliver important system benefits, including improved efficiency and cost-effective service for our restaurant owners, as well as providing a reasonable return for the Company. Under the franchise arrangements with our Canadian restaurant owners, each restaurant owner is required to purchase substantially all products, such as coffee, sugar, and restaurant supplies, from us. Canadian and U.S. restaurant owners are also required to purchase par-baked Maidstone Bakeries products from either us or an outside distributor, depending upon the restaurant location. We own or lease a significant number of trucks and trailers that deliver to most of our Canadian restaurants on a regular basis. We use third-party distributors to deliver all products to the U.S. restaurants and to deliver to certain limited geographic areas of Canada.
Supply chain is a critical element of our business model as it allows us to control costs to our restaurant owners and to service restaurants efficiently and reliably, while contributing positively to our profitability. One-stop delivery furthers these objectives of timely and efficient service for our restaurant owners, despite the lower profitability to us of frozen and refrigerated distribution. We continue to consider expansion of our distribution business, including frozen and refrigerated distribution to areas in Canada not supplied by the Guelph facility and the Kingston facility, if there are sufficient system benefits to do so.
We also offer home-brew coffee through various lines of distribution in Canada and the U.S., including certain grocery stores. In late 2008 through 2009, we expanded our distribution in the grocery channel in Canada. Home-brew coffee, other hot beverages and various accessories are also offered and distributed through TimShopTM. See “E-commerce Platform” below.
Menu items and new product innovation. Each Tim Hortons restaurant offers a relatively standard menu that spans a broad range of categories designed to appeal to customers throughout the day. While the largest portion of systemwide sales is generated in the morning, we generate sales throughout the day with no two-hour period
11
Table of Contents
accounting for more than 20% of our average daily sales. A substantial majority of Tim Hortons restaurants are open 24 hours. Our average cheque size in both Canada and the U.S. is in the range of approximately $2.75 to $3.50 (includes both standard and non-standard locations).
The Tim Hortons menu consists of products such as our premium blend coffee, flavoured hot and iced cappuccinos, specialty and steeped teas, cold beverages, flavour shots in hot and cold beverages, home-style soups, chili, freshly prepared sandwiches, wraps, yogurt and berries, oatmeal and freshly baked goods, including donuts, Timbits, bagels, muffins, cookies, croissants, Danishes, pastries and more. We also offer a variety of breakfast sandwiches in both Canada and the U.S., including the sausage/bacon and egg on a biscuit, bagel or an English muffin, as well as a variety of breakfast wraps. New product offerings have historically contributed significantly to same-store sales growth. In 2010, we continued to reinforce our commitment to providing customers with value by focusing advertising and promotions on product-specific items and combos. In addition to food items, Tim Hortons restaurants sell a variety of promotional products on a seasonal basis and also sell home coffee brewers, home-brew coffee, boxed teas, and other products throughout the year. We will also tailor our menu offerings to meet the needs of our international customers in connection with our recently announced international expansion into the Gulf Cooperation Council market.
Quality controls. Our quality control programs focus on maintaining product quality, freshness, and availability, as well as speed of service, cleanliness, security, and employment standards. These programs are implemented by our restaurant owners (and the Company for Company-operated restaurants), with assistance from our field management. In addition, because the Tim Hortons brand is so closely linked to the public’s perception of our food quality and safety, we require our restaurant owners, as well as their managers and operations personnel, to complete the Advanced.fst® food safety program for our Canadian restaurants and the ServSafe® program for our U.S. restaurants. These programs must be completed with a passing grade and participants must be re-certified every five years. We also conduct site visits on a regular basis and, twice a year at a minimum, we perform unscheduled food safety audits. In addition, all restaurant staff must complete a multi-level food safety training module as part of their mandatory training. We also have a comprehensive supplier quality approval process, which requires all suppliers’ products to be pre-approved to our quality standards. Part of this process requires the supplier to pass on-site food safety inspections for the supplier’s manufacturing process and facilities.
Manufacturing. We have two wholly owned coffee roasting facilities. Our Maidstone Coffee facility, located in Rochester, New York and, therefore, part of our U.S. segment for financial reporting purposes, roasts coffee for approximately 44% of our total coffee requirements. We acquired this plant in 2001 as part of our U.S. expansion efforts. In 2009, we constructed a new coffee roasting facility in Hamilton, Ontario. Together, our coffee roasting plants will have the capacity to produce at least 75% of our total coffee requirements. We blend our coffee prior to providing it to our third-party roasters as we believe this practice protects the proprietary nature of our coffee. We also own a fondant and fills manufacturing facility that was acquired in 2003 and produces fondants, fills, and ready-to-use glaze, which is used in connection with a number of the products produced in the Always Fresh baking system.
In 2001, a subsidiary of the Company formed CillRyan’s Bakery Limited (“CillRyan’s” or “Maidstone Bakeries”), a 50/50 joint venture with IAWS Group Ltd. (now owned by Aryzta AG) (“Aryzta”), to commission the construction of the Maidstone Bakeries facility, a 400,000 square foot joint venture par-baking facility located in Brantford, Ontario. This facility manufactures par-baked donuts, Timbits and selected breads, following traditional Tim Hortons recipes, as well as European pastries, including Danishes, croissants, and puff pastry. Those products are partially baked and then flash frozen and delivered to system restaurants, most of which have an Always Fresh oven with the Company’s proprietary technology. The restaurant completes the baking process with this oven and adds final finishing such as glazing and fondant, allowing the product to be served warm to the customer within a few minutes of baking. The limited space required for the Always Fresh oven allows most non-standard restaurant locations (other than self-serve and certain other non-standard kiosk locations) to provide products baked fresh on-site.
12
Table of Contents
In April 2010, we received notice from Aryzta invoking the buy/sell provisions of the Maidstone Bakeries joint venture. Pursuant to such buy/sell provisions, Aryzta gave us notice offering to purchase all but not less than all of our interest in Maidstone Bakeries for an aggregate purchase price of $475 million or to sell to us all but not less than all of Aryzta’s interest for an aggregate purchase price of $475 million. We accepted Aryzta’s offer to purchase our interest in Maidstone Bakeries in August, 2010. The all-cash transaction closed on October 29, 2010 for gross proceeds of $475 million. See “Source and Availability of Raw Materials” below and Item 7. Management’s Discussion and Analysis of Financial Condition and Results of Operations—“Executive Overview.”
Combination restaurants, an ongoing relationship with Wendy’s. Since the early 1990s, TIMWEN Partnership (“TIMWEN Partnership”), owned on a 50/50 basis by the Company and Wendy’s, jointly developed the real estate underlying “combination restaurants” in Canada that offer Tim Hortons and Wendy’s products at one location, typically with separate restaurant owners operating the Tim Hortons and the Wendy’s portions of a restaurant. The combination restaurants have separate drive-thrus, if the site allows for drive-thrus, but share a common entrance way, seating areas and restrooms. Separate front counters and food preparation areas are also in place for each of the two restaurant concepts. TIMWEN Partnership owns or leases the underlying real estate from a third party, develops the combination restaurants and leases, or subleases, as applicable, a portion of the location to the Company (for the Tim Hortons restaurant) and to Wendy’s (for the Wendy’s restaurant).
As of January 2, 2011, there were 102 combination restaurants in the TIMWEN Partnership, all of which were in Canada, and 98 of which were franchised. We also have a small number of combination restaurants that are not held by the TIMWEN Partnership. At January 2, 2011, there were 21 such restaurants in Canada, all of which were franchised, and 30 combination restaurants in the U.S., 29 of which were franchised. For the U.S. combination restaurants, we generally own or lease the land, and typically own the building and lease or sublease, as applicable, a portion of the location to the Tim Hortons restaurant owner (for the Tim Hortons restaurant) and to Wendy’s (for the Wendy’s restaurant). We do not intend to actively open combination restaurants with Wendy’s in future years, nor has there been significant development of these restaurants in recent years.
Credit, Debit and Cash Card Arrangements. In 2004, electronic payment systems for credit cards were implemented in the U.S. restaurants. We introduced electronic payment systems in Canada to allow for payment by credit card in 2007. In late 2010, electronic payment systems for debit cards were available at most of our restaurants in Canada. By the end of December 2010, electronic payment capabilities (including our Tim Card®, see below) were in place at approximately 2,840 locations in Canada and 450 locations in the U.S. We also have a Tim Card quick-pay cash card program. The Tim Card is a reloadable cash card that can be used by customers for purchases at system restaurants. Customers can reload the Tim Card online at www.timhortons.com. Our electronic payment systems provide customers with more payment options. As of January 2, 2011, “Restricted cash and cash equivalents” and “Restricted investments,” which represent outstanding customer deposits on our Tim Card, totaled $105.1 million ($80.8 million as of January 3, 2010).
E-commerce Platform. TimShop, an e-commerce platform, serves Canadian and U.S. residents. Canadian customers may order a range of items online such as gift baskets, coffee brewers, travel mugs, and our full canned beverage line-up of coffee, teas, cappuccinos and hot chocolate, at shop.timhortons.com. Beginning in December 2010, U.S. customers may also order products online, including ground coffee, hot chocolate, cappuccinos, boxed tea, various travel mugs and insulated coffee carriers, at shopus.timhortons.com.
Source and Availability of Raw Materials
Our food products are sourced from a combination of third-party suppliers and our own manufacturing facilities. We and our restaurant owners have not experienced any material shortages of food, equipment, fixtures, or other products that are necessary to restaurant operations. We currently do not anticipate any
13
Table of Contents
shortages of products. Alternative suppliers are available for most of our products, although we currently source some of our beverage and food offerings from a single supplier. As described below, in the event of an interruption in supply from any of these sources, our restaurants could experience shortages of certain products. While customers might purchase other products when a desired menu item is unavailable, this might not entirely offset the loss of revenue from the unavailable products.
While we have multiple suppliers for coffee, the available supply and price for high-quality coffee beans can fluctuate dramatically. Accordingly, we monitor world market conditions for green (unroasted) coffee and contract for future supply volumes to obtain expected requirements of high quality coffee beans at acceptable prices. It may be necessary for us to adjust our sources of supply from time-to-time to achieve the desired blend, and we expect that we will continue to be able to do so.
During 2010, we sold our 50% joint venture interest in Maidstone Bakeries to Aryzta, our former joint venture partner. See “Operations—Manufacturing” above. Maidstone Bakeries supplies all of the par-baked donuts and Timbits, a significant portion of other bread products and European pastries, including Danishes, croissants and pastries. In connection with the sale of Maidstone Bakeries, our obligations to purchase supply of donuts and Timbits extend until early 2016, and we have supply rights until late 2017, at our option, allowing us sufficient flexibility to secure alternative means of supply, if necessary. Our rights to purchase supply, which generally extend for seven years from the termination of the joint venture agreements, could expire before the expiration of seven years if a triggering event occurs with respect to the Company, such as if we breach our obligation to purchase all of our donuts and Timbits from Maidstone Bakeries until early 2016 or if we fail to cooperate in estimating the supply needs of our system, and Aryzta takes action to terminate our supply agreement with Maidstone Bakeries. All triggering events which may terminate our right to continue to purchase products from Maidstone Bakeries until late 2017 are within our ability to control.
Under certain circumstances as a result of our exit from the joint venture, we may be required to purchase products currently sourced from Maidstone Bakeries at a higher cost, build our own facility to manufacture these products, or find alternative products and/or production methods, any of which would cause us to incur significant start-up and other costs. Also, if Maidstone Bakeries’ operations were negatively impacted by an unexpected event, our restaurants could experience shortages of donuts, Timbits, European pastries, and other bread products sourced from Maidstone Bakeries. We expect that any such shortage for most products would be for a limited period of time, until such products could be sourced from alternate suppliers, except for certain par-baked donuts and Timbits, for which we have not identified alternate suppliers. Any product shortages, however, even of a limited duration, could negatively affect our sales as well as injure our relationships with restaurant owners and our customers’ perception of Tim Hortons and our brand.
Commencing in 2009 with the addition of our second plant in Hamilton, Ontario, a larger percentage of Tim Hortons system restaurants purchased coffee that is blended and roasted at our two Maidstone Coffee facilities, although we have additional third-party suppliers. Our fondant and fills manufacturing facility produces and is the sole supplier of ready-to-use glaze and certain fondants and fills which are used on a number of the products produced in the Always Fresh baking system. However, should our facility be unable to supply ready-to-use glaze, it may be replicated by restaurant-level operations, and should our facility be unable to supply fondants and fills for an extended period, we believe substitute fondants and fills could be supplied by third parties. We sell most other raw materials and supplies, including coffee, sugar, paper goods and other restaurant supplies, to system restaurants. We purchase those raw materials and supplies from multiple suppliers and generally have alternative sources of supply for each.
World markets for some of the commodities that we use in our business (such as coffee, wheat, edible oils and sugar) have experienced high volatility, including a number of commodities which experienced elevated spot market prices relative to historic prices. We currently have purchase contracts in place covering key commodities such as coffee, wheat, sugar, and cooking oils that generally extend to the fourth quarter of 2011, albeit at prices generally higher than those secured for 2010. The current strength of the Canadian dollar may help to mitigate
14
Table of Contents
some, but not all, of these price increases as certain of these commodities are sourced in U.S. dollars. Also, we may be subject to higher commodity prices depending upon prevailing market conditions at the time we make purchases beyond our current commitments.
Our business will continue to be subject to changes related to the underlying costs of key commodities. These cost changes can impact revenues, costs and margins, and can create volatility quarter-over-quarter and year-over-year. Increases and decreases in commodity costs are largely passed through to restaurant owners, resulting in higher or lower revenues and higher or lower costs of sales from our business. These changes may impact margins as many of these products are typically priced based on a fixed-dollar mark-up. Although we have implemented purchasing practices that mitigate our exposure to volatility to a certain degree, as mentioned above, if costs increased to a greater degree for 2011 purchases, we and our restaurant owners have some ability to increase product pricing to offset a rise in commodity prices, but these price increases could negatively affect sales.
In addition, we purchase certain products, such as coffee, in U.S. dollars. As the Canadian dollar strengthens against the U.S. dollar, these products become less expensive for us and, therefore, our Canadian restaurant owners. For our U.S. restaurant owners, as the U.S. dollar weakens against the Canadian dollar, certain other products become more expensive for them. As a result, although world commodity prices have increased, in a rising Canadian dollar environment, the positive impact of foreign exchange has partially offset the overall effect to us and our Canadian restaurant owners of such price increases. See Item 1A. Risk Factors and Item 7A. Quantitative and Qualitative Disclosures About Market Risk—Foreign Exchange Risk and Commodity Risk.
Franchise and Other Arrangements
Restaurant owners. Our objective is to have restaurant owners own substantially all Tim Hortons restaurants and to maintain a small number of Company-operated restaurants for restaurant owner training. As of January 2, 2011, restaurant owners owned or operated 99.5% of our Canadian restaurants and 99.3% of our U.S. restaurants.
Our restaurant owners operate under several types of license agreements, with a typical term for a standard restaurant of ten years plus aggregate renewal period(s) of approximately ten years. For restaurant owners who lease land and/or buildings from the Company, for new arrangements and renewals, the license agreement typically requires a royalty payment of 4.5% of weekly gross sales of the restaurant, as defined in the license agreement. Under a separate sublease, restaurant owners typically pay monthly rental based on a percentage (usually 8.5%) of monthly gross sales, as defined in the license agreement. Where the restaurant owner either owns the premises or leases it from a third party, the royalty is typically increased. Under the license agreement, each restaurant owner is required to make contributions to an advertising fund based on a percentage of restaurant gross sales, further described under “Advertising and Promotions,” below.
Generally, we retain the right to reacquire a restaurant owner’s interest in a restaurant. To keep system restaurants up-to-date, both aesthetically and operationally, our license agreements require a full-scale renovation of each system restaurant by the restaurant owner, including our non-standard restaurants, approximately every ten years. We typically contribute up to 50% of the funding required for certain front-of-store construction costs incurred in connection with renovations on property that we own or lease.
In Canada, and generally to-date in the U.S., we have not granted exclusive or protected areas or territories to restaurant owners. The license is a “location” license only, and we reserve the right to grant additional licenses for Tim Hortons restaurants at any other location. In addition, the royalty rates under license agreements entered into in connection with non-standard restaurants, including self-serve kiosks and strategic alliances with third parties, may vary from those describe above for standard restaurants and are negotiated on a case-by-case basis.
The Company reserves the right to terminate the license agreement for a variety of reasons described in the underlying agreement.
15
Table of Contents
Other Arrangements. For most restaurant owners new to the system, we will enter into arrangements, typically called operator agreements, in which the operator acquires the right to operate a Tim Hortons restaurant, but we continue to be the owner of the equipment, signage and trade fixtures. These are not typical franchise relationships. Such arrangements usually require the operator to pay approximately 20% of the restaurant’s weekly gross sales, as described in the operator agreement, to the Company. Additionally, the operator will be responsible for paying all trade debts, wages and salary expenses, maintenance and repair costs, taxes, and any other expenses incurred in connection with the operation of the restaurant. These operators also make the required contributions to our advertising funds, described below. In any such arrangement, the Company and the operator each have the option of terminating the agreement upon 30 days notice. Although we do not consider our operators as typical restaurant owners, for purposes of this Form 10-K, references to restaurant owners include these operators, and references to license agreements include these operator agreements, unless otherwise indicated. Under Financial Accounting Standards Board Accounting Standards Codification™ 810 – Consolidation (formerly FASB Interpretation 46R – Consolidation of Variable Interest Entities – an Interpretation of ARB 51 (revised December 2003)), we are required to consolidate the financial results of certain of these operators. Additional detail regarding these arrangements for operators that are consolidated, as well as additional detail regarding the consolidation, is set forth in Notes 1 and 20 to the Consolidated Financial Statements.
We have developed a franchise incentive program for U.S. restaurant owners that provides financing for both the initial franchise fee and the purchase of certain restaurant equipment, furniture, trade fixtures, and interior signs. Payment for the purchase of those assets is deferred for a period of 104 weeks from the date of opening, and the restaurant owner has the option to pay the initial franchise fee, including interest thereon, over this period as well. Payment for the equipment package is due and owing at the end of 104 weeks. The only benefit received under the franchise incentive program is deferred payment for 104 weeks for the franchise fee, which is otherwise paid weekly, and the equipment, which is to be paid at the end of the term. Currently, the royalty rate and rent rate under this program are consistent with the standard rates referred to above for U.S. restaurants, although some restaurant owners are still on the prior program, under which the royalty and rental rates were reduced. In addition, at the conclusion of the franchise incentive program, if our restaurant owners are unable to secure financing for the equipment package, we may extend the necessary financing to these restaurant owners. See Notes 1 and 6 to the Consolidated Financial Statements for additional details regarding the franchise incentive program and related notes receivable.
To supplement the franchise incentive program, at our discretion, we may offer additional relief to restaurant owners in developing markets in the U.S. where the brand is not yet established and the restaurants are underperforming. The terms of this additional relief vary depending on the circumstances, but may include assistance with costs of supplies; certain operating expenses, including rent and royalties; and, in certain markets, labour and other costs. These “support costs” decrease the Company’s rents and royalties revenue. As we franchise more restaurants in the U.S., and as we transition corporate restaurants to franchised locations, our relief costs increase. We anticipate this will continue as we expand our developing markets in the U.S. We also provide limited relief to Canadian restaurant owners in certain circumstances as well.
Master License Agreements. In the fourth quarter of 2009, we entered into two separate master licensing arrangements with Kahala Franchise Corp., the franchisor of the Cold Stone Creamery brand. The nature and purpose of the arrangements are to expand the parties’ co-branding initiatives. We have exclusive development rights in Canada, and certain rights to use licenses within the U.S., in both cases to operate ice cream and frozen confections retail outlets. In 2011, we entered into a master license agreement with Apparel Group to develop Tim Hortons restaurants in the Gulf Cooperation Council States of United Arab Emirates, Qatar, Bahrain, Kuwait and Oman. See “Trademarks and Service Marks” and “International Operations” below.
16
Table of Contents
Advertising and Promotions
Our marketing is designed to create and extend our brand image as “your neighbourhood Tims” that offers “quality products at reasonable prices.” We use radio, television, online advertising, and event sponsorship, as well as our highly visible community caring programs, and our Tim Card, to reinforce this brand image with our customers. We also host a website at www.everycup.ca and www.everycup.com which invites customers from Canada and the U.S. to share their stories and experiences with Tim Hortons as well as a Facebook page.
National Marketing Program. Restaurant owners fund substantially all of our national marketing programs by making contributions to our Canadian or U.S. advertising funds, which were established to collect and administer contributions for advertising efforts. In fiscal 2010, restaurant owners and Company-operated restaurants in Canada contributed approximately $179 million (approximately 3.5% of their sales) to the Canadian advertising fund. Although the franchise or license agreement requires contributions of up to 4.0% of sales, we have voluntarily reduced the current contribution to 3.5%, but retained the right to increase the contribution at any time. Restaurant owners and Company-operated restaurants in the U.S. contribute 4.0% of their sales to the U.S. advertising fund. We have made, and from time to time may make at our discretion, additional investments in advertising for specific programs in the U.S. to support the growth of our brand in our developing markets. We have national advisory boards of elected restaurant owners. The mandate for these boards includes responsibility for matters related to the Canadian and U.S. advertising funds, respectively, including promotions, operations, and research and development.
In 2011, one key component of our strategies to increase same-store sales includes leveraging our marketing strengths and advantages. In Canada, we will leverage our scale as one of the country’s largest advertisers to reinforce our attractive price to value position and to reinforce our brand equity, and continue to focus on our hospitality initiatives. In the United States, we plan to significantly increase our marketing and advertising spending in all markets over historical contribution levels and, in particular, in our core, more developed growth markets, to increase awareness of our brand. In addition, we will seek other marketing means, such as community involvement, sponsorships, and other forms of communication, to supplement traditional advertising to reinforce our brand position with customers and to broaden our brand awareness as a cafe and bake shop destination.
Regional Marketing Programs. Part of the national marketing program contribution is allocated to regional marketing groups (approximately 323 in Canada and 33 in the U.S.). The regional marketing groups sponsor and support locally targeted marketing programs. We also support these regional marketing groups with market strategy and regional plans and programs.
Required restaurant owner contributions to the advertising funds, and the allocation to local and regional advertising programs, are governed by the respective franchise agreements between the Company and its restaurant owners. Contributions by Company-operated restaurants for advertising and promotional programs are at the same percent of retail sales as those made by franchised restaurants.
See Note 20 to the Consolidated Financial Statements for further information regarding our advertising funds.
Competition
We compete in the quick service restaurant segment in Canada and the U.S. We face significant competition with a wide variety of restaurants on a national, regional, and local level, including quick service restaurants and fast-casual restaurants focused on specialty coffee, baked goods, and sandwiches, as well as gas and other convenience locations that sell food and beverages. The size and strength of our competitors vary by region, and there are numerous competitors in nearly every market in which we conduct business or expect to enter.
17
Table of Contents
We believe competition within the quick service restaurant segment is based on, among other things, product quality, concept, atmosphere, customer service, operational excellence, convenience and price. The number and location of units, quality and speed of service, attractiveness of facilities, effectiveness of marketing, general brand acceptance, and new product development by us and our competitors are also important factors. The prices charged by us for menu items may vary from market to market depending on competitive pricing and the local cost structure. Additionally, we compete with quick service restaurants and other specialty restaurants for personnel, suitable restaurant locations, and qualified restaurant owners.
In Canada, we have the leading market position in this segment, based on systemwide sales and number of restaurants, with a strong presence in every province. According to industry market studies, based on transactions, our system restaurants represented 41% of the Canadian quick service restaurant sector for the 12 months ended August 2010 and 78% of the brewed coffee sector of the Canadian quick service restaurant sector for the same period, in each case based on number of customers served. We believe our presence in key markets and our ability to leverage our scale in advertising support our drive to maintain and extend our market leadership position in Canada over 2011.
In the U.S., we have developed a regional presence in certain markets in the Northeast and Midwest, but we still have limited brand awareness, even in many areas where we have a presence. Our competitors in the U.S. range from small local independent operators to well-capitalized national and regional chains, such as McDonald’s®, Wendy’s, Starbucks®, Subway® and Dunkin’ Donuts®. Many of our competitors in the U.S. are significantly larger than us, based on total systemwide sales and number of restaurants, and, therefore, have substantially greater financial, marketing, personnel and other resources.
Competition in both Canada and the U.S. continues to intensify as new players enter the coffee market, and quick service restaurants have increasingly focused efforts on specialty coffee and other coffee-based beverages and baked goods. Also, our competitors in the coffee and baked goods sector are continuing to expand their food offerings, particularly during breakfast, which is a key daypart for us. Commencing in 2009, a number of our competitors also commenced and/or intensified discounting (heightened by the continuing economic challenges in North America) and “combo” or value-pricing practices, as well as free product promotions. This cross-over of brands and menu offerings, and general increased competition on price and other factors, continued through 2010. In 2010, we continued to offer targeted value-priced food and beverage programs, in addition to the launch of new products at a variety of everyday value price points, with the intent to strengthen and build on our price/value position and to enhance this message with our consumers in a tangible way. In the U.S., we also introduced the use of coupons as a vehicle to attract new customers and introduce them to our brand and new product offerings. While we do not intend to stray from our core everyday positioning of quality food at reasonable prices, we are working with our restaurant owners to communicate and interact with customers in a manner that responds to their current situation and the economic environment. We believe that continued business refinements will help, over time, position our U.S. business to defend aggressive competitive discounting activity, while also creating sales momentum.
We plan to continue expanding in the U.S., including potentially into areas where customers are unfamiliar with our brand. We will likely need to build brand awareness in those markets through advertising and promotional activity. We do not get the same leverage from our television marketing activities in the U.S. because our restaurants are spread across numerous distinct markets that require local purchases for television advertising, as opposed to leveraging local or regional advertising across larger marketing areas that are more highly penetrated with our restaurants. See “Advertising and Promotions” above. Many of the U.S. markets into which we may expand have competitive conditions, consumer tastes and discretionary spending patterns that may differ from our existing markets. We may need to adapt our brand and our restaurants to those markets. In addition, our position as a new entrant in certain U.S. regional markets makes us more vulnerable to competitive promotional activity from other more established brands in those markets and to increased competition for restaurant locations, customers, and restaurant owners. In certain markets in the U.S., we open restaurants that are less successful and may adversely impact surrounding locations for a period of time, and we may provide
18
Table of Contents
greater levels of relief to U.S. restaurant owners as a result. Such decisions are based on a long-term view of strengthening and expanding our business in the U.S. See “Operations—Restaurant Development” above.
Trademarks and Service Marks
We have registered various trademarks and service marks in Canada, the U.S. and certain other jurisdictions. We have also registered various internet domain names, including www.timhortons.com, www.rolluptherimtowin.com, www.timcard.ca, shop.timhortons.com, www.everycup.ca and www.everycup.com. Some of our most recognizable registered marks include:
| • | Tim Hortons signature; |
| • | Tim Hortons and Always Fresh Oval Background Design; |
| • | Roll Up The Rim To Win; |
| • | Timbits; and |
| • | Tim Card. |
We believe our trademarks, service marks and other proprietary rights have significant value and are important to our brand-building efforts and the marketing of our restaurant system. We generally intend to renew trademarks and service marks that are scheduled to expire and to otherwise protect and vigorously defend and enforce our rights to this intellectual property. See also Item 1A. Risk Factors of this Annual Report.
In 2009, we entered into a master license agreement with Kahala Franchise Corp. giving us the exclusive right to use the Cold Stone Creamery® trademarks in Canada together with the right to sub-franchise said marks on an exclusive basis. In 2009, we also entered into a master license agreement with Kahala Franchise Corp. giving us the right to use the Cold Stone Creamery trademarks in the United States, together with the right to sublicense said marks.
In 2011, the Company entered into a master license agreement with Apparel Group based in Dubai, giving Apparel Group the right to use the Tim Hortons trade marks in Oman, Bahrain, Qatar, Kuwait and United Arab Emirates.
Sustainability and Responsibility
Sustainability and responsibility at Tim Hortons focuses on initiatives and programs framed around three pillars—Individuals, Communities, and the Planet. We have developed a number of overarching sustainability and responsibility commitments and goals and have reported our performance against these goals in our first sustainability and responsibility report issued in our 2009 annual report. Our report was also developed using the process outlined by the Global Reporting Initiative’s (“GRI”) G3 Guidelines. We intend to publish an annual sustainability and responsibility report in accordance with the GRI Sustainability reporting framework.
Governance and Accountability for Sustainability and Responsibility. Our sustainability and responsibility policy includes a structure and supporting processes for effective sustainability and responsibility governance and accountability. The Tim Hortons Board of Directors governs sustainability and responsibility. The Nominating and Corporate Governance Committee of the Board manages this accountability on behalf of the Board. Oversight activities include review of: policy development; sustainability and responsibility strategies, and supporting implementation and resource plans, including mitigation of risks; and organizational sustainability and responsibility commitments, goals and external reporting. Management accountability for sustainability and responsibility resides with the Tim Hortons Executive Team.
19
Table of Contents
Management of Sustainability Risks and Opportunities. The assessment and management of sustainability related risks and opportunities are embedded as part of our governance framework, and our sustainability and responsibility strategy and its supporting implementation plan. Key aspects of our approach include: the assessment of sustainability and responsibility impacts of major business decisions; the integration of sustainability and responsibility into the Company’s Enterprise Risk Management process and internal performance scorecards; monitoring our relations with our stakeholders, including our sustainability and responsibility Advisory Council of external experts; the assessment of sustainability and responsibility trends; and, consideration of public policy, consumer, corporate, general public trends, issues, and developments that may impact the Company.
Environmental Matters
Our operations, including our distribution and manufacturing facilities, restaurant site selection and development, and other aspects of our business, are subject to complex environmental, health, and safety regulatory regimes, and involve the risk of environmental liability. There are also potential risks for road and on-site releases of hazardous substances and accidents that could result in environmental contamination that are not within our control.
Our restaurants have not been the subject of any material environmental investigations or claims of which we are aware. Our current practice is to conduct environmental due diligence when considering potential new restaurant locations or other company-owned facilities. This due diligence typically includes a Phase I Environmental Site Assessment, which will not necessarily identify all environmental conditions associated with a property and, if warranted, a Phase II Environmental Site Assessment to further investigate any areas of potential environmental concern. Appropriate action is taken, as needed, to resolve any issues.
Some municipal governments and environmental advocacy groups have begun to focus on the level of emissions from vehicles idling in drive-thrus. Some municipalities have implemented a moratorium on drive-thru development along with considering implementing a restriction on drive-thru operations on smog-alert days. Anti-idling by-laws are also being considered in various communities, on both public and private lands. If such restrictions, moratoriums and/or by-laws are imposed, they could have a substantial negative impact on our business and would limit our ability to develop restaurants with drive-thrus.
Variations in weather, due to climate change, have the potential to impact growing conditions in regions where we source our agricultural commodities, including coffee. On a year-to-year basis, agricultural production can be negatively affected by variations in weather and resulting physical impacts to the environment. The overall supply and demand of agricultural commodities and the price we pay for these commodities on the world market can therefore be impacted. With respect to potential climate-change legislation, the Canadian government has indicated that it will follow the U.S. with respect to implementing any climate-change related regulations. Proposed cap and trade systems and/or new carbon taxation may present risks or opportunities that will likely be unique to every business sector. We are unable to predict the effect on our operations of possible future environmental legislation or regulation in these areas.
Stewardship fee programs require all industry stewards with branded packaging, such as Tim Hortons, to contribute to a fund that subsidizes a portion of the costs of municipal recycling programs. Volumes of designated packaging are enumerated by the industry steward and fees are paid regardless of whether the designated materials are managed in municipal recycling programs. Stewardship programs for packaging currently exist in Ontario, Quebec and Manitoba. The Canadian Council of Ministers of the Environment’s (“CCME”) Canada-Wide Action Plan for Extended Producer Responsibility (“EPR”) has recommended that all Canadian jurisdictions (with the exception of the Territories) develop and implement EPR legislation for packaging (and other designated materials) by 2015. Some provinces (i.e. British Columbia) have begun this process. A change in EPR programs involves a shift towards paying 100% of the fees associated with managing
20
Table of Contents
packaging waste in municipal systems. As the CCME recommendations are only guidelines, there is no certainty regarding future increases in stewardship fees. In 2010, our stewardship fees in the aggregate were not financially material.
Acquisitions and Dispositions
We have from time-to-time acquired the interests of, and sold Tim Hortons restaurants to, restaurant owners, and we expect to continue to do so from time-to-time in the future, where prudent. We generally retain a right of first refusal in connection with any proposed sale of a restaurant owner’s interest. The Company is in the process of exploring options in connection with the disposition and sale of Company-owned properties as a result of the restaurant closures in the Southern New England area. In October 2010, we sold our 50% joint venture interest in Maidstone Bakeries to our former partner. See “Operations—Manufacturing” above. We intend to evaluate other potential mergers, acquisitions, joint ventures, investments, strategic initiatives, alliances, vertical integration opportunities and divestitures when opportunities arise or our business warrants evaluation of such strategies. See “Business Overview and 2011 Objectives” above and Item 1A. Risk Factors.
International Operations
Following a comprehensive assessment and due diligence process, we entered into a master license agreement with Apparel Group based in Dubai in February 2011 providing for the development of up to 120 multi-format restaurants over a five-year period in markets in the Gulf Cooperation Council (“GCC”) of United Arab Emirates, Qatar, Bahrain, Kuwait and Oman. Based on the level of success in our initial market entry into the GCC region, our international growth strategy is currently designed to evaluate potential additional regional market entries. In 2011, Apparel Group is committed to developing and operating approximately five restaurants. The master license agreement with Apparel Group is primarily a royalty-based model and also includes an upfront license fee, and our supply chain costs will be covered. The Apparel Group is responsible for capital spending and real estate development to open restaurants, along with operations. As a result, this arrangement minimizes our capital requirements, while still allowing us to pursue identified international growth opportunities. It is our intention to invest an amount between $2 million to $4 million in 2011, net of royalties, license fees and other costs, to support Apparel Group’s investments to launch the business in our GCC market entry.
We have self-serve kiosks in the Republic of Ireland through offerings at gas and other convenience locations, primarily under the Tim Hortons brand but also under another brand owned by Tim Hortons. These kiosks offer our premium coffee, tea, specialty hot beverages and a selection of donuts and muffins. As of January 2, 2011, there were a total of 194 units in the Republic of Ireland, 191 of which were self-serve and three of which were full-serve, licensed as Tim Hortons locations. We also have self-serve kiosks at gas and other convenience locations in the United Kingdom, where we had 81 units as of January 2, 2011. In addition, we have begun to experiment with larger footprints and drive-thrus at certain of these sites. As of January 2, 2011, we have continued our temporary location in Kandahar, Afghanistan, which is a full-serve location. These arrangements are not expected to contribute significantly to financial results in 2011.
See Item 2. Properties of this Annual Report for a listing of our international locations by country. We include the self-serve kiosks and full-serve restaurants as licensed locations under “International Operations,” as described under Item 2 but not in our U.S. or Canadian restaurant counts.
Our financial and other business arrangements for international locations (and for international development in general) are likely to differ from our traditional development models. We believe these international activities (and others we may test or undertake in the future), provide us with opportunities to evaluate a variety of new strategies for the development of our brand, which, if successful, may be adapted to existing markets as well as other new markets.
21
Table of Contents
Seasonality
Our business is moderately seasonal. Revenues and operating income are generally lower in the first quarter due, in part, to a lower number of new restaurant openings and consumer post-holiday spending patterns. First quarter revenues and operating income may also be affected by severe winter weather conditions, which can limit our customers’ ability to visit our restaurants and, therefore, reduce sales. Revenues and operating income generally build over the second, third, and fourth quarter and are typically higher in the third and fourth quarters due, in part, to a higher number of restaurant openings having occurred year-to-date, cooler weather potentially increasing sales of such products, such as hot coffee, and, in the fourth quarter, sales of holiday-packaged coffee and other merchandise. Because our business is moderately seasonal, results for any quarter are not necessarily indicative of the results that may be achieved for any other quarter or for the full fiscal year.
Employees
Our principal office locations are in Oakville, Ontario (Canada) and Dublin, Ohio (U.S.). We have ten other regional offices, including our five distribution centres. Our manufacturing facilities are located in Rochester, New York, Hamilton, Ontario and Oakville, Ontario. Our other regional offices (other than our distribution and manufacturing facilities) are located in Lachine, Quebec; Brighton, Michigan; and Williamsville, New York. As at January 2, 2011, we had approximately 1,863 employees in our principal offices, regional offices, distribution centres, and manufacturing facilities. We also have three employees that work on international activities in the Republic of Ireland and the U.K.
As at January 2, 2011, the Company operated directly (without restaurant owners) 16 restaurants in Canada and four restaurants in the U.S. The total number of full-time employees working in these corporate restaurants at January 2, 2011 was approximately 220, with another approximately 239 employees working part-time, bringing the total number of our restaurant employees to approximately 459. None of our employees is covered by a collective bargaining agreement. At franchised locations, employees are hired and managed by the restaurant owners and not the Company.
We believe in creating and fostering a positive employee-relations environment. We do this through active training and development, employee communication, a competitive total reward philosophy, a promotion-from-within philosophy, and other initiatives and programs focused on employee engagement. Our corporate values evidence our commitment to our strong “people” focus and the other critical elements of our culture.
Government Regulations and Affairs
The successful development and operation of restaurants depend to a significant extent on the selection and acquisition of suitable sites, which are subject to zoning, land use (including the placement of drive-thrus), environmental (including litter and drive-thru emissions), traffic and transportation, land transfer tax, and other regulations. Restaurant operations, including our restaurants and our manufacturing and distribution facilities, are also subject to licensing and regulation by state, provincial, and local departments relating to the environment, health, food preparation, sanitation and safety standards and, for our distribution business, traffic and transportation regulations; federal, provincial, and state labour laws (including applicable minimum wage requirements, overtime, working and safety conditions and citizenship requirements); federal, provincial, and state laws prohibiting discrimination; federal, provincial, state and local tax laws and regulations; and, other laws regulating the design and operation of facilities, such as the Americans with Disabilities Act of 1990 and similar Canadian provincial legislation that can have a significant impact on our restaurant owners and our performance. See also “Environmental Matters” above regarding environmental regulations affecting the Company.
A number of states in the U.S., and the provinces of Ontario, Alberta, Prince Edward Island, and New Brunswick, have enacted or are in the final stages of enacting legislation that affects companies involved in
22
Table of Contents
franchising. The Province of Manitoba is also considering such legislation. Franchising activity in the U.S. is also regulated by the U.S. Federal Trade Commission. Much of the legislation and rules adopted have been aimed at requiring detailed disclosure to a prospective restaurant owner, duties of good faith as between the franchisor and the restaurant owner, and/or periodic registration by the franchisor with applicable regulatory agencies. Additionally, some U.S. states have enacted legislation that governs the termination or non-renewal of a franchise agreement and other aspects of the franchise relationship. The Province of Manitoba and certain U.S. states, as well as the U.S. Congress, have also considered or are considering legislation of this nature. We have complied with regulatory requirements of this type in all applicable jurisdictions. We cannot predict the effect on our operations, particularly on our relationship with restaurant owners, of the future enactment of additional legislation or modifications of existing legislation.
Governments and consumer advocacy groups are encouraging alternative food processing methods that will result in significant reductions in trans fatty acids (“TFA”). During 2006, significant progress was made to reduce trans fat in most of our products to at or below acceptable levels in Canada and the U.S. As required by Canadian and U.S. legislation, we comply with nutritional labeling for foods, including those that contain TFA. Certain local governmental authorities, such as New York City, have banned TFA. We continue to research approaches to allow us to keep our products at acceptable levels of TFA while still maintaining the taste and quality that consumers desire.
The Canadian government continues to work with members of the quick service restaurants sector to reduce sodium intake. The Sodium Working Group, which consists of members from the manufacturing, health advocacy group, health professional organizations, and food service groups, agreed on a three pronged approach that includes: voluntary reduction of sodium levels in processed goods sold in food service establishments; education and awareness of consumers; and, research. As such, we have voluntarily posted the sodium content of our products in our on-line and printed nutrition guides for a number of years as part of our commitment to providing our guests with up to date nutritional information. We are currently working with suppliers to reduce the amount of sodium in our products and reducing sodium content by approximately 19% across our soup offering. Our main objective is to continue to provide our guests with the same great tasting, quality products without sacrificing flavour and freshness.
Legislation has been enacted in the U.S. requiring restaurants to post calorie count information on menu boards. We will monitor and comply with all regulations enacted by the U.S. Food and Drug Administration in connection with such calorie count posting requirements. Certain provinces within Canada are also considering similar laws to post calorie count information on menu boards.
Availability of Information
We currently qualify as a foreign private issuer in the U.S. for purposes of the Exchange Act. Although as a foreign private issuer we are no longer required to do so, we currently continue to file annual reports on Form 10-K, quarterly reports on Form 10-Q, and current reports on Form 8-K with the Securities and Exchange Commission (“SEC”) instead of filing the reporting forms available to foreign private issuers. We make available, through our internet website for investors (www.timhortons-invest.com), our annual reports on Form 10-K, quarterly reports on Form 10-Q, current reports on Form 8-K and amendments to those reports filed or furnished pursuant to Section 13(a) or 15(d) of the Exchange Act, as soon as reasonably practicable after electronically filing such material with the SEC and with Canadian securities regulators. The foregoing reference to our website address does not constitute incorporation by reference of the information contained on the website, and such information should not be considered part of this document.
| Item 1A. | Risk Factors |
Certain information contained in this Annual Report on Form 10-K (the “Report”), including information regarding future financial performance and plans, expectations, and objectives of management, constitute
23
Table of Contents
forward-looking information within the meaning of Canadian securities laws and forward-looking statements within the meaning of the Private Securities Litigation Reform Act of 1995. We refer to all of these as forward-looking statements. A forward-looking statement is not a guarantee of the occurrence of future events or circumstances, and such future events or circumstances may not occur. Forward-looking statements can be identified by the fact that they do not relate strictly to historical or current facts. They often include words such as “believes,” “expects,” “anticipates,” “estimates,” “intends,” “plans,” “seeks,” “outlook,” “forecast” or words of similar meaning, or future or conditional verbs, such as “will,” “should,” “could” or “may.” Examples of forward-looking statements that may be contained in our public disclosure from time to time include, but are not limited to, statements concerning management’s expectations relating to possible or assumed future results, our strategic goals and our priorities, and the economic and business outlook for us, for each of our business segments, and for the economy generally. The forward-looking statements contained in this Report are based on currently available information and are subject to various risks and uncertainties, including, but not limited to, the risks and uncertainties discussed below, that could materially and adversely impact our business, financial condition and results of operations (i.e., the “risk factors”). Additional risks and uncertainties not currently known to us or that we currently believe to be immaterial may also materially adversely affect our business, financial condition, and/or operating results. Forward-looking information and statements are based on a number of assumptions which may prove to be incorrect, including, but not limited to, assumptions about: the absence of a material increase in competition within the quick service restaurant segment of the food service industry; the absence of an adverse event or condition that damages our strong brand position and reputation; continuing positive working relationships with the majority of the Company’s restaurant owners; there being no significant change in the Company’s ability to comply with current or future regulatory requirements; the absence of any material adverse effects arising as a result of litigation; and general worldwide economic conditions. We are presenting this information for the purpose of informing you of management’s current expectations regarding these matters, and this information may not be appropriate for other purposes.
Many of the factors that could determine our future performance are beyond our ability to control or predict. Investors should carefully consider our risk factors and the other information set forth in this Report and are further cautioned not to place undue reliance on the forward-looking statements contained in this Report, which speak only as of the date of this Report. The events and uncertainties outlined in the risk factors, as well as other events and uncertainties not set forth below, could cause our actual results to differ materially from the expectation(s) included in the forward-looking statement, and if significant, could materially affect the Company’s business, sales revenue, stock price, financial condition, and/or future results, including, but not limited to, causing the Company to (i) close restaurants, (ii) fail to realize our same-store sales, which are critical to achieving our operating income and other financial targets, (iii) fail to meet the expectations of our securities analysts or investors, or otherwise fail to perform as expected, (iv) have insufficient cash to engage in or fund expansion activities, dividends, or share repurchase programs, or (v) increase costs, corporately or at restaurant level, which may result in increased restaurant-level pricing, which, in turn, may result in decreased customer demand for our products resulting in lower sales, revenue, and earnings. We assume no obligation to update or alter any forward-looking statements after they are made, whether as a result of new information, future events, or otherwise, except as required by applicable law.
Throughout these risk factors, the words “include,” “including” or words of similar effect mean “include, without limitation” or “including, without limitation,” as applicable.
Our growth strategy and other important strategic initiatives may not be successful and may expose us to additional risk.
Our growth strategy to a large extent depends on our ability to increase the number of Tim Hortons restaurants through internal growth and potentially through strategic initiatives (such as acquisitions, joint ventures, and alternative business models, such as self-serve kiosks and co-branding) and increased emphasis (especially outside Canada) on non-standard restaurant development and other initiatives. However, we may not be able to achieve our growth objectives, new restaurants may not be profitable, and strategic initiatives may not be successful and may expose us to various risks.
24
Table of Contents
The addition of a number of new restaurants in a market may negatively impact the same-store sales growth and profitability of restaurants already existing in the market. If our new restaurants are not profitable or if new restaurants negatively affect the profitability of existing restaurants, we may be limited or unable to carry out our business model of franchising the new or existing restaurants, or we may be delayed in doing so, as we could have difficulty finding qualified restaurant owners willing to participate in our expansion or we may desire that the restaurant reach minimum profitability levels before franchising the restaurant. This could limit our ability to expand or make it harder for us to find qualified restaurant owners, either of which would likely hurt revenue growth and operating results. We may also need to provide relief and support programs for our restaurant owners in developing markets as well as expand our financing support programs or extend financing on more generous terms than would be available from third parties, either of which could increase our costs and thus decrease net income. Alternatively, if we have interested restaurant owners, we may offer the restaurant to a restaurant owner on an operator or other agreement, which may also result in an increase in restaurant owner relief and support costs. Initially, after conversion, we generally provided additional relief to the operator, and we have been required to consolidate some of these restaurants in accordance with variable interest entity accounting rules for consolidations.
We may also enter markets where our brand is not well known and where we have little or no operating experience, although we will do this to a lesser extent in 2011. New markets may have different competitive conditions, consumer tastes and discretionary spending patterns than our existing markets; as a result, new restaurants in those markets may be less successful than restaurants in existing markets. When we enter new regions and markets, we will need to build brand awareness in those markets through advertising and promotional activity, and those activities may not promote our brand as effectively as intended, if at all. For example, our advertising expenditures in the U.S., particularly with respect to television advertising, do not yield the desired leverage across all marketing areas because our regional markets do not overlap to a significant degree, and we have not achieved significant market penetration in all regions.
Restaurants opened in new markets may also have lower average restaurant sales than restaurants opened in existing markets, and may have higher construction, occupancy, and operating costs than restaurants in existing markets. Sales at restaurants opened in new markets may take longer to reach expected sales and profit levels, and may never do so, thereby affecting our overall financial condition. Our failure to successfully implement growth and various other business strategies and initiatives related to international development may have a negative impact on the overall operation of our business and may result in increased costs or inefficiencies that we cannot currently anticipate.
From time to time, we may rationalize and close underperforming restaurants in order to improve overall profitability. Such closures, however, may be accompanied by impairment charges and/or valuation allowances that may have a negative impact on our earnings. We may also deliberately slow the development of new restaurants in some markets, depending on various factors, including the sales growth of existing restaurants in such markets. Same-store sales growth is a milestone we monitor, and, among other things, if sales growth falls below our expectations for a prolonged period of time, if we have significant negative cash flows in a market for several years, or if we close restaurants out of the ordinary course, we may be forced to impair assets in affected markets, which could have a negative effect on our earnings.
The success of any restaurant depends in substantial part on its location. There can be no assurance that current locations will continue to be attractive as demographic patterns change. Neighbourhood or economic conditions where restaurants are located could decline in the future, thus resulting in potentially reduced sales in those locations. If we cannot obtain desirable locations for our restaurants at reasonable prices, our ability to execute our growth strategy will be adversely affected.
We also intend to continue to evaluate potential mergers, acquisitions, joint venture investments, alliances, vertical integration opportunities and divestitures, which are subject to many of the same risks that also affect new restaurant development. In addition, these transactions involve various other financial and tax, managerial
25
Table of Contents
and operational risks, including accurately assessing the value, future growth potential, strengths, weaknesses, contingent and other liabilities and potential profitability of acquisition candidates; the potential loss of key personnel of an acquired business; the Company’s ability to achieve projected economic and operating synergies; difficulties successfully integrating, operating, maintaining and managing newly acquired operations or employees; difficulties maintaining uniform standards, controls, procedures and policies; the possibility the Company could incur impairment charges if an acquired business performs below expectations; unanticipated changes in business and economic conditions affecting acquired business; ramp-up costs, whether anticipated or not; the potential for the unauthorized use of the Company’s trademarks and brand name by third parties; the possibility of a breach of contract or spoliation of the business relationship with a third party; the potential negative effects such transactions may have on the Company’s relationship with restaurant owners and existing business relationships with suppliers; the potential exposure to restaurant owners and others arising from the Company’s reliance on and dissemination of information provided by third parties; and diversion of management’s and restaurant owners’ attention from the demands of the existing business. In addition, there can be no assurance that the Company will be able to complete the desirable transactions, for reasons including restrictive covenants in debt instruments or other agreements with third parties, or a failure to secure financing if there was a tight credit market.
Strategic alliances have been and will continue to be an integral part of our strategic plan to “grow in ways we have not grown before.” There can be no assurance that: significant value will be recognized through such strategic alliances; we will be able to maintain our existing strategic alliances; or, we will be able to enter into new strategic relationships in the future. While we believe we could ultimately take action to terminate any alliances that prove to be unsuccessful, we may not be able to identify problems and take action quickly enough and, as a result, our brand image and reputation may suffer, or we may suffer increased liabilities, costs and other financial burdens. Entry into and the subsequent unwinding of strategic alliances may expose us to additional risks which may adversely affect our brand and business and decrease our revenue and growth prospects.
We developed and began implementing various strategic plans and initiatives commencing in 2010. Our financial outlook and long-range aspirational EPS targets through the end of 2013, as previously announced, are based on the successful implementation, execution, and customer acceptance of such plans and initiatives. These strategic plans are also designed to improve our results of operations and drive long-term shareholder value. There can be no assurance that we will be able to implement our strategic plans and initiatives or that such plans and initiatives will yield the expected results, either of which could cause us to fall short of achievement of our financial objectives and long-range aspirational goals.
Our success depends substantially on the value of the Tim Hortons brand and our Canadian segment performance.
Our success is dependent to a large part upon our ability to maintain and enhance the value of our brand, our customers’ connection to and perception of our brand, and a positive relationship with our restaurant owners. Brand value can be severely damaged even by isolated incidents, particularly if the incidents receive considerable negative publicity or result in litigation. Some of these incidents may relate to the way we manage our relationship with our restaurant owners, our growth strategies, our relationships with third parties with whom we enter into strategic alliances, our development efforts in domestic and foreign markets, land use and site and building development for our restaurants (including equipment, environment, and health and safety issues), or the ordinary course of our or our restaurant owners’ business. Other incidents may arise from events that are or may be beyond our ability to control and may damage our brand, such as: actions taken (or not taken) by one or more restaurant owners or their employees relating to health, safety, welfare, labour matters, or otherwise; litigation and claims; security breaches or other fraudulent activities associated with our electronic payment systems; illegal activity targeted at us; and negative incidents occurring at or affecting our strategic business partners, affiliates, or corporate social responsibility programs. Our brand could also be damaged by falsified claims or the quality of products from vertically integrated manufacturing facilities and potentially negative publicity from various sources, including social media sites on a variety of topics and issues, whether true or not, which are
26
Table of Contents
beyond our control. Consumer demand for our products and our brand value could diminish significantly if any such incidents or other matters erode consumer confidence in us or our products, which would likely result in lower sales and, ultimately, lower earnings and profits.
In addition, the Tim Hortons brand is synonymous with our ability to deliver quality food products at value prices. If we are unable to maintain in Canada, or unable to maintain and/or achieve in other markets, an appropriate price to value relationship for our products in the minds of consumers, our ability, by and through our restaurant owners and independently, to increase or maintain same-store sales may be affected. Our ability to maintain or achieve the appropriate price to value relationship also may be affected by discounting or other promotional activity of competitors, which can be extremely aggressive.
Our financial performance is highly dependent on our Canadian operating segment, which accounted for approximately 83.4% of our consolidated revenues, and all our profit, in 2010. Any substantial or sustained decline in our Canadian business would materially and adversely affect our financial performance.
The quick service restaurant segment is highly competitive, and competition could lower our revenues, margins, and market share.
The quick service restaurant segment of the food service industry is intensely competitive. Tim Hortons restaurants compete with international, regional, and local organizations primarily through the quality, variety, and value perception of food products offered. Other key competitive factors include: the number and location of restaurants; quality and speed of service; attractiveness of facilities; effectiveness and magnitude of advertising, marketing, promotional, and operational programs; price; changing demographic patterns and trends; changing consumer preferences and spending patterns, including weaker consumer spending in difficult economic times, or a desire for a more diversified menu; changing health or dietary preferences; and, perceptions and new product development. Our major competitors continue to engage in discounting, free sampling and other promotional activities. In addition, some of our competitors, particularly in the U.S., have substantially greater financial and other resources than we do, including larger marketing budgets and greater leverage from marketing spend, which may provide them with a competitive advantage. Also, Tim Hortons restaurants compete within the food service industry and the quick service restaurant segment not only for customers but also for management and hourly employees, suitable real estate sites, and qualified restaurant owners. If we are unable to maintain our competitive position, we could experience lower demand for products, downward pressure on prices, reduced margins, an inability to take advantage of new business opportunities, the loss of market share, and the inability to attract qualified restaurant owners.
Increases in the cost of commodities could have an adverse impact on our business and financial results.
We are exposed to price volatility in connection with certain key commodities that we purchase in the ordinary course of business such as coffee, wheat, edible oil and sugar, which can impact revenues, costs and margins. Although we monitor our exposure to commodity prices and our forward hedging program (of varied duration, depending upon the type of underlying commodity) partially mitigates the negative impact of any costs increases, price volatility for commodities we purchase has increased due to conditions beyond our control, including recent economic conditions, currency fluctuations, availability of supply, weather conditions and consumer demand. Increases and decreases in commodity costs are largely passed through to restaurant owners, and we and our restaurant owners have some ability to increase product pricing to offset a rise in commodity prices, subject to restaurant owner and customer acceptance, respectively. Notwithstanding the foregoing, we may not be able to, or we may choose not to, as we did in 2009 with respect to certain products, pass along all price increases to our restaurant owners. As a result, commodity cost increases could have a more significant effect on our business and results of operations than if we had passed along all increases to our restaurant owners. Price fluctuations may also impact margins as many of these commodities are typically priced based on a fixed-dollar mark-up. A number of commodities have recently experienced elevated spot market prices relative to historic prices. Although we have secured commitments for most of our key commodities through year-end 2011
27
Table of Contents
in anticipation of continued high prices in 2011, these are at higher prices than our previous commitments. In addition, if further escalation in prices continues, we may be forced to purchase commodities at higher prices at the end of the respective terms of our current commitments. See Item 7A. Quantitative and Qualitative Disclosures about Market Risk—Commodity Risk.
Food safety and health concerns may have an adverse effect on our business.
Incidents or reports, whether true or not, of food-borne illness (such as e-coli, listeria, bovine spongiform encephalopathy, hepatitis A or salmonella); injuries caused by or claims of food tampering, employee hygiene and cleanliness failures or impropriety at Tim Hortons or other quick service restaurants unrelated to Tim Hortons; and, the health aspects of consuming our products, could result in negative publicity, damage our brand value, and potentially lead to product liability or other claims. Any decrease in customer traffic or temporary closure of any of our restaurants as a result of such incidents or negative publicity may have a material adverse effect on our business and results of operations.
Our distribution operations and supply chain are subject to pressures and risks, many of which are outside our control that could reduce the profitability of our operations.
Our distribution operations and supply chain may be impacted by various factors, some of which are beyond our control, that could injure our brand and negatively affect our results of operations and our ability to generate expected earnings and/or increase costs, including:
| • | transportation and/or shipping costs, including but not limited to energy and fuel costs (and/or fuel shortages) for our fleet of trucks and trailers or increased costs from third-party transportation companies that make deliveries to system restaurants from our five distribution centres; |
| • | inclement weather, which could affect the cost and timely delivery of products and supplies to us and to our restaurant owners; |
| • | increased food and other supply costs; |
| • | the risks of having a single source of supply for certain of our food products, including certain par-baked goods, iced cappuccinos, and other popular food products; |
| • | shortages or interruptions in the availability or supply of perishable food products and/or their ingredients, which could affect the availability, quality, and cost of such food products and ingredients, as well as other factors that could affect the quality of products we supply; |
| • | potential negative impacts on our relationship with our restaurant owners associated with the increase of required purchases or prices of products purchased from our distribution business; and |
| • | political, physical, environmental, labour, or technological disruptions in our own or our suppliers’ manufacturing and/or warehouse plants, facilities, or equipment. |
See additional disclosure under “Sources and Availability of Raw Materials” in Item 1 of this Report that is incorporated in this section by reference.
In the U.S., because we do not provide distribution services to our U.S. restaurant owners, our U.S. restaurant owners may not receive the same level of service and reliability as we are able to provide through our distribution business for our Canadian restaurant owners.
28
Table of Contents
Our earnings and business growth strategy depends in large part on the success of our restaurant owners; actions taken by our restaurant owners and changes in franchise laws and regulations may harm our business.
A substantial portion of our earnings come from royalties and other amounts paid by restaurant owners, who operated 99.5% of the Tim Hortons restaurants as of January 2, 2011. Our restaurant owners are independent contractors and, as a result, the quality of their operations may be diminished by factors beyond our control. Some restaurant owners may not successfully operate restaurants in a manner consistent with our standards and requirements and may not train qualified managers and other restaurant personnel. Any operational shortcoming of a franchise restaurant is likely to be attributed by consumers to our entire system, thus damaging our brand reputation and potentially affecting revenues and profitability. Our principal competitors that have a significantly higher percentage of company-operated restaurants than we do may have greater control over their respective restaurant systems and have greater flexibility to implement operational initiatives and business strategies. Our success will also continue to depend on our ability to attract and retain qualified restaurant owners.
Since we receive revenues in the form of rents, royalties, and franchise fees from our restaurant owners, our revenues and profits would decline and our brand reputation could also be harmed if a significant number of restaurant owners were to: experience operational failures, including health and safety exposures; experience financial difficulty; be unwilling or unable to pay us for food and supplies or for royalties, rent or other fees; fail to enter into renewals of franchise or license agreements; or experience any labour shortages or significant increases in labour or other costs of running their businesses. Our advertising levies may also be at risk which could impact the magnitude and extent of our marketing initiatives. In addition, the ability of restaurant owners to finance the equipment and renovation costs or improvements and additions to existing restaurants, and our acquisition of restaurants from or sale of restaurants to restaurant owners, are affected by economic conditions, including interest rates and the cost and availability of borrowed funds. A weakening in restaurant owner financial stability would have a negative impact on our business and may cause us to finance such purchases for our restaurant owners or, if we elect not to do so or we are unable to do so, our ability to grow our business may be adversely impacted.
Although we generally enjoy a positive working relationship with the vast majority of our restaurant owners, active and/or potential disputes with restaurant owners could damage our brand reputation and/or our relationships with the broader restaurant owner group. See also, risk factor “Our business activities subject us to litigation risk that could affect us adversely by subjecting us to significant money damages and other remedies or by increasing our litigation expense” below.
Our business activities subject us to litigation risk that could affect us adversely by subjecting us to significant monetary damages and other remedies or by increasing our litigation expense.
From time to time, we are subject to claims incidental to our business, such as illness or injury relating to food quality or food handling. In addition, class action lawsuits have been filed in the past, and may continue to be filed, against quick service restaurants alleging, among other things, that quick service restaurants have failed to disclose the health risks associated with their products or that certain food products contribute to obesity. These types of claims could harm our brand reputation, making it more difficult to attract and retain qualified restaurant owners and grow the business. We may also be subject to claims from employees, customers, and others relating to health and safety risks and conditions of our restaurants associated with design, construction, site location and development, indoor or airborne contaminants and/or certain equipment utilized in operations. In addition, from time to time, we face claims from: our employees relating to employment or labour matters, including potentially class action suits, regarding wages, discrimination, unfair or unequal treatment, harassment, wrongful termination, or overtime compensation; our restaurant owners and/or operators regarding their profitability (which is a present claim against us), wrongful termination of their franchise or operating (license) agreement, as the case may be, or other restaurant owner relationship matters; taxation authorities regarding certain tax disputes; or, other stakeholders or business partners. We are also exposed to a wide variety of falsified claims due to our size and brand recognition. All of these types of matters have the potential to unduly distract
29
Table of Contents
management attention and increase costs, including costs associated with defending such claims. Any negative publicity resulting from these claims may adversely affect our reputation. Our current exposure with respect to legal matters pending against us could change if determinations by judges and other finders of fact are not in accordance with management’s evaluation of the claims. Should management’s evaluation prove incorrect, our exposure could exceed expectations and have a material adverse effect on our financial condition and results of operations. If successful, any such claims could adversely affect our business, financial condition, and financial results. With respect to restaurant owner litigation, see Item 3. Legal Proceedings of this Annual Report.
Our business is subject to various laws and regulations and changes in such laws and regulations and/or failure to comply with existing or future laws and regulations, or our planning initiatives related to such laws and regulations, could adversely affect us and our shareholders and expose us to litigation, damage our brand reputation or lower profits.
We and our restaurant owners are subject to various international, federal, state, provincial and local laws, treaties and regulations affecting our and their businesses. These laws and regulations include those regarding or relating to: zoning, land use (including the development and/or operation of drive-thru windows), and traffic; health, food, sanitation and safety; privacy; immigration and labour laws, including significant increases in minimum wage requirements that were implemented in certain provinces in Canada in 2010 and others that are planned for certain other provinces in 2011, that will substantially increase our and our restaurant owners’ labour costs in those provinces; laws preventing discrimination and harassment in the workplace and providing certain civil rights to individuals with disabilities, laws affecting the design of facilities (such as the Americans with Disabilities Act of 1990 and similar Canadian legislation); tax laws affecting our restaurant owners’ business; environmental matters; product safety; nutritional disclosure and regulations regarding the nutritional content, including menu labeling; advertising and marketing; record keeping and document retention procedures; and new and/or additional franchise legislation. We are also subject to applicable accounting and reporting requirements and regulations, including those imposed by Canadian and U.S. securities regulatory authorities, the NYSE and the TSX. The complexity of the regulatory environment in which we operate and the related cost of compliance are both increasing due to additional legal and regulatory requirements.
With respect to environmental laws and regulations, our operations are governed and impacted by laws, regulations or limitations regarding our management, handling and/or disposal of water resources, air resources, toxic substances, solid waste and other environmental matters, including:
| • | regulations regarding drive-thrus, including banning or imposing idling restrictions in drive-thrus, which limit our ability to develop restaurants with drive-thrus in certain locations; local building codes, which may require more expensive building materials or restaurant types as well as programs requiring greater use of recyclable materials that can be processed by the waste management industry and/or required contributions to residential blue box programs in Ontario and other provinces in Canada, or similar programs in the U.S. that result in increased costs because certain municipalities do not accept our recyclable packaging; and |
| • | regulations relating to the discharge, storage, handling, release and/or disposal of hazardous or toxic substances, particularly with respect to: certain of our operations (e.g., distribution and manufacturing); restaurant locations that were formerly gas stations or that are adjacent to gas stations; and, septic systems with insufficient capacity. |
In addition, third parties may make claims against owners or operators of properties for personal injuries or property damage associated with releases of hazardous or toxic substances. See additional disclosure under “Environmental Matters” in Item 1 of this Report that is incorporated into this section by reference.
As “sustainability” issues become more prevalent and accepted, there may be increased governmental, shareholder, and other stakeholder awareness and sentiment for more regulation as well as voluntarily adopted programs relating to reduction and mitigation of environmental impacts. There is a possibility that, when and if enacted, the final form of such legislation or any voluntary actions taken by us in this regard would impose
30
Table of Contents
stricter requirements or alternative modes of conducting business, which could lead to the need for significant capital expenditures in order to meet those requirements and/or higher ongoing compliance and operating costs. Our participation in or implementation of, or our decision not to participate in or implement, certain types of programs also may have an adverse impact on our brand due to potentially negative publicity or negative perception of stakeholders regarding our business practices and lack of willingness to demonstrate environmental leadership. Such injury to our brand and reputation may, in turn, also reduce revenues and profits. See also our disclosure under “Sustainability and Responsibility” in Item 1 of this Report regarding our planned activities with respect to sustainability and corporate responsibility initiatives.
We are reviewing a comprehensive U.S. health care reform law regarding government-mandated health benefits that was enacted in 2010 as well as the new U.S. food safety modernization law that was enacted in January 2011. We cannot currently determine with certainty the financial and operational impact that the new laws will have on us, our restaurant owners and/or our third-party suppliers and distributors.
Existing, new, or future changes in tax laws, regulations, and treaties, or the interpretation or enforcement thereof, may adversely impact: our anticipated effective tax rate, tax liabilities and/or reserves; the benefits that we expected to achieve from certain of our completed or planned public or internal corporate reorganizations; ongoing tax disputes, realization of our tax assets; disclosure of tax-related matters; and/or the expansion of our business into new territories through our strategic initiatives, joint ventures, or other types of programs, projects or activities. In addition, incremental sales taxes at the federal, provincial, state or local level on products sold by our restaurants resulting from, without limitation, increased sales tax rates, changes to the taxability of our products sold at retail, changes to tax rules applicable to our restaurants, introduction of new tax systems such as value-added taxes and the harmonization of federal and provincial sales tax systems in Canada, may all result in increased sales taxes collected at retail. Any of these changes, if enacted, could have a material adverse impact on us.
It is not possible for us to predict what laws or regulations will be enacted in the future, how existing or future laws and regulations will be administered or interpreted. Changes in our business operations may be negatively impacted by current laws or amended laws resulting in a material adverse impact to us. Compliance with these laws and regulations and planning initiatives undertaken in connection with such laws and regulation could increase the cost of doing business and reduce operational efficiencies and, depending upon the nature of our and our restaurant owners’ responsive actions to or planning in connection with such laws, regulations, and other matters, could damage our reputation. Increases in costs impact our profitability and the profitability of our restaurant owners. Failure to comply with such laws or regulations on a timely basis may lead to civil and criminal liability, cancellation of license, fines, and other corrective action, which could adversely affect our future financial results and have an adverse impact on our brand due to potentially negative publicity regarding our business practices and result in decreased revenues and profits. Similarly, certain international markets where we may seek to conduct our business in the future may pose legal and business challenges due to substantial uncertainty regarding laws and regulation in such jurisdictions.
See additional disclosure under “Government Regulations and Affairs” in Item 1 of this Report that is incorporated into this section by reference.
Tax regulatory authorities may disagree with our positions and conclusions regarding certain tax attributes and treatment, including relating to certain of our corporate reorganizations, resulting in unanticipated costs or non-realization of expected benefits.
A taxation authority may disagree with certain views of the Company, including, for example, the allocation of profits by tax jurisdiction, and may take the position that material income tax liabilities, interests, penalties or amounts are payable by us, in which case, we expect that we would contest such assessment. Contesting such an assessment may be lengthy and costly and if we were unsuccessful in disputing the assessment, the implications could be materially adverse to us and affect our anticipated effective tax rate or operating income, where applicable.
31
Table of Contents
Based on the provisions of the Income Tax Act (Canada), the U.S. Internal Revenue Code of 1986, as amended, and the regulations promulgated thereunder at the time of completing certain of our public or internal company corporate reorganizations (the “Reorganizations”), we anticipated that the Reorganizations would not result in any ongoing material Canadian and/or U.S. federal income tax liabilities to us. However, there can be no assurance that Canada Revenue Agency (the “CRA”) and/or the U.S. Internal Revenue Service (the “IRS”) will agree with our interpretation of the tax aspects of the Reorganizations or any related matters associated therewith. The CRA or the IRS may disagree with our view and take the position that material Canadian or U.S. federal income tax liabilities, interest and penalties, respectively, are payable as a result of the Reorganizations. If we are unsuccessful in disputing the CRA’s or the IRS’ assertions, we may not be in a position to take advantage of the effective tax rates and the level of benefits that we anticipated to achieve as a result of the Reorganizations and the implications could be materially adverse to us. Even if we are successful in maintaining our positions, we may incur significant expense in contesting positions asserted or claims made by tax authorities. Similarly, other costs or difficulties related to the Reorganizations and related transactions, which could be greater than expected, could also affect our projected results, future operations, and financial condition.
We are party to a tax sharing agreement with Wendy’s, which sets forth the principles and responsibilities of Wendy’s and the Company regarding the allocation of taxes, audits and other tax matters relating to periods when we were part of the same U.S. federal consolidated or state and local combined tax filing group. Either we or Wendy’s may be required to reimburse the other party for the use of tax attributes while we filed U.S. consolidated or state and local combined returns, as a result of audits or similar proceedings giving rise to “adjustments” to previously filed returns, in accordance with the terms of the agreement. As several years remain open to review and adjustment by taxation authorities, payments may be made by one party to the other for the use of the other party’s tax attributes.
Our new international operations will be subject to various factors of uncertainty and there is no assurance that international operations will be profitable.
We have entered into a master license agreement with a licensee for the development of Tim Hortons restaurants in the Gulf Cooperation Council. The licensee is committed to open and operate approximately five restaurant locations in 2011. The implementation of our international strategic plan may require considerable or dedicated management time as well as start-up expenses for market development before any significant revenues and earnings are generated. Expansion into new international markets carries risks similar to those risks described above relative to expansion into new markets in the U.S.; however, some or all of these factors, including food safety, brand protection and intellectual property protection, may be more pronounced in markets outside Canada and the U.S. due to cultural, political, legal, economic, regulatory and other conditions and differences. As such, our international business operations will be subject to additional legal, accounting, tax and regulatory risks associated with doing business internationally, including: tariffs, quotas, other trade protection measures; import or export regulations and licensing requirements; foreign exchange controls; restrictions on our ability to own or operate or repatriate profits from our subsidiaries, make investments or acquire new businesses in foreign jurisdictions; difficulties in enforcement of contractual obligations governed by non-Canadian or U.S. law due to differing interpretation of rights and obligations in connection with international franchise or licensing agreements and collection of royalties from international restaurant owners; compliance with multiple and potentially conflicting laws; new and potentially untested laws and judicial systems; and reduced or diminished protection of intellectual property. For example, we currently plan to export our proprietary products to our restaurant owners in our new international markets. Numerous government regulations apply to both the export of food products from Canada and the U.S. as well as the import of food products into other countries. If one or more of the ingredients in our products are banned, alternative ingredients would need to be identified and sourced. Although we intend to be proactive in addressing any product ingredient issues, such requirements may delay our ability to open restaurants in other countries in accordance with our planned or desired schedule.
32
Table of Contents
Any operational shortcoming of a licensee is likely to be attributed by consumers to our entire system, thus damaging our brand reputation and potentially affecting revenues and profitability. Additionally, we may also have difficulty finding suppliers and distributors to provide us with adequate and stable supplies of ingredients meeting our standards in a cost-effective manner. Although we believe we have developed the support structure required for international growth, there can be no assurance that our international operations will achieve or maintain profitability or meet planned growth rates. There can be no assurance that appropriate restaurant owners and/or other licensees will be available in our new international markets. We currently expect that our international restaurant owners may be responsible for the development of a larger number of restaurants than typical for our Canadian or U.S. restaurant owners. As a result, our international operations may be more closely tied to the success of a smaller number of our restaurant owners than typical for our Canadian and U.S. operations.
Our operating results and financial condition could be adversely impacted by the current worldwide economic conditions.
Our operating results and financial condition are sensitive to and dependent upon discretionary spending by consumers, which may be affected by downward pressure in general economic conditions that could drive down demand for our products and result in fewer transactions or decrease average value per transaction at our restaurants. In addition, we have investments of cash in bank deposits and money market funds, which could experience sharp declines in returns or otherwise be at risk depending upon the extent of instability in the credit and investment markets. The current economic conditions may also have negative impacts on businesses in general, including our restaurant owners, suppliers and strategic partners. We cannot predict the timing or duration of the suppressed economic conditions or the timing or strength of a subsequent economic recovery, and many of the effects and consequences of these conditions are currently unknown; any one or all of them could have an adverse effect on our business, results of operations, financial condition, liquidity and/or capital resources.
Catastrophic events may disrupt our business.
Unforeseen events, including war, terrorism and other international, regional or local instability or conflicts (including labour issues), embargos, public health issues (including tainted food, food-borne illnesses, food tampering, or water supply or widespread/pandemic illness such as the avian or H1N1 flu), and natural disasters such as earthquakes, hurricanes, or other adverse weather and climate conditions, whether occurring in Canada, the U.S. or abroad, could disrupt our operations; disrupt the operations of our restaurant owners, suppliers, or customers; or, result in political or economic instability. These events could reduce traffic in our restaurants and demand for our products; make it difficult or impossible to adequately staff our restaurants, receive products from suppliers, deliver products to our restaurant owners on a timely basis, or perform functions at the corporate level; and, otherwise impede our ability to continue our business operations in a continuous manner consistent with the level and extent of our business activities prior to the occurrence of the unexpected event or events.
We rely extensively on computer systems to process transactions, summarize results and manage our business, and a disruption or a failure of such networks, systems or technology could harm our ability to run our business.
Network and information systems and other technology systems are integral to retail operations at system restaurants, in our distribution facilities, at our manufacturing facilities, and at our office locations. We also rely heavily on computer systems in managing financial results. These systems are subject to damage or interruption from power outages, computer and telecommunications failures, computer worms, viruses and other destructive or disruptive software, security breaches, catastrophic events and improper or personal usage by employees. Such an event could have an adverse impact on us and our customers, employees and restaurant owners, including a disruption of our operations, customer dissatisfaction or a loss of customers or revenues. Such an event also could result in expenditures necessary to repair or replace such networks or information systems or to protect them from similar events in the future.
33
Table of Contents
In connection with our integrated financial system and our electronic payment solutions, we rely extensively on third-party vendors to retain data, process transactions, and provide certain services. While we make every reasonable effort to ensure that these vendors have appropriate processes and controls in place to make certain that there is continuity of services and protection of data, we have no direct control over the same; consequently, the possibility of failure in such third-party vendors’ systems and processes exists. In such an event, we could experience business interruptions or privacy and/or security breaches surrounding our data. For additional information regarding risks surrounding privacy and/or security breaches, refer to our risk factor “Privacy protection is increasingly demanding, and the introduction of electronic payment exposes us to increased risk of privacy and/or security breaches as well as other risks.”
We continue to enhance our integrated enterprise resource planning system. The introduction of new modules for inventory replenishment, sustainability, and business reporting and analysis will be implemented over the next two years. These systems will integrate and exchange data with the financial modules already in place. There may be risks associated with adjusting to and supporting the new modules which may impact our relations with our restaurant owners, vendors and suppliers and the conduct of our business generally.
Fluctuations in U.S. and Canadian dollar exchange rates can affect commodity prices and our results generally, as well as the price of common shares and certain dividends we pay.
Our Canadian restaurants are vulnerable to increases in the value of the U.S. dollar, as certain commodities, such as coffee, are priced in U.S. dollars in international markets. We typically do not enter into purchase agreements for coffee or other commodities in excess of one year; however, we do engage in purchasing activity that mitigates, to a certain degree, our exposure to fluctuations in commodity costs, and we do hedge certain exposures to foreign exchange risk.
Conversely, our U.S. restaurants are impacted when the value of the U.S. dollar falls relative to the Canadian dollar. Although we have been shifting sourcing for U.S. restaurants for some of our products and supplies to the U.S., our U.S. restaurants are required to purchase many goods from Canadian suppliers through our third-party distributors. The costs of these goods in U.S. dollars rise when the Canadian dollar increases in value relative to the U.S. dollar. Increases in these costs would affect the profitability of our U.S. restaurants and potentially make it harder for us to expand in the U.S. In addition, relief and support costs for U.S. restaurant owners would likely increase, adversely affecting our earnings.
In addition, the majority of our operations, restaurants, income, revenues, expenses and cash flows are in Canadian dollars and we report our results in Canadian dollars. When the U.S. dollar falls in value relative to the Canadian dollar, any profits reported by the Company’s U.S. business segment contribute less to (or, for losses, do not impact as significantly) our consolidated Canadian dollar earnings because of the weaker U.S. dollar. Conversely, when the U.S. dollar increases in value relative to the Canadian dollar, any profits reported by the Company’s U.S. business segment contribute more to (or, for losses, impact more significantly) our consolidated Canadian dollar earnings because of the stronger U.S. dollar.
Royalties paid to us by our international restaurant owners will be based on a conversion of local currencies to U.S. dollars using the prevailing exchange rate, and changes in the exchange rate could adversely affect our revenues. To the extent that the portion of any revenues generated from international operations increases in the future, our exposure to change in currency fluctuations will increase.
Canadian dollars drive our earnings per share; accordingly, our earnings per share may be translated into U.S. dollars by analysts and others. Given the foregoing, the value of an investment in our common shares to a U.S. shareholder will fluctuate as the U.S. dollar rises and falls against the Canadian dollar. Our decision to declare a dividend depends on results of operations reported in Canadian dollars, and we declare dividends in Canadian dollars. As a result, U.S. and other shareholders seeking U.S. dollar total returns, including increases in the share price and dividends paid, are subject to foreign exchange risk as the U.S. dollar rises and falls against the Canadian dollar. See Item 5 of this Report for additional information regarding the conversion of dividends.
34
Table of Contents
Privacy protection is increasingly demanding, and the introduction of electronic payment exposes us to increased risk of privacy and/or security breaches as well as other risks.
The protection of customer, employee, vendor, restaurant owner and other business data is critical to us. Federal, state, provincial and international laws and regulations govern the collection, retention, sharing and security of data that we receive from and about our employees, customers, vendors, suppliers and restaurant owners. The regulatory environment surrounding information security and privacy has been increasingly demanding in recent years, and may see the imposition of new and additional requirements. Compliance with these requirements may result in cost increases due to necessary systems changes and the development of new processes to meet these requirements by us and our restaurant owners. In addition, customers and restaurant owners have a high expectation that we will adequately protect their personal information. If we or our service provider fail to comply with these laws and regulations or experience a significant breach of customer, employee, vendor, restaurant owner or other company data, our reputation could be damaged and result in an increase in service charges, suspension of service, lost sales, fines, or lawsuits.
With our use of credit payment systems, our reloadable cash card, and use of debit card systems across Canada, we are more susceptible to a risk, particularly with respect to an external security breach of customer information that we or third parties under arrangements with us control (including those with whom we have strategic alliances). We could become subject to various claims, including those arising out of thefts and fraudulent transactions in the event of a security breach, theft, leakage, accidental release or other illegal activity with respect to employee; customer; vendor; restaurant owner; third-party, including those with whom we have strategic alliances; or, other company data. This may also result in the suspension of electronic payment processing services. This could harm our reputation as well as divert management attention and expose us to potentially unreserved claims and litigation. Any loss in connection with these types of claims could be substantial. In addition, if our electronic payment systems are damaged or cease to function properly, we may have to make significant investments to fix or replace them, and we may suffer interruptions in our operations in the interim. In addition, we are reliant on these systems, not only to protect the security of the information stored, but also to appropriately track and record data. Any failures or inadequacies in these systems could expose us to significant unreserved losses, which could result in an earnings and stock price decline. Our brand reputation would likely be damaged as well.
We may not be able to adequately protect our intellectual property, which could decrease the value of our brand and branded products.
The success of our business depends on our continued ability to use our existing trademarks, service marks, and other components of our brand in order to increase brand awareness and further develop branded products in the U.S. and Canadian markets, as well as in international markets in which we may wish to expand. We may not be able to adequately protect our trademarks, and use of these trademarks may result in liability for trademark infringement, trademark dilution, or unfair competition. In addition, in certain jurisdictions outside of the U.S. and Canada, there are substantial uncertainties regarding the interpretation and application of laws and regulations relating to, and the enforceability of, intellectual property and related contract rights. Our business could be adversely affected if we are unable to adequately monitor the use of our intellectual property or enforce our intellectual property and related contract rights in courts in international jurisdictions.
Our ownership and leasing of significant amounts of real estate exposes us to possible liabilities, losses, and risks.
As of January 2, 2011, we owned or leased the land or building for approximately 79% of our 3,750 system restaurants. Accordingly, we are subject to all of the risks associated with owning and leasing real estate. In particular, the value of our assets could decrease, and/or our costs could increase, because of changes in the investment climate for real estate, demographic trends, demand for restaurant sites and other retail properties, and exposure to or liability associated with environmental contamination and reclamation, as further discussed above.
35
Table of Contents
We lease land generally for initial terms of 10 to 20 years. Most of our leases provide that the rent increases over the term of the lease and require us to pay all of the costs of insurance, taxes, maintenance, utilities, and other property-related costs. We generally cannot cancel these leases. If an existing or future restaurant is not profitable, and we decide to close it, we may nonetheless be committed to perform our obligations under the applicable lease, including, among other things, paying the base rent, taxes, and common area expenses for the balance of the lease term. Certain leases may limit our ability to terminate our use of the underlying real estate, making it more costly to close undesirable locations. In addition, as leases expire, we may fail to negotiate renewals, either on commercially acceptable terms or at all, which could cause us to close restaurants in desirable locations.
A downgrade of our credit rating could adversely affect our cost of funds, liquidity and access to capital markets.
Failure to maintain our credit rating could adversely affect our cost of funds, liquidity and access to capital markets. We received an inaugural debt rating in connection with the issuance of our senior unsecured seven year 4.20% notes in Canada on June 1, 2010. Although we have indicated our intent to target maintenance of an investment grade credit rating, ratings are evaluated and determined by independent third parties and may be impacted by events both outside of our control as well as significant decisions made by us, including major acquisitions or divestitures. Credit rating agencies perform independent analysis when assigning credit ratings and such analysis includes a number of criteria, including, but not limited to, various financial tests, business composition and market and operational risks. The credit rating agencies continually review the criteria for industry sectors and various credit ratings. Accordingly, such criteria may change from time to time. A downgrade of our credit rating may limit our access to capital markets and increase our cost of borrowing under debt facilities or future note issuances. In addition, if the rating agency were to downgrade our credit rating, the instruments governing our future indebtedness could impose additional restrictions on our ability to make capital expenditures or otherwise limit our flexibility in planning for, or reacting to changes in our business and the industry in which we operate and our ability to take advantage of potential business opportunities. These modifications could also require us to meet more stringent financial ratios and tests or could require us to grant a security interest in our assets to secure the indebtedness in the future. Our ability to comply with covenants contained in the instruments governing our existing and future indebtedness may be affected by events and circumstances beyond our control. If we breach any of these covenants, one or more events of default, including defaults between multiple components of our indebtedness, could result, and the payment of principal and interest due and payable on our outstanding senior notes may become accelerated. These events of default could permit our creditors to declare all amounts owing to be immediately due and payable, and terminate any commitments to make further extensions of credit. The lack of access to cost-effective capital resources, an increase in our financing costs, or a breach of debt instrument covenants could have an adverse effect on our business, financial condition, or future results. A downgrade in our credit rating could also affect the value and marketability of our outstanding notes.
Credit ratings are not recommendations to buy, sell or hold investments in the rated entity. Ratings are subject to revision or withdrawal at any time by the ratings agencies and there can be no assurance that we will be able to maintain our credit rating even if we meet or exceed their criteria or that other credit rating agencies will similarly assign us ratings.
Failure to retain our existing senior management team or the inability to attract and retain new qualified personnel could hurt our business and inhibit our ability to operate and grow successfully.
Our success will continue to depend to a significant extent on our executive management team and the ability of other key management personnel to replace executives who retire or resign. We may not be able to retain our executive officers and key personnel or attract additional qualified management personnel to replace executives who retire or resign. Failure to retain our leadership team and attract and retain other important personnel could lead to ineffective management and operations, which would likely decrease our profitability.
36
Table of Contents
Our articles, by-laws, shareholder rights plan and certain Canadian legislation contain provisions that may have the effect of delaying or preventing a change in control.
Certain provisions of our articles of incorporation and by-laws, together or separately, could discourage potential acquisition proposals, delay or prevent a change in control, and limit the price that certain investors might be willing to pay in the future for our common shares. Our articles of incorporation authorize our Board of Directors to issue an unlimited number of preferred shares, which are commonly referred to as “blank check” preferred shares and, therefore, our Board of Directors may designate and create the preferred shares as shares of any series and determine the respective rights and restrictions of any such series. The rights of the holders of our common shares will be subject to, and may be adversely affected by, the rights of the holders of any preferred shares that may be issued in the future. The issuance of preferred shares could delay, deter, or prevent a change in control and could adversely affect the voting power or economic value of the common shares. In addition, our by-laws contain provisions that establish certain advance notice procedures for nomination of candidates for election as directors and for shareholder proposals to be considered at shareholders’ meetings. Furthermore, under these provisions, directors may be removed by majority shareholder vote at special meetings of shareholders. For a further description of these provisions, see our articles of incorporation, by-laws, and the Canada Business Corporations Act.
Pursuant to our shareholder rights plan (the “Rights Plan”), one right to purchase a common share (a “Right”) has been issued in respect of each of the outstanding Common Shares and an additional Right will be issued in respect of each additional common share issued prior to the Separation Time (as defined below). The purpose of the Rights Plan is to provide holders of our common shares, and our Board of Directors, with the time necessary to ensure that, in the event of a take-over bid (the Canadian term for a tender offer) for our company, alternatives to the bid which may be in the best interests of our company are identified and fully explored. The Rights Plan can potentially impose a significant penalty on any person or group that acquires, or begins a tender or exchange offer that would result in such person acquiring, 20% or more of the outstanding common shares. See Exhibit 4(a) to this Report for reference to our Rights Plan, which is also described in more detail in the Notes to our Consolidated Financial Statements contained in this Report.
The Investment Canada Act requires that a “non-Canadian”, as defined therein, file an application for review with the Minister responsible for the Investment Canada Act and obtain approval of the Minister prior to acquiring control of a Canadian business, where prescribed financial thresholds are exceeded. Otherwise, there are no limitations either under the laws of Canada or in the Company’s articles on the right of a non-Canadian to hold or vote our common shares.
| Item 1B. | Unresolved Staff Comments |
None.
| Item 2. | Properties |
We have construction and site management personnel who oversee the construction of our restaurants by outside contractors. The restaurants are built to our specifications as to exterior style and interior decor. Tim Hortons restaurants operate in a variety of formats. A standard Tim Hortons restaurant is a free-standing building typically ranging in size from 1,400 to 3,090 square feet, with a dining room and drive-thru window. Each of these restaurants typically includes a kitchen capable of supplying fresh baked goods throughout the day. We also have non-standard restaurants designed to fit anywhere, consisting of small full-service restaurants and/or self-serve kiosks in offices, hospitals, colleges, airports, grocery stores, gas and convenience locations and drive-thru-only units on smaller pieces of property. These units typically average between 150 to 1,000 square feet. Some of the drive-thru-only units, kiosks, and carts also have bakery production facilities on site.
37
Table of Contents
“Combination restaurants” that include Tim Hortons and Wendy’s restaurants in single free-standing units, typically average about 5,780 square feet. For additional information regarding combination restaurants, see “Operations—Combination restaurants, an ongoing relationship with Wendy’s” in Item 1 of this Report.
As of January 2, 2011, the number of Tim Hortons restaurants, both standard and non-standard locations across Canada and the U.S., totaled 3,750, with standard restaurants comprising 71.6% of the total. For purposes of the foregoing, we have included self-serve kiosks as “non-standard locations.” At January 2, 2011, all but 20 of the Tim Hortons restaurants were franchise-operated. Of the 3,730 franchised restaurants, 751 were sites owned by the Company and leased to restaurant owners, 2,176 were leased by us, and in turn, subleased to restaurant owners, with the remainder either owned or leased directly by the restaurant owner. Our land or land and building leases are generally for terms of 10 to 20 years, and often have one or more five-year renewal options. In certain lease agreements, we have the option to purchase or right of first refusal to purchase the real estate. Certain leases require the payment of additional rent equal to a percentage (ranging from 0.75% to 13%) of annual sales in excess of specified amounts.
The following tables illustrate Tim Hortons system restaurant locations by type, and whether they are operated by the Company or our restaurant owners, as of January 2, 2011.
Company and Franchised Locations
| Canadian Locations by Province/Territory |
Standard | Non-Standard | Self-Serve Kiosks |
|||||||||||||||||||||
| Company | Franchise | Company | Franchise | Franchise | Total | |||||||||||||||||||
| Alberta |
1 | 202 | 1 | 68 | 19 | 291 | ||||||||||||||||||
| British Columbia |
— | 195 | — | 56 | 27 | 278 | ||||||||||||||||||
| Manitoba |
— | 55 | — | 24 | 1 | 80 | ||||||||||||||||||
| New Brunswick |
— | 102 | — | 14 | — | 116 | ||||||||||||||||||
| Newfoundland |
— | 45 | — | 9 | 1 | 55 | ||||||||||||||||||
| Nova Scotia |
1 | 134 | — | 30 | 3 | 168 | ||||||||||||||||||
| Northwest Territories |
— | 1 | — | — | — | 1 | ||||||||||||||||||
| Nunavut |
— | — | — | — | 3 | 3 | ||||||||||||||||||
| Ontario |
6 | 1,133 | 3 | 446 | 46 | 1,634 | ||||||||||||||||||
| Prince Edward Island |
— | 12 | — | 7 | — | 19 | ||||||||||||||||||
| Quebec |
3 | 349 | 1 | 86 | 6 | 445 | ||||||||||||||||||
| Saskatchewan |
— | 38 | — | 12 | 6 | 56 | ||||||||||||||||||
| Yukon |
— | 2 | — | — | — | 2 | ||||||||||||||||||
| Canada |
11 | 2,268 | 5 | 752 | 112 | 3,148 | ||||||||||||||||||
| % of restaurants that are standard—Canada | 72.4% | |
| % of restaurants that are standard—Systemwide | 71.6% |
38
Table of Contents
| United States Locations by State |
Standard | Non-Standard | Self-Serve Kiosks |
|||||||||||||||||||||
| Company | Franchise | Company | Franchise | Franchise | Total | |||||||||||||||||||
| Indiana |
— | 1 | — | — | — | 1 | ||||||||||||||||||
| Kentucky |
— | 2 | — | 1 | — | 3 | ||||||||||||||||||
| Maine |
3 | 25 | — | 1 | — | 29 | ||||||||||||||||||
| Michigan |
— | 132 | — | 5 | 1 | 138 | ||||||||||||||||||
| New York |
— | 122 | 1 | 59 | 106 | 288 | ||||||||||||||||||
| Ohio |
— | 104 | — | 6 | 4 | 114 | ||||||||||||||||||
| Pennsylvania |
— | 9 | — | 1 | 12 | 22 | ||||||||||||||||||
| Virginia |
— | 1 | — | — | — | 1 | ||||||||||||||||||
| West Virginia |
— | 6 | — | — | — | 6 | ||||||||||||||||||
| United States |
3 | 402 | 1 | 73 | 123 | 602 | ||||||||||||||||||
| % of restaurants that are standard—U.S. | 67.3% | |
| % of restaurants that are standard—Systemwide | 71.6% |
| International Locations by Country |
Non-Standard Arrangements | |||||||||||
| Self-Serve Kiosks |
Full-Service Locations |
Total | ||||||||||
| Republic of Ireland(1) |
191 | 3 | 194 | |||||||||
| United Kingdom (1) |
81 | — | 81 | |||||||||
| Kandahar, Afghanistan(2) |
— | 1 | 1 | |||||||||
| Total |
272 | 4 | 276 | |||||||||
| (1) | Represents self-serve kiosks and full-serve locations primarily located in gas and convenience locations, mainly under the Tim Hortons brand, but also operating under other brands owned by Tim Hortons. See “International Operations” in Item 1 above. These locations are not included in U.S. or Canadian restaurant counts, but are included, as set forth in the table above, as international licensed locations. |
| (2) | Temporary restaurant operated by the Canadian Armed Forces. |
39
Table of Contents
The following table sets forth the Company’s owned and leased office, warehouse, manufacturing and distribution facilities, including the approximate square footage of each facility. None of these owned properties, or the Company’s leasehold interest in leased property, is encumbered by a mortgage.
| Location |
Type | Owned/Leased | Approximate Square Footage |
|||||
| Rochester, New York (Maidstone coffee roasting facility) |
Manufacturing | Leased | 38,000 | |||||
| Oakville, Ontario (fondant and fills facility) |
Manufacturing | Owned | 36,650 | |||||
| Hamilton, Ontario (Canadian coffee roasting facility) |
Manufacturing | Owned | 76,000 | |||||
| Guelph, Ontario |
Distribution/Office | Owned | 155,750 | |||||
| Calgary, Alberta |
Distribution/Office | Owned | 35,500 | |||||
| Debert, Nova Scotia |
Distribution/Office | Owned | 28,000 | |||||
| Langley, British Columbia |
Distribution/Office | Owned | 27,500 | |||||
| Kingston, Ontario |
Distribution/Office | Owned | 42,750 | |||||
| Kingston, Ontario* |
Distribution/Office | Owned | 135,080 | |||||
| Oakville, Ontario |
Warehouse | Owned | 37,000 | |||||
| Oakville, Ontario |
Office | Owned | 153,060 | |||||
| Dublin, Ohio |
Office | Leased | 17,200 | |||||
| Lachine, Quebec |
Office | Owned | 5,000 | |||||
| Lachine, Quebec |
Office | Leased | 8,000 | |||||
| West Greenwich, Rhode Island |
Office | Owned | < 2,500 | |||||
| Williamsville, New York |
Office | Leased | < 2,500 | |||||
| Brighton, Michigan |
Office | Leased | < 2,500 | |||||
| * | This facility is currently under construction and expected to open in the latter half of 2011, at which time it is currently expected that the existing Kingston distribution centre/office will be closed and the land and building sold. |
| Item 3. | Legal Proceedings |
On June 12, 2008, a claim was filed against the Company and certain of its affiliates in the Ontario Superior Court of Justice (the “Court”) by two of its restaurant owners, Fairview Donut Inc. and Brule Foods Ltd., alleging, generally, that the Company’s Always Fresh baking system and expansion of lunch offerings have led to lower restaurant owner profitability. The claim, which seeks class certification on behalf of Canadian restaurant owners, asserts damages of approximately $1.95 billion. Those damages are claimed based on breach of contract, breach of the duty of good faith and fair dealing, negligent misrepresentation, unjust enrichment and price maintenance. The plaintiffs filed a motion for certification of the putative class in May of 2009 and the Company filed its responding materials as well as a motion for summary judgment in November of 2009. The two motions are now scheduled to be heard together in August 2011. The Company continues to believe the claim is without merit and will not be successful, and the Company intends to oppose the certification motion and defend the claim vigorously. However, there can be no assurance that the outcome of the claim will be favourable to the Company or that it will not have a material adverse impact on the Company’s financial position or liquidity in the event that the ultimate determinations by the Court and/or appellate court are not in accordance with the Company’s evaluation of this claim.
40
Table of Contents
From time to time, the Company is also a defendant in litigation arising in the normal course of business. Claims typically pertain to “slip and fall” accidents at franchised or Company-operated restaurants, employment claims and claims from customers alleging illness, injury or other food quality, health or operational concerns. Other claims and disputes have arisen in connection with supply contracts, the site development and construction of system restaurants and/or leasing of underlying real estate, and with respect to various restaurant owner matters, including but not limited to those described in the first paragraph above. Certain of these claims are not covered by existing insurance policies; however, many are referred to and are covered by insurance, except for deductible amounts, and to-date, these claims have not had a material effect on the Company. Reserves related to the resolution of legal proceedings are included in the Company’s Consolidated Balance Sheets as a liability under “Accounts payable.” As of the date of hereof, the Company believes that the ultimate resolution of such matters will not materially affect the Company’s financial condition or earnings. Refer also to Item 1A. Risk Factors.
| Item 4. | (Removed and Reserved) |
41
Table of Contents
PART II
| Item 5. | Market for the Registrant’s Common Equity, Related Stockholder Matters and Issuer Purchases of Equity Securities |
The Company’s common shares are traded on the Toronto Stock Exchange (“TSX”) and New York Stock Exchange (“NYSE”) (trading symbol: THI). The following tables set forth the High, Low and Close prices of the Company’s common shares on NYSE and TSX commencing with the first quarter 2009, as well as the dividends declared per share for such period.
Market Price of Common Shares on the Toronto Stock Exchange and New York Stock Exchange(1)
| Toronto Stock Exchange (Cdn.$) | New York Stock Exchange (US$) | |||||||||||||||||||||||
| 2009 Fiscal Year |
High | Low | Close | High | Low | Close | ||||||||||||||||||
| First Quarter (Ended March 29) |
$ | 35.23 | $ | 28.01 | $ | 31.73 | $ | 29.15 | $ | 22.20 | $ | 25.70 | ||||||||||||
| Second Quarter (Ended June 28) |
$ | 33.36 | $ | 28.00 | $ | 28.66 | $ | 27.44 | $ | 23.84 | $ | 24.84 | ||||||||||||
| Third Quarter (Ended September 27) |
$ | 33.00 | $ | 28.28 | $ | 30.60 | $ | 30.18 | $ | 24.27 | $ | 27.99 | ||||||||||||
| Fourth Quarter (Ended January 3, 2010) |
$ | 32.30 | $ | 29.59 | $ | 32.13 | $ | 30.75 | $ | 27.55 | $ | 30.51 | ||||||||||||
| Toronto Stock Exchange (Cdn.$) | New York Stock Exchange (US$) | |||||||||||||||||||||||
| 2010 Fiscal Year |
High | Low | Close | High | Low | Close | ||||||||||||||||||
| First Quarter (Ended April 4) |
$ | 34.68 | $ | 30.26 | $ | 33.39 | $ | 34.00 | $ | 28.33 | $ | 33.10 | ||||||||||||
| Second Quarter (Ended July 4) |
$ | 35.76 | $ | 32.30 | $ | 34.04 | $ | 35.17 | $ | 29.92 | $ | 31.94 | ||||||||||||
| Third Quarter (Ended October 3) |
$ | 38.82 | $ | 33.45 | $ | 37.36 | $ | 37.67 | $ | 31.68 | $ | 36.69 | ||||||||||||
| Fourth Quarter (Ended January 2, 2011) |
$ | 42.26 | $ | 36.98 | $ | 41.10 | $ | 41.83 | $ | 36.26 | $ | 41.23 | ||||||||||||
| (1) | Source: Thomson Reuters |
As of February 22, 2011, there were 167,532,579 common shares outstanding, of which 278,082 are owned by The TDL RSU Plan Trust.
Dividends Declared Per Common Share (Cdn.$)
| 2009 Fiscal Year |
||||
| First Quarter (Declared February 2009) |
$ | 0.10 | ||
| Second Quarter (Declared May 2009) |
$ | 0.10 | ||
| Third Quarter (Declared August 2009) |
$ | 0.10 | ||
| Fourth Quarter (Declared October 2009) |
$ | 0.10 | ||
| 2010 Fiscal Year |
||||
| First Quarter (Declared February 2010) |
$ | 0.13 | ||
| Second Quarter (Declared May 2010) |
$ | 0.13 | ||
| Third Quarter (Declared August 2010) |
$ | 0.13 | ||
| Fourth Quarter (Declared November 2010) |
$ | 0.13 | ||
Subsequent to the public company reorganization, the Company declares and pays dividends in Canadian dollars, eliminating the foreign exchange exposure for our shareholders ultimately receiving Canadian dollars. For U.S. beneficial shareholders, however, Clearing and Depository Services Inc. (“CDS”) will convert, and for registered shareholders, we will convert, the Canadian dividend amounts into U.S. dollars based on exchange rates prevailing at the time of conversion and pay such dividends in U.S. dollars. Shareholders ultimately
42
Table of Contents
receiving U.S. dollars are exposed to foreign exchange risk from the date the dividend is declared until the date CDS or we, as applicable, convert the dividend payment to U.S. dollars.
All dividends paid by the Company after September 28, 2009, unless otherwise indicated, are designated as eligible dividends for Canadian tax purposes in accordance with subsection 89(14) of the Income Tax Act (Canada), and any applicable corresponding provincial and territorial provisions. The Income Tax Act (Canada) requires the Company to deduct and withhold tax from all dividends remitted to non-residents. According to the Canada-U.S. Income Convention (tax treaty), the Company has deducted a withholding tax of 15% on dividends paid to residents of the U.S. after September 28, 2009, except in the case of a company that owns 10% of the voting stock. In such case, if applicable in the future, the withholding tax would be 5%.
In 2010, our Board of Directors approved an increase in the quarterly dividend from $0.10 to $0.13 per common share and our dividend payout range from 20% to 25% to 30% to 35% of prior year, normalized annual net income attributable to Tim Hortons Inc., which is net income attributable to Tim Hortons Inc. adjusted for certain discrete items, such as gains on divestitures, tax impacts and asset impairments that affect our annual net income attributable to Tim Hortons Inc. In February 2011, our Board of Directors approved a 31% increase in the quarterly dividend from $0.13 per common share to $0.17 per common share for the first quarter of 2011. Notwithstanding our long-term targeted dividend payout range and the recent increase in our dividend, the declaration and payment of all future dividends remains subject to the discretion of our Board of Directors and the Company’s continued financial performance, debt covenant compliance, and other factors when considering dividend declarations.
The terms of the revolving credit facility contains limitations on the payment of dividends by the Company. The Company may not make any dividend distribution unless, at the time of, and after giving effect to the aggregate dividend payment, the Company is in compliance with the financial covenants contained in the revolving credit facility, and there is no default outstanding under the senior credit facilities. See Management’s Discussion and Analysis of Financial Condition and Results of Operations – Liquidity – Credit Facilities.
Shareholders
As of January 2, 2011, we had approximately 43,076 shareholders of record (as registered shareholders), as determined by the Company based on information supplied by Computershare Investor Services Inc. We also have approximately 135,828 beneficial holders, based on information provided by Broadridge Financial Solutions.
See Note 17 of the Consolidated Financial Statements for information on related shareholder matters.
43
Table of Contents
Securities Authorized for Issuance Under Equity Compensation Plans
The following table sets forth, as of the end of the Company’s last fiscal year, (a) the number of securities that could be issued upon exercise of outstanding options and vesting of outstanding restricted stock units and restricted stock awards under the Company’s equity compensation plans, (b) the weighted average exercise price of outstanding options under such plans, and (c) the number of securities remaining available for future issuance under such plans, excluding securities that could be issued upon exercise of outstanding options.
| EQUITY COMPENSATION PLAN INFORMATION |
||||||||||||
| Plan Category |
Number of securities to be issued upon exercise of outstanding options, warrants and rights(1) (a) |
Weighted- average exercise price of outstanding options, warrants and rights (b)(2) |
Number of securities remaining available for future issuance under equity compensation plans (excluding securities reflected in column (a)) (c) |
|||||||||
| Equity compensation plans approved by security holders |
1,379,181 | $ | 31.87 | 844,735 | ||||||||
| Equity compensation plans not approved by security holders |
N/A | N/A | N/A | |||||||||
| Total |
1,379,181 | $ | 31.87 | 844,735 | ||||||||
| (1) | The Company’s 2006 Stock Incentive Plan provides that an aggregate of 2.9 million common shares may be awarded as restricted stock, stock units, stock options, stock appreciation rights (“SARs”), performance shares, performance units, dividend equivalent rights, and/or share awards. Included in the 1,379,181 total number of securities in column (a) above are approximately 293,175 restricted stock units (“RSUs,” including RSUs issued as a result of performance-based restricted stock units or “P+RSUs”), subject to vesting requirements, and dividend equivalent rights associated with the RSUs and 1,086,006 stock options and related SARs. Of the 1,086,006 options/SARs outstanding at January 2, 2011, only 263,498 were exercisable as of that date due to vesting requirements. |
| (2) | The average exercise price in this column is based only on stock options and related SARs as RSUs (including P+RSUs) have no “exercise price” required to be paid by the recipient upon vesting and settlement. |
44
Table of Contents
Performance Graph
The following graph compares the yearly percentage change in the Company’s cumulative total shareholder return on the TSX and NYSE as measured by (i) the change in the Company’s share price from March 23, 2006 (the date we became a public company) to December 31, 2010, and (ii) the reinvestment of dividends at the closing price on the dividend payment date, against the cumulative total return of the S&P/TSX Composite Index, S&P/TSX Consumer Discretionary Index, and S&P 500. The information provided under the heading “Performance Graph” shall not be considered “filed” for purposes of Section 18 of the Exchange Act or incorporated by reference in any filing under the Securities Act or the Exchange Act.
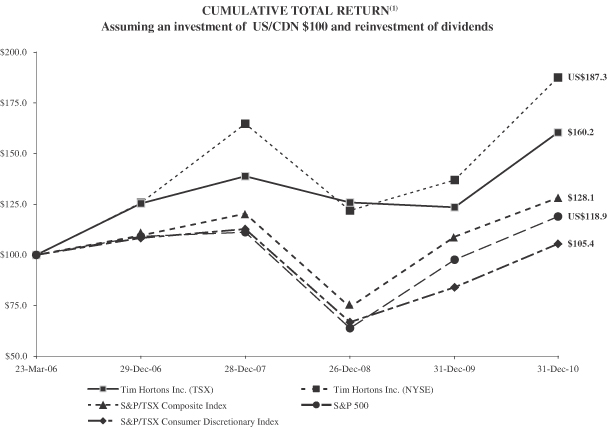
| 23-Mar-06 | 29-Dec-06 | 28-Dec-07 | 26-Dec-08 | 31-Dec-09 | 31-Dec-10 | |||||||||||||||||||
| S&P/TSX Composite Index (Cdn$)(2) |
$ | 100.0 | $ | 109.6 | $ | 120.3 | $ | 74.4 | $ | 108.9 | $ | 128.1 | ||||||||||||
| S&P/TSX Consumer Discretionary Index (Cdn$)(2) |
$ | 100.0 | $ | 108.3 | $ | 112.7 | $ | 67.0 | $ | 84.0 | $ | 105.4 | ||||||||||||
| S&P 500 (U.S.$) |
$ | 100.0 | $ | 109.0 | $ | 111.1 | $ | 63.9 | $ | 97.6 | $ | 118.9 | ||||||||||||
| Tim Hortons Inc. (TSX) |
$ | 100.0 | $ | 125.3 | $ | 138.6 | $ | 125.8 | $ | 123.4 | $ | 160.2 | ||||||||||||
| Tim Hortons Inc. (NYSE) |
$ | 100.0 | $ | 125.6 | $ | 164.5 | $ | 121.8 | $ | 136.7 | $ | 187.3 | ||||||||||||
| (1) | The majority of the Company’s operations, income, revenues, expenses, and cash flows are in Canadian dollars, and the Company is primarily managed in Canadian dollars. This drives our Canadian-dollar earnings per share that may be translated to U.S. dollars by analysts and others. Fluctuations in the foreign exchange rates between the U.S. and Canadian dollar can affect the Company’s share price. See “Risk Factors” in Part 1A. Over the course of 2007, the Canadian dollar appreciated approximately 19% relative to the U.S. dollar, which was the primary cause of the larger appreciation in the U.S. dollar share price relative to the Canadian dollar share price over 2007. However, in 2008, the Canadian dollar depreciated |
45
Table of Contents
| approximately 20% relative to the U.S. dollar and caused the opposite effect, resulting in a decline in the U.S. dollar share price as a result of the currency fluctuation that is not directly attributable to changes in the Company’s underlying business or financial condition aside from the impact of foreign exchange. Over the course of 2009, the Canadian dollar appreciated approximately 13% relative to the U.S. dollar which was the primary cause of the larger appreciation in the U.S. dollar share price relative to the decrease in the Canadian dollar share price over 2009. In 2010, the Canadian dollar continued to strengthen relative to the U.S. dollar, as it appreciated approximately 4.5%. This was the primary cause of the larger appreciation in the U.S. dollar share price relative to the increase in the Canadian dollar share price over 2010. |
| (2) | Since September 29, 2006, the Company has been included in the S&P/TSX Composite Index and the S&P/TSX Consumer Discretionary Index. |
Sales and Repurchases of Equity Securities
The following table presents the Company’s repurchases of its common shares for each of the three periods included in the fourth quarter ended January 2, 2011:
ISSUER PURCHASES OF EQUITY SECURITIES
| Period |
(a) Total Number of Shares Purchased(1) |
(b) Average Price Paid Per Share (Cdn.)(2) |
(c) Total Number of Shares Purchased as Part of Publicly Announced Plans or Programs |
(d) Maximum Approximate Dollar Value of Shares that May Yet be Purchased Under the Plans or Programs (Cdn.)(3)(4) |
||||||||||||
| Period #10 (October 4, 2010—November 7, 2010) |
380,649 | $ | 37.85 | 380,649 | $ | 86,235,597 | ||||||||||
| Period #11 (November 8, 2010— December 5, 2010) |
1,395,311 | (5) | $ | 40.59 | 1,385,856 | $ | 230,000,459 | |||||||||
| Period #12 (December 6, 2010— January 2, 2011) |
871,469 | $ | 41.20 | 871,469 | $ | 194,107,436 | ||||||||||
| Total |
2,647,429 | $ | 40.39 | 2,637,974 | $ | 194,107,436 | ||||||||||
| (1) | Based on settlement date. |
| (2) | Inclusive of commissions paid to the broker to repurchase the shares. |
| (3) | Exclusive of commissions paid to the broker to repurchase the shares. |
| (4) | On March 1, 2010, the Company announced that it had obtained regulatory approval from the TSX under TSX normal course issuer bid rules to commence a 2010 share repurchase program (“2010 program”) for up to $200 million in common shares, not to exceed the regulatory maximum of 8,817,291 common shares, equivalent to 5% of the outstanding common shares as of February 19, 2010. On November 10, 2010, the Company announced that it had obtained regulatory approval from the TSX to amend the 2010 program, to increase the maximum number of shares that may be purchased effective November 16, 2010, to a total of $400 million (from the $200 million original amount approved), subject to the limitation that the Company could not repurchase more than the regulatory maximum of 17,531,446 of its common shares (representing 10% of the Company’s “public float” as of February 19, 2010, as defined under TSX rules). Under the amended program, as of January 2, 2011, the Company had spent $205.9 million. Purchases of common shares have been made through a combination of automatic trading plan purchases, and at management’s discretion in compliance with regulatory requirements, given prevailing market, cost, and other considerations. Repurchases have been made by the Company on the TSX and NYSE. Shares repurchased pursuant to the 2010 program have been cancelled. The 2010 program commenced March 3, 2010 and will end on March 2, 2011. The first purchases were made under the 2010 program on March 9, 2010. |
| (5) | In November 2010, the Company purchased 9,455 common shares in the open market to settle restricted stock unit awards of certain of the Company’s employees who did not have shares delivered to them for settlement from The TDL RSU Plan Trust. |
46
Table of Contents
| Item 6. | Selected Financial Data |
The following table presents our selected historical consolidated financial and other data and should be read in conjunction with “Management’s Discussion and Analysis of Financial Condition and Results of Operations” and our historical Consolidated Financial Statements and notes thereto included elsewhere in this Annual Report on Form 10-K. Effective January 4, 2010, we adopted a new accounting standard relating to variable interest entities and retroactively applied this standard to comparative periods presented in our selected historical consolidated financial data, “Management’s Discussion and Analysis of Financial Condition and Results of Operations” and our Consolidated Financial Statements. See Note 20 to the Consolidated Financial Statements for additional information regarding the impact of the adoption of this accounting standard. Our historical consolidated financial information may not be indicative of our future performance and, because we were a subsidiary of Wendy’s until September 2006, does not necessarily reflect what our financial position and results of operations would have been had we operated as a separate, standalone entity during fiscal year 2006.
| Fiscal Years(1)(2) | ||||||||||||||||||||
| 2010 | 2009 | 2008 | 2007 | 2006 | ||||||||||||||||
| (in thousands, except share and per share data, number of restaurants, and otherwise where noted) |
||||||||||||||||||||
| Consolidated Statements of Operations Data |
||||||||||||||||||||
| Revenues |
||||||||||||||||||||
| Sales |
$ | 1,755,244 | $ | 1,704,065 | $ | 1,541,882 | $ | 1,404,986 | $ | 1,249,076 | ||||||||||
| Franchise revenues: |
||||||||||||||||||||
| Rents and royalties(3) |
687,039 | 644,755 | 593,483 | 546,925 | 499,324 | |||||||||||||||
| Franchise fees |
94,212 | 90,033 | 93,808 | 93,835 | 83,769 | |||||||||||||||
| 781,251 | 734,788 | 687,291 | 640,760 | 583,093 | ||||||||||||||||
| Total revenues |
2,536,495 | 2,438,853 | 2,229,173 | 2,045,746 | 1,832,169 | |||||||||||||||
| Asset impairment and related closure costs |
28,298 | — | 21,266 | — | — | |||||||||||||||
| Other costs and expenses |
1,997,034 | 1,913,251 | 1,729,460 | 1,586,010 | 1,417,648 | |||||||||||||||
| Total costs and expenses |
2,025,332 | 1,913,251 | 1,750,726 | 1,586,010 | 1,417,648 | |||||||||||||||
| Gain on sale of interest in Maidstone Bakeries(4) |
(361,075 | ) | — | — | — | — | ||||||||||||||
| Operating income |
872,238 | 525,602 | 478,447 | 459,736 | 414,521 | |||||||||||||||
| Interest expense, net |
24,180 | 19,184 | 19,632 | 14,923 | 16,918 | |||||||||||||||
| Income before income taxes |
848,058 | 506,418 | 458,815 | 444,813 | 397,603 | |||||||||||||||
| Income taxes |
200,940 | 186,606 | 150,309 | 147,226 | 112,365 | |||||||||||||||
| Net income |
$ | 647,118 | $ | 319,812 | $ | 308,506 | $ | 297,587 | $ | 285,238 | ||||||||||
| Net income attributable to noncontrolling interests |
$ | 23,159 | $ | 23,445 | $ | 23,828 | $ | 28,036 | $ | 25,642 | ||||||||||
| Net income attributable to Tim Hortons Inc. |
$ | 623,959 | $ | 296,367 | $ | 284,678 | $ | 269,551 | $ | 259,596 | ||||||||||
| Fully diluted earnings per common share |
$ | 3.58 | $ | 1.64 | $ | 1.55 | $ | 1.43 | $ | 1.40 | ||||||||||
| Weighted average number of common shares outstanding – diluted (thousands) |
174,215 | 180,609 | 183,492 | 188,759 | 185,401 | |||||||||||||||
| Dividends per common share (post initial public offering) |
$ | 0.52 | $ | 0.40 | $ | 0.36 | $ | 0.28 | $ | 0.14 | ||||||||||
47
Table of Contents
| Fiscal Years(1)(2) | ||||||||||||||||||||
| 2010 | 2009 | 2008 | 2007 | 2006 | ||||||||||||||||
| (in thousands, except share and per share data, number of restaurants, and otherwise where noted) |
||||||||||||||||||||
| Consolidated Balance Sheets Data |
||||||||||||||||||||
| Cash and cash equivalents |
$ | 574,354 | $ | 121,653 | $ | 124,717 | $ | 186,982 | $ | 226,912 | ||||||||||
| Restricted cash and cash equivalents and Restricted investments |
$ | 105,080 | $ | 80,815 | $ | 62,329 | $ | 37,790 | $ | — | ||||||||||
| Total assets |
$ | 2,481,516 | $ | 2,094,291 | $ | 2,097,694 | $ | 1,902,200 | $ | 1,852,652 | ||||||||||
| Long-term debt(5) |
$ | 437,348 | $ | 411,694 | $ | 405,500 | $ | 401,166 | $ | 399,389 | ||||||||||
| Total liabilities(5) |
$ | 1,039,074 | $ | 838,605 | $ | 865,891 | $ | 806,764 | $ | 742,146 | ||||||||||
| Total equity(6) |
$ | 1,442,442 | $ | 1,255,686 | $ | 1,231,803 | $ | 1,095,436 | $ | 1,110,506 | ||||||||||
| Other Financial Data |
||||||||||||||||||||
| EBITDA attributable to Tim Hortons Inc.(7) | $ | 956,532 | $ | 599,939 | $ | 541,168 | $ | 516,597 | $ | 460,923 | ||||||||||
| Capital expenditures |
$ | 132,912 | $ | 160,458 | $ | 184,538 | $ | 195,094 | $ | 184,606 | ||||||||||
| Operating margin(8) (%) |
34.4 | % | 21.6 | % | 21.5 | % | 22.5 | % | 22.6 | % | ||||||||||
| EBITDA margin attributable to Tim Hortons Inc.(7) (%) |
37.7 | % | 24.6 | % | 24.3 | % | 25.3 | % | 25.2 | % | ||||||||||
| Other Operating Data |
||||||||||||||||||||
| Total systemwide sales growth(10)(11) |
6.2 | % | 7.9 | % | 8.3 | % | 10.2 | % | 12.8 | % | ||||||||||
| Systemwide restaurant unit growth(10) |
4.8 | % | 4.1 | % | 6.7 | % | 5.7 | % | 5.6 | % | ||||||||||
| Canada average same-store sales growth(10) |
4.9 | % | 2.9 | % | 4.4 | % | 6.1 | % | 7.7 | % | ||||||||||
| U.S. average same-store sales growth(10) |
3.9 | % | 3.2 | % | 0.8 | % | 4.1 | % | 8.9 | % | ||||||||||
| Total system restaurants franchised (%) |
99.5 | % | 99.5 | % | 99.0 | % | 97.8 | % | 96.9 | % | ||||||||||
| Restaurants open at end of year – Canada |
||||||||||||||||||||
| Standard |
2,279 | 2,193 | 2,116 | 2,055 | 1,983 | |||||||||||||||
| Non-standard |
757 | 724 | 702 | 664 | 622 | |||||||||||||||
| Self-serve kiosk |
112 | 98 | 99 | 104 | 106 | |||||||||||||||
| Restaurants open at end of year – U.S. |
||||||||||||||||||||
| Standard |
405 | 422 | 398 | 361 | 318 | |||||||||||||||
| Non-standard |
74 | 54 | 34 | 22 | 18 | |||||||||||||||
| Self-serve kiosk |
123 | 87 | 88 | 15 | — | |||||||||||||||
| Total |
3,750 | 3,578 | 3,437 | 3,221 | 3,047 | |||||||||||||||
| Average sales per standard restaurant:(9)(10) |
||||||||||||||||||||
| Canada (in thousands of Canadian dollars) |
$ | 2,070 | $ | 2,025 | $ | 1,955 | $ | 1,888 | $ | 1,793 | ||||||||||
| U.S. (in thousands of U.S. dollars) |
$ | 978 | $ | 957 | $ | 930 | $ | 956 | $ | 944 | ||||||||||
| U.S. (in thousands of Canadian dollars) |
$ | 1,012 | $ | 1,097 | $ | 977 | $ | 1,023 | $ | 1,070 | ||||||||||
| Average sales per non-standard restaurant:(10) |
||||||||||||||||||||
| Canada (in thousands of Canadian dollars) |
$ | 830 | $ | 794 | $ | 751 | $ | 707 | $ | 662 | ||||||||||
| U.S. (in thousands of U.S. dollars) |
$ | 459 | $ | 426 | $ | 457 | $ | 397 | $ | 326 | ||||||||||
| U.S. (in thousands of Canadian dollars) |
$ | 475 | $ | 488 | $ | 481 | $ | 425 | $ | 370 | ||||||||||
| (1) | Fiscal years include 52 weeks, except for fiscal 2009, which included 53 weeks. |
| (2) | Our selected historical consolidated financial data has been derived from our audited historical Consolidated Balance Sheets at January 2, 2011 and January 3, 2010, and the results of operations and cash flows for each of the years ended January 2, 2011, January 3, 2010 and December 28, 2008, and the unaudited financial statements from December 30, 2007 and December 31, 2006. |
| (3) | Rents and royalties revenues consist of (a) royalties, which typically range from 3.0% to 4.5% of gross franchise restaurant sales and (b) rents, which consist of base rent and percentage rent in Canada and percentage rent only in the U.S. Rents typically range from 8.5% to 10.0% of gross franchise restaurant sales. Franchise restaurant sales are reported to us by our franchisees. Franchise restaurant sales are not included in our Consolidated Financial Statements, other than approximately 250 to 275 restaurants whose |
48
Table of Contents
| results of operations are consolidated with ours, as described in “Management’s Discussion and Analysis of Financial Condition and Results of Operations—Financial Definitions—Sales.” However, franchise restaurant sales result in royalties and rental income, which are included in our franchise revenues, as well as distribution income. The reported franchise restaurant sales for the last five years were: |
| Fiscal Years(1)(2) | ||||||||||||||||||||
| 2010 | 2009 | 2008 | 2007 | 2006 | ||||||||||||||||
| Franchised restaurant sales: |
||||||||||||||||||||
| Canada (in thousands of Canadian dollars) |
$ | 5,181,831 | $ | 4,880,934 | $ | 4,546,027 | $ | 4,197,478 | $ | 3,821,857 | ||||||||||
| U.S. (in thousands of U.S. dollars) |
$ | 439,227 | $ | 409,882 | $ | 345,429 | $ | 301,255 | $ | 246,343 | ||||||||||
| (4) | The Company sold its 50% interest in Maidstone Bakeries for a pre-tax gain of $361.1 million on October 29, 2010. |
| (5) | Long-term debt includes long-term debt and capital leases. |
| (6) | In March 2006, we completed an initial public offering (“IPO”), selling 17.25% of our common stock for total proceeds, net of issuance costs, of $841.9 million. Prior to our IPO, we were a wholly owned subsidiary of Wendy’s International, Inc. On September 29, 2006, Wendy’s distributed its remaining interest of 82.75% of our outstanding common stock to its stockholders through a special, pro rata dividend distribution. On September 28, 2009, we reorganized as a Canadian public company; however, the reorganization did not change the total equity of the Company. |
| (7) | EBITDA attributable to THI (“EBITDA”) is defined as net income before interest, taxes, depreciation and amortization and after deducting EBITDA attributable to noncontrolling interests. EBITDA Margin represents EBITDA expressed as a percentage of Total revenues. EBITDA and EBITDA Margin are used by management as a performance measure for benchmarking against our peers and our competitors. We believe EBITDA and EBITDA Margin are useful to investors because they are frequently used by securities analysts, investors and other interested parties to evaluate companies in our industry. EBITDA and EBITDA Margin are not recognized terms under U.S. GAAP. EBITDA should not be viewed in isolation and does not purport to be an alternative to net income as an indicator of operating performance or as an alternative to cash flows from operating activities as a measure of liquidity. There are material limitations associated with making the adjustments to calculate EBITDA and using this non-GAAP financial measure as compared to the most directly comparable GAAP financial measure. For instance, EBITDA does not include: |
| • | interest expense, and because we have borrowed money to finance our operations, interest expense is a necessary element of our costs and ability to generate revenue; |
| • | depreciation and amortization expense, and because we use property and equipment, depreciation and amortization expense is a necessary element of our costs and ability to generate revenue; and |
| • | income tax expense, and because the payment of taxes is part of our operations, tax expense is a necessary element of our costs and ability to operate. |
| Additionally, EBITDA is not intended to be a measure of free cash flow for management’s discretionary use, as it does not consider certain cash requirements such as capital expenditures, contractual commitments, interest payments, tax payments and debt service requirements. Because not all companies use identical calculations, this presentation of EBITDA may not be comparable to other similarly titled measures of other companies. |
49
Table of Contents
The following table is a reconciliation of EBITDA to our net income:
| Fiscal Years(1)(2) | ||||||||||||||||||||
| 2010 | 2009 | 2008 | 2007 | 2006 | ||||||||||||||||
| (in thousands) | ||||||||||||||||||||
| Net income |
$ | 647,118 | $ | 319,812 | $ | 308,506 | $ | 297,587 | $ | 285,238 | ||||||||||
| Interest expense, net |
24,180 | 19,184 | 19,632 | 14,923 | 16,918 | |||||||||||||||
| Income tax expense |
200,940 | 186,606 | 150,309 | 147,226 | 112,365 | |||||||||||||||
| Operating income |
872,238 | 525,602 | 478,447 | 459,736 | 414,521 | |||||||||||||||
| Depreciation and amortization |
118,385 | 113,475 | 103,793 | 93,041 | 80,977 | |||||||||||||||
| EBITDA* |
990,623 | 639,077 | 582,240 | 552,777 | 495,498 | |||||||||||||||
| EBITDA attributable to noncontrolling interests |
34,091 | 39,138 | 41,072 | 36,180 | 34,575 | |||||||||||||||
| EBITDA attributable to Tim Hortons Inc. |
956,532 | 599,939 | $ | 541,168 | $ | 516,597 | $ | 460,923 | ||||||||||||
| * | EBITDA includes and has not been adjusted for the asset impairment and related closure costs of $28.3 million, $21.3 million in fiscal 2010 and 2008, respectively. It has also not been adjusted for the gain on sale from our interest in Maidstone Bakeries of $361.1 million, partially offset by the $30 million allocated to our restaurant owners, for a total net pre-tax gain of $331.1 million. |
| (8) | Operating Margin represents operating income expressed as a percentage of Total revenues. |
| (9) | Our standard restaurant typically measures between 1,400 to 3,090 square feet, with a dining room, a counter for placing orders and drive-thru service. Standard restaurants comprised 71.6% of our system as of January 3, 2011. We also have “combination restaurants” that offer Tim Hortons and Wendy’s products at one location. Our combination restaurants typically have a common area dining room and separate counters and, typically, separate franchisees operate the two different concepts. In fiscal 2010, we had approximately 123 combination restaurants in Canada and 30 in the U.S. |
| (10) | Includes both franchised and Company-operated restaurants. Franchise restaurant sales are not included in our Consolidated Financial Statements, other than approximately 250 to 275 restaurants whose results of operations are required to be consolidated with ours. However, franchise restaurant sales result in royalties and rental income, which are included in our revenues as well as distribution revenues. U.S. average sales per standard and non-standard restaurant are disclosed in both Canadian and U.S. dollars, the reporting and functional currency, respectively, of our U.S. operations. The U.S. average sales per standard and non-standard restaurant were converted into Canadian dollars for each year using the average foreign exchange rate in the applicable year. The U.S. average sales per standard and non-standard restaurant, when converted into Canadian dollars, includes the effects of exchange rate fluctuations, which decreases comparability between the years. We believe the presentation of the U.S. dollar average sales per standard and non-standard restaurant is useful to investors to show the local currency amounts for restaurants in the U.S. and provides transparency on the underlying business performance without the impact of foreign exchange. The average unit volumes for non-standard restaurants excludes volumes from self-serve kiosks. Self-serve kiosks differ in size and product offering and, as a result, contribute significantly less than standard and non-standard restaurants to both systemwide sales as well as our revenues and operating income, particularly in the U.S. Self-serve kiosks are, however, important as they drive convenience and brand-penetration, especially in the U.S. where our brand is less developed. |
| (11) | Total systemwide sales growth is determined using a constant exchange rate to exclude the effects of foreign currency translation. U.S. dollar sales are converted into Canadian dollar amounts using the average exchange rate of the base year for the period covered. Systemwide sales growth excludes sales from the Republic of Ireland, and the United Kingdom licensed locations. |
50
Table of Contents
| Item 7. | Management’s Discussion and Analysis of Financial Condition and Results of Operations |
The following discussion of the financial condition and results of operations of the Company should be read in conjunction with the 2010 Consolidated Financial Statements and accompanying Notes included elsewhere in our Annual Report on Form 10-K for the year ended January 2, 2011 (“Annual Report”). All amounts are expressed in Canadian dollars unless otherwise noted. The following discussion includes forward-looking statements that are not historical facts but reflect our current expectation regarding future results. Actual results may differ materially from the results discussed in the forward-looking statements because of a number of risks and uncertainties, including the matters discussed below. Please refer to “Risk Factors” included elsewhere in our Annual Report for a further description of risks and uncertainties affecting our business and financial results. Historical trends should not be taken as indicative of future operations and financial results.
Our financial results are driven largely by changes in systemwide sales, which include restaurant-level sales at both franchise and Company-operated restaurants. As of January 2, 2011, 3,730 or 99.5% of our restaurants were franchised, representing 99.5% in Canada and 99.3% in the United States. The amount of systemwide sales affects our franchisee royalties and rental income, as well as our distribution income. Changes in systemwide sales are driven by changes in same-store sales and changes in the number of restaurants and are ultimately driven by consumer demand. Average same-store sales growth, one of the key metrics we use to assess our performance, provides information on growth in total systemwide sales at all restaurants, which have been operating for thirteen or more months, and provides a useful comparison between periods. We believe systemwide sales and average same-store sales growth provide meaningful information to investors concerning the size of our system, the overall health and financial performance of the system, and the strength of our brand and franchisee base, which ultimately impacts our consolidated and segmented financial performance. Franchise restaurant sales generally are not included in our Consolidated Financial Statements (except for certain non-owned restaurants consolidated in accordance with applicable accounting rules; however, franchise restaurant sales result in royalties and rental income, which are included in our franchise revenues, and also generate distribution income. We adopted this standard effective January 4, 2010 and retrospectively applied the standard to all fiscal years presented herein.
We prepare our financial statements in accordance with accounting principles generally accepted in the United States (“U.S. GAAP”). However this Management’s Discussion and Analysis of Financial Condition and Results of Operations may also contain certain non-GAAP financial measures to assist readers in understanding the Company’s performance. Non-GAAP financial measures are measures that either exclude or include amounts that are not excluded or included in the most directly comparable measure calculated and presented in accordance with GAAP. Where non-GAAP financial measures are used, we have provided the most directly comparable measures calculated and presented in accordance with GAAP and a reconciliation to GAAP measures.
References herein to “Tim Hortons,” the “Company,” “we,” “our,” or “us” refer to Tim Hortons Inc., a Delaware corporation, and its subsidiaries (“THI USA”) for periods on or before September 27, 2009 and to Tim Hortons Inc., a corporation governed by the Canada Business Corporations Act and its subsidiaries for periods on or after September 28, 2009, unless specifically noted otherwise.
Executive Overview
We primarily franchise Tim Hortons restaurants in Canada and the U.S. As the franchisor, we collect royalty income from franchised restaurant sales. Our business model also includes controlling the real estate for the majority of our franchised restaurants. As of January 2, 2011, we leased or owned the real estate for approximately 79% of our system restaurants, which generates a recurring stream of rental income. Real estate that is not controlled by us is generally for non-standard restaurants, including, for example, kiosks in offices, hospitals, colleges, and airports, as well as self-serve kiosks located in gas and convenience locations and grocery stores. We distribute coffee and other beverages, non-perishable food, supplies, packaging and equipment to system restaurants in Canada through our five distribution centres, and, in some cases, through third-party
51
Table of Contents
distributors. We supply frozen and some refrigerated products as well as paper and dry goods from our Guelph facility to approximately 85% of our Ontario restaurants. We are currently constructing a replacement distribution centre in Kingston, Ontario which is expected to serve more than 650 restaurants in eastern Ontario and Quebec with dry goods, frozen and refrigerated products. We anticipate the facility to be fully operational in the second half of 2011. In the U.S., we supply similar products to system restaurants through third-party distributors. In addition to our Canadian and U.S. franchising business, we have 275 licensed locations in the Republic of Ireland and the United Kingdom, which are mainly self-serve kiosks operating primarily under the name “Tim Hortons.” In keeping with our vertical integration initiatives, we also operate two coffee roasting facilities located in Hamilton, Ontario and Rochester, New York and a fondant and fills manufacturing facility in Oakville, Ontario.
2010 Performance against Targets
The following table sets forth our 2010 actual performance as compared to our 2010 financial targets, as well as management’s views on our 2010 performance relative to such targets:
| Measure |
Target |
Actual |
Commentary | |||
| Average Same-store Sales Growth |
||||||
| • Canada • U.S. |
3% - 5% 2% - 4% |
4.9% 3.9% |
Average same-store sales growth was driven by menu innovation, promotional programs, and operational strategies, such as our hospitality program, and pricing. In addition, the core markets in our U.S. business had strong same-store sales growth in the latter half of 2010. Cold Stone Creamery continues to be a contributor to same-store sales growth, but to a lesser extent than in 2009. | |||
| Adjusted Operating Income Growth (on a 52- week basis) |
8% - 10% | 11.4% | See Selected Operating and Financial Highlights below for a breakdown of year-over-year operating income adjustments, which we believe provide a more meaningful comparison to our 2010 target as these items were not contemplated at the time the target was set. Strong same-store sales growth in both Canada and U.S. was one of the primary drivers of our higher operational performance, primarily in our rent and royalties and our distribution operations, and contributed to the Company exceeding its key growth targets for 2010. | |||
| Effective Tax Rate |
Approximately 32% | 23.7% | Our original target did not include the lower effective tax rate that resulted from the sale of our interest in Maidstone Bakeries, which positively impacted our effective tax rate by approximately 8%. Partially offsetting the decrease in our effective tax rate was the negative impact of approximately 1% resulting from the asset impairment and related restaurant closure costs in the New England region. | |||
52
Table of Contents
| Measure |
Target |
Actual |
Commentary | |||
| Restaurant Development • Canada
• U.S. |
130 – 150 restaurants
40 – 60 restaurants |
149 restaurants
96 restaurants |
Canada and U.S. new restaurant development, including self-serve kiosk locations, was within the targeted range. Included in our 2010 new restaurant development were 20 and 52 new self-serve kiosks in Canada and U.S., respectively. Also included were 27 new Cold Stone Creamery co-branded restaurants (12 in Canada, 15 in U.S.). In addition, we converted 66 and 9 existing Tim Hortons locations in Canada and the U.S., respectively, to include Cold Stone Creamery. | |||
| Capital Expenditures |
$180 - $200 million | $132.9 million | Capital expenditures were lower than the targeted range primarily due to changes in restaurant development formats and higher amount of capital leases versus purchases within our 2010 restaurant development. We entered into $29.2 million of capital lease obligations in 2010. | |||
| Earnings per share (fully diluted) | $1.95 - $2.05 | $3.58 per share | The factors noted above that impacted our 2010 operating income also impacted our diluted earnings per share (“EPS”) target, including the unanticipated gain on sale of our interest in Maidstone Bakeries, partially offset by our $30.0 million allocation to restaurant owners, which, net of tax, impacted EPS growth by approximately $1.70 per share. As planned, EPS growth also benefited from 3.5% fewer shares outstanding in 2010 versus 2009 due to our share repurchase programs. Partially offsetting these increases were asset impairment and related closure costs recognized in the latter half of the year, and other net costs which reduced EPS growth by approximately $0.16 per share. | |||
The gain on the sale of our interest in Maidstone Bakeries, our $30 million allocation to restaurant owners, which was recorded as a reduction of Sales on the Consolidated Statement of Operations, as well as the asset impairment charge and costs associated with the decision to close restaurants in the New England region, were not contemplated as part of Management’s 2010 guidance for operating income growth, effective tax rate, or EPS, as noted above and within Selected Operating and Financial Highlights.
The macro-economic climate in North America improved throughout 2010 as compared to 2009, which was characterized by persistently high unemployment levels and other pressures in the U.S. and in certain Canadian regions that have a larger manufacturing base, including Ontario. The improvement in economic conditions translated into increased systemwide sales for our business in fiscal 2010. While we are not immune from recessionary and inflationary impacts, historically, we have proven to be fairly resilient in Canada during challenging economic times, and we continue to be well-positioned, due in part, to our quality product offerings at reasonable prices.
53
Table of Contents
We opened a total of 245 restaurants (which included 72 self-serve kiosks) in fiscal 2010 compared to 176 restaurants (which included 3 self-serve kiosks) in fiscal 2009. Our restaurant development program is typically highest in the fourth quarter each year. We execute our development activities prudently and only with what we believe to be the right opportunities. In 2010, we continued with the shift we began in 2008, focusing our restaurant development towards smaller restaurants, with a higher mix of non-standard units in Canadian growth markets and core growth markets in the U.S., which are most developed, as well as strategic alliances and co-branding opportunities. We are also targeting urban and rural communities in Canada as part of our broader development strategy, including evaluating new flexible restaurant designs tailored to urban and rural markets.
Two major events that impacted our fiscal 2010 financial results were the sale of our interest in Maidstone Bakeries and our decision to close 34 restaurants and 18 self-serve kiosks in our Hartford and Providence markets, as well as two restaurants in our Portland market.
In April 2010, we received notice from IAWS Group Ltd., a subsidiary of Aryzta AG, our 50-50 partner under the Maidstone Bakeries joint venture (“Maidstone Bakeries”), invoking the buy/sell provisions of the joint-venture agreement. We decided to sell our 50% interest in Maidstone Bakeries for gross cash proceeds of $475 million. Due to Aryzta’s ability to potentially leverage available surplus capacity for other channels and the international nature of their tax structure, this facility represented greater economic value to Aryzta than to Tim Hortons. The all-cash transaction closed on October 29, 2010. Our supply obligations for products extend for donuts and TimbitsTM until early 2016, and we have supply rights until late 2017, at our option, allowing us sufficient flexibility to secure alternative means of supply, if necessary. The results of Maidstone Bakeries were consolidated in our financial results in accordance with applicable accounting rules until October 29, 2010, at which point we were no longer required to consolidate their results. Due to the continuing business relationship that exists, Maidstone Bakeries did not qualify to be presented as discontinued operations. In fiscal 2010, Maidstone Bakeries contributed approximately $24 million to our adjusted operating income attributable to Tim Hortons Inc., $21 million to our net income attributable to Tim Hortons Inc., and $0.12 per share attributable to Tim Hortons Inc., representing our 50% share of earnings for the ten month period prior to the sale (fiscal 2009: Maidstone Bakeries contributed approximately $26 million, $22 million and $0.12 per share to our adjusted operating income, net income, and diluted earnings per share attributable to Tim Hortons Inc., respectively). See “Selected Operating and Financial Highlights” for a GAAP reconciliation of adjusted operating income attributable to Tim Hortons Inc. to operating income. We have recorded a pre-tax gain on sale of Maidstone Bakeries in the fourth quarter of 2010 of $402 million, less approximately $41 million which, for accounting purposes, has been deferred and will be amortized over the remaining term of the supply agreement.
During the third quarter of 2010, an impairment review was initiated on our Portland, Providence and Hartford markets in the New England region based on their same-store sales growth and financial performance, which were continuing to fall below our expectations. Upon completion of this review, we determined that the future expected cash flows of these markets were insufficient to recover the carrying value of the long-lived assets in these markets. Commensurate with this review, we decided to close 34 restaurants and 18 self-serve kiosks in our Hartford and Providence markets in the fourth quarter of 2010 and two restaurants in our Portland market. The Providence and Hartford markets are among the most densely penetrated market areas in U.S. by quick service restaurants, and we were not successful in expanding our customer base to the levels required for future profitability. As a result, total asset impairment and related closure costs of $28.3 million were recorded in our U.S. operating segment in the latter half of 2010. These markets represent a relatively small portion of our overall system in the U.S., but historically had a disproportionately negative impact on earnings, average unit volumes and same-store sales growth in the U.S. segment. Average unit volumes for standard restaurants in the Providence and Hartford markets were approximately half of our other core markets in the U.S. These restaurant closures will allow us to focus on and reinvest a portion of our savings from these closed restaurants into our core growth markets in the Northeast and Midwest U.S. by increasing our advertising and marketing scale where the brand continues to demonstrate strengthening average unit volumes, cash flows and brand progression. We expect this decision to contribute directly to operating income improvement in our U.S. segment in 2011.
Operating income increased $346.6 million, or 66.0%, in fiscal 2010 compared to fiscal 2009, primarily as a result of the gain on sale of our interest in Maidstone Bakeries of $361.1 million, partially offset by our $30.0
54
Table of Contents
million allocation to restaurant owners. The large gain was also offset, in part, by asset impairment and related closures costs of $28.3 million. Exclusive of these factors, other significant contributors to operating income growth were higher revenues driven by continued same-store sales growth in both Canada and the U.S. and an increase in the number of systemwide restaurants, resulting in higher royalty, rental and distribution income. Fiscal 2010 had 52 weeks as compared to our fiscal 2009 year which had a 53rd week of operations. This 53rd week impacted 2010 operating income growth by approximately 1.5%. Partially offsetting these operating gains were higher general and administrative expenses and lower franchise fee income and, in 2009 we had a $2.4 million gain from a land sale which did not recur in 2010.
Net income attributable to Tim Hortons Inc. increased $327.6 million, or 110.5%, compared to fiscal 2009. The increase in net income was primarily a result of the higher operating income, offset to a much lesser extent by higher net interest expense and higher income tax expense due to the sale of Maidstone Bakeries, albeit at a lower effective tax rate in 2010. The higher net interest expense was primarily driven by higher interest rates on long-term debt, the early settlement of our interest rate swaps associated with the prepayment of our term debt that would otherwise have expired in February 2011, and the write-off of deferred financing costs associated with the portion of the term debt that was prepaid. These impacts were partially offset by approximately $20.0 million of tax-related expenses incurred in 2009 in connection with our Canadian public company reorganization, which did not recur in 2010 and contributed to the overall growth rate, as well as interest income earned on higher cash balances on hand during the fourth quarter of 2010 mainly due to the proceeds from the sale of our interest in Maidstone Bakeries.
Fully diluted EPS increased to $3.58 in fiscal 2010 compared to $1.64 in fiscal 2009. In addition to the operating income gains and significant items noted above, the lower basic and diluted weighted average number of shares outstanding in fiscal 2010, as a result of our share repurchase program, was another driver of higher EPS in 2010.
We generate substantial cash flows from operations and have historically self-funded our growth requirements from internally-generated cash flows. We, therefore, decided to distribute approximately $400 million of the approximately $430 million in after-tax proceeds from the sale of Maidstone Bakeries through the repurchase of common shares. It is our intention, subject to regulatory approval and in parallel with our annual capital allocation process, to distribute the remaining net cash proceeds from the sale of Maidstone Bakeries of up to approximately $245 million through an additional normal course issuer bid. We expect the net proceeds to be distributed in their entirety through share repurchases by the end of the third quarter of 2011, although we may terminate the program at any time, subject to compliance with regulatory requirements. In addition, we have also allocated $30 million related to the Maidstone Bakeries sale to support our key relationship with restaurant owners with the intent of helping to partially mitigate anticipated rising operating costs.
55
Table of Contents
2011 Performance Targets
The following table sets forth our 2011 performance targets, as well as management’s views on achieving such objectives (see accompanying notes below):
| Measure |
Target |
Commentary | ||
| Same-store Sales Growth • Canada • U.S. |
3% – 5% 3% – 5% |
Same–store sales growth to be driven by daypart, marketing and menu opportunities, as well as our continued focus on our hospitality initiatives. We plan to create menu and product innovation to expand our market share across various dayparts and product categories, responding to customer needs and trends. We plan to place particular focus on morning and afternoon/evening snacking dayparts, as well as extending lunch opportunities in the Canadian segment. In the U.S., we plan to test and roll-out menu items that help differentiate our cafe and bake shop brand identity. We also plan on leveraging our marketing strengths and advantages in Canada, and significantly increase our marketing and advertising spend in U.S. markets compared to historical contribution levels, and in particular in our core, more developed markets. Our full-year targets incorporate the impact of adverse weather conditions in several of our major Canadian and U.S. markets, as well as minimal residual pricing in most Canadian markets. | ||
| Earnings per share (fully diluted) | $2.30 - $2.40 | We are targeting EPS growth, on a fully diluted basis, for 2011 to be within our long-range aspirational target of 12%-15% (excluding the 2010 impact of the disposition of our 50% joint-venture interest in Maidstone Bakeries and the U.S. asset impairment and related closure costs).
Our EPS target includes U.S. segment operating income of US$13 million to US$16 million. | ||
| Effective Tax Rate |
Approximately 30% | We expect to continue to realize benefits associated from the public company reorganization completed in 2009. | ||
| Restaurant Development • Canada
• U.S. |
160 – 180 restaurants
70 – 90 restaurants |
Our specific plans include continued active development of both standard and non-standard restaurants in Canadian growth markets; working to accelerate the time it takes to create critical mass for convenience and advertising scale in our most developed U.S. markets; and complementing our standard restaurant development activity in both Canada and the U.S. with non-standard formats and locations. | ||
| Capital Expenditures |
$180 million to $200 million | Includes increased new restaurant development in Canada compared to historical levels, the commencement of increased development in U.S. core markets, and the completion of our replacement distribution facility in Kingston, Ontario. | ||
Notes:
The operational objectives, financial outlook, and aspirational goals (collectively, “targets”) established for 2011 and longer-term are based on the accounting, tax, and other legislative rules in place at the time the targets were issued and on the continuation of share repurchase programs relatively consistent with historical levels. The
56
Table of Contents
impact of future changes in accounting, tax and/or other legislative rules that may or may not become effective in fiscal 2010, 2011 and/or future years, changes to our share repurchase activities, and other matters not contemplated at the time the targets were established that could affect our business (such as, for example, the impact of disposition of our 50% joint venture interest in Maidstone Bakeries and other significant matters), were not included in the determination of these targets. In addition, the targets are forward-looking and are based on our expectations and outlook on, and shall be effective only as of, the date the targets were originally issued. Except as required by applicable securities laws, we do not intend to update these targets. You should refer to the Company’s public filings for any reported updates. These targets and our performance generally are subject to various risks and uncertainties and are based on certain underlying assumptions, set forth in Item 1A. Risk Factors of this Annual Report, which may impact future performance and our achievement of these targets. For 2011, our targets are based on expectations of a gradual, continued economic recovery in both Canada and the U.S.
Additional information on our 2011 Financial Outlook is included under Item 1. Business in this Annual Report.
We recently announced that we have entered into a Master License Agreement (“MLA”), based primarily on a royalty model, with The Apparel Group FZCO (the “Apparel Group”) based in Dubai to develop up to 120 multi-format restaurants over five years, including approximately five in 2011. The MLA includes markets in the Gulf Cooperation Council (“GCC”) markets of United Arab Emirates, Qatar, Bahrain, Kuwait and Oman. The business structure for the MLA also includes an upfront license fee and a small percentage of sales to cover procurement and product supply services to the GCC. We believe there is opportunity over the long-term to explore international opportunities and seed the Tim Hortons brand in various markets outside of North America.
Selected Operating and Financial Highlights
| Fiscal Years | ||||||||||||
| 2010 | 2009 | 2008 | ||||||||||
| Systemwide sales growth(1) (2) |
6.2 | % | 7.9 | % | 8.3 | % | ||||||
| Average same-store sales growth |
||||||||||||
| Canada |
4.9 | % | 2.9 | % | 4.4 | % | ||||||
| U.S. |
3.9 | % | 3.2 | % | 0.8 | % | ||||||
| Systemwide restaurants |
3,750 | 3,578 | 3,437 | |||||||||
| Revenues (in millions)(1) |
$ | 2,536.5 | $ | 2,438.9 | $ | 2,229.2 | ||||||
| Operating income (in millions)(1) |
$ | 872.2 | $ | 525.6 | $ | 478.4 | ||||||
| Adjusted operating income attributable to THI (in millions)(3) |
541.6 | 486.4 | N/A | |||||||||
| Net income attributable to THI (in millions)(1) |
$ | 624.0 | $ | 296.4 | $ | 284.7 | ||||||
| Basic and diluted earnings per share(1) |
$ | 3.58 | $ | 1.64 | $ | 1.55 | ||||||
| Weighted average number of shares of common shares outstanding – Diluted (in millions) |
174.2 | 180.6 | 183.5 | |||||||||
N/A – Not applicable
| (1) | Fiscal years include 52 weeks, except for fiscal 2009, which consisted of 53 weeks. Systemwide sales growth for 2010 and 2009 measured on a year-over-year 52-week basis was 7.9% and 6.1%, respectively. |
| (2) | Total systemwide sales growth is determined using a constant exchange rate to exclude the effects of foreign currency translation. U.S. dollar sales are converted into Canadian dollar amounts using the average exchange rate of the base year for the period covered. Systemwide sales growth excludes sales from our Republic of Ireland and United Kingdom licensed locations. Systemwide sales growth in Canadian dollars, which includes the effects of foreign currency translation, was 5.3% and 8.6% for fiscal 2010 and fiscal 2009, respectively. |
| (3) | Adjusted operating income attributable to Tim Hortons Inc. and operating income attributable to Tim Hortons Inc. are non-GAAP measures (see table below). Operating income attributable to Tim Hortons Inc. excludes operating income attributable to noncontrolling interests. Prior to the adoption of a new accounting |
57
Table of Contents
| standard at the beginning of the first quarter of 2010, operating income was, for the most part, unaffected by noncontrolling interests, which is not the case post-adoption. This new accounting standard requires the consolidation of variable interest entities of which we are considered to be the primary beneficiary, including Maidstone Bakeries up to the date of sale on October 29, 2010, as well as, on average, approximately 250 to 275 non-owned restaurants from fiscal 2008 to 2010. Previously, we did not consolidate Maidstone Bakeries and we consolidated approximately 120 non-owned restaurants, on average, in accordance with the prior accounting standard. Management believes that operating income attributable to Tim Hortons Inc. provides important information for comparison purposes to prior periods and for purposes of evaluating the Company’s operating income performance without the effects of the new accounting standard. |
Adjusted operating income attributable to Tim Hortons Inc. excludes operating income attributable to noncontrolling interests, as described above, the gain on sale of our interest in Maidstone Bakeries, the $30.0 million allocation to restaurant owners and other Maidstone Bakeries related operating income adjustments, and excludes asset impairment and related closure cost charges. The closure of these New England restaurants impacted three U.S. operating markets, which represents approximately 2% of our overall systemwide restaurants. In addition, we have adjusted operating income for 2009 for the 53rd week of operations and for 2 months of Maidstone Bakeries’ operating income so that year-over-year results are on a comparable basis. We have excluded these items as we consider them to have a disproportionate impact on the overall performance of our consolidated business. They also distort the comparison of financial results year-over-year and therefore, the assessment of ongoing operational performance.
The presentation of these non-GAAP measures is made with operating income, the most directly comparable U.S. GAAP measure. We present information excluding amounts related to the impacts described above, and set forth on the table below, as it is more reflective of the way we manage and measure our performance internally. Therefore, these measures provide a more consistent view of management’s perspectives on underlying performance than the closest equivalent U.S. GAAP measure.
| Change from prior year |
||||||||||||
| Fiscal Year | 2010 vs. 2009 |
|||||||||||
| 2010 | 2009 | % | ||||||||||
| (In millions) | ||||||||||||
| Operating income |
$ | 872.2 | $ | 525.6 | 66.0 | % | ||||||
| Less: Operating income attributable to noncontrolling interests |
(26.5 | ) | (27.8 | ) | n/m | |||||||
| Operating income attributable to Tim Hortons Inc. |
$ | 845.7 | $ | 497.8 | 69.9 | % | ||||||
| Add: Asset impairment and related closure costs |
28.3 | — | n/m | |||||||||
| Add: Restaurant owner allocation |
30.0 | — | n/m | |||||||||
| Less: Gain on sale of our interest in Maidstone Bakeries |
(361.1 | ) | — | n/m | ||||||||
| Less: Amortization of Maidstone Bakeries supply agreement |
(1.3 | ) | — | n/m | ||||||||
| Less: Maidstone Bakeries 2-month operating income adjustment (November/December) |
— | (4.8 | ) | n/m | ||||||||
| Less: 53rd week operating impact |
— | (6.7 | ) | n/m | ||||||||
| Adjusted operating income attributable to Tim Hortons Inc. |
$ | 541.6 | $ | 486.4 | 11.4 | % | ||||||
All numbers rounded
n/m – not meaningful
Systemwide Sales Growth
Systemwide sales growth was 6.2%, as a result of continued same-store sales growth in Canada and the U.S and new restaurant expansion in fiscal 2010 and 2009.
58
Table of Contents
Our financial results are driven largely by changes in systemwide sales, which include restaurant-level sales at both franchised and Company-operated restaurants, although approximately 99.5% of our system is franchised. Franchise restaurant sales are reported to us by our franchisees. Franchise restaurant sales are not included in our Consolidated Financial Statements, other than approximately 275 non-owned restaurants, on average whose results of operations are consolidated with ours pursuant to variable interest entity accounting rules. The amount of systemwide sales impacts our royalties and rental income, as well as our distribution income. Changes in systemwide sales are driven by changes in average same-store sales and changes in the number of restaurants (i.e., historically the addition of new restaurants) and are ultimately driven by consumer demand. Systemwide sales growth is determined using a constant exchange rate to exclude the effects of foreign currency translation. U.S. dollar sales are converted into Canadian dollar amounts using the average exchange rate of the base year for the period covered. Systemwide sales growth excludes sales from our Republic of Ireland and United Kingdom licensed locations as these locations operate on a significantly different business model compared to our North American operations.
Average Same-Store Sales Growth
Average same-store sales, one of the key metrics we use to assess our performance, provides information on total retail sales at restaurants operating systemwide that have been operating for thirteen or more months (i.e., includes both franchised and Company-operated restaurants), and provides a useful comparison between periods. Our average same-store sales growth is generally attributable to several key factors, including new product introductions, improvements in restaurant speed of service and other operational efficiencies, hospitality initiatives, more frequent customer visits, expansion into broader menu offerings, promotional activities, and pricing. Restaurant-level price increases are primarily used to offset higher restaurant-level costs on key items such as coffee, wheat, cooking oils and other commodities, labour, supplies, utilities and business expenses. Our primary commodity, coffee, has seen high double-digit percentage increases in the past year, and while increases in our coffee supply costs have not been up as high as the overall markets, they are up significantly year-over-year, and there has been no relief in green coffee pricing in the first part of 2011. Costs of producing baked goods have also been under pressure. The most important input costs in our baked goods commodities basket, wheat and cooking oils, have also seen significant year-over-year increases. We secured pricing on our 2011 sugar supply last year at much lower prices, however, which will help offset some of the pressure on baked goods ingredient costs. As a result of these rising prices, we expect that certain regions and markets in Canada will need to increase prices to consumers in 2011 to help offset some of these significant cost pressures, as we did in February 2011 on certain products in our U.S. market. Across the U.S., prices on certain products, including coffee, increased approximately 3%. In 2010, the U.S. increased prices to consumers in May. The majority of the Canadian regions have minimum residual pricing remaining in the system in 2011, prior to any new increases. There can be no assurance that these price increases will result in an equivalent level of sales growth, which depends upon customers maintaining the frequency of their visits even with the new pricing.
In fiscal 2010, Canadian average same-store sales increased 4.9% over fiscal 2009, which was our 19th consecutive annual increase in Canada. In the U.S., average same-store sales (measured in U.S. currency) increased 3.9% in fiscal 2010 over fiscal 2009, which represented our 20th consecutive annual increase.
Product innovation is one of our focused strategies to drive same-store sales growth, including innovation at breakfast as well as other dayparts. Marketing and promotional activities which were designed to drive same-store sales growth contributed to our 2010 same-store sales results in both Canada and the U.S. In fiscal 2010, we had an active menu and product-focused promotional program designed to reinforce value to our customers. In addition, we rolled out our Canadian hospitality program and continued our Cold Stone Creamery co-branding initiative, with same-store sales benefiting from both of these initiatives. Our product offerings, promotional activity, and operational efficiencies led to transaction growth in 2010. Price increases in the front half of the year in Canada and in the latter half of the year in the U.S. also helped contribute to a higher average cheque.
59
Table of Contents
The following tables set forth average same-store sales growth by quarter for fiscal 2010, 2009, and 2008 and by year for the ten-year period from 2001 to 2010. Our historical average same-store sales trends are not necessarily indicative of future results.
| Historical Average Same-Store Sales Increase | ||||||||||||||||||||
| 1st Quarter | 2nd Quarter | 3rd Quarter | 4th Quarter | Year | ||||||||||||||||
| Canada |
||||||||||||||||||||
| 2010 |
5.2 | % | 6.4 | % | 4.3 | % | 3.9 | % | 4.9 | % | ||||||||||
| 2009 |
3.4 | % | 1.7 | % | 3.1 | % | 3.4 | % | 2.9 | % | ||||||||||
| 2008 |
3.5 | % | 5.7 | % | 3.8 | % | 4.4 | % | 4.4 | % | ||||||||||
| U.S. |
||||||||||||||||||||
| 2010 |
3.0 | % | 3.1 | % | 3.3 | % | 6.3 | % | 3.9 | % | ||||||||||
| 2009 |
3.2 | % | 3.3 | % | 4.3 | % | 2.1 | % | 3.2 | % | ||||||||||
| 2008 |
1.0 | % | 3.1 | % | (0.6 | )% | (0.1 | )% | 0.8 | % | ||||||||||
| Canada | U.S. | |||||||
| 2010 |
4.9 | % | 3.9 | % | ||||
| 2009 * |
2.9 | % | 3.2 | % | ||||
| 2008 |
4.4 | % | 0.8 | % | ||||
| 2007 |
6.1 | % | 4.1 | % | ||||
| 2006 |
7.7 | % | 8.9 | % | ||||
| 2005 |
5.5 | % | 7.0 | % | ||||
| 2004 * |
7.8 | % | 9.8 | % | ||||
| 2003 |
5.3 | % | 4.5 | % | ||||
| 2002 |
7.9 | % | 9.9 | % | ||||
| 2001 |
8.5 | % | 7.7 | % | ||||
| 10-year average |
6.1 | % | 6.0 | % | ||||
| * | Indicates fiscal years that had 53 weeks; for calculation of same-store sales increase, the comparative base also includes 53 weeks. |
New Restaurant Development
Opening restaurants in new and existing markets in Canada and the U.S. has been a significant contributor to our growth. Below is a summary of restaurant openings and closures for our 2010, 2009, and 2008 fiscal years:
| Fiscal Year 2010 | Fiscal Year 2009 | Fiscal Year 2008 | ||||||||||||||||||||||||||||||||||||||||||||||||||||||
| Full-serve Standard and Non-standard |
Self-serve Kiosks |
Total | Full-serve Standard and Non-standard |
Self-serve Kiosks |
Total | Full-serve Standard and Non-standard |
Self-serve Kiosks |
Total | ||||||||||||||||||||||||||||||||||||||||||||||||
| Canada |
||||||||||||||||||||||||||||||||||||||||||||||||||||||||
| Restaurants opened |
129 | 20 | 149 | 128 | 3 | 131 | 130 | — | 130 | |||||||||||||||||||||||||||||||||||||||||||||||
| Restaurants closed |
(16 | ) | — | (16 | ) | (29 | ) | (4 | ) | (33 | ) | (31 | ) | (5 | ) | (36 | ) | |||||||||||||||||||||||||||||||||||||||
| Net change |
113 | 20 | 133 | 99 | (1 | ) | 98 | 99 | (5 | ) | 94 | |||||||||||||||||||||||||||||||||||||||||||||
| U.S. |
||||||||||||||||||||||||||||||||||||||||||||||||||||||||
| Restaurants opened |
44 | 52 | 96 | 45 | — | 45 | 63 | 73 | 136 | |||||||||||||||||||||||||||||||||||||||||||||||
| Restaurants closed |
(39 | ) | (18 | ) | (57 | ) | (1 | ) | (1 | ) | (2 | ) | (14 | ) | — | (14 | ) | |||||||||||||||||||||||||||||||||||||||
| Net change |
5 | 34 | 39 | 44 | (1 | ) | 43 | 49 | 73 | 122 | ||||||||||||||||||||||||||||||||||||||||||||||
| Total Company |
||||||||||||||||||||||||||||||||||||||||||||||||||||||||
| Restaurants opened |
173 | 72 | 245 | 173 | 3 | 176 | 193 | 73 | 266 | |||||||||||||||||||||||||||||||||||||||||||||||
| Restaurants closed |
(55 | ) | (18 | ) | (73 | ) | (30 | ) | (5 | ) | (35 | ) | (45 | ) | (5 | ) | (50 | ) | ||||||||||||||||||||||||||||||||||||||
| Net change |
118 | 54 | 172 | 143 | (2 | ) | 141 | 148 | 68 | 216 | ||||||||||||||||||||||||||||||||||||||||||||||
60
Table of Contents
From the beginning of 2008 to the end of fiscal 2010, we opened 529 system restaurants including both franchised and Company-operated restaurants, net of restaurant closures. Typically, 20 to 40 system restaurants are closed annually, the majority of which are in Canada. Restaurant closures generally result from an opportunity to acquire a better location, which will permit us to upgrade size and layout or add a drive-thru. Restaurant closures made in the normal course typically occur at the end of a lease term or the end of the useful life of the principal asset. We have also closed, and may continue to close, restaurants for which the restaurant location has performed below our expectations for an extended period of time, and/or we believe that sales from the restaurant can be absorbed by surrounding restaurants. In fiscal 2010, we closed a total of 73 system restaurants, including the closure of 36 standard and 18 self-serve kiosks in our New England region. In 2009, we closed a total of 35 restaurants, the substantial majority being in Canada. In 2008, we closed a total of 50 restaurants, which included the closure of 10 restaurants in the fourth quarter of 2008 in New England (one additional restaurant was closed by February 1, 2009, for a total of 11 closures in southern New England). New England closures were outside of the normal course of operations, arising from strategic profitability reviews of our U.S. operations. These closures, therefore, triggered impairment reviews, ultimately resulting in impairment charges and related closure costs in fiscal 2010 and 2008.
Included in our fiscal 2010 U.S. restaurant openings were 52 self-serve kiosks (nil in 2009 and 73 in 2008) primarily located within Tops Friendly Market stores as part of our continued strategic alliance. Self-serve kiosk locations have significantly different economics than our standard and non-standard restaurants, including substantially less capital investment, as well as significantly lower sales and, therefore, lower associated royalties and distribution income; however, such kiosks serve to increase our brand awareness and create another outlet to drive convenience, which is important in our developing markets.
One of our strategic planning initiatives is to grow differently in ways we have not grown before. Initiatives in support of this strategy include the expansion of our Cold Stone Creamery co-branding concept. In 2009, we began to co-brand certain U.S. restaurants with Cold Stone Creamery and, in the second half of 2009; we expanded this initiative to Canada. In the fourth quarter of 2009, we entered into two separate licensing arrangements with Kahala Franchise Corp., the franchisor of the Cold Stone Creamery brand. The nature and purpose of the arrangements were to expand the parties’ co-branding initiatives. We have exclusive development rights in Canada, and certain rights to use licenses within the U.S., in both cases to operate ice cream and frozen confections retail outlets. As of January 2, 2011, we had 170 co-branded locations, including 79 co-branded locations in the U.S. (73 in Tim Hortons restaurants and 6 in Cold Stone Creamery locations) and 91 co-branded locations in Tim Hortons restaurants in Canada. In addition, we have a few Cold Stone Creamery locations that are operating on a limited term agreement, and we are testing some take-home-only formats inside our restaurants.
In addition to the Cold Stone Creamery co-branding initiative, we began testing new concept restaurants in certain U.S. markets to differentiate our customer offering as a cafe and bake shop destination. At the end of fiscal 2010, we had four new concept restaurants opened in the U.S. These restaurants will be utilized to test various new products, equipment and restaurant design features in support of our U.S. strategic plan. During 2011, we plan to incorporate various restaurant design features, product offerings, and/or equipment from these new concept restaurants into our new restaurant development and renovation programs.
The following table shows our restaurant count as of the end of fiscal 2010, 2009 and 2008 and provides a breakdown of our Company-operated and franchised restaurants. At January 2, 2011, 3,730 system restaurants across Canada and the U.S., or 99.5%, were franchised (representing 99.5% in Canada and 99.3% in the U.S.).
61
Table of Contents
Systemwide Restaurant Count
| Fiscal Year | ||||||||||||
| 2010 | 2009 | 2008 | ||||||||||
| Canada |
||||||||||||
| Company-operated |
16 | 13 | 15 | |||||||||
| Franchised – standard and non-standard |
3,020 | 2,904 | 2,803 | |||||||||
| Franchised – self-serve kiosks |
112 | 98 | 99 | |||||||||
| Total |
3,148 | 3,015 | 2,917 | |||||||||
| % Franchised |
99.5 | % | 99.6 | % | 99.5 | % | ||||||
| U.S. |
||||||||||||
| Company-operated |
4 | 5 | 19 | |||||||||
| Franchised – standard and non-standard |
475 | 471 | 413 | |||||||||
| Franchised – self-serve kiosks |
123 | 87 | 88 | |||||||||
| Total |
602 | 563 | 520 | |||||||||
| % Franchised |
99.3 | % | 99.1 | % | 96.3 | % | ||||||
| Total system |
||||||||||||
| Company-operated |
20 | 18 | 34 | |||||||||
| Franchised – standard and non-standard |
3,495 | 3,375 | 3,216 | |||||||||
| Franchised – self-serve kiosks |
235 | 185 | 187 | |||||||||
| Total |
3,750 | 3,578 | 3,437 | |||||||||
| % Franchised |
99.5 | % | 99.5 | % | 99.0 | % | ||||||
In fiscal 2008 and 2009, we converted most of our U.S. Company-operated restaurants to operator agreements. The effect of these conversions to date has been slightly accretive to operating income. We believe that, in the long-term, this franchising strategy generally provides better overall profitability to the business. Initially, after conversion, we generally provided additional relief to the operator, and we have been required to consolidate some of these restaurants in accordance with variable interest entity accounting rules for consolidations, which changed effective for our first quarter of 2010. We consolidated approximately 120 non-owned restaurants, on average, under the previous accounting standard and, with the adoption of the new variable interest entities accounting standard, we are now consolidating, on average, approximately 275 non-owned restaurants in fiscal 2010. We adopted this standard with retroactive application to prior periods for comparability.
Segment Operating Income (Loss)
Systemwide sales and average same-store sales growth is affected by the business and economic environments in Canada and the U.S. We manage and review financial results from Canadian and U.S. operations separately. We, therefore, have determined the reportable segments for our business to be the geographic locations of Canada and the U.S. Each segment includes all manufacturing and distribution operations that are located in their respective geographic locations. We continue to manage the development of our international operations in the Republic of Ireland and the United Kingdom, which consist primarily of branded, licensed self-serve kiosk locations, corporately. Our reportable segments exclude the effects of the variable interests accounting standard, reflective of the way the business is managed.
62
Table of Contents
The following tables contain information about the operating income (loss) of our reportable segments:
| Fiscal 2010 Compared to Fiscal 2009 | ||||||||||||||||||||||||
| 2010 | % of Revenues |
2009 | % of Revenues |
Change | ||||||||||||||||||||
| Dollars | Percentage | |||||||||||||||||||||||
| (In thousands, except where noted) | ||||||||||||||||||||||||
| Operating Income (Loss) |
||||||||||||||||||||||||
| Canada (1) (2) |
$ | 904,768 | 35.7 | % | $ | 538,292 | 22.1 | % | $ | 366,476 | 68.1 | % | ||||||||||||
| U.S. (3) |
(18,363 | ) | (0.7 | )% | 4,840 | 0.2 | % | (23,203 | ) | n/m | ||||||||||||||
| Reportable segment operating income |
886,405 | 34.9 | % | 543,132 | 22.3 | % | 343,273 | 63.2 | % | |||||||||||||||
| Variable interest entities |
26,534 | 1.0 | % | 27,762 | 1.1 | % | (1,228 | ) | (4.4 | )% | ||||||||||||||
| Corporate charges(4) |
(40,701 | ) | (1.6 | )% | (45,292 | ) | (1.9 | )% | 4,591 | (10.1 | )% | |||||||||||||
| Consolidated operating income |
$ | 872,238 | 34.4 | % | $ | 525,602 | 21.6 | % | $ | 346,636 | 66.0 | % | ||||||||||||
| Fiscal 2009 Compared to Fiscal 2008 | ||||||||||||||||||||||||
| 2009 | % of Revenues |
2008 | % of Revenues |
Change | ||||||||||||||||||||
| Dollars | Percentage | |||||||||||||||||||||||
| (In thousands, except where noted) | ||||||||||||||||||||||||
| Operating Income (Loss) |
||||||||||||||||||||||||
| Canada (1) |
$ | 538,292 | 22.1 | % | $ | 512,255 | 23.0 | % | $ | 26,037 | 5.1 | % | ||||||||||||
| U.S. (3) |
4,840 | 0.2 | % | (26,488 | ) | (1.2 | )% | 31,328 | n/m | |||||||||||||||
| Reportable segment operating income |
543,132 | 22.3 | % | 485,767 | 21.8 | % | 57,365 | 11.8 | % | |||||||||||||||
| Variable interest entities |
27,762 | 1.1 | % | 29,631 | 1.3 | % | (1,869 | ) | (0.6 | )% | ||||||||||||||
| Corporate charges(4) |
(45,292 | ) | (1.9 | )% | (36,951 | ) | (1.6 | )% | (8,341 | ) | 22.6 | % | ||||||||||||
| Consolidated operating income |
$ | 525,602 | 21.6 | % | $ | 478,447 | 21.5 | % | $ | 47,155 | 9.9 | % | ||||||||||||
| (1) | While the adoption of amended accounting rules for variable interest entities resulted in the consolidation of Maidstone Bakeries, the Company’s chief decision maker viewed and evaluated the performance of the Canadian segment with Maidstone Bakeries accounted for on an equity accounting basis, which reflects 50% of its operating income (consistent with views and evaluations prior to the adoption of the accounting standard). As a result, the net revenues and the remaining 50% of operating income of Maidstone Bakeries up to October 29, 2010, the date of disposition, were included in the Variable interest entities line item, along with revenues and operating income from our non-owned consolidated restaurants. |
| (2) | Fiscal 2010 includes a $361.1 million gain recognized from the sale for our 50% interest in Maidstone Bakeries, less $30.0 million allocated to restaurant owners and $1.3 million income relating to the amortization of a deferred gain in connection with our continuing supply agreement with Maidstone Bakeries. |
| (3) | The U.S. operating income (loss) includes $28.3 million (2010) and $21.3 million (2008) of asset impairment and related closure costs in connection with the closure of 36 restaurants and 18 self-serve kiosks primarily in the New England region in 2010 (11 restaurants in 2008). |
| (4) | Corporate charges include certain overhead costs that are not allocated to individual business segments, the impact of certain foreign currency exchange gains and losses, and the operating income from international operations (discussed above), which continue to be managed corporately. |
n/m – The comparison is not meaningful.
Fiscal 2010 compared to Fiscal 2009
Reportable segment operating income increased $343.3 million, or 63.2%, in fiscal 2010 to $886.4 million compared to $543.1 million in fiscal 2009, and, as a percentage of total revenues, was 34.9% and 22.3%, respectively. Our Canadian segment includes a $361.1 million gain on the sale of our interest in Maidstone Bakeries, less $30.0 million allocated to our restaurant owners and $1.3 million of income relating to the
63
Table of Contents
amortization of our deferred gain in connection with our continuing supply agreement with Maidstone Bakeries. Also included in our 2010 segment operating income are asset impairment and related closure costs of $28.3 million related to our New England region that was recorded in our U.S. segment. Excluding the gain on sale and related impacts, allocation to restaurant owners and asset impairment and related closure costs, segment operating income would have increased $40.5 million, or 7.5%. Fiscal 2010 has 52 weeks of operations whereas fiscal 2009 includes a 53rd week of operations. The 53rd week increased 2009 segment revenues and reportable segment operating income growth rates by approximately 1.8% and 1.5%, respectively.
Canada
Exclusive of the gain on the sale of our interest in Maidstone Bakeries and the $30.0 million restaurant owner allocation, described above, our Canadian segment operating income increased $35.4 million, or 6.6%, from $538.3 million in fiscal 2009 to $573.7 million in fiscal 2010, primarily due to systemwide sales increases and increased contribution from our distribution business. Canadian same-store sales growth was 4.9% in fiscal 2010, which includes some pricing benefits. In fiscal 2010, we opened 149 restaurants in Canada and closed 16, compared to opening 131 restaurants and closing 33 in fiscal 2009. Transaction growth continued to add to same-store sales growth, benefiting from our ongoing menu initiatives, promotions, and operational initiatives such as our hospitality program. We also co-branded 78 locations in 2010 with Cold Stone Creamery, which contributed slightly to the segment’s same-store sales growth and contributed positively to our Canadian franchise fee income. In 2011, we will continue our focus on driving same-store sales, through menu and product innovation to expand our market share across various dayparts and product categories, with a particular focus on morning and afternoon/evening snacking dayparts, as well as lunch. We also plan on leveraging our marketing strengths and advantages and will continue to promote improvement in restaurant service levels through our hospitality program (see Item 1. Business—Business Overview and 2011 Objectives). There is minimal residual pricing remaining in the system in 2011, prior to any new increases.
Canadian systemwide sales growth drove higher rents and royalties income, as well as higher income from our distribution business. The distribution business also benefited from incremental income related to new products in our supply chain. Distribution is a critical element of our business model as it allows us to control costs to our franchisees and service our restaurants efficiently and effectively while contributing to our profitability. Also contributing to our Canadian segment operating income growth was our new coffee roasting facility in Hamilton, Ontario, which began operations in the fourth quarter of 2009. Partially offsetting this growth in segment operating income were higher general and administrative expenses, due largely to additional headcount required to support the growth of our business as well as investments in our hospitality and co-branding strategies and lower franchise fee income primarily due to a shift in mix of restaurant type openings to a greater number of non-standard restaurants with lower franchise fees. Our Canadian segment operating income includes 50% of operating income from our previously-held Bakery joint-venture. Due to the sale of our 50% interest in Maidstone Bakeries on October 29, 2010, the income in fiscal 2010 only included ten months of operations, as compared to twelve months in 2009.
U.S.
In 2010, our U.S. segment had an operating loss of $18.4 million, compared to operating income of $4.8 million in 2009. The operating loss is entirely due to the asset impairment and closure costs recorded in the back half of 2010 relating to our underperforming restaurants in the New England region (described below). Excluding the asset impairment and related closure costs, we would have more than doubled our operating income from fiscal 2009 in our U.S. segment to $9.9 million in fiscal 2010. This is a considerable improvement over the prior year, due, in large part, to same-store sales growth of 3.9% amid a continued challenging macro-economic climate in many of our core markets in the U.S. The closure of the underperforming restaurants also contributed to the improvement in the U.S. segment operating income as they resulted in higher rents and royalties (due to lower relief). We plan on reinvesting a portion of our savings from these closed restaurants into our core U.S. growth markets in Northeast and Midwest U.S. in 2011 to increase our advertising and marketing scale and increase awareness of our brand. In addition, as a result of rising commodity costs, including coffee, the U.S. increased prices to consumers in February 2011 by approximately 3%. The U.S. had previously increased pricing in May 2010.
64
Table of Contents
During the third quarter of 2010, an impairment review was initiated related to our Portland, Providence and Hartford markets in the New England region based on their same-store sales growth and financial performance, which were continuing to underperform against expectations. Upon completion of this review, we determined that the future expected cash flows of these markets were insufficient to recover the carrying value of the long-lived assets in these markets. Commensurate with this review, we decided to close 34 restaurants and 18 self-serve kiosks in our Hartford and Providence markets and two restaurants in our Portland market. The Providence and Hartford markets are among the most densely penetrated market areas in U.S. by quick service restaurants, and we were not successful in expanding our customer base to the levels required for future profitability. As a result, total asset impairment and related closure costs of $28.3 million were recorded in our U.S. operating segment in the latter half of 2010, comprised of $18.4 million in an asset impairment charge and $9.9 million in restaurant closure costs representing primarily lease commitment obligations. We intend to settle the majority of these obligations, to the extent possible in 2011, with the obligation being paid out in cash, as required. These markets represent a relatively small portion of our overall system in the U.S., but have had a disproportionately negative impact on earnings, average unit volumes, and same-store sales growth in the U.S. segment. Average unit volumes for standard restaurants in the Providence and Hartford markets were approximately half of other core markets in the U.S.
While we expect the decision to close the underperforming restaurants will contribute directly to earnings improvement, primarily through reduced depreciation and lower franchise relief provided to support these underperforming restaurants, in the U.S. segment throughout 2011, we will be redeploying a portion of these savings into advertising programs in our other core markets (as described above), which we expect will help drive sales improvements. Our U.S. segment operating income may continue to show volatility, quarter-to-quarter and year-to-year, as we expand our new unit growth. When we enter new markets, average unit sales volumes for our franchisees may be lower than sales levels in our more established markets. In addition, based on past experience, as we add new restaurants in developing markets, average unit sales growth for existing restaurants may be affected for a period of time until awareness of the brand improves and the market adjusts to the added convenience that new locations provide. In certain situations, we provide relief of rents and royalties, and in some cases, relief for other operating costs, for a period of time to support these franchisees. Such relief offsets our rent and royalty revenues. In developing markets, when we transition a restaurant from a Company-operated restaurant to either a full franchised restaurant or a restaurant governed by an operator agreement, we also generally provide relief to the franchisee for an initial period.
We are typically able to identify franchisees for new restaurants, but in certain developing markets, it may be more challenging; however, it has not historically been a major impediment to our growth. Despite the current economic climate and credit conditions, our franchisees continue to have access to lending programs with third-party lenders, although processing may take longer and costs may be higher, consistent with prevailing market conditions. We continue to experience a higher number of past-due notes under our franchise incentive program with approximately 70% of the notes past due as of January 2, 2011. In many cases, we have also chosen to hold the note for longer periods of time than we have historically done to ensure the restaurant has achieved certain profitability targets. In the event a franchisee cannot repay the note, we will take back ownership of the restaurant and equipment, which effectively collateralizes the note and, therefore, minimizes our risk. In addition, we are also entering into operator agreements more frequently than full franchise agreements when opening new restaurants, and once the restaurant is established and reaches certain profitability measures, we may sell the restaurant to the operator under a full franchise agreement.
We have also adapted our marketing and promotional activities to the challenging economic environment and related circumstances. Commencing in 2009, a number of our competitors also commenced and/or intensified discounting (heightened by the continuing economic challenges in North America) and “combo” or value-pricing practices, as well as free product promotions. This cross-over of brands and menu offerings, and increased competition on price and other factors, continued through 2010. In 2010, we continued to offer targeted value-priced food and beverage programs, in addition to the launch of new products at a variety of everyday value price points, with the intent to strengthen and build on our price to value position and to enhance this
65
Table of Contents
message with our consumers in a tangible way. In the U.S., we also introduced the use of coupons as a vehicle to attract new customers and introduce them to our brand and new product offerings. While we do not intend to stray from our core everyday positioning of quality food at reasonable prices, we are working with our franchisees to communicate and interact with customers in a manner that responds to their current situation and the economic environment. We believe that continued business refinements will help, over time, position our U.S. business to defend aggressive competitive discounting activity, while also creating sales momentum.
During fiscal 2010, we opened 96 new restaurants, including 52 self-serve kiosks, and closed 39 restaurants and 18 self-serve kiosks in the U.S., as compared to opening 45 new restaurants and closing two restaurants, in fiscal 2009. The majority of the self-serve openings in fiscal 2010 were part of an expansion of our strategic alliance with Tops Friendly Markets and are located in Tops stores in western and central New York, and northern Pennsylvania. Although self-serve kiosks contribute minimally to sales and operating earnings, they are one of the ways we seed our brand and offer convenience to our customers.
In 2011, we plan to further prioritize U.S. restaurant development capital spending among our core growth markets which are most developed. Our strategy is designed to increase our density in these core markets, and to accelerate the process to reach critical mass for both customer convenience and advertising scale. While targeting a considerable increase in U.S. segment operating income contribution in 2011, we are also investing corporately in expanded brand development and marketing activities across our markets and, in particular, in these core growth markets during the upcoming year. We also plan to test and roll-out menu items that help differentiate our brand and offerings as a cafe and bake shop destination.
Variable interest entities
Our variable interest entities’ income before income tax pertains to the entities that we are required to consolidate in accordance with applicable accounting rules. These entities include Maidstone Bakeries, until the date of disposition of our 50% ownership interest, and certain non-owned restaurants. In fiscal 2010, our variable interest entities’ income before income tax was $26.5 million as compared to $27.8 million in fiscal 2009, of which $24.4 million and $26.2 million relates to Maidstone Bakeries, respectively. The year-over-year decrease in income from Maidstone Bakeries is due to only ten months of income consolidated in our fiscal 2010 results prior to selling our interest on October 29, 2010. We consolidated approximately 275 restaurants on average in fiscal 2010 and 2009, with a greater proportion representing U.S. non-owned consolidated restaurants as a result of the progression of U.S. restaurants to our operator model versus Company-operated restaurants and increased participation in our franchise incentive program.
Corporate charges
Corporate charges include certain overhead costs that are not allocated to individual business units and the impact of certain foreign currency exchange gains and losses. Corporate charges were $40.7 million in fiscal 2010 and $45.3 million in fiscal 2009. The $4.6 million decrease primarily reflects the professional advisory and shareholder costs associated with our public company reorganization in 2009 that did not recur in 2010, which amounted to $7.3 million. Partially offsetting these lower costs were higher salary and benefit costs and higher professional fees related to other corporate initiatives including developing our international strategy.
The Company, through a wholly-owned Irish subsidiary, has self-serve kiosks and on a limited basis, some full-serve kiosks in certain licensed locations within convenience stores in the Republic of Ireland and the United Kingdom. The self-serve kiosks feature our premium coffee, tea, specialty hot beverages and a selection of donuts and muffins. As of January 2, 2011, there were 275 licensed locations in the Republic of Ireland and in the United Kingdom (2009 – 291). These kiosks are operated by independent licensed retailers. At present, the distribution of coffee and donuts through licensed locations with respect to these self-serve kiosks is not a material contributor to our operating income, and therefore, is netted in corporate charges. These arrangements have resulted in incremental distribution sales and royalties. Our financial arrangements for these self-serve
66
Table of Contents
kiosks are different than our traditional franchise models, and we may not, therefore, collect similar data or include these locations in certain of our metrics, including systemwide and same-store sales growth.
We recently announced that we have entered into a Master License Agreement with Apparel Group to develop up to 120 multi-format restaurants in markets in the GCC. Our top priority continues to be growing our Canadian and U.S. businesses. We will manage this expansion corporately. Operating income from our international operations, which currently are insignificant, will continue to be included in Corporate charges in our segmented operating results. In 2011, we expect to invest $2 million to $4 million, net of royalties, license fees and other costs, to support Apparel Group’s investments to launch the business in our GCC market entry.
Fiscal 2009 compared to Fiscal 2008
Segment operating income increased $57.3 million, or 11.8%, in fiscal 2009 to $543.1 million compared to $485.8 million in fiscal 2008, and, as a percentage of total revenues, was 22.3% and 21.8%, respectively. Included in our 2008 segment operating income were asset impairment and related closure cost charges of $21.3 million that were recorded in our U.S. segment. Excluding the asset impairment and related closure costs, segment operating income would have increased $36.1 million, or 7.1%. Fiscal 2009 includes a 53rd week of operations whereas fiscal 2008 only had 52 weeks of operations. The 53rd week increased segment revenues and reportable segment operating income growth rates by approximately 1.8% and 1.5%, respectively.
Canada
Our Canadian segment operating income increased $26.0 million, or 5.1%, from $512.3 million in fiscal 2008 to $538.3 million in fiscal 2009, primarily due to systemwide sales increases and increased contribution from our distribution business. Canadian same-store sales growth was 2.9% in fiscal 2009, including some pricing contributions. In fiscal 2009, we opened 131 restaurants in Canada and closed 33, compared to opening 130 restaurants and closing 36 in fiscal 2008.
Canadian systemwide sales growth drove higher rents and royalties income, as well as higher income from our distribution business. The distribution business also benefited from incremental income related to new products in our supply chain. Distribution is a critical element of our business model as it allows us to control costs to our franchisees and service our restaurants efficiently and effectively while contributing to our profitability. During 2009, we supported our franchisees through the difficult economic conditions by not passing through certain cost increases to franchisees incurred in our distribution business. Partially offsetting this growth in segment operating income were lower franchise fee income; higher general and administrative expenses, due largely to additional headcount required to support the growth of our business.
U.S.
In fiscal 2009, our U.S. segment had operating income of $4.8 million, compared to an operating loss of $26.5 million in fiscal 2008, which exceeded our 2009 break-even operating income target. The significant improvement in our U.S. segment operating loss was, in part, due to the $21.3 million asset impairment and related closure costs recorded during the fourth quarter of 2008 (see below). Excluding the asset impairment and related closure costs, our 2008 operating loss in the U.S. segment would have been $5.2 million. Therefore, the 2009 results compared to 2008, excluding the impairment and related closure cost impacts, reflect a $10.0 million improvement from 2008. The closure of the underperforming Company-operated restaurants, and the related asset impairment charge contributed to the improvement in the U.S. segment operating income as they resulted in lower Company-operated restaurant losses and lower depreciation and rent expense, benefiting operating income by $4.6 million. In addition, lower general and administrative expense and contributions from vertical integration also positively impacted operating income. The U.S. operating segment income improvement also resulted from higher systemwide sales, which benefited distribution and rents and royalties income. Our 2009 co-branding initiative with Cold Stone Creamery contributed a significant portion of our sales growth, leading to rents and royalties revenues and, in some cases, lower relief provided to franchisees. Our core brand
67
Table of Contents
same-store sales continued to be positive, excluding the impacts of co-branding. Partially offsetting these improvements were additional relief provided to certain franchisees, particularly as we transitioned more Company-operated restaurants to franchisees or operator agreements, and lower franchise fee income.
In 2009, we explored other complementary strategic development opportunities to grow the business, including our co-branding initiative, our expansion into New York City utilizing unique restaurant formats, and the opening of restaurants on two U.S. military bases. We saw the benefits of these initiatives in our U.S. systemwide sales results in 2009. These initiatives complement our core strategy of selectively developing full-serve, standalone Tim Hortons locations in our core markets.
We also adapted our marketing and promotional activities to the challenging economic environment and related circumstances. In 2009, we continued to see a large amount of competitive discounting and, as a result, we targeted “combo” food programs at a variety of value price points, with the intent to strengthen and build on our price/value position and enhance this message with U.S. consumers. We introduced the use of coupons as a vehicle to attract new customers and introduce them to our brand and new product offerings.
During fiscal 2009, we opened 45 new restaurants, and closed two restaurants in the U.S., as compared to opening 136 new restaurants, including 73 self-serve kiosks, and closing 14 restaurants, in fiscal 2008. The 2008 self-serve openings included 71 that were part of a strategic alliance with Tops Friendly Markets and are located in Tops stores in western and central New York, and northern Pennsylvania.
We typically expect price increases in one or more regions during the course of the year, but there can be no assurance that price increases will result in an equivalent level of sales growth, which depends upon customer response to the new pricing, and levels of discretionary spending, and our promotional activities. In 2009, we did not implement any price increases given the challenging U.S. economic environment.
Additionally, in 2009, we completed our initiative to transition most of our company-operated restaurants to franchise or operator agreements. This shift was part of our longer-term strategy of having a primarily franchised-system model, similar to our Canadian operations. At the end of 2009, approximately 99.1% of our U.S. restaurants were franchised, compared to 96.3% at the end of 2008. Our historical experience indicates that franchised restaurants are more successful for the franchisee, and therefore us, over the long term. While transitioning company restaurants to franchise or operator agreements usually results in an initial increase in franchisee relief, particularly in our newer markets, and may increase the number of restaurants that we are required to consolidate in accordance with applicable accounting rules, this increase in relief is typically less than the operating loss we would otherwise incur from operating the restaurants corporately. As a result, for 2009, there was a net slightly positive benefit to our U.S. segment as a result of the completion of this initiative.
Variable interest entities
Our variable interest entities’ income before income tax pertains to our previously-held 50% ownership in Maidstone Bakeries and certain non-owned restaurants that we consolidate in accordance with applicable accounting rules. Our variable interest entities’ income before income tax was $27.8 million in fiscal 2009 and $29.6 million in fiscal 2008. Included in this income was $26.2 million and $28.0 earned by Maidstone Bakeries with the difference representing income earned on an average of 250 to 275 non-owned consolidated restaurants from fiscal 2008 to fiscal 2009, respectively. During 2009, we had a gradual shift towards a greater proportion of U.S. non-owned consolidated restaurants as a result of the progression of U.S. restaurants to an owner/operator model, versus Company-operated restaurants.
Corporate charges
Corporate charges include certain overhead costs that are not allocated to individual business units and the impact of certain foreign currency exchange gains and losses. Corporate charges were $45.3 million in fiscal
68
Table of Contents
2009 and $37.0 million in fiscal 2008. The $8.3 million increase primarily reflects the professional advisory and shareholder costs associated with our public company reorganization in 2009, which amounted to $7.3 million. Included in 2008 corporate charges was a management restructuring charge, net of savings, of $2.5 million.
The Company, through a wholly-owned Irish subsidiary, has self-serve kiosks and on a limited basis, some full-serve kiosks in certain licensed locations within convenience stores in the Republic of Ireland and the United Kingdom. The self-serve kiosks feature our premium coffee, tea, specialty hot beverages and a selection of donuts and muffins. As of January 3, 2010, there were 291 licensed locations in the Republic of Ireland and in the United Kingdom (2008 – 293).
Results of Operations
Fiscal 2010 Compared to Fiscal 2009
Below is a summary of comparative results of operations and a more detailed discussion of results for fiscal 2010 and 2009. Financial definitions can be found immediately following “Liquidity and Capital Resources.”
| Fiscal 2010 Compared to Fiscal 2009 | Change from Prior Year |
|||||||||||||||||||||||
| 2010 | % of Revenues |
2009 | % of Revenues |
$ | % | |||||||||||||||||||
| (in thousands, except where noted) | ||||||||||||||||||||||||
| Revenues |
||||||||||||||||||||||||
| Sales |
$ | 1,755,244 | 69.2 | % | $ | 1,704,065 | 69.9 | % | $ | 51,179 | 3.0 | % | ||||||||||||
| Franchise revenues: |
||||||||||||||||||||||||
| Rents and royalties(1) |
687,039 | 27.1 | % | 644,755 | 26.4 | % | 42,284 | 6.6 | % | |||||||||||||||
| Franchise fees |
94,212 | 3.7 | % | 90,033 | 3.7 | % | 4,179 | 4.6 | % | |||||||||||||||
| 781,251 | 30.8 | % | 734,788 | 30.1 | % | 46,463 | 6.3 | % | ||||||||||||||||
| Total revenues |
2,536,495 | 100.0 | % | 2,438,853 | 100.0 | % | 97,642 | 4.0 | % | |||||||||||||||
| Costs and expenses |
||||||||||||||||||||||||
| Cost of sales |
1,527,405 | 60.2 | % | 1,464,844 | 60.1 | % | 62,561 | 4.3 | % | |||||||||||||||
| Operating expenses |
246,335 | 9.7 | % | 236,784 | 9.7 | % | 9,551 | 4.0 | % | |||||||||||||||
| Franchise fee costs |
91,743 | 3.6 | % | 86,903 | 3.6 | % | 4,840 | 5.6 | % | |||||||||||||||
| General and administrative expenses |
147,300 | 5.8 | % | 141,739 | 5.8 | % | 5,561 | 3.9 | % | |||||||||||||||
| Equity (income) |
(14,649 | ) | (0.6 | )% | (13,700 | ) | (0.6 | )% | (949 | ) | 6.9 | % | ||||||||||||
| Asset impairment and related closure costs |
28,298 | 1.1 | % | — | 0.0 | % | 28,298 | n/m | ||||||||||||||||
| Other (income), net |
(1,100 | ) | 0.0 | % | (3,319 | ) | (0.1 | )% | 2,219 | (66.9 | )% | |||||||||||||
| Total costs and expenses, net |
2,025,332 | 79.8 | % | 1,913,251 | 78.4 | % | 112,081 | 5.9 | % | |||||||||||||||
| Gain on sale of interest in Maidstone Bakeries |
361,075 | (14.2 | )% | — | 0.0 | % | (361,075 | ) | n/m | |||||||||||||||
| Operating income |
872,238 | 34.4 | % | 525,602 | 21.6 | % | 346,636 | 66.0 | % | |||||||||||||||
| Interest (expense) |
(26,642 | ) | (1.1 | )% | (21,134 | ) | (0.9 | )% | (5,508 | ) | 26.1 | % | ||||||||||||
| Interest income |
2,462 | 0.1 | % | 1,950 | 0.1 | % | 512 | 26.3 | % | |||||||||||||||
| Income before income taxes |
848,058 | 33.4 | % | 506,418 | 20.8 | % | 341,640 | 67.5 | % | |||||||||||||||
| Income taxes |
200,940 | 7.9 | % | 186,606 | 7.7 | % | 14,334 | 7.7 | % | |||||||||||||||
| Net income |
647,118 | 25.5 | % | 319,812 | 13.1 | % | 327,306 | 102.3 | % | |||||||||||||||
| Net income attributable to noncontrolling interests |
23,159 | 0.9 | % | 23,445 | 1.0 | % | (286 | ) | (1.2 | )% | ||||||||||||||
| Net income attributable to Tim Hortons Inc. |
$ | 623,959 | 24.6 | % | $ | 296,367 | 12.2 | % | $ | 327,592 | 110.5 | % | ||||||||||||
69
Table of Contents
| n/m | – The comparison is not meaningful. |
| (1) | Rents and royalties revenues consist of (i) royalties, which typically range from 3.0% to 4.5% of gross franchise restaurant sales and (ii) rents, which consist of base and percentage rent in Canada and percentage rent only in the U.S., and typically range from 8.5% to 10.0% of gross franchise restaurant sales. Franchise restaurant sales are reported to us by our franchisees. Franchise restaurant sales are not included in our Consolidated Financial Statements, other than approximately 275 non-owned restaurants, on average whose results of operations are consolidated with ours pursuant to applicable accounting rules. Franchise restaurant sales do, however, result in royalties and rental income, which are included in our franchise revenues, as well as distribution income. The reported franchise restaurant sales (including those consolidated pursuant to applicable accounting rules) were: |
| Fiscal Years | ||||||||
| 2010 | 2009 | |||||||
| Franchised restaurant sales: |
||||||||
| Canada (in thousands of Canadian dollars) |
$ | 5,181,831 | $ | 4,880,934 | ||||
| U.S. (in thousands of U.S. dollars) |
$ | 439,227 | $ | 409,882 | ||||
Revenues
Sales
Our sales include distribution sales, sales from Company-operated restaurants, and sales from variable interest entities that are required to be consolidated pursuant to applicable accounting rules.
Sales for fiscal 2010 increased $51.2 million, or 3.0%, over fiscal 2009, to $1,755.2 million. The increase in sales was primarily driven from our distribution business; however, partially offsetting the increase were lower sales from variable interest entities consolidated in accordance with applicable accounting rules and Company-operated restaurants. Also negatively impacting year-over-year sales growth is the $30.0 million commitment made to restaurant owners which has been recorded as a reduction of sales. Fiscal 2009 also had the benefit of an additional week of sales from the inclusion of a 53rd week of operations, which impacted sales growth in 2010 by approximately 1.7%.
Distribution sales. Distribution sales increased $138.4 million, or 10.7%, from $1,295.7 million to $1,434.1 million. New products managed through our supply chain, continued systemwide sales growth, product mix and higher commodity prices contributed to distribution sales growth. New products managed through the supply chain, including some products from Maidstone Bakeries, represented approximately $120.7 million in incremental sales (and incremental corresponding costs—see below). Systemwide sales growth, which reflects higher same-store sales and sales from a higher number of restaurants, represented approximately $48.8 million of total distribution sales growth. Product mix and pricing related primarily to higher prices for coffee and other commodities due to higher underlying costs also contributed to the sales increase. Distribution sales growth was negatively impacted by the $30.0 million commitment to restaurant owners made in relation to the sale of Maidstone Bakeries in the fourth quarter of 2010. Distribution sales growth was also negatively impacted by approximately 1.9% due to the inclusion of a 53rd week of operations in fiscal 2009, as well as fluctuations in foreign exchange rates.
Distribution sales represented approximately 56.5% of our total revenues in fiscal 2010 compared to 53.1% of our revenues in fiscal 2009. Our revenue mix has shifted towards a higher proportion of distribution sales, due primarily to new products being managed through the supply chain, partially offset by lower sales from our variable interest entities. Sales as a percentage of total revenues were relatively consistent year-over-year at 69.2% in fiscal 2010 as compared to 69.9% in fiscal 2009.
70
Table of Contents
Our distribution revenues are subject to changes related to the underlying costs of key commodities, such as coffee, sugar, etc. Underlying product costs can also be impacted by currency changes. Increases and decreases in product costs may be passed through to franchisees, resulting in higher or lower sales and higher or lower costs of sales from our distribution business. In 2009, we did not pass on all cost increases to our franchisees due to the weaker economic climate. Recently, the restaurant industry has experienced sharp increases across-the-board in the commodities basket. Our primary commodity, coffee, has seen significant increases in the past year. Other key commodities have also seen increases. As a result of these increasing commodity costs, and with our goal to provide the restaurant owner with consistent, predictable pricing over longer periods of time and to secure a stable supply chain, we have extended our forward purchasing beyond our historical pattern of six months, and we now have coverage for our key commodities for the remainder of 2011. Commodity cost increases will be passed on to our restaurant owners in 2011. These commodity cost changes may also impact margins as many of our products are typically priced based on a fixed-dollar mark-up and this can, therefore, create volatility year-over-year.
Company-operated restaurants sales. Company-operated restaurants sales decreased from $24.2 million in fiscal 2009 to $22.2 million in fiscal 2010. We operated on average 20 restaurants in 2010 compared to 26 Company-operated restaurants in 2009, resulting in lower sales. We ended 2010 with 16 Company-operated restaurants in Canada, and four in the U.S., representing in total approximately 0.5% of total systemwide restaurants. On occasion, we may open Company-operated restaurants when we enter new markets in the U.S., and we may also repurchase restaurants from existing franchisees, operate them corporately for a short period of time, and then refranchise these restaurants. As such, Company-operated revenue is impacted by the timing of these events throughout the year and also the type of restaurant (standard or non-standard) that we own.
Variable interest entities’ sales. Variable interest entities’ sales include sales from the consolidation of our previously-held interest in Maidstone Bakeries and from the consolidation of certain non-owned restaurants in accordance with applicable accounting rules. Variable interest entities’ sales were $299.0 million and $384.2 million in fiscal 2010 and 2009, respectively. The decline is mainly due a more significant proportion of output from Maidstone Bakeries being managed and billed through our supply chain. In addition, the sale and de-consolidation of Maidstone Bakeries in October 2010 resulting in only 10 months of sales in fiscal 2010 as compared to fiscal 2009, which had a full year of operations. The majority of non-owned restaurants that are consolidated operate either solely under an operator agreement or are franchised locations participating in our U.S. franchise incentive program. On average, we consolidated approximately 275 non-owned restaurants during fiscal 2010 and 2009. While the overall number of non-owned consolidated restaurants has remained consistent, a greater proportion of U.S. non-owned restaurants are being consolidated as a result of the progression of U.S. restaurants to the owner/operator model from Company-operated restaurants (noted previously). These U.S. locations have historically had lower sales and income than Canadian non-owned restaurants that were previously consolidated. Also contributing to the year-over-year sales decline is the impact of approximately 1.3% from the inclusion of a 53rd week of operations in fiscal 2009.
Foreign exchange. Sales from our U.S. segment are denominated in U.S. dollars and translated into Canadian dollars for reporting of our consolidated results. The strengthening of the Canadian dollar relative to the U.S. dollar decreased the value of reported sales by approximately 1.2% in fiscal 2010 compared to the value that would have been reported had there been no exchange rate movement during fiscal 2010.
Franchise Revenues
Rents and Royalties. Revenues from rents and royalties were $687.0 million in fiscal 2010, an increase of $42.3 million, or 6.6%, over fiscal 2009, ahead of fiscal 2010 systemwide sales growth of 5.3%, unadjusted for currency. Systemwide sales growth was driven by higher same-store sales and sales from new restaurants opened during the year, both of which result in higher royalty and rental revenues because both are typically based, in whole or part, on a percentage of restaurant sales.
71
Table of Contents
Rents and royalty growth was driven by overall systemwide sales growth and lower relief, partially offset by unfavourable foreign exchange. Both Canada and the U.S. (excluding the effect of foreign exchange translation) contributed to our growth in rents and royalties revenues largely in proportion to their overall share of systemwide sales. Continued same-store sales growth provided $19.6 million to our rents and royalties growth, while the addition of 174 new full-serve restaurants in the system (and 2009 restaurants which have not yet been open for more than 12 months) year-over-year contributed approximately $22.7 million. Relief, which was primarily all within our U.S. operations, was lower in fiscal 2010 on a year-to-date basis as compared to fiscal 2009, partially due to foreign exchange and lower relief provided, due mainly from one less week of operations in 2010 and, to a lesser extent, from the closure of restaurants in the New England region. We believe this trend of less relief will continue in 2011 as we focus on our core growth markets in the Northeast and Midwest U.S. and have the benefit of a full year of closures in New England. As previously mentioned, we will be redeploying a portion of savings from New England closure into advertising spend in our other core markets (as described above), which we expect will help drive sales improvements.
Rents and royalties growth was negatively impacted by approximately 1.8% due to an additional week of sales from the inclusion of a 53rd week in fiscal 2009 which we did not benefit from in fiscal 2010.
Franchise Fees. Franchise fees include the sales revenue from initial equipment packages, as well as fees to cover costs and expenses related to establishing a franchisee’s business. In the U.S., we have a franchise incentive program (“FIP”) whereby revenue and related costs from the sale of initial equipment packages are deferred until the franchise restaurant has exceeded and maintained certain sales volume levels and other recognition criteria. This incentive program impacts the timing of revenue recognized on these franchise sales (See “The Application of Critical Accounting Policies—Revenue Recognition”).
Franchise fees were $94.2 million during fiscal 2010 compared to $90.0 million in fiscal 2009. The increase in franchise fees year-over-year is primarily the result of adding 102 co-branded Cold Stone Creamery locations either within existing or new Tim Hortons locations, mainly in Canada. Partially offsetting this increase have been lower franchise fee revenues recognized under our U.S franchise incentive program, and a change in restaurant mix to a higher number of non-standard locations. Our non-standard restaurants utilize a number of unique restaurant formats and attract lower franchise fees per unit than our typical standard format.
In fiscal 2010, we opened a total of 173 standard and non-standard restaurants, excluding self-serve kiosks, consistent with 173 standard and non-standard restaurants openings in 2009. Non-standard restaurants include full serve kiosks and locations in gas and convenience locations, hospitals, grocery stores, universities and office buildings. In addition, we opened 72 self-serve kiosks in 2010 compared to three self-serve kiosks in 2009. While self-serve kiosks represented a disproportionate amount of overall unit growth in fiscal 2010, they did not represent a significant portion of franchise fees as the franchise fees related to these units are significantly lower than franchise fees for full-serve standard and non-standard restaurants, due primarily to the size of the equipment package required. Additionally, we had fewer resales and replacements in 2010, resulting in lower revenues. A “replacement” restaurant refers to a site change that results in a rebuild generally within a one kilometer radius and typically generates a new franchise fee. In addition, we may enter into operator agreements for new restaurant sales, as opposed to full franchise agreements. The amount of franchise fee revenues (and associated costs) are significantly different for operator agreement arrangements as compared to full franchise sales as we retain ownership of the equipment package under operator agreement arrangements.
Foreign exchange. Franchise revenues from our U.S. segment are denominated in U.S. dollars and translated into Canadian dollars for purposes of reporting of our consolidated results. The strengthening of the Canadian dollar relative to the U.S. dollar decreased the value of reported rents and royalties by approximately 0.7% in 2010 compared to the value that would have been reported had there been no exchange rate movement during 2010. Franchise fee revenues are not earned evenly throughout the year, and for the U.S. business, depend largely on the revenue recognition criteria under the FIP program, mentioned previously. As a result, franchise fee revenues for fiscal 2010 were 0.5% lower than the value that would have been reported had there not been a change in the foreign exchange rates in effect at the time these revenues were recognized.
72
Table of Contents
Total Costs and Expenses
Cost of Sales
Cost of sales was $1,527.4 million in fiscal 2010, compared to $1,464.8 million in fiscal 2009, representing an increase of $62.6 million or 4.3%. Cost of sales growth was driven by higher distribution cost of sales, but was partially offset by lower cost of sales from certain consolidated variable interest entities and lower Company-operated restaurant cost of sales. The increase in cost of sales in fiscal 2010 was also reduced in comparative growth terms by approximately 1.8% due to the extra week in operations in fiscal 2009.
Distribution cost of sales. Cost of sales from our distribution business was $148.8 million, or 13.2% higher year-over-year. Higher costs were primarily associated with new products being managed through our supply chain, including some products supplied by Maidstone Bakery, and continued systemwide sales growth along with changes in product mix and higher underlying product costs. Costs associated with sales of new products represented approximately $117.3 million, while systemwide sales growth increased costs by approximately $40.3 million due to continued same-store sales growth and the higher number of system restaurants year-over-year. In addition, changes in product mix and higher product costs represented $17.9 million of the increase. The increase in distribution cost of sales in fiscal 2010 was reduced by approximately 2.0% due to the inclusion of a 53rd week in operations in 2009, as well as fluctuations in foreign exchange rates.
Distribution cost of sales represented 64.1% of our total costs and expenses (excluding our gain on sale of Maidstone Bakeries and asset impairment and related closure costs) in fiscal 2010 as compared to 59.1% of our total costs and expenses in fiscal 2009. Our cost of sales mix has shifted towards a higher proportion of distribution cost of sales due primarily to new products being managed through the supply chain and the cost increases noted above, but is partially offset by lower cost of sales from variable interest entities, and Company-operated restaurants.
Our distribution costs are subject to changes related to the underlying costs of key commodities, such as coffee, sugar, etc. Underlying product costs can also be impacted by currency changes, as was the case this year. Increases and decreases in product costs are largely passed through to franchisees, resulting in higher or lower revenues and higher or lower costs of sales from our distribution business. These changes may also impact margins as many of these products are typically priced based on a fixed-dollar mark-up and can create volatility year-over-year. See “7A. Quantitative and Qualitative Disclosure About Market Risk – Commodity Risks” below.
In connection with the sale of our interest in Maidstone Bakeries we deferred $41.2 million of the gain on the sale associated with the ongoing supply agreement. The supply agreement covers our obligation to purchase donuts and Timbits and extends to early 2016 and, at our option, rights can be extended to late 2017. The fair value liability of the supply agreement that was deferred is being amortized over the remaining term of the obligation to purchase (until early 2016). Approximately $1.3 million was amortized and recognized as a reduction in distribution cost of sales in fiscal 2010. Approximately $8.3 million will be amortized in 2011 and 2012, $7.9 million in 2013, $7.6 million in 2014, $7.2 million in 2015 and $0.6 million in 2016.
Company-operated restaurants cost of sales. Cost of sales associated with Company-operated restaurants includes food, paper, labour and occupancy costs, and varies with the average number and mix (e.g., size, location, and standard or non-standard) of Company-operated restaurants. These costs decreased by $5.0 million in fiscal 2010 from $27.5 million in fiscal 2009 to $22.5 million as a result of six fewer Company-operated restaurants, on average, during the year.
Variable interest entities’ cost of sales. Cost of sales during 2010 compared to 2009 declined $81.2 million year-over-year primarily due to a more significant proportion of our output from Maidstone Bakeries being managed and billed through our supply chain. The offset to this decline is reflected in our distribution cost of sales, as described above. In addition, the sale and de-consolidation of Maidstone Bakeries in the latter half of
73
Table of Contents
2010 further reduced cost of sales year-over-year. We also experienced a change in mix of non-owned restaurants, which for 2010 continued to include a greater proportion of U.S. restaurants, which contribute less to variable interest entities’ cost of sales and income than previously-consolidated Canadian non-owned restaurants. On average, we consolidated approximately 275 non-owned restaurants under applicable accounting standards during fiscal 2010 and 2009. Also contributing to the decline is approximately 1.3% of higher costs of sales due to the inclusion of a 53rd week in 2009.
Foreign exchange. Cost of sales from our U.S. segment are denominated in U.S. dollars and translated into Canadian dollars for reporting of our consolidated results. The strengthening of the Canadian dollar relative to the U.S. dollar decreased the value of reported costs of sales by approximately 1.3% in fiscal 2010 compared to the value that would have been reported had there been no exchange rate movement during fiscal 2010.
Operating Expenses
Total operating expenses, representing primarily rent expense, depreciation and property costs, increased $9.6 million, or 4.0%, in fiscal 2010 as compared to fiscal 2009. Operating expenses growth was driven by higher rent expense, primarily as a result of 91 additional properties that were leased and then subleased to franchisees and higher percentage rent on certain properties resulting from increased restaurant sales. Depreciation expense was also higher as the total number of properties we either own or lease and then subleased to franchisees increased to 2,947 in 2010 from 2,849 in 2009. The 53rd week of operations in 2009 lowered operating expense growth by approximately 2.0%.
Operating expenses from our U.S. segment are denominated in U.S. dollars and translated into Canadian dollars for reporting of our consolidated results. The strengthening of the Canadian dollar relative to the U.S. dollar decreased the value of reported operating expenses by approximately 1.4% in fiscal 2010 compared to the value that would have been reported had there been no exchange rate movement during fiscal 2010.
Franchise Fee Costs
Franchise fee costs include costs of equipment sold to franchisees as part of the commencement of their restaurant business, including the introduction of our co-branding initiatives into existing locations, as well as training and other costs necessary to ensure a successful restaurant opening.
Franchise fee costs increased $4.8 million in fiscal 2010 to $91.7 million from $86.9 million in fiscal 2009. These higher costs were due to the addition of 102 Cold Stone Creamery co-branded locations (78 in Canada and 24 in U.S.), higher support costs and expenses associated with establishing a franchisee’s business, and amortization expense related to the intangible asset associated with our exclusive development rights for Cold Stone Creamery in Canada. Partially offsetting these higher costs were a lower number of U.S. franchise sales recognized under the FIP and, therefore, lower franchise fee costs and expenses recognized.
Franchise fee costs from our U.S. segment are denominated in U.S. dollars and translated into Canadian dollars for reporting our consolidated results. Franchise fee costs are not incurred evenly throughout the year and, for the U.S., depend largely on the revenue recognition criteria mentioned previously. Franchise fee costs for fiscal 2010 were 0.8% lower than the value that would have been reported had there not been a change in the foreign exchange rates in effect at the time these costs were recognized.
General and Administrative Expenses
General and administrative expenses are comprised of expenses associated with corporate and administrative functions that support current operations and provide the infrastructure to support future growth. In general, our objective is for general and administrative expense growth not to exceed systemwide sales growth.
74
Table of Contents
General and administrative expenses increased $5.6 million, or 3.9%, to $147.3 million in fiscal 2010 from $141.7 million in fiscal 2009. General and administrative expenses for fiscal 2010 included $4.5 million related to various professional advisory and project-related fees incurred to support our long-term international and other strategic initiatives planning, hospitality and co-branding initiatives, as well as fees associated with our sale of Maidstone Bakeries. In addition, we incurred higher salary and benefits to support the growth of our business, increased spending related to promotional activities, higher shareholder communication costs and higher depreciation. Stock-based compensation increased salary and benefits by $2.0 million, which was directly attributable to the increase in our share price.
The increase in general and administrative expenses in fiscal 2010 more than offset the $7.3 million related to professional advisory fees, shareholder-related transaction costs, and filing fees associated with our reorganization as a Canadian public company in 2009, which did not recur in 2010. The additional week of operations in fiscal 2009 impacted, and partially offset, the year-over-year increase in general and administrative expenses by approximately 1.7%.
As a percentage of revenues, general and administrative expenses remained flat at 5.8% in both fiscal 2010 and fiscal 2009. There can be quarterly fluctuations in general and administrative expenses due to timing of recurring events or the impact of significant, corporate-wide initiatives intended to deliver long-term shareholder value.
Our U.S. segment general and administrative expenses are denominated in U.S. dollars and translated into Canadian dollars for reporting our consolidated results. The strengthening of the Canadian dollar relative to the U.S. dollar decreased the value of reported general and administrative expenses by approximately 1.4% in fiscal 2010 compared to the value that would have been reported had there been no exchange rate movement during fiscal 2010.
Equity Income
Equity income relates to income from equity investments in joint ventures and other investments over which we exercise significant influence but which do not meet the consolidation requirements under applicable accounting rules. Our most significant equity investment is our 50% interest in TIMWEN Partnership, which leases Canadian Tim Hortons/Wendy’s combination restaurants to owners or operators.
Equity income in fiscal 2010 was $14.6 million compared to $13.7 million in fiscal 2009, representing an increase of $0.9 million. Equity income from our TIMWEN Partnership is not expected to grow significantly as we are unlikely to add any new properties to this venture in the future.
Asset Impairment and Related Closure Costs
In 2010, asset impairment and related closure cost charges of $28.3 million were recorded in our U.S. operating segment in the latter half of 2010 based on our decision to close 34 restaurants and 18 self-serve kiosks in the New England region and two restaurants in our Portland market.
Other Income, net
Other income, net, includes amounts that are not directly derived from our primary businesses. This includes gains and losses on asset sales, other asset write-offs, and foreign exchange gains and losses. In fiscal 2010, other income, net, was $1.1 million versus $3.3 million in fiscal 2009. The $2.2 million decrease was primarily the result of a $2.4 million gain on the sale of a property in 2009 which did not recur in 2010.
Interest Expense
Total interest expense, including interest on our Senior Notes (see “Liquidity and Capital Resources—Overview”) and our credit facilities and capital leases, was $26.6 million in fiscal 2010 and $21.1 million in
75
Table of Contents
fiscal 2009, representing an increase of $5.5 million. Higher interest expense is primarily related to a higher weighted-average interest rate on our long-term debt, and includes $1.6 million in settlement losses arising from the early termination and settlement of $130 million of interest rate swaps in fiscal 2010. These settlements resulted from our prepayment of our $300 million term loan which would have matured on February 2011. In addition, interest from additional capital leases contributed $1.1 million to higher interest expense.
Our Senior Notes, which were issued in the second quarter of 2010, and a subsequent reissue in the same series in the fourth quarter of 2010, have a fixed interest rate over seven years, whereas our long-term debt that was retired had a higher variable component, which resulted in lower rates historically.
Interest Income
Interest income is comprised of interest earned from our cash and cash equivalents as well as imputed interest on our FIP and other notes receivable. Interest income was $2.5 million in fiscal 2010 and $2.0 million in fiscal 2009. The increase of $0.5 million was a result of higher interest rates in Canada and higher cash balances due to proceeds received from the sale of Maidstone Bakeries, partially offset by a reduction in interest earned from our FIP and other programs.
Income Taxes
Total tax expense was $200.9 million in fiscal 2010 and $186.6 million in fiscal 2009. Our effective income tax rate in fiscal 2010 was 23.7% compared to 36.8% in fiscal 2009. Our fiscal 2010 expected tax rate of 32% was impacted positively by approximately 8% resulting from the favourable tax treatment of the divestiture of our interest in Maidstone Bakeries, offset by the negative impact of approximately 1% resulting from the U.S. impairment charge and related restaurant closure costs. The tax consequences of the Maidstone Bakeries divestiture resulted in the utilization of approximately $43 million of foreign tax credits which were entirely offset by a valuation allowance. Given the nature of the Maidstone Bakeries divestiture, we continue to maintain a full valuation allowance on remaining deferred tax assets in the U.S. The fiscal 2009 effective tax rates were negatively impacted primarily by a tax charge resulting from our reorganization of the Company as a Canadian public company. We expect our effective tax rate will be approximately 30% in fiscal 2011, although some volatility may be experienced between quarters. The expected effective tax rate does not include the impact of any new tax matters such as unanticipated audit issues by taxation authorities or changes in tax law, rates or regulations in jurisdictions in which we operate.
There were revisions proposed to the U.S. Internal Revenue Code of 1986, which would affect the federal income taxation of foreign earnings. On August 10, 2010, President Obama signed the Education Jobs and Medicaid Assistance Act of 2010 that included certain revisions to these original proposals. We had previously disclosed in connection with our public company reorganization, that the original proposals, which we referred to at the time as the “Obama proposals,” if enacted, in whole or in part, may increase our effective tax rate by up to 3.5% commencing in the year the proposals became effective. Management has determined that the proposals, as enacted, will not result in an increase in our effective tax rates.
The determination of income tax expense takes into consideration amounts that may be needed to cover exposure for open tax years. For federal tax purposes, Canadian and U.S. tax jurisdictions remain open to examination for taxation years commencing in fiscal 2005 and fiscal 2007, respectively. The 2004 audit was completed for Canada during fiscal 2010 and resulted in no material change in taxes. The Canada Revenue Agency is currently conducting an examination of various Canadian subsidiaries of the Company for fiscal 2005 and subsequent taxation years. In fiscal 2008, the Internal Revenue Service completed its examination of the Wendy’s consolidated tax group which included Tim Hortons Inc. up to September 29, 2006. Income tax returns filed with various provincial and state jurisdictions are generally open to examination for periods of three to five years subsequent to the filing of the respective return. We do not currently expect any material impact on earnings to result from the resolution of matters related to open tax years; however, actual settlements may differ from amounts accrued.
76
Table of Contents
The provisions of the tax sharing agreement with Wendy’s, as subsequently amended on November 7, 2007 (the “Agreement”), set forth the principles and responsibilities of Wendy’s and the Company regarding the allocation of taxes, audits and other tax matters relating to periods when we were part of the same U.S. federal consolidated or state and local combined tax filing group. The Agreement is applicable for all taxation periods up to September 29, 2006. Either we or Wendy’s may be required to reimburse the other party for the use of tax attributes while we filed U.S. consolidated or state and local combined returns, as a result of audits or similar proceedings giving rise to “adjustments” to previously filed returns, in accordance with the terms of the Agreement. For Competent Authority purposes only, two taxation years remain open to adjustment which could also result in payments to be made by one party to the other for the use of the other party’s tax attributes. Also, disagreements concerning interpretation of the Agreement or use of tax attributes in open and/or closed years may occur, which, in accordance with the terms of the Agreement, could result in arbitration and the payment by one party to the other for the use of the other party’s tax attributes. No payments have been made by either party to the other under the Agreement during fiscal 2010.
We have not recorded deferred taxes on undistributed earnings and other temporary differences of certain subsidiaries which are considered to be indefinitely reinvested. If management’s intentions with respect to these undistributed earnings and other temporary differences were to change in the future, deferred taxes may need to be provided that could materially impact our financial results.
Net income attributable to noncontrolling interests
Net income attributable to noncontrolling interests relates to the minority interests arising from certain non-owned restaurants we consolidate in accordance with applicable accounting rules and to the consolidation of our previously-held interest in Maidstone Bakeries. As a result of the sale of our interest in the bakery facility, we will no longer be consolidating the operations and net income of Maidstone Bakeries. We consolidated on average 275 restaurants in accordance with applicable accounting rules during fiscal 2010 and fiscal 2009 and consolidated Maidstone Bakeries until October 29, 2010.
Comprehensive Income
In fiscal 2010, comprehensive income attributable to Tim Hortons Inc. was $600.4 million compared to $231.7 million in fiscal 2009. Net income increased $327.3 million in fiscal 2010 from fiscal 2009, as discussed above. Other comprehensive income (loss) included a translation adjustment loss of $22.1 million in fiscal 2010, as compared to a translation adjustment loss of $62.3 million in fiscal 2009. Translation adjustment losses and gains arise primarily from the translation of our U.S. net assets into our reporting currency, Canadian dollars, at the period-end rates. The remainder of the year-over-year change in other comprehensive income (loss) is attributable to losses of $1.5 million and $2.4 related to cash flow hedges, net of taxes in fiscal 2010 and 2009, respectively.
The exchange rates were Cdn$0.9946, Cdn$1.0510, and Cdn$1.2092 for US$1.00 on January 2, 2011, January 3, 2010, and December 28, 2008, respectively.
Fiscal 2009 Compared to Fiscal 2008
We adopted a new accounting rule effective January 4, 2010, which resulted in the full consolidation of our previously-held interest in Maidstone Bakeries and the consolidation of approximately 130-145 additional non-owned restaurants. This accounting rule was applied retroactively and, as such, the results of operations for both fiscal 2009 and 2008 have been adjusted to reflect these changes.
77
Table of Contents
Below is a summary of comparative results of operations and a more detailed discussion of results for fiscal 2009 and 2008. Financial definitions can be found immediately following “Liquidity and Capital Resources.”
| Fiscal 2009 Compared to Fiscal 2008 | Change from Prior Year |
|||||||||||||||||||||||
| 2009 | % of Revenues |
2008 | % of Revenues |
$ | % | |||||||||||||||||||
| (in thousands, except where noted) | ||||||||||||||||||||||||
| Revenues |
||||||||||||||||||||||||
| Sales |
$ | 1,704,065 | 69.9 | % | $ | 1,541,882 | 69.2 | % | $ | 162,183 | 10.5 | % | ||||||||||||
| Franchise revenues: |
||||||||||||||||||||||||
| Rents and royalties(1) |
644,755 | 26.4 | % | 593,483 | 26.6 | % | 51,272 | 8.6 | % | |||||||||||||||
| Franchise fees |
90,033 | 3.7 | % | 93,808 | 4.2 | % | (3,775 | ) | (4.0 | )% | ||||||||||||||
| 734,788 | 30.1 | % | 687,291 | 30.8 | % | 47,497 | 6.9 | % | ||||||||||||||||
| Total revenues |
2,438,853 | 100.0 | % | 2,229,173 | 100.0 | % | 209,680 | 9.4 | % | |||||||||||||||
| Costs and expenses |
||||||||||||||||||||||||
| Cost of sales |
1,464,844 | 60.1 | % | 1,313,036 | 58.9 | % | 151,808 | 11.6 | % | |||||||||||||||
| Operating expenses |
236,784 | 9.7 | % | 214,935 | 9.6 | % | 21,849 | 10.2 | % | |||||||||||||||
| Franchise fee costs |
86,903 | 3.6 | % | 87,486 | 3.9 | % | (583 | ) | (0.7 | )% | ||||||||||||||
| General and administrative expenses |
141,739 | 5.8 | % | 130,846 | 5.9 | % | 10,893 | 8.3 | % | |||||||||||||||
| Equity (income) |
(13,700 | ) | (0.6 | )% | (14,279 | ) | (0.6 | )% | 579 | (4.1 | )% | |||||||||||||
| Asset impairment and related closure costs |
— | 0.0 | % | 21,266 | 1.0 | % | (21,266 | ) | n/m | |||||||||||||||
| Other (income), net |
(3,319 | ) | (0.1 | )% | (2,564 | ) | (0.1 | )% | (755 | ) | 29.4 | % | ||||||||||||
| Total costs and expenses, net |
1,913,251 | 78.4 | % | 1,750,726 | 78.5 | % | 162,525 | 9.3 | % | |||||||||||||||
| Operating income |
525,602 | 21.6 | % | 478,447 | 21.5 | % | 47,155 | 9.9 | % | |||||||||||||||
| Interest (expense) |
(21,134 | ) | (0.9 | )% | (24,558 | ) | (1.1 | )% | 3,424 | (13.9 | )% | |||||||||||||
| Interest income |
1,950 | 0.1 | % | 4,926 | 0.2 | % | (2,976 | ) | (60.4 | )% | ||||||||||||||
| Income before income taxes |
506,418 | 20.8 | % | 458,815 | 20.6 | % | 47,603 | 10.4 | % | |||||||||||||||
| Income taxes |
186,606 | 7.7 | % | 150,309 | 6.7 | % | 36,297 | 24.1 | % | |||||||||||||||
| Net income |
319,812 | 13.1 | % | 308,506 | 13.8 | % | 11,306 | 3.7 | % | |||||||||||||||
| Net income attributable to noncontrolling interests |
23,445 | 1.0 | % | 23,828 | 1.1 | % | (383 | ) | (1.6 | )% | ||||||||||||||
| Net income attributable to Tim Hortons Inc. |
$ | 296,367 | 12.2 | % | $ | 284,678 | 12.8 | % | $ | 11,689 | 4.1 | % | ||||||||||||
| n/m | – The comparison is not meaningful. |
| (1) | Rents and royalties revenues consist of (i) royalties, which typically range from 3.0% to 4.5% of gross franchise restaurant sales and (ii) rents, which consist of base and percentage rent in Canada and percentage rent only in the U.S., and typically range from 8.5% to 10.0% of gross franchise restaurant sales. Franchise restaurant sales are reported to us by our franchisees. Franchise restaurant sales are not included in our Consolidated Financial Statements, other than approximately 275 and 250 non-owned restaurants on average in fiscal 2009 and fiscal 2008, respectively, whose results of operations are consolidated with ours pursuant to ASC 810. Franchise restaurant sales do, however, result in royalties and rental income, which are included in our franchise revenues, as well as distribution income. The reported franchise restaurant sales (including those consolidated pursuant to ASC 810) were: |
| Fiscal Years | ||||||||
| 2009 | 2008 | |||||||
| Franchised restaurant sales: |
||||||||
| Canada (in thousands of Canadian dollars) |
$ | 4,880,934 | $ | 4,546,027 | ||||
| U.S. (in thousands of U.S. dollars) |
$ | 409,882 | $ | 345,429 | ||||
78
Table of Contents
Revenues
Sales
Our sales include distribution sales, sales from Company-operated restaurants, and sales from variable interest entities that are required to be consolidated pursuant to ASC 810.
Sales during fiscal 2009 were $1,704.1 million compared to $1,541.9 million in fiscal 2008, representing an increase of $162.2 million, or 10.5%, year-over-year. Sales growth was driven primarily by higher distribution sales and higher sales from variable interest entities, but was partially offset by lower Company-operated restaurant sales. Sales growth for fiscal 2009 as compared to fiscal 2008 was positively impacted by approximately 1.8% due to an additional week of sales from the inclusion of a 53rd week of operations.
Distribution sales. Distribution sales increased $156.6 million, or 13.7%, from $1,139.1 million to $1,295.7 million. New products managed through our supply chain, continued systemwide sales growth, product mix, higher commodity prices, the inclusion of a 53rd week, and foreign exchange contributed to distribution sales growth. New products managed through the supply chain represented approximately $64.0 million in incremental sales (and incremental corresponding costs—see below). Systemwide sales growth, which reflects higher same-store sales and sales from a higher number of restaurants, represented approximately $44.4 million of total distribution sales growth. Product mix and pricing related primarily to higher prices for coffee and other commodities due to higher underlying costs also contributed to the sales increase. We did not pass on all of these cost increases during fiscal 2009, in order to help support our franchisees’ businesses and our customers during the challenging economic times of 2009. Distribution sales growth over fiscal 2008 was also favourably impacted by approximately 1.9% due to the inclusion of a 53rd week of operations, and foreign exchange also contributed positively to the growth.
Distribution sales represented approximately 53.1% of our total revenues in fiscal 2009 compared to 51.1% of our revenues in fiscal 2008. Our revenue mix has shifted towards a higher proportion of distribution sales, due primarily to new products being managed through the supply chain, with some offset by lower sales from Company-operated restaurants and variable interest entities. As a result, sales as a percentage of total revenues was relatively consistent year-over-year at 69.9% in 2009 and 69.2% in 2008.
Company-operated restaurants sales. Lower sales were mainly due to a decrease in the number of Company-operated restaurants in 2009. While there was an additional week of sales from the inclusion of a 53rd week in 2009, the impact on Company-operated restaurant sales was not significant. In 2009, we operated, on average, 26 Company-operated restaurants compared to 53 Company-operated restaurants in 2008, resulting in a $14.1 million reduction in Company-operated restaurant sales year-over-year. Our Company-operated restaurant count decreased year-over-year as we focused on transitioning many of our Company-operated restaurants, particularly in the U.S., to either franchise or operator agreements. In addition, we closed 11 Company-operated restaurants in our southern New England markets, ten in the fourth quarter of 2008 and one early in the first quarter of 2009. We ended 2009 with 13 Company-operated restaurants in Canada, and 5 in the U.S.
Variable interest entities’ sales. Sales from the consolidation of variable interest entities increased 5.4%, or $19.7 million, from $364.5 million in 2008 to $384.2 million in 2009. The increase was primarily attributable to increased sales at our Maidstone Bakeries facility; however, the increase in sales is disproportionate to the increase in cost of sales experienced by the bakery (see below). The majority of non-owned restaurants that are consolidated operate either under an operator agreement or are franchised locations, many of which are participating in our U.S. franchise incentive program. On average, we consolidated approximately 250 to 275 non-owned restaurants during 2008 and 2009. While the overall number of non-owned consolidated restaurants increased, we had a gradual shift towards a greater proportion of U.S. non-owned restaurants being consolidated as a result of the progression of U.S. restaurants to the owner/operator model from Company-operated restaurants (noted above). These U.S. locations have historically had lower sales and income than Canadian non-owned restaurants that were previously consolidated. Sales from variable interest entities were favourably impacted by approximately 1.7% due to the inclusion of a 53rd week of operations.
79
Table of Contents
Foreign exchange. Sales from our U.S. segment are denominated in U.S. dollars and translated into Canadian dollars for reporting of our consolidated results. The weakening of the Canadian dollar relative to the U.S. dollar increased the value of reported sales by approximately 1.0% in fiscal 2009 compared to the value that would have been reported had there been no exchange rate movement during fiscal 2009.
Franchise Revenues
Rents and Royalties. Revenues from rents and royalties increased $51.3 million, or 8.6%, in fiscal 2009 over 2008, which was consistent with the fiscal 2009 systemwide sales growth of 8.6%, unadjusted for currency. Systemwide sales growth was driven by higher same-store sales and sales from new restaurants opened during the year, both of which result in higher royalty and rental revenues because both are typically based, in whole or part, on a percentage of restaurant sales.
Rents and royalty growth was driven by overall systemwide sales growth, partially offset by additional relief provided to certain franchisees in U.S. markets. In addition, the transition of Company-operated restaurants to either franchises or operator agreements contributed to the growth in rents and royalties revenues. Higher relief in 2009, which was all in our U.S. operations, was primarily related to either restaurants that were open for less than twenty-four months or restaurants that were previously operated as Company restaurants and transitioned to the owner-operator model.
During 2009, both Canada and the U.S. (excluding the effect of foreign exchange translation) contributed to our growth in rents and royalties revenues, largely in proportion to their overall share of systemwide sales. Continued same-store sales growth provided $21.9 million to our rents and royalties growth, while the addition of 173 new full-serve restaurants in the system year-over-year contributed approximately $19.1 million. Rents and royalties growth was positively impacted by approximately 1.8% due to an additional week of sales from the inclusion of a 53rd week, and foreign exchange contributed to the growth rates in 2009.
Franchise Fees . Franchise fees include the sales revenue from initial equipment packages, as well as fees to cover costs and expenses related to establishing a franchisee’s business. In the U.S., we have a franchise incentive program (“FIP”) whereby revenue and related costs from the sale of initial equipment packages are deferred until the franchise restaurant has exceeded and maintained certain sales volume levels and other recognition criteria. This incentive program impacts the timing of revenue recognized on these franchise sales (See “The Application of Critical Accounting Policies—Revenue Recognition”).
Franchise fees were $90.0 million during fiscal 2009 compared to $93.8 million in fiscal 2008. The decline in franchise fees year-over-year is primarily the result of fewer units sold and a change in restaurant mix to greater non-standard locations. Our non-standard restaurants utilize a number of unique restaurant formats and resulted in lower franchise fees per unit than our typical non-standard format. Partially offsetting this decline in revenue were higher revenues recognized under our FIP in the U.S.
In 2009, we opened a total of 173 standard and non-standard restaurants, excluding self-serve kiosks, compared to 193 standard and non-standard restaurants openings in 2008. Non-standard restaurants include kiosks and locations in gas and convenience locations, hospitals, grocery stores, universities and office buildings. In addition, we opened 3 self-serve kiosks in 2009 compared to 73 self-serve kiosks in 2008. While self-serve kiosks represented a disproportionate amount of overall unit growth in fiscal 2008, they did not represent a significant portion of franchise fees as the franchise fees related to these units are significantly lower than franchise fees for full-serve standard and non-standard restaurants, due primarily to the size of the equipment package required. Additionally, lower revenues from resales and replacements were due primarily to a lower number of resales and replacements in 2009. A “replacement” restaurant refers to a site change that results in a rebuild generally within a one kilometer radius and typically generates a new franchise fee. In addition, we may enter into operator agreements for new restaurant sales, as opposed to full franchise agreements. The amount of
80
Table of Contents
franchise fee revenues (and associated costs) are significantly different for operator agreement arrangements as compared to full franchise sales.
Foreign exchange. Franchise revenues from our U.S. segment are denominated in U.S. dollars and translated into Canadian dollars for purposes of reporting of our consolidated results. The weakening of the Canadian dollar relative to the U.S. dollar increased the value of reported rents and royalties by approximately 0.6% in 2009 compared to the value that would have been reported had there been no exchange rate movement during 2009. Franchise fee revenues are not earned evenly throughout the year, and for the U.S. business, depend largely on the revenue recognition criteria under the FIP program, mentioned previously. As a result, franchise fee revenues for fiscal 2009 were 1.8% higher than the value that would have been reported had there not been a change in the foreign exchange rates in effect at the time these revenues were recognized.
Total Costs and Expenses
Cost of Sales
Cost of sales was $1,464.8 million in fiscal 2009, compared to $1,313.0 million in fiscal 2008, representing an increase of $151.8 million or 11.6%. Cost of sales growth was driven by higher distribution cost of sales and higher cost of sales from our consolidated variable interest entities, but was partially offset by lower Company-operated restaurant cost of sales. The extra week of operations, due to the inclusion of a 53rd week in fiscal 2009, increased cost of sales by approximately 1.9%.
Distribution cost of sales. Cost of sales from our distribution business was $144.8 million, or 14.7% higher year-over-year. Higher costs were primarily associated with new products being managed through our supply chain, and continued systemwide sales growth along with changes in product mix and higher underlying product costs. Costs associated with sales of new products represented approximately $58.6 million, while systemwide sales growth increased costs by approximately $38.4 million due to continued same-store sales growth and the higher number of system restaurants year-over-year. In addition, changes in product mix and higher product costs represented $31.5 million of the increase. Distribution cost of sales was higher by approximately 2.0% compared to fiscal 2008 due to the inclusion of a 53rd week, and foreign exchange accounted for the remainder of cost of sales growth increase.
The rate of growth in distribution cost of sales in fiscal 2009 was higher than the corresponding rate of growth in distribution sales in fiscal 2009 due primarily to higher product costs, including increases in underlying commodity costs such as coffee and sugar and the impact of foreign currency fluctuations, most of which (but not all) were passed on to franchisees.
Distribution cost of sales represented 59.1% of our total costs and expenses in fiscal 2009 as compared to 57.0% of our total costs and expenses in fiscal 2008 (excluding the asset impairment and related closure costs). Our cost of sales mix has shifted towards a higher proportion of distribution cost of sales due primarily to new products being managed through the supply chain and the cost increases noted above (some of which were not fully passed on to franchisees), but is somewhat offset by lower cost of sales from fewer Company-operated restaurants.
Company-operated restaurants cost of sales. Cost of sales associated with Company-operated restaurants includes food, paper, labour and occupancy costs, and varies with the average number and mix (e.g., size, location, and standard or non-standard) of Company-operated restaurants. These costs decreased by $17.4 million in fiscal 2009 from $44.9 million in fiscal 2008 as a result of 27 fewer Company-operated restaurants, on average, during the year.
Variable interest entities’ cost of sales. Cost of sales increased $24.4 million year-over-year due in large part to higher commodity cost pressures experienced by our previously-consolidated bakery facility. Maidstone
81
Table of Contents
Bakeries produces bakery products, which do not necessarily have the same growth rates as total systemwide sales. In fiscal 2009, commodity cost increases at the bakery were not passed on to our franchisees. This was one way we helped to support our franchisees’ businesses and customers during these challenging economic times. The inclusion of a 53rd week also resulted in approximately 1.8% of higher costs of sales. In addition, we consolidated, on average, approximately 250 to 275 non-owned restaurants under ASC 810 during fiscal 2008 and 2009. However, we had a gradual shift towards a greater proportion of certain U.S. non-owned restaurants requiring consolidation, which historically have lower costs per restaurant than certain Canadian non-owned restaurants.
Foreign exchange. Cost of sales from our U.S. segment are denominated in U.S. dollars and translated into Canadian dollars for reporting of our consolidated results. The weakening of the Canadian dollar relative to the U.S. dollar increased the value of reported costs of sales by approximately 1.1% in fiscal 2009 compared to the value that would have been reported had there been no exchange rate movement during fiscal 2009.
Operating Expenses
Total operating expenses, representing primarily rent expense, depreciation and property costs, increased by $21.8 million in fiscal 2009 as compared to fiscal 2008, representing an increase of 10.2%. Operating expenses growth was driven by higher rent expense, primarily as a result of 87 additional properties that were leased and then subleased to franchisees and higher percentage rent on certain properties resulting from increased restaurant sales. Depreciation expense was also higher as the total number of properties we either own or lease and then subleased to franchisees increased to 2.849 in 2009 from 2,726 in 2008. In addition, operating expenses were higher by approximately 2.1% due to the inclusion of a 53rd week. Foreign exchange translation also increased operating expenses (see below). We also had higher project and related support costs, such as salaries, property maintenance, and higher other expenses.
Operating expenses from our U.S. segment are denominated in U.S. dollars and translated into Canadian dollars for reporting of our consolidated results. The weakening of the Canadian dollar relative to the U.S. dollar increased the value of reported operating expenses by approximately 1.2% in fiscal 2009 compared to the value that would have been reported had there been no exchange rate movement during fiscal 2009.
Franchise Fee Costs
Franchise fee costs include costs of equipment sold to franchisees as part of the commencement of their restaurant business, as well as training and other costs necessary to ensure a successful restaurant opening.
Franchise fee costs declined $0.6 million in fiscal 2009 to $86.9 million from $87.5 million in fiscal 2008. Costs declined primarily due to a fewer number of standard restaurant openings, fewer resales and replacements and a higher number of restaurants opened as operator agreements versus full franchise agreements, which results in lower costs (and associated revenues). Partially offsetting these lower costs were a higher number of U.S. franchise sales recognized under the FIP resulting in recognition of the associated costs, and, higher support costs, generally associated with establishing and/or developing our franchised restaurants.
Franchise fee costs from our U.S. segment are denominated in U.S. dollars and translated into Canadian dollars for reporting our consolidated results. Franchise fee costs are not incurred evenly throughout the year and, for the U.S., depend largely on the revenue recognition criteria mentioned previously. As a result, franchise fee costs for fiscal 2009 were 1.8% higher than the value that would have been reported had there not been a change in the foreign exchange rates in effect at the time these costs were recognized.
82
Table of Contents
General and Administrative Expenses
General and administrative expenses are comprised of expenses associated with corporate and administrative functions that support current operations and provide the infrastructure to support future growth.
General and administrative expenses increased $10.9 million, or 8.3%, to $141.7 million in fiscal 2009 from $130.8 million in fiscal 2008. General and administrative expenses for fiscal 2009 included $7.3 million related to professional advisory fees, shareholder-related transaction costs, and filing fees associated with our reorganization as a Canadian public company. In addition, higher salary and benefit expenses and foreign exchange resulting from the translation of our general and administrative expenses from U.S. operations (see below) also increased expenses in fiscal 2009. The additional week of operations in fiscal 2009 contributed approximately 1.7% of the increase. Partially offsetting these higher expenses was the $2.5 million management restructuring charge, net of savings, related to changes in senior management that occurred in 2008 that did not recur in 2009.
As a percentage of revenues, general and administrative expenses decreased marginally from 5.9% in 2008 to 5.8% in 2009. There can be quarterly fluctuations in general and administrative expenses due to timing of recurring expenses or certain other events that may impact growth rates in any particular quarter.
Our U.S. segment general and administrative expense is denominated in U.S. dollars and translated into Canadian dollars for reporting our consolidated results. The weakening of the Canadian dollar relative to the U.S. dollar increased the value of reported general and administrative expenses by approximately 1.1% in fiscal 2009 compared to the value that would have been reported had there been no exchange rate movement during fiscal 2009.
Equity Income
Equity income relates to income from equity investments in joint ventures and other investments over which we exercise significant influence but which do not meet the consolidation requirements under ASC 810. Our most significant equity investment is our 50% interest in TIMWEN Partnership which leases Canadian Tim Hortons/Wendy’s combination restaurants.
Equity income decreased $0.6 million from $14.3 million in fiscal 2008 to $13.7 million in fiscal 2009. Equity income from our TIMWEN Partnership is not expected to grow significantly as we are unlikely to add any new properties to this venture in the future.
Asset Impairment and Related Closure Costs
In 2008, asset impairment and related closure costs of $21.3 million were incurred relating to the decision to close 11 restaurants in two southern New England markets (Hartford and Providence), of which 10 were closed in December 2008 and one was closed in early 2009.
Other Income, net
Other income, net, includes amounts that are not directly derived from our primary businesses. This includes gains and losses on asset sales, other asset write-offs, and foreign exchange gains and losses. In fiscal 2009, other income, net, was $3.3 million versus $2.6 million in fiscal 2008. The $0.8 million increase was primarily the result of a gain on the sale of a property in 2009 of $2.4 million, partially offset by lower foreign exchange gains in 2009.
83
Table of Contents
Interest Expense
Total interest expense, including interest paid on our credit facilities, decreased $3.4 million to $21.1 million in fiscal 2009 primarily as a result of lower effective interest rates on our term debt, partially offset by higher interest expense due to a higher number of capital leases during fiscal 2009 over 2008.
Interest Income
Interest income is comprised of interest earned from our cash and cash equivalents as well as imputed interest on our FIP and other notes receivable. Interest income was $1.9 million in fiscal 2009 and $4.9 million in fiscal 2008. The decrease of $3.0 million was primarily a result of lower overall rates of return on cash and cash equivalents.
Income Taxes
Our effective income tax rate in fiscal 2009 was 36.8% compared to 32.8% in 2008, near our revised 2009 targeted range of between 37% and 39%, which was adjusted to include the impact of the public company reorganization transaction. As previously disclosed, the variance between years was primarily due to the tax effects of the completion of the public company merger on September 28, 2009, as approved by stockholders of the Company on September 22, 2009, and the subsequent reorganization of the Company and its subsidiaries (collectively “the Reorganization”). The discrete items resulting from the Reorganization that contributed to the increase in the 2009 effective tax rate included a valuation allowance relating to the uncertainty of realizing $18.7 million of deferred tax assets relating to U.S. operations, U.S. withholding tax expense of $7.8 million, and other tax charges of $4.8 million. These expenses were offset by the reversal of $11.4 million of previously accrued Canadian withholding taxes. We expect our effective tax rate will be approximately 32% in 2010, although some volatility may be experienced between quarters. The expected effective tax rate does not include the impact of new tax matters such as unanticipated audit issues by taxation authorities or changes in tax law, rates or regulations in jurisdictions in which we operate.
The determination of income tax expense takes into consideration amounts that may be needed to cover exposure for open tax years. The Canada Revenue Agency is currently conducting an examination of various Canadian subsidiaries of the Company for 2004 and subsequent taxation years. The 2003 audit was completed for Canada during 2009 and resulted in no material change in income taxes. The Internal Revenue Service completed in a previous year its examination of the Wendy’s consolidated tax group which included Tim Hortons Inc. up to September 29, 2006. In addition, income tax returns filed with various provincial and state jurisdictions are generally open to examination for periods of three to five years subsequent to the filing of the respective return. We do not currently expect any material impact on earnings to result from the resolution of matters related to open tax years; however, actual settlements may differ from amounts accrued.
We are party to a tax sharing agreement with Wendy’s, as subsequently amended on November 7, 2007 (the “agreement”), which sets forth the principles and responsibilities of Wendy’s and the Company regarding the allocation of taxes, audits and other tax matters relating to periods when we were part of the same U.S. federal consolidated or state and local combined tax filing group. The agreement is applicable for all taxation periods up to September 29, 2006. Commencing September 30, 2006, we became a standalone public company and, as a result, we file all U.S. tax returns independently from Wendy’s from that date forward. Either we or Wendy’s may be required to reimburse the other party for the use of tax attributes while we filed U.S. consolidated or state and local combined returns, as a result of audits or similar proceedings giving rise to “adjustments” to previously filed returns, in accordance with the terms of the agreement. As several years remain open to review and adjustment by taxation authorities, payments may be made by one party to the other for the use of the other party’s tax attributes. No payments have been made by either party to the other under this agreement during fiscal 2009.
84
Table of Contents
Net income attributable to noncontrolling interests
Net income attributable to noncontrolling interests relates to the minority interests arising from the consolidation of variable interest entities, under ASC 810, which included our previously-held interest in Maidstone Bakeries and continues to include certain non-owned restaurants. In fiscal 2008 and 2009, we consolidated on average, approximately 250 to 275 restaurants under ASC 810. Net income attributable to noncontrolling interests represented 1.0% and 1.1% of total revenues in fiscal 2009 and 2008, respectively.
Comprehensive Income
In fiscal 2009, comprehensive income attributable to Tim Hortons Inc. was $231.7 million compared to $367.8 million in fiscal 2008. Net income increased $11.3 million in fiscal 2009 from fiscal 2008, as discussed above. Other comprehensive income included a translation adjustment loss of $62.3 million in fiscal 2009 as opposed to a translation adjustment gain of $83.3 million in fiscal 2008. Translation adjustment losses and gains arise primarily from the translation of our U.S. net assets into our reporting currency, Canadian dollars, at the period-end rates. The remainder of the year-over-year change in other comprehensive income is attributable to losses of $2.4 million and $0.2 million related to cash flow hedges, net of taxes in fiscal 2009 and fiscal 2008, respectively.
The exchange rates were Cdn$1.0510, Cdn$1.2092, and Cdn$0.9805 for US$1.00 on January 3, 2010, December 28, 2008, and December 30, 2007, respectively.
XBRL Filing
Subsequent to the filing of this report, we will file an amended report on Form 10-K/A, which will have documents formatted in XBRL (Extensible Business Reporting Language). We have elected to take advantage of the 30-day grace period in filing our first annual report on Form 10-K with detailed tagging requirements as allowed by Rule 405 of Regulation S-T. Users of this data are advised that, pursuant to Rule 406T of Regulation S-T, the interactive data file is deemed not filed or part of a registration statement or prospectus for purposes of section 11 or 12 of the Securities Act of 1933, is deemed not filed for purposes of section 18 of the Securities Exchange Act of 1934, and is otherwise not subject to liability under these sections. The financial information contained in the XBRL-related documents is “unaudited” and/or “unreviewed,” as applicable.
As a result of the inherent limitations within the rendering tools, we have identified discrepancies that could not be corrected and, therefore, our XBRL tagged financial statements and footnotes should be read in conjunction with our Consolidated Financial Statements contained within this Form 10-K.
Liquidity and Capital Resources
Overview
Our primary source of liquidity has historically been, and continues to be, cash generated from Canadian operations which has, for the most part, self-funded our operations, growth in new restaurants, capital expenditures, dividends, normal course share repurchases, acquisitions and investments. Our U.S. operations have historically been a net user of cash given investment plans and stage of growth, and we expect this trend to continue through 2011. Our senior bank facility (“Senior Bank Facility”) was refinanced during the year and replaced with our revolving bank facility (“Revolving Bank Facility”), which provides an additional source of liquidity, if needed.
In fiscal 2010, we generated $525.5 million of cash from operations, as compared to cash generated from operations of $442.6 million in fiscal 2009, for a net increase of $82.9 million (see “Comparative Cash Flows” below). We believe that we will continue to generate adequate operating cash flows to fund both our capital expenditures and expected debt service requirements over the next twelve months. If additional funds are needed
85
Table of Contents
for strategic initiatives or other corporate purposes beyond current availability under our Revolving Bank Facility, we believe, with the strength of our balance sheet and our strong capital structure, we could borrow additional funds. Our ability to incur additional indebtedness will be limited by our financial and other covenants under our Revolving Bank Facility. Our Senior Unsecured Notes (“Senior Notes”) are not subject to any financial covenants; however, the Senior Notes contain certain other covenants, which are described below. Any such borrowings may result in an increase in our borrowing costs. If such additional borrowings are significant, our credit rating may be downgraded, and it is possible that we would not be able to borrow on terms which are favourable to us.
We had an unsecured five-year Senior Bank Facility with a syndicate of Canadian and U.S. financial institutions that included a revolving facility of $200 million and US$100 million (“Revolvers”) along with a $300 million (at inception) term loan (“Term Debt”), all of which were due to mature on February 28, 2011.
In the second quarter of 2010, we repaid $200 million of the Term Debt, prior to maturity and without penalty. In the fourth quarter of 2010, we repaid the remaining $100 million of the Term Debt prior to maturity and without penalty. These prepayments were made primarily with net proceeds from the issuance of $300 million of Senior Notes, 4.2% coupon, Series 1, due June 1, 2017. In addition, in the fourth quarter, we terminated our Senior Bank Facility, and entered into a new $250 million unsecured revolving credit facility that matures on December 15, 2014 (see Credit Facilities below).
The Senior Notes were offered on a private placement basis in Canada with a term of seven years, maturing June 1, 2017. In the second quarter of 2010, we issued $200 million of Senior Notes for net proceeds of the same. In the fourth quarter of 2010, we reopened the Senior Notes and issued an additional $100 million for net proceeds of $102.3 million, which included a premium of $2.3 million. The premium, along with the loss on the interest rate forwards of $4.9 million (see below) and financing fees of approximately $1.8 million, were deferred and are being amortized to interest expense over the term of the Senior Notes. The effective yield including all fees, premium and the impact of the interest rate forwards loss is 4.45%.
The Senior Notes bear a fixed interest coupon rate of 4.20% with interest payable in semi-annual installments, in arrears, which commenced December 1, 2010. The Senior Notes rank equally and pari passu with each other and with the notes of every other series (regardless of their actual time of issue) issued under the Trust Indenture, and, with all other senior unsecured and unsubordinated indebtedness of Tim Hortons Inc. (the “Borrower”), including amounts owing under the Revolving Bank Facility dated December 13, 2010 (see below), except as to any sinking fund which pertains exclusively to any particular indebtedness of the Borrower and statutory preferred exceptions. The Senior Notes are initially guaranteed by The TDL Group Corp. (“TDL”), the Borrower’s largest Canadian subsidiary. For as long as the Borrower’s and TDL’s third party revenues represent at least 75% of the consolidated revenues of the Company as tested quarterly, on a rolling twelve-month basis, TDL will remain the sole guarantor. To the extent combined third party revenues of these two entities is less than 75% of consolidated revenues, additional guarantors must be added until 75% of consolidated revenues are reached or exceeded. In each case, the Borrowers subsidiary with the highest gross revenue must be one of the guarantors. Alternatively, if the Borrower’s third party revenues reach or exceed 75% of consolidated revenues, the guarantors will be released. There are also certain covenants limiting liens to secure borrowed money (subject to permitted exceptions) and limiting our ability to undertake certain acquisitions and dispositions (subject to compliance with certain requirements).
The Senior Notes are redeemable, at the Borrower’s option, at any time, upon not less than 30 days notice, but no more than 60 days notice, at a redemption price equal to the greater of (i) a price calculated to provide a yield to maturity (from the redemption date) equal to the yield on a non-callable Government of Canada bond with a maturity equal to, or as close as possible to, the remaining term to maturity of the Senior Notes, plus 0.30% and (ii) par, together, in each case, with accrued and unpaid interest, if any, to the date fixed for redemption. In the event of a change of control and a resulting rating downgrade to below investment grade, the Borrower will be required to make an offer to repurchase the Senior Notes at a redemption price of 101% of the principal amount, plus accrued and unpaid interest, if any, to the date of redemption.
86
Table of Contents
In March 2010, we entered into interest rate forwards with a notional amount of $195 million as a cash flow hedge to limit the interest rate volatility in the period prior to the issuance of the Senior Notes. These interest rate forwards were settled in June 2010, resulting in a loss of $4.9 million of which $4.4 million remains in Accumulated Other comprehensive loss on the Consolidated Balance Sheet. This loss is being recognized in interest expense over the seven-year term of the Senior Notes as noted above.
In 2006 and 2007, in connection with the Term Debt, we entered into interest rate swaps with a notional amount of $130 million, which were used to fix a portion of the variable rate Term Debt at 5.04%. Upon prepayment of the Term Debt, we also settled these interest rate swaps, resulting in a reclassification of $1.6 million from Other comprehensive loss to interest expense in 2010.
When evaluating our leverage position, we look at metrics that consider the impact of long-term operating and capital leases as well as other long-term debt obligations. We believe this provides a more meaningful measure of our leverage position given our significant investments in real estate. At January 2, 2011, we had approximately $426.9 million in long-term debt and capital leases on our balance sheet. We continue to believe that the strength of our balance sheet, including our cash position, provides us with opportunity and flexibility for future growth while still enabling us to return excess cash to our shareholders through a combination of our share repurchase program and dividends. Given the ongoing credit concerns in financial markets, we continue to be more focused on capital preservation than yield when investing cash. We invest primarily in short-term money market instruments of several large Canadian financial institutions, thereby minimizing both our liquidity risk and counterparty risk associated with our cash and cash equivalents.
Our primary liquidity and capital requirements are for new restaurant construction, renovations of existing restaurants, expansion of our business through vertical integration and general corporate needs. In addition, we utilize cash to fund our dividends and share repurchase programs. Historically, our annual working capital needs have not been significant because of our focus on managing our working capital investment. In each of the last five fiscal years, operating cash flows have funded our capital expenditure requirements for new restaurant development, remodeling, technology initiatives and other capital needs. Our strategic plan outlined key aspects of our business that we intend to focus on during the next four years. Leveraging significant levels of vertical integration and continuing to explore additional systemwide benefits through vertical integration was one of the key initiatives outlined in the “More than a Great Brand” strategic plan. Consistent with that plan, we are in the process of constructing a replacement distribution centre in Kingston, Ontario which will provide warehouse and distribution capability and capacity for frozen and refrigerated products in addition to dry goods, one-stop shop, to our restaurant owners. Total planned capital expenditures on this facility are currently estimated to be approximately $45.0 million, with approximately $10.3 million incurred in fiscal 2010. Capital expenditures on the Kingston distribution centre are less than expected for 2010, due to timing. The facility is expected to be fully operational in the second half of 2011 and serve more than 650 restaurants in eastern Ontario and Quebec, responding to continued projected growth in that market. As with other vertical integration initiatives, we expect this new facility will deliver important system benefits, including improved efficiency and cost-effective service for our restaurant owners, as well as providing a reasonable financial return for the Company. In 2011, we expect to incur certain ramp-up costs, primarily in the second and third quarters, that will have an impact on our distribution margins; however, the impact of these costs is included in our 2011 EPS target. Distribution is a critical element of our business model as it allows us to control costs to our franchisees and service our restaurants efficiently and effectively while contributing to our profitability.
In fiscal 2010, we continued to repurchase shares under our previously announced share repurchase program, which authorized the Company to repurchase up to $200 million of common shares, not to exceed the regulatory maximum of 8,817,291 shares, which was equivalent to 5% of the Company’s outstanding common shares at the time of regulatory approval on February 19, 2010. The 2010 program, which received Toronto Stock Exchange (“TSX”) approval on March 1, 2010 under TSX normal course issuer bid rules, commenced on March 3, 2010 and is due to end on March 2, 2011.
In the third quarter 2010, the sale of our interest in Maidstone Bakeries generated gross cash proceeds of $475 million (see “Executive Overview”). We announced our plans to distribute approximately $400 million of
87
Table of Contents
the approximately $430 million in after-tax proceeds from that sale to shareholders through increased share repurchases, and we obtained regulatory approval from the TSX to amend our 2010 share repurchase program to increase the maximum number of shares that may be purchased, effective November 16, 2010. Under the amended program, we planned to spend the $200 million originally contemplated, plus up to an additional $200 million, with the final amount dependent upon average daily trading limits and share price, subject to the limitation that we cannot repurchase more than the regulatory maximum of 17,531,446 of our shares (representing 10% of our public float as of February 19, 2010, as defined under TSX rules). The program will terminate on March 2, 2011, without the $400 million maximum being reached as the share maximum under the agreement will have been achieved. The maximum number of shares that could be purchased during any trading day under the amended program was the lesser of 125,025 common shares, representing 25% of the average daily trading volume (“ADTV”) on the TSX, based on the six completed calendar months ended January 31, 2010, and 20% of the trading volume (i.e., the aggregate trading volume for the common shares on the TSX, NYSE or other corporation-approved “published market” (as defined under the Ontario Securities Act)). The 25% of ADTV limit, for which there are permitted exceptions, was determined in accordance with regulatory requirements in connection with the original implementation of the program, and the 20% of trading volume was a limit we implemented voluntarily after consideration of trading volumes leading up to the date of the amendment.
Under the 2010 amended program, shares were repurchased through a combination of a 10b5-1, or automatic trading program, and through management’s discretion, subject to regulatory requirements, market, cost, and other considerations. In fiscal 2010, we spent approximately $242.6 million to purchase and cancel approximately 6.7 million shares under our share repurchase programs at an average cost of $36.46 per share.
As part of our annual capital allocation process, we considered our remaining net proceeds from the Maidstone Bakeries sale in conjunction with our plan to return capital to shareholders in 2011. As a result, our Board of Directors has approved a new share repurchase program (“2011 Program”) for up to $445 million in common shares, not to exceed the regulatory maximum of 14,881,870 shares, representing 10% of our public float as of February 17, 2011, as defined under TSX rules. The 2011 Program represents $200 million in cash flow generation and cash-on-hand and, in addition, up to $245 million from the remaining undistributed net proceeds from the Maidstone Bakeries sale in October 2010. The net proceeds of $400 million from that sale, after taxes and the $30 million allocated to restaurant owners, is expected to be distributed in its entirety by the end of the third quarter of 2011.
We received regulatory approval for the 2011 Program from the Toronto Stock Exchange (“TSX”) on February 23, 2011. The 2011 Program is planned to commence on March 3, 2011 and is due to terminate on March 2, 2012. Under the terms, the 2011 Program may terminate earlier than March 2, 2012 if the $445 million maximum or regulatory maximum of 14,881,870 shares is reached or, at our discretion, subject to regulatory compliance. There can be no assurance as to the precise number of shares (or equivalent dollar value of shares) that will be purchased under the 2011 Program. Common shares will be purchased under the program through a combination of a 10b5-1 automatic trading plan as well as at management’s discretion in compliance with regulatory requirements, and given market, cost and other considerations. Repurchases will be made on the TSX, the New York Stock Exchange, and/or other Canadian marketplaces, subject to compliance with applicable regulatory requirements. The maximum number of shares that may be purchased during any trading day may not exceed 25% of the average daily trading volume on the TSX, excluding purchases made by us under our current normal course issuer bid, based on the previous six completed calendar months, for a daily total of 93,920 common shares. This limit, for which there are permitted exceptions, is determined in accordance with regulatory requirements.
Since initiation of these share repurchase programs, we have repurchased an aggregate of approximately 22.6 million shares, or 11.7%, of our outstanding common shares as of the date of inception of the first program, for a total cost of $771.7 million. Separately, we spent $3.3 million to acquire shares for The TDL RSU Plan Trust in 2010 (discussed below). We have primarily funded all of these repurchases to date from our cash on hand, including net proceeds from the sale of Maidstone Bakeries, and from our cash from operations.
Our outstanding share capital is comprised of common shares. An unlimited number of common shares, without par value, is authorized, and we had 170,664,295 common shares outstanding at January 2, 2011. As at
88
Table of Contents
this same date, we had issued options to acquire 1,086,006 of our common shares to officers of the Corporation pursuant to our 2006 Stock Incentive Plan, of which 263,498 were exercisable.
Our Board of Directors approved a 30.0% increase in the quarterly dividend to $0.13 per common share in February 2010. In fiscal 2010, we paid four quarterly dividends of $0.13 per common share, totaling approximately $90.3 million at this new rate. In fiscal 2009, we paid four quarterly dividends of $0.10 per share, totaling approximately $72.5 million. We have historically paid for all dividends primarily from cash generated from our operations, and we expect to continue to do so in 2011. In 2010, our Board increased our long-term, targeted dividend payout range to 30%-35% (from 20%-25%) of prior year, normalized annual net income attributable to Tim Hortons Inc., which is net income attributable to Tim Hortons Inc. adjusted for certain discrete items, such as gains on divestitures, tax impacts and asset impairments, that affect our annual net income attributable to Tim Hortons Inc.
In February 2011, our Board of Directors approved an increase in the dividend from $0.13 to $0.17 per share paid quarterly, representing an increase of 31%, reflecting our strong cash flow position, which allows us to continue our first priority of funding our business growth investment needs while still returning value to our shareholders in the form of dividends and share repurchases. The Board has declared the first quarterly dividend at the increased rate of $0.17 per share, payable on March 22, 2011 to shareholders of record as of March 7, 2011. Dividends are declared and paid in Canadian dollars to all shareholders with Canadian resident addresses. For U.S. resident shareholders, dividends paid will be converted to U.S. dollars based on prevailing exchange rates at time of conversion by the Clearing and Depository Services Inc. for beneficial shareholders and by us for registered shareholders. Notwithstanding our targeted payout range and the recent increase in our dividend, the declaration and payment of all future dividends remains subject to the discretion of our Board of Directors and the Company’s continued financial performance, debt covenant compliance, and other risk factors.
In 2006, we established The TDL RSU Plan Trust. The Trust holds our common shares for future use to satisfy our obligation to settle restricted stock units (“RSUs”) granted to certain Canadian employees under our 2006 stock incentive plan by delivering common shares. This Trust enables us to fix the amount of cash required to satisfy RSU obligations that vest in a future period at approximately the same dollar value at which the RSUs were originally granted. In fiscal 2010 and 2009, the Trust purchased approximately 92,000 shares and 25,000 shares, respectively, of our common shares on the open market for a total cost of $3.3 million and $0.7 million, respectively.
In fiscal 2010, the Trust settled RSU obligations with the substantial majority of the Company’s Canadian employees by disbursing 92,000 shares from the Trust, with a total value of $3.1 million, after provision for all applicable statutory withholding requirements on account of the employees. In fiscal 2009, prior to the corporate reorganization, RSU obligations to U.S. employees and directors were settled with treasury shares. As a Canadian public company after the reorganization, we no longer have treasury shares and as a result, RSU obligations to U.S. employees and certain other participants were settled by open market purchase, all of the foregoing after provision for all applicable statutory withholding requirements on the account of the respective employees.
Credit Facilities
The Senior Bank Facility was terminated in the fourth quarter of 2010. We now have an unsecured four-year Revolving Bank Facility, which is supported by a syndicate lending group of nine financial institutions, of which Canadian financial institutions hold approximately 57% of the total funding commitment. The Revolving Bank Facility matures on December 15, 2014. We will use the borrowings under the new Revolving Bank Facility for general corporate purposes, including potential acquisitions and other business initiatives.
The Revolving Bank Facility has the same guarantee structure as the Senior Notes and may be drawn by the Borrower or TDL and as such, has a Tim Hortons Inc. guarantee that can not be released. The Revolving Bank
89
Table of Contents
Facility is for $250.0 million (which includes $25.0 million overdraft availability and $25.0 million letter of credit facility). The Revolving Bank Facility is undrawn, except for approximately $9.6 million (2009: $8.6 million under the Revolvers) to support standby letters of credit. We also incur commitment fees, whether the facility is used or unused. Under the Revolvers, the commitment fees varied according to the our leverage ratio, whereas under the Revolving Bank Facility the commitment fees vary according to our credit rating on our Senior Notes and, as at January 2, 2011 and January 3, 2010, equaled 0.38% and 0.08% of the Facility amount, respectively.
The Revolving Bank Facility provides variable rate funding options including bankers’ acceptances or LIBOR plus a margin. If certain market conditions caused LIBOR to be unascertainable or not reflective of the cost of funding, the administration agent under the facility can cause the borrowing to be at the base rate which has a floor of one month LIBOR plus 1%. This facility does not carry a market disruption clause. The Revolving Bank Facility contains various covenants which, among other things, requires the maintenance of two financial ratios: a consolidated maximum total debt coverage ratio, and, a minimum fixed charge coverage ratio. We were in compliance with these covenants as at January 2, 2011.
The consolidated maximum debt coverage ratio is computed as consolidated total debt divided by net income (excluding net income of variable interest entities) and before interest expense, taxes, depreciation and amortization, and net of discrete non-cash losses and gains or extraordinary losses and gains incurred outside the ordinary course of business (the denominator). Consolidated total debt (the numerator) primarily includes (without duplication) all liabilities for borrowed money, capital lease obligations, letters of credit (whether or not related to borrowed money), the net marked-to-market under swap agreements and guarantee liabilities (excluding those scheduled in the agreement).
The minimum fixed charge coverage is computed as net income (excluding net income of variable interest entities) and before interest expense, taxes, depreciation and amortization, rent expense, and net of discrete non-cash losses and gains or extraordinary losses and gains incurred outside the ordinary course of business, collectively as the numerator, divided by consolidated fixed charges. Consolidated fixed charges includes interest and rent expense.
The following table outlines the level of our covenant compliance for fiscal 2010 under the Revolving Bank Facility:
| Actual | Required(1) | |||||||
| Consolidated total debt to EBITDA |
0.72 | <3.00 | ||||||
| Minimum fixed charge |
4.23 | >2.00 | ||||||
| (1) | Consolidated total debt to EBITDA cannot exceed 3.00. Minimum fixed charge cannot be less than 2.00. |
The Revolving Bank Facility contains certain covenants that will limit our ability to, among other things: incur additional indebtedness; create liens; merge with other entities; sell assets; make restricted payments; make certain investments, loans, advances, guarantees or acquisitions; change the nature of our business; enter into transactions with affiliates; or enter into certain restrictive agreements; or pay dividends or make share repurchases if we are not in compliance with the financial covenants, or if such transactions would cause us to not be in compliance with the financial covenants.
Events of default under the Revolving Bank Facility include: a default in the payment of the obligations under the Revolving Bank Facility or a change in control of Tim Hortons Inc. Additionally, events of default for the Borrower, TDL or any future Guarantor include: a breach of any representation, warranty or covenant under the Revolving Bank Facility; certain events of bankruptcy, insolvency or liquidation; and, any payment default or acceleration of indebtedness if the total amount of such indebtedness unpaid or accelerated exceeds $25.0 million.
90
Table of Contents
Comparative Cash Flows
Operating Activities. Net cash provided from operating activities increased $82.9 million in fiscal 2010 to $525.5 million from $442.6 million in fiscal 2009. Operating cash flow growth in fiscal 2010 had higher net income attributable to Tim Hortons Inc. of $327.3 million which included an accounting gain on sale of our interest in Maidstone Bakeries of $361.1 million and a non-cash asset impairment of $18.4 million and the associated tax effects. Changes in operating assets and liabilities were mainly attributable to our $30 million allocation to restaurant owners, restaurant closure costs and other liabilities outstanding at year end and was partially offset by an increase in inventories and other. Higher depreciation expense and higher stock-based compensation expense of $4.9 million and $5.4 million, respectively, also contributed to higher net cash provided by operating activities. Deferred income taxes decreased by $24.2 million. Included in deferred tax expense in fiscal 2009 was approximately $18.7 million relating to the uncertainty of realizing deferred tax assets relating to U.S. operations in connection with the public company reorganization. The higher fiscal 2010 depreciation expense primarily reflects depreciation expense from new restaurant development in late 2009 and fiscal 2010 and a full year’s depreciation related to our new coffee roasting facility which became fully operational in the latter half of 2009.
Investing Activities. Net cash provided from investing activities in fiscal 2010 was $296.0 million compared to a net cash use of $200.3 million in fiscal 2009, representing an increase in cash from investing activities of $496.3 million. The higher provision of cash was primarily a result of the gross proceeds received from the sale of our interest in Maidstone Bakeries of $475.0 million, offset by $30.4 million of cash and cash equivalents held by Maidstone Bakeries and deconsolidated at the time of sale. Also contributing to the increase in cash are lower capital expenditures of $27.5 million year-over-year as we continue our focus on more capital-efficient designs and locations and also leased a higher proportion of new restaurant development year-over-year. In addition, we issued fewer notes receivable and received higher principal repayments of $7.0 million on our notes receivable.
We spent $132.9 million on capital expenditures in fiscal 2010 compared to $160.5 million in fiscal 2009. Capital expenditures are typically the largest ongoing component of our investing activities and include expenditures for new restaurants, improvements to existing restaurants, and other corporate capital needs. A summary of capital expenditures for fiscal 2010, 2009, and 2008 is as follows:
| Fiscal Years | ||||||||||||
| 2010 | 2009 | 2008 | ||||||||||
| (in millions) | ||||||||||||
| Capital expenditures |
||||||||||||
| New restaurants |
$ | 67.0 | $ | 66.8 | $ | 124.9 | ||||||
| Restaurant replacements and renovations |
38.9 | 40.4 | 34.8 | |||||||||
| New coffee roasting facility |
1.3 | 28.1 | 0.5 | |||||||||
| New distribution facility |
10.3 | — | — | |||||||||
| Other capital needs |
15.4 | 25.2 | 24.3 | |||||||||
| Total capital expenditures |
$ | 132.9 | $ | 160.5 | $ | 184.5 | ||||||
91
Table of Contents
Capital expenditures were primarily for new restaurant development and remodeling (mentioned above), as well as spending on our new distribution facility in Kingston, Ontario and other capital needs. In addition, capital expenditures in fiscal 2009 included expenditures related to the completion of our new coffee roasting facility in Hamilton, Ontario. Expenditures for other capital needs typically represent software implementations and other equipment purchases required for ongoing business needs. Capital expenditures for new restaurants by operating segment were as follows:
| Fiscal Years | ||||||||||||
| 2010 | 2009 | 2008 | ||||||||||
| (in millions) | ||||||||||||
| Canada |
$ | 45.9 | $ | 48.1 | $ | 69.8 | ||||||
| U.S. |
21.1 | 18.7 | 55.1 | |||||||||
| Total |
$ | 67.0 | $ | 66.8 | $ | 124.9 | ||||||
We expect fiscal 2011 capital expenditures to be between $180 million and $200 million for new restaurant development, remodeling, technology initiatives and other capital needs, including the completion of our replacement distribution facility in Kingston, Ontario. We anticipate these and future capital needs related to our normal business activities will be funded through ongoing operations.
Financing Activities. Financing activities used cash of $365.6 million in fiscal 2010, compared to $236.1 million in fiscal 2009. Our increased spending is primarily related to our share repurchase program (see Overview section). We spent $115.3 million more year-over-year on share repurchases in comparison to 2009. Late in 2010 we began to deploy the proceeds from the sale of our interest in Maidstone Bakeries through our share repurchase program. We intend to continue the deployment of these proceeds through our 2011 Program with the intent to have proceeds fully deployed by the third quarter of 2011. We deferred repurchases during April 2009 through October 2009 until we completed a review of our capital allocation activities after our public company reorganization. Higher dividend payments of $17.8 million in 2010 and principal payments on our long-term debt obligations (largely offset by the issuance of our Senior Notes) also contributed to the higher spending.
92
Table of Contents
Contractual Obligations
Our significant contractual obligations and commitments as of January 2, 2011 are shown in the following table. Purchase obligations primarily include commitments for advertising expenditures and purchases for certain food ingredients.
| Payments Due by Period | ||||||||||||||||||||||||||||
| Less than 1 Year |
1 – 3 Years |
3 – 5 Years |
After 5 Years |
Total | Liability recorded on Balance Sheet |
Future Commitment not Recorded on Balance Sheet |
||||||||||||||||||||||
| (in thousands) | ||||||||||||||||||||||||||||
| Contractual Obligations |
||||||||||||||||||||||||||||
| Long-term debt, including interest and current maturities |
$ | 21,351 | $ | 39,879 | $ | 41,507 | $ | 396,593 | $ | 499,330 | $ | 347,163 | $ | 152,167 | ||||||||||||||
| Advertising fund restricted debt, including interest and current maturities |
328 | 394 | 73 | — | 795 | 795 | — | |||||||||||||||||||||
| Capital leases |
15,611 | 27,510 | 25,885 | 89,922 | 158,928 | 89,718 | 69,210 | |||||||||||||||||||||
| Operating leases |
77,767 | 134,664 | 127,598 | 483,331 | 823,360 | — | 823,360 | |||||||||||||||||||||
| Purchase obligations |
317,812 | 26,183 | 146 | — | 344,141 | — | 344,141 | |||||||||||||||||||||
| Total contractual obligations |
$ | 432,869 | $ | 228,630 | $ | 195,209 | $ | 969,846 | $ | 1,826,554 | $ | 437,676 | $ | 1,388,878 | ||||||||||||||
| As of January 2, 2011 | ||||
| (in thousands) | ||||
| Other Commercial Commitments |
||||
| Franchisee lease and loan guarantees |
$ | 954 | ||
| Letters of credit and surety bonds |
10,729 | |||
| Total other commercial commitments |
$ | 11,683 | ||
The above table does not reflect unrecognized tax benefits of $33.1 million (including related interest) as the Company is unable to make a reasonable reliable estimate when possible cash settlements with a taxing authority would occur (Refer to Note 7 to the Consolidated Financial Statements).
We purchase certain products in the normal course of business, the prices of which are affected by commodity prices. Included in the purchase obligations outlined above are commitments relating to the following commodities: green coffee, sugar, palm/soybean oil and wheat. Some of these purchase commitments are made on behalf of third-party suppliers, including Maidstone Bakeries. We generally purchase six to twelve months forward in these commodities, but in periods of rising prices, we may extend these purchase commitments for longer periods. We employ various purchasing and pricing contract techniques in an effort to minimize volatility, including setting fixed prices with suppliers, setting in advance the price for products to be delivered in the future and unit pricing based on an average of commodity prices over the corresponding period of time. In general, we do not have contracts with our suppliers of commodities that extend greater than twelve months. (See Item 7A—Quantitative and Qualitative Disclosures about Market Risk).
As of January 2, 2011, we have guaranteed certain leases and debt payments of franchisees amounting to approximately $1.0 million. In the event of default by a franchisee, we generally retain the right to acquire possession of the related restaurants. We are also the guarantor on $10.7 million in letters of credit and surety bonds with various parties; however, we do not expect any significant loss to result from these instruments because we do not believe performance will be required.
93
Table of Contents
Off-Balance Sheet Arrangements
We do not have “off-balance sheet” arrangements as of January 2, 2011 and January 3, 2010 as that term is described by the SEC.
Financial Definitions
Sales
Primarily includes sales of products, supplies and restaurant equipment (except for initial equipment packages sold to franchisees as part of the establishment of their restaurant’s business—see “Franchise Fees”) that are shipped directly from our warehouses or by third party distributors to the restaurants, which we include in distribution sales. Sales include canned coffee sales through the grocery channel. Sales also include sales from Company-operated restaurants, sales from certain non-owned restaurants that are consolidated in accordance with ASC 810, and sales from our previously-held bakery joint venture, which we were also required to consolidate under ASC 810 prior to the sale of our interest.
Rents and Royalties
Includes royalties and rental revenues paid to us by restaurant owners.
Franchise Fees
Includes the sales revenue from initial equipment packages, as well as fees for various costs and expenses related to establishing a franchisee’s business.
Cost of Sales
Includes costs associated with our distribution business, including cost of goods, direct labour, and depreciation, as well as the cost of goods delivered by third-party distributors to the restaurants, and for canned coffee sold through grocery stores. Cost of sales also includes food, paper, and labour costs for Company-operated restaurants, and certain non-owned restaurants that are consolidated in accordance with ASC 810 and cost of sales from our previously-held bakery joint venture which we were also required to consolidate under ASC 810.
Operating Expenses
Includes rent expense related to properties leased to restaurant owners and other property-related costs (including depreciation).
Franchise Fee Costs
Includes costs of equipment sold to franchisees as part of the commencement of their restaurant business, as well as training and other costs necessary to ensure a successful restaurant opening.
General and Administrative Expenses
Includes costs that cannot be directly related to generating revenue, including expenses associated with our corporate and administrative functions, and depreciation of office equipment, the majority of our information technology systems, and head office real estate.
Equity Income
Includes income from equity investments in joint ventures and other minority investments over which we exercise significant influence, excluding joint ventures that we are required to consolidate. Equity income from
these investments is considered to be an integrated part of our business operations and is, therefore, included in operating income. Income amounts are shown as reductions to total costs and expenses.
94
Table of Contents
Asset Impairment and Related Closure Costs
Represents non-cash charges relating to the impairment of long-lived assets. It also includes costs related to restaurant closures made as part of the restaurant closures, primarily in the New England region, in the fourth quarter of 2010 and in 2008.
Other Income and Expense
Includes expenses (income) that are not directly derived from our primary businesses. Items include foreign currency adjustments, gains and losses on asset sales, and other asset write-offs.
Noncontrolling interests
Relates to the consolidation of our previously-held bakery joint venture and certain non-owned restaurants that we are required to consolidate under ASC 810.
Comprehensive Income
Represents the change in our net assets during the reporting period from transactions and other events and circumstances from non-owner sources. It includes net income and other comprehensive income such as foreign currency translation adjustments and the net impact of cash flow hedges.
The Application of Critical Accounting Policies
We describe our significant accounting policies in Note 1 of our audited historical Consolidated Financial Statements. Included in our significant accounting policies are certain policies that we believe are both significant and may require us to make difficult, subjective or complex judgments, often because we need to estimate the effect of inherently uncertain matters. The preparation of Consolidated Financial Statements in conformity with accounting principles generally accepted in the U.S. requires us to make assumptions and estimates that can have a material impact on the results of our operations. These assumptions and estimates affect the reported amounts of assets and liabilities and the disclosure of contingent assets and liabilities as of the date of the Consolidated Financial Statements and the reported amounts of revenues and expenses during the reporting periods. Estimates and judgments are inherent in, but not limited to, the following: the estimation of the collectibility of royalty and other franchise related revenue; legal obligations; income taxes; insurance liabilities; various other commitments and contingencies; valuations used when assessing potential impairment of assets and other intangibles; inventory valuations; gift certificate and cash card breakage; property and equipment, including the estimation of the useful lives of property and equipment and other long-lived assets; estimates associated with restaurant closure costs; and, valuations associated with estimating stock-based compensation expense. While management applies its judgment based on assumptions believed to be reasonable under the circumstances and at the time, actual results could vary from these assumptions or if different assumptions had been used. We evaluate and update our assumptions and estimates based on new events occurring, additional information being obtained or more experience being acquired.
In the normal course of business, we must make continuing estimates of potential future legal obligations and liabilities, which also requires the use of management’s judgment on the outcome of various issues. We may also use outside legal advice to assist in the estimating process. However, the ultimate outcome of various legal issues could be different than management estimates, and adjustments to income could be required.
Basis of Presentation
The functional currency of Tim Hortons Inc. is the Canadian dollar, as the majority of the Company’s cash flows are in Canadian dollars. The functional currency of each of the Company’s subsidiaries and legal entities is the local currency in which each subsidiary operates, which is the Canadian dollar, the U.S. dollar or the Euro. The majority of the Company’s operations, restaurants and cash flows are based in Canada, and the Company is primarily managed in Canadian dollars. As a result, the Company’s reporting currency is the Canadian dollar.
95
Table of Contents
The Consolidated Financial Statements include the results and balances of Tim Hortons Inc., its wholly-owned subsidiaries and certain independent operators and joint ventures consolidated according to ASC 810— Consolidation. Intercompany accounts and transactions among consolidated entities have been eliminated upon consolidation. Investments in non-consolidated affiliates over which we exercise significant influence, but for which we are not the primary beneficiary and do not have control, are accounted for using the equity method. Our share of the earnings or loss of these non-consolidated affiliates is included in equity income, which is included as part of operating income since these investments are operating ventures closely integrated in our business operations.
Other than the adoption of new accounting standards, there have been no significant changes in critical accounting policies or management estimates since the year ended January 3, 2010.
Effective January 4, 2010, we adopted SFAS No. 167, now codified within ASC 810. This Statement amended Interpretation 46(R) to require an enterprise to perform an analysis to determine whether the enterprise’s variable interest or interests give it a controlling financial interest in a variable interest entity. This analysis identifies the primary beneficiary of a variable interest entity as the enterprise that has both of the following characteristics: (i) the power to direct the activities of a variable interest entity that most significantly impacts the entity’s economic performance; and (ii) the obligation to absorb losses of the entity that could potentially be significant to the variable interest entity or the right to receive benefits from the entity that could potentially be significant to the variable interest entity. Additionally, an enterprise is required to assess whether it has an implicit financial responsibility to ensure that a variable interest entity operates as designed when determining whether it has the power to direct the activities of the variable interest entity that most significantly impact the entity’s economic performance. This Statement also amended Interpretation 46(R) to focus on a more qualitative approach, rather than a quantitative approach previously required for determining the primary beneficiary of a variable interest entity, amended certain guidance for determining whether an entity is a variable interest entity, added an additional requirement to assess whether an entity is a variable interest entity, on an ongoing basis, and requires enhanced disclosures that will provide users of financial statements with more transparent information about an enterprise’s involvement in a variable interest entity. See our Condensed Consolidated Financial Statements Note 20—Variable Interest Entities for additional information regarding the impact of the adoption of this standard.
Effective January 4, 2010, we adopted certain provisions within Accounting Standard Update (“ASU”) No. 2010-06—Fair Value Measurements: Improving Disclosures about Fair Value Measurements, as codified in ASC 820—Fair Value Measurements. This ASU provides amendments to fair value measurements that requires more enhanced disclosures about (i) the different classes of assets and liabilities measured at fair value, (ii) the valuation techniques and inputs used, (iii) the activity in Level 3 fair value measurements, and (iv) the transfers between Levels 1, 2 and 3 fair value measurements. This ASU is effective for interim or annual reporting periods beginning after December 15, 2009, except for certain disclosures applicable to Level 3 fair value measurements which are effective for fiscal years beginning after December 15, 2010, and for interim periods within those years. We adopted all elements of this update, and it did not have a significant impact on our financial statements or related disclosures.
Effective June 15, 2010, we adopted ASU No. 2010-11—Scope Exception Related to Embedded Credit Derivatives, as codified in ASC 815—Derivatives and Hedging. This ASU clarifies the type of embedded credit derivative that is exempt from embedded derivative bifurcation requirements. Only one form of embedded credit derivative qualifies for the exemption—one that is related only to the subordination of one financial instrument to another. As a result, entities that have contracts containing an embedded credit derivative feature in a form other than such subordination may need to separately account for the embedded credit derivative feature. This ASU was effective for interim periods beginning after June 15, 2010. The adoption of this update did not have a significant impact on our financial statements or related disclosures.
Effective December 15, 2010, the Company adopted ASU No. 2010-20—Disclosures about the Credit Quality of Financing Receivables and the Allowance for Credit Losses as codified in ASC 310—Receivables.
96
Table of Contents
This update improves the disclosures that an entity provides about the credit quality of its financing receivables, excluding short-term trade receivables, and the related allowance for credit losses. As a result of these amendments, an entity is required to disaggregate by portfolio segment or class certain existing disclosures and provide certain new disclosures about its financing receivables and related allowance for credit losses. This ASU is effective for public companies, for interim and annual reporting periods ending on or after December 15, 2010 regarding disclosures as of the end of the reporting period, and for interim and annual reporting periods beginning on or after December 15, 2010 regarding disclosures about activity that occurs during a reporting period. Since this update only relates to disclosures, the adoption of ASU No. 2010-20 did not have a significant impact on our results from operations or financial position.
Described below are critical accounting policies, which should be read in conjunction with our historical Consolidated Financial Statements and the Notes thereto for a full understanding of our financial position and results of operations.
Revenue Recognition
The timing of revenue recognition for Sales (distribution and Company-operating restaurants), and franchise revenues (rents and royalties and franchise fees) does not involve significant estimates and assumptions.
Sales
We operate warehouses in Canada to distribute coffee and other dry goods and refrigerated and frozen products to an extensive franchise system. Revenues from these sales are recorded when the product is delivered to the franchisee, or in certain cases, where the product is delivered to a third-party distributor. Revenue at Company-operated restaurants is recognized upon tender of payment at the time of sale. Sales related to variable interest entities are recognized when product is delivered to a third-part, in the case of our previously-held Maidstone Bakeries joint venture, or upon the tender of payment at the time of sale in the case of non-owned restaurants that are consolidated in accordance with ASC 810.
Franchise revenues
Our restaurants are predominantly franchised. We grant franchise licenses or operator agreements to independent operators who in turn pay franchise fees and other payments, which may include payments for equipment, royalties and, in most cases, rents for each restaurant opened. Franchise fees are collected at the time of sale or resale or renovation of the franchised restaurant. Franchise fees and equipment sales are generally recognized as income when each restaurant commences operations and payment is received from the franchisee, unless the franchisee is participating in our franchise incentive program (“FIP”) (see below). Rental revenue, excluding contingent rent, is recognized on a straight-line basis. Contingent rent is recognized in the month earned. Royalties, based on a percentage of monthly sales, are recognized as income in the month earned on the accrual basis and are normally collected within the month or shortly thereafter.
We have developed a FIP available to certain of our U.S. restaurant owners, which provides financing for both the initial franchise fee and the purchase of certain restaurant equipment, furniture, trade fixtures, and interior signs. The payment for those assets is deferred for a period of 104 weeks from the date of opening. The initial franchise fee is recognized at the time of opening the restaurant and the equipment revenue is recognized after a sustained period of sales levels are achieved, or at the end of 104 week term, whichever is earlier. The restaurant owner has the option to pay for the initial franchise fee, including interest thereon, on a weekly basis over a period of up to 104 weeks from the opening of the restaurant. The initial franchise fee revenues are recognized at the time of restaurant opening, with consideration for potential uncollectibility. Should we determine that a franchise sold under this program is a VIE and we are the primary beneficiary, we do not recognize any revenue until we are no longer the primary beneficiary and we meet the criteria noted above.
97
Table of Contents
We generally control, either through ownership or by leasing, a significant majority of the real estate on which our restaurants are located, and we lease the real estate to our restaurant owners. Rental income is recorded on an accrual basis. Most leases provide for fixed payments with contingent (or percentage) rent after sales exceed certain levels, while others provide for monthly rentals based solely on a percentage of sales. Fixed, or base, rental revenue is recorded on a straight-line basis and contingent (or percentage) rental revenue is recognized when sales exceed certain levels.
The financing is initially recorded at fair value and are subsequently measured at amortized cost. We have established reserves based on net realizable value, related to the collection of franchise royalties and other franchise-related receivables and commitments when it is not probable that amounts will be collected. Although we generally enjoy a positive relationship with our restaurant owners, and collection rates have historically been high, if average sales or the financial health of our restaurant owners were to deteriorate, we might have to increase reserves against collection of franchise revenues.
Effective December 15, 2010, we adopted ASU No. 2010-20—Disclosures about the Credit Quality of Financing Receivables and the Allowance for Credit Losses as codified in ASC 310—Receivables. This update improves the disclosures that an entity provides about the credit quality of its financing receivables, excluding short-term trade receivables, and the related allowance for credit losses. As a result of these amendments, an entity is required to disaggregate by portfolio segment or class certain existing disclosures and provide certain new disclosures about its financing receivables and related allowance for credit losses. This ASU is effective for public companies, for interim and annual reporting periods ending on or after December 15, 2010 regarding disclosures as of the end of the reporting period, and for interim and annual reporting periods beginning on or after December 15, 2010 regarding disclosures about activity that occurs during a reporting period. Since this update only relates to disclosures, the adoption of ASU No. 2010-20 did not have a significant impact on our results from operations or financial position.
The real estate site selection for restaurants is generally controlled by us. Restaurant owners receive assistance in such areas as purchasing and marketing from Company personnel. These franchise expenses are included in franchise fee costs. Franchise fee revenues are comprised of revenues primarily from the sale of equipment related to establishing a restaurant owner’s business and the initial franchise fee. Restaurant owners may receive other financial assistance, or “relief,” relating to lower rents and royalties and reductions or assistance with certain other operating costs for restaurants in new and developing markets, and the amount of this relief is recorded as a reduction to our rents and royalties revenues.
Income Taxes
We account for income taxes in accordance with ASC 740—Income Taxes. We use the asset and liability method whereby income taxes reflect the expected future tax consequences of temporary differences between the carrying amounts of assets or liabilities for accounting purposes as compared to tax purposes. A deferred income tax asset or liability is determined for each temporary difference based on the currently enacted tax rates that are expected to be in effect when the underlying items of income and expense are expected to be realized, except for the amount of earnings related to our foreign operations where repatriation is not contemplated in the foreseeable future. Income taxes reported in the Consolidated Statement of Operations include the current and deferred portions of the expense. Income taxes applicable to items charged or credited to equity are netted with such items. Changes in deferred income taxes related to a change in tax rates are recognized in the period when the tax rate change is enacted. In addition, the Consolidated Statement of Operations contain items that are non-taxable or non-deductible for income tax purposes and, accordingly, cause the income tax provision to be different from what it would be if based on statutory rates.
When considered necessary, we record a valuation allowance to reduce deferred tax assets to the balance that is more likely than not to be realized. Management must make estimates and judgments on future taxable income, considering feasible tax planning strategies and taking into account existing facts and circumstances, to determine the proper valuation allowance. When we determine that deferred tax assets could be realized in greater or lesser amounts than recorded, the asset balance and income statement reflect the change in the period
98
Table of Contents
such determination is made. Due to changes in facts and circumstances and the estimates and judgments that are involved in determining the proper valuation allowance, differences between actual future events and prior estimates and judgments could result in adjustments to this valuation allowance.
Under the accounting standards for Uncertain Tax Positions contained in ASC 740, a tax benefit from an uncertain tax position may be recognized in the financial statements only if it is more likely than not that the position will be sustained on examination by taxing authorities, based on the technical merits of the position. The tax benefits recognized in the financial statements from such a position are measured based on the largest benefit that has a greater than 50% likelihood of being realized upon ultimate settlement. The standards require that changes in judgment that result in subsequent recognition, derecognition or a change in measurement of a tax position taken in a prior period (including any related interest and penalties) be recognized as a discrete item in the interim period in which the change occurs. We record interest and potential penalties related to unrecognized tax benefits in income tax expense. The standards require that a liability associated with an unrecognized tax benefit be classified as long-term liability except for the liabilities that are expected to be settled within the next twelve months.
Property and Equipment
We carry our property and equipment at cost. Depreciation and amortization are recognized using the straight-line method over the following estimated useful lives:
| Depreciation Periods(1) | ||
| Buildings and leasehold improvements | 10 to 40 years or lease term(2) | |
| Restaurant other equipment | 7 to 10 years | |
| Capital leases | 8 to 40 years or lease term(2) | |
| Computer hardware and software | 3 to 10 years | |
| Advertising fund property and equipment | 3 to 10 years | |
| Manufacturing and other equipment | 4 to 30 years | |
| Construction in progress | Reclassified to above categories when put in use |
| (1) | We estimate useful lives on buildings and equipment based on historical data and industry trends. We monitor our capitalization and amortization policies to ensure they remain appropriate. Lives may be related to legal or contractual lives or must be estimated by management based on specific circumstances. |
| (2) | Lease term as defined in ASC 840—Leases. |
Interest and other costs associated with the construction of new restaurants and facilities are capitalized. Major improvements are capitalized, while maintenance and repairs are expensed when incurred. Gains and losses on the disposition of property and equipment are included in Other (income), net in the Consolidated Statement of Operations.
Advertising fund property and equipment includes certain assets purchased or leased by the advertising fund.
Impairment of Long-lived Assets
Long-lived assets are grouped at the lowest level of independent cash flows and tested for impairment whenever an event or circumstance occurs that indicate impairment may exist (“triggering event”), which may include a current expectation that, more likely than not, a long-lived asset or asset group will be sold or otherwise disposed of prior to its estimated useful life.
Restaurant-related long-lived assets are grouped into operating markets as this is the lowest identifiable level of independent cash flows. Events such as prolonged negative same-store sales growth in the market, which is a key operating metric, or prolonged negative cash flows in the operating market, are indicators that we use in
99
Table of Contents
evaluating whether an impairment may exist. We also test for impairment if we have a higher-than-normal amount of restaurant closures in any one market. We also consider the length of time we have been in the market as it takes time to fully establish a market. Generally, if same-store sales decline over time on a consecutive basis, further evaluation may be required, including a review of operating market cash flows. The impairment analysis of the triggering events described above differs depending upon whether the affected market is considered a developed market or a developing market. In developed markets, one of the key indicators for the overall health of an operating market is same-store sales growth. In developing markets, we assess a number of factors, including systemwide sales growth, which encompasses new restaurants and same-store sales growth, the stage of growth of the operating market and the average unit sales volume trends, as well as a higher-than-normal amount of restaurant closures in a market. Given the external market conditions present for the majority of the period under review, we also make assessments as to whether declines are an indication of expected long-term performance for the developing market or whether the declines may be more temporary due to the impact of external market conditions.
Non-restaurant-related assets are grouped based on their ability to generate independent cash flows. In the case of our manufacturing facilities, they are grouped on a facility-by-facility basis. Corporate assets, which relate primarily to land, buildings, and computer hardware and software systems, are grouped on a consolidated level with all long-lived assets as they support the entire business and independent cash flows are not generated from these specific assets.
If it is determined that a triggering event has occurred, an undiscounted cash flow analysis is completed on the affected market to determine if the future expected cash flows of a market are sufficient to recover the carrying value of the assets. If it is determined that the undiscounted cash flows are insufficient, then the market is deemed to be impaired. The fair value of the property and equipment is estimated using primarily third-party appraisals or the discounted cash flows, as appropriate. The estimated fair value is allocated to individual assets within the group.
Gift Certificates and Cash Cards
We have a Tim Card® a quick pay cash card program. Generally, customers can prepay using cash, debit card or credit card for future purchases at participating Tim Hortons restaurants or over the Internet by reloading a dollar value onto their Tim Card when and as needed. A Tim Card entitles the holder to use the value for purchasing product only and the amounts generally are nonrefundable and not redeemable for cash. Tim Card holders are not entitled to any interest, dividends or returns on prepaid amounts. There are no expiration dates on the cash cards, and we do not charge any service fees that cause a decrease to customer balances.
Cash collected from the loading of the Tim Card is recorded as Restricted cash and cash equivalents and Restricted investments on the Consolidated Balance Sheet since these funds have been designated for use only by the cash card program to honour outstanding obligations. Changes in the Restricted cash and cash equivalents balances have been classified as an operating activity on the Consolidated Statement of Cash Flows while changes in the Restricted investments are classified as an investing activity. The Restricted cash and cash equivalents and Restricted investment balances at January 2, 2011 and January 3, 2010, represent the prepaid amounts not yet redeemed by customers. The outstanding customer obligations for both Tim Cards and gift certificates are recorded in Accrued liabilities, Other on the Consolidated Balance Sheet. Since the inception of the program, interest on the Restricted cash and cash equivalents and Restricted investments has been contributed to our advertising and promotion funds to help offset costs associated with this program.
While we will honour all cash cards presented for payment, we may, based on historical review after the program has been in place for some time, determine the likelihood of redemption to be remote for certain card balances due to, among other factors, long periods of inactivity. In these circumstances, to the extent management determines there is no requirement for remitting card balances to government agencies under unclaimed property laws and legal requirements governing gift card programs, the obligation for any such card balances may be transferred to our advertising and promotion funds. No such amounts were recognized in 2010, 2009 or 2008.
100
Table of Contents
In addition to the Tim Card program, we have gift certificates available in a limited number of non-traditional locations. The Company will continue to honour outstanding gift certificates. When a customer uses a gift certificate or a Tim Card to purchase product at a Company-operated restaurant, we recognize the revenue from the sale of the product. When a customer uses a gift certificate or Tim Card at a franchised restaurant, we recognize revenues, in the form of rents and royalties, arising from the sale of the product. We recognize income on unredeemed gift certificates (“gift certificate breakage”) when it can determine that the likelihood of the gift certificate being redeemed is remote and that there is no legal obligation to remit the unredeemed gift certificate value to relevant jurisdictions. We determine gift certificate breakage based on historical redemption patterns. Once the breakage rate is determined, it is recognized over a seven-year time period which is the estimated life of a gift certificate.
Reserve Contingencies for Litigation and Other Matters
In the normal course of business, we must make continuing estimates of potential future legal obligations and liabilities, which requires the use of management’s judgment on the outcome of various issues. Management may also use outside legal advice to assist in the estimating process; however, the ultimate outcome of various legal issues could be different than management estimates, and adjustments to income could be required.
Variable Interest Entities
In accordance with ASC 810, we analyze our variable interests, including our equity investments and certain license or operator arrangements with various entities. We determine our interests in variable interest entities (“VIEs”), and then assess whether we are considered to be the primary beneficiary of these VIEs. If it is determined that we are the primary beneficiary, we then consolidate the VIE’s assets, liabilities, results of operations and cash flows. If we are not the primary beneficiary, we account for such interests using other applicable U.S. GAAP.
We enter into flexible lease arrangements with certain operators who are not required to invest a significant amount of capital. In addition, U.S. franchisees participating in the FIP (“FIP Franchisee”) do not have a significant amount of initial capital invested that is not financed directly by us. Because the legal entity within which such an operator or FIP Franchisee operates is considered not to be adequately capitalized, that entity is considered a VIE as defined in the Master Glossary of the FASB Codification and according to the provisions in ASC 810. Based on management’s review of the financial statements it receives from these operators and FIP Franchisees, the projections performed by the Company indicate that we are, in some instances, the primary beneficiary of expected returns or losses as that term is defined by ASC 810, of these VIEs. Accordingly, we have consolidated on average, 250 to 275 restaurants during fiscal 2008 to fiscal 2010.
VIEs for which we are determined to be the primary beneficiary have an inconsequential impact on our reported consolidated net income and cash flows. The impact of consolidating these VIEs to our Consolidated Balance Sheets is also not significant. There are a small percentage of restaurants considered to be VIEs in which we hold a significant variable interest, but for which we are not the primary beneficiary. Our maximum exposure to loss as a result of our involvement with this small percentage of franchise restaurants is also inconsequential.
We have no equity interest in any of our restaurant owners. None of our assets serve as collateral for the consolidated restaurants, and creditors of these operators have no recourse to us. The only significant exposure to us related to these VIEs relates to the collection of amounts due to us, which are collected weekly. Generally, the agreements governing the license arrangements can be cancelled by either the restaurant owner or us with 30 days notice, further reducing our potential exposure.
In connection with RSU awards granted to employees, we established The TDL RSU Plan Trust that purchases and retains common shares to satisfy our contractual obligation to deliver shares to settle the awards for most Canadian employees. For accounting purposes, the cost of the shares held by the Trust has been accounted for as a reduction in outstanding common shares, and the Trust has been consolidated in accordance with ASC 810 as a VIE since the Company is the primary beneficiary.
101
Table of Contents
Fair Value Measurements
ASC 820 defines fair value, establishes a framework for measuring fair value under U.S. GAAP and enhances disclosures about fair value measurements. Fair value is defined under ASC 820 as the exchange price that would be received for an asset or paid to transfer a liability (an exit price) in the principal or most advantageous market for the asset or liability in an orderly transaction between market participants on the measurement date. Valuation techniques used to measure fair value under ASC 820 must maximize the use of observable inputs and minimize the use of unobservable inputs. The standard describes a fair value hierarchy based on three levels of inputs. The first two levels are considered observable and the last unobservable. These are used to measure fair value as follows:
| • | Level 1—Quoted prices (unadjusted) in active markets for identical assets or liabilities that the Company has the ability to access at the measurement date. |
| • | Level 2—Inputs, other than Level 1 inputs, that are observable for the assets or liabilities, either directly or indirectly. Level 2 inputs include: quoted market prices for similar assets or liabilities; quoted prices in markets that are not active; or, other inputs that are observable or can be corroborated by observable market data for substantially the full term of the assets or liabilities. |
| • | Level 3—Unobservable inputs that are supported by little or no market activity and that are significant to the fair value of the assets or liabilities. |
In accordance with ASC 815 and ASC 820, the tables below outline the Company’s outstanding derivatives and fair value measurements as at and for the years ended January 2, 2011 and January 3, 2010.
The following table summarizes the classification and fair value of non-financial assets on the Consolidated Balance Sheet:
| As at January 2, 2011 | ||||||||||||
| (in thousands) |
Fair value hierarchy |
Fair value asset (liability) |
Classification on Consolidated Balance Sheet |
|||||||||
| Long-lived assets(1) |
Level 3 | $ | 6,302 | Inventories and other | ||||||||
| Long-lived assets(1) |
Level 3 | $ | 6,796 | Property and equipment, net | ||||||||
| Total |
$ | 13,098 | ||||||||||
| (1) | The Company recorded an asset impairment charge of $18.4 million in 2010 relating to the long-lived assets of the Company’s Portland, Providence and Hartford markets in the New England region (see Note 3). The most significant long-lived assets are property and buildings for which the fair value of the underlying real estate was estimated to be approximately $12.3 million. Management estimated the fair value of the real estate assets by using independent property valuations. These valuations are considered to be a Level 3 valuation on the fair value hierarchy. A 10% change in management’s fair value estimate of the assets would either increase or decrease the value of the assets by less than $2 million. |
In addition, the Company values its assets held for sale at the lower of historical cost or fair value less cost to sell. When applicable, fair value is generally based on third-party appraisals.
Stock-based Compensation
Our 2006 Stock Incentive Plan, as amended (the “2006 Plan”) is an omnibus plan, designed to allow for a broad range of equity-based compensation awards in the form of restricted stock units (RSUs”), stock options, stock appreciation rights (“SARs”), dividend equivalent rights (“DERs”), performance awards and share awards. We currently provide compensation to certain employees under the 2006 Plan in the form of restricted stock units and stock options with tandem SARs. In addition, we issue deferred stock units (“DSUs”) to our directors under our Non-Employee Director Deferred Stock Unit Plan. We previously issued restricted stock units to directors,
102
Table of Contents
but these were fully vested and settled in November 2008. We account for stock-based compensation in accordance with the fair value recognition provisions of ASC 718—Compensation—Stock Compensation.
Restricted stock units—RSUs are measured at the fair market value based on the closing price of our common shares traded on the Toronto Stock Exchange on the first business day preceding the grant date. RSUs are generally expensed on a straight-line basis over the vesting period except for grants to retirement-eligible employees, which unless the grant of the RSU is subject to a performance condition, are expensed immediately. These expenses are recorded in general and administrative expenses, consistent with the classification of the related employee compensation expense. RSUs have accompanying DERs. In addition, we may grant performance-conditioned RSUs to certain of our employees. The performance component is based on prior-year performance and is only used to determine the amount of units granted. All other characteristics of the performance-based RSUs are the same as restricted stock.
Deferred stock units—DSUs are granted to non-employee members of our Board of Directors and are expensed on the date of grant since they vest immediately, although they are not payable until a director’s separation from service. DSUs are notional units which track the value of our common shares. These units are settled in cash based on the value of our common shares on the Toronto Stock Exchange on the date of the director’s separation of service from the Company. Since the awards are settled in cash, the award is accounted for using the liability method, which results in a revaluation of the liability to fair value each period and expensed. DSUs have accompanying DERs, which are expensed as earned.
Stock options—The Company uses the Black-Scholes-Merton option pricing model to value outstanding options which requires the use of subjective assumptions. These assumptions include: the estimated length of time employees will retain their stock options before exercising them (“the expected term”), the expected volatility of our common share price over the expected term, and the number of options that will ultimately not complete their vesting requirements (“forfeitures”). The awards are accounted for using the liability method, which results in a revaluation of the liability to fair value each period, and are expensed over the vesting period. Stock options with tandem SARs (see below) granted to retirement-eligible employees are expensed immediately. Changes in subjective assumptions as well as changes in the share price from period to period, can materially affect the estimate of fair value of stock-based compensation and, consequently, the related amount of compensation expense recognized on the Consolidated Statements of Operations. We issued stock option awards with tandem SARs for the first time to our named executive officers in fiscal 2008 and to all of our officers in fiscal 2009.
Stock appreciation rights—SARs may be granted alone or in conjunction with a stock option. A SAR related to an option terminates upon the expiration, forfeiture, or exercise of the related option, and is exercisable only to the extent that the related option is exercisable. Stock options with tandem SARs enable the employee to exercise the stock option to receive common shares or to exercise the SAR and receive a cash payment in each case of a value equal to the difference between the market price of the share on the exercise date and the exercise price of the stock option.
Segmented Reporting
We operate exclusively in the food-service industry and have determined that our reportable segments are those that are based on methods of internal reporting and management structure and represent the manner in which our chief decision maker views and evaluates the various aspects of our business. Our reportable segments are the geographic locations of Canada and the U.S.
Recently Issued Accounting Standards
In October 2009, the FASB issued Accounting Standard Update (“ASU”) No. 2009-13—Multiple Deliverable Revenue Arrangements, as codified in ASC 605—Revenue Recognition. The objective of this ASU is
103
Table of Contents
to address the accounting for multiple-deliverable arrangements to enable vendors to account for products or services (deliverables) separately rather than as a combined unit. The ASU also establishes a selling price hierarchy for determining the selling price of a deliverable and has expanded disclosures related to vendor’s multiple-deliverable revenue arrangements. This ASU is effective for fiscal years beginning after June 15, 2010, and we are currently assessing the potential impact, if any, the adoption of this ASU may have on our Consolidated Financial Statements.
In April 2010, the FASB issued ASU No. 2010-13—Effect of Denominating the Exercise Price of a Share-Based Payment Award in the Currency of the Market in Which the Underlying Equity Security Trades as codified in ASC 718—Compensation—Stock Compensation. This update addresses the classification of a share-based payment award with an exercise price denominated in the currency of a market in which the underlying equity security trades. ASC 718 is amended to clarify that a share-based payment award with an exercise price denominated in the currency of a market in which a substantial portion of the entity’s equity securities trades shall not be considered to contain a market, performance, or service condition. Therefore, such an award is not to be classified as a liability if it otherwise qualifies as equity classification. This ASU is effective for fiscal years beginning on or after December 15, 2010, and we are currently assessing the potential impact, if any, the adoption of this update may have on our Consolidated Financial Statements.
In April 2010, the FAS issued ASU No. 2010-17—Revenue Recognition—Milestone Method of Revenue Recognition as codified in ASC 605—Revenue Recognition. This update provides guidance on defining a milestone and determining when it may be appropriate to apply the milestone method of revenue recognition for research or development transactions. Consideration that is contingent on achievement of a milestone in its entirety may be recognized as revenue in the period in which the milestone is achieved only if the milestone is judged to meet certain criteria to be considered substantive. Milestones should be considered substantive in their entirety and may not be bifurcated. An arrangement may contain both substantive and nonsubstantive milestones that should be evaluated individually. This ASU is effective for fiscal years beginning on or after June 15, 2010, and we are currently assessing the potential impact, if any, the adoption of this update may have on our Consolidated Financial Statements.
Impact of Accounting Pronouncements Not Yet Implemented
In February 2010, the SEC released Commission Statement in Support of Convergence and Global Accounting Standards. The statement includes a detailed Work Plan to be executed by the SEC staff in its analysis in determining both whether and how to incorporate International Financial Reporting Standards (“IFRS”) into the U.S. financial reporting system. IFRS is a comprehensive series of accounting standards published by the International Accounting Standards Board. Under the proposed roadmap, if the SEC incorporates IFRS into the US domestic reporting system, companies could be required to prepare financial statements and accompanying notes in accordance with IFRS as early as fiscal 2015. As a foreign private issuer, the Company is able to apply IFRS earlier if certain approvals are obtained.
Further, although Canadian securities laws generally require Canadian reporting issuers to apply IFRS beginning in 2011, National Instrument 52-107 Acceptable Accounting Principles, Auditing Standards and Reporting Currency permits issuers that have a class of securities registered under section 12 of the U.S. Securities Exchange Act of 1934, as amended (the “Exchange Act”) or are required to file reports under section 15(d) of the Exchange Act and which are not registered or required to be registered as an investment company under the U.S. Investment Company Act of 1940, to elect to prepare financial statements that are filed with or delivered to a securities regulatory authority or regulator (other than acquisition statements) in accordance with U.S. GAAP. Pending the developments of the SEC’s work plan, the Company is currently assessing the impact that the adoption of IFRS would have on the condensed consolidated financial statements, accompanying notes and disclosures, and will continue to monitor the development of the potential implementation of IFRS.
104
Table of Contents
| Item 7A. | Quantitative and Qualitative Disclosures About Market Risk |
We are exposed to financial market risks associated with foreign exchange rates, commodity prices, interest rates and inflation. In accordance with our policies, we manage our exposure to these various market-based risks.
Foreign Exchange Risk
Our exposure to foreign exchange risk is primarily related to fluctuations between the Canadian dollar and the U.S. dollar. Our primary foreign exchange exposure to our cash flows results from purchases by Canadian operations in U.S. dollars and payments from Canadian operations to U.S. operations. Net cash flows between the Canadian and U.S. dollar currencies were approximately $220 million for fiscal 2010. In addition, we are exposed to foreign exchange fluctuations when we translate our U.S. operating results into Canadian dollars for reporting purposes. While these fluctuations are not significant to the consolidated operating results, the fluctuations in exchange rates do impact our U.S. segment operating results, and can affect the comparability between quarters and year-to-year. Also, from time to time, we hold U.S. dollars and other U.S. dollar net positions in Canadian dollar functional currency entities to support our business needs. The holding of U.S. dollar net positions in these entities can cause foreign exchange gains and losses which are included in Other expense (income), net, and can, therefore, affect our earnings.
We seek to manage significant cash flows and net income exposures related to exchange rate changes between these two currencies. We may use derivative products to reduce the risk of a significant impact on our cash flows or net income. Forward currency contracts are entered into to reduce some of the risk related to purchases paid for by the Canadian operations in U.S. dollars, such as coffee, including certain intercompany purchases. We do not hedge foreign currency exposure in a manner that would entirely eliminate the effect of changes in foreign currency exchange rates on net income and cash flows. We have a policy forbidding speculating in foreign currency. By their nature, derivative financial instruments involve risk including the credit risk of non-performance by counterparties, and our maximum potential loss may exceed the amount recognized in our balance sheet. To minimize this risk, except in certain circumstances, we limit the notional amount per counterparty to a maximum of $100.0 million. We have reviewed counterparty risk related to these derivative positions and do not believe there is significant risk with respect to these instruments.
Forward currency contracts to sell Canadian dollars and buy US$116 million and US$75.0 million were outstanding as of January 2, 2011 and January 3, 2010, respectively, primarily to hedge coffee purchases from third parties, including intercompany purchases. The fair value unrealized loss on these forward contracts was $3.5 million as of January 2, 2011, compared to an unrealized loss of $2.0 million as of January 3, 2010.
At the current level of annual operating income generated from our U.S. operations and current U.S. dollar cash flow exposures, if the U.S. currency rate changes by 10% the entire year, the annual impact on our net income and annual cash flows would not be material.
Commodity Risk
We purchase certain products such as coffee, wheat, edible oil and sugar and other prepared products, the prices of which are affected by commodity prices, in the normal course of business. Therefore, we are exposed to some price volatility related to weather and, more importantly, various other market conditions outside of our control. However, we do employ various purchasing and pricing contract techniques in an effort to minimize volatility. Generally, these techniques include setting fixed prices for periods of up to one year with suppliers, setting in advance the price for products to be delivered in the future, and unit pricing based on an average of commodity prices over the corresponding period of time. We purchase a significant amount of green coffee and typically have purchase commitments fixing the price for a minimum of six to twelve months depending upon prevailing market conditions. Given the current volatility in the commodity markets, we covered our key commodities through all of 2011 in an effort to have price certainty and security of supply. We also typically hedge against the risk of foreign exchange on green coffee prices at the same time. We do not generally make use
105
Table of Contents
of financial instruments to hedge commodity prices, partly because of our other contract pricing techniques outlined above. As we make purchases beyond our current commitments, we may be subject to higher commodity prices depending upon prevailing market conditions. Increases and decreases in commodity costs are largely passed through to franchisees, resulting in higher or lower revenues and higher or lower costs of sales from our business. These changes may impact margins as many of these products are typically priced based on a fixed-dollar mark-up. We and our restaurant owners have some ability to increase product pricing to offset a rise in commodity prices, subject to acceptance by restaurant owners and customers. These cost and pricing changes can impact revenues, costs and margins, and can create volatility quarter-over-quarter and year-over-year. See Item 1A. Risk Factors—Increases in the cost of commodities could have an adverse impact on our business and financial results.
Interest Rate Risk
In the second and fourth quarters of 2010, we issued $200 million and $100 million of Senior Notes, which were offered on a private placement basis in Canada with a term of seven years. Net proceeds from the Senior Notes were primarily used to prepay $300 million of our existing Term Debt, prior to maturity. The Senior Notes bear a fixed coupon interest rate of 4.20%, and an effective rate of 4.45% (resulting from the settlement of interest rate forwards used to hedge the interest rate prior to the issuance of the first portion of the Senior Notes, premium recorded on the subsequent issue of Senior Notes and the deferred financing fees associated with the issuances). As our cash is invested in short term variable rate instruments, we are now exposed on a net basis to interest rate movements on a net asset position when historically we have been exposed on a net liability position. If interest rates change by 100 basis points, the impact on our annual net income would not be material.
Inflation
Consolidated Financial Statements determined on an historical cost basis may not accurately reflect all the effects of changing prices on an enterprise. Several factors tend to reduce the impact of inflation for our business: inventories approximate current market prices, property holdings at fixed costs are substantial, and there is some ability to adjust prices. However, if several of the various costs in our business experience inflation at the same time, such as commodity price increases beyond our ability to control and increased labour costs, we and our restaurant owners may not be able to adjust prices to sufficiently offset the effect of the various cost increases without negatively impacting consumer demand.
| Item 8. | Financial Statements and Supplementary Data |
Management’s Statement of Responsibility for Financial Statements
Management is responsible for preparation of the Consolidated Financial Statements and other related financial information included in this Annual Report on Form 10-K. The Consolidated Financial Statements have been prepared in conformity with accounting principles generally accepted in the United States, incorporating management’s reasonable estimates and judgments, where applicable.
106
Table of Contents
TIM HORTONS INC. AND SUBSIDIARIES
INDEX TO CONSOLIDATED FINANCIAL STATEMENTS
107
Table of Contents
TIM HORTONS INC. AND SUBSIDIARIES
Consolidated Statement of Operations
(in thousands of Canadian dollars, except per share data)
| Year ended | ||||||||||||
| January 2, 2011 |
January 3, 2010 |
December 28, 2008 |
||||||||||
| Revenues |
||||||||||||
| Sales |
$ | 1,755,244 | $ | 1,704,065 | $ | 1,541,882 | ||||||
| Franchise revenues |
||||||||||||
| Rents and royalties |
687,039 | 644,755 | 593,483 | |||||||||
| Franchise fees |
94,212 | 90,033 | 93,808 | |||||||||
| 781,251 | 734,788 | 687,291 | ||||||||||
| Total revenues |
2,536,495 | 2,438,853 | 2,229,173 | |||||||||
| Costs and expenses |
||||||||||||
| Cost of sales |
1,527,405 | 1,464,844 | 1,313,036 | |||||||||
| Operating expenses |
246,335 | 236,784 | 214,935 | |||||||||
| Franchise fee costs |
91,743 | 86,903 | 87,486 | |||||||||
| General and administrative expenses |
147,300 | 141,739 | 130,846 | |||||||||
| Equity (income) (note 11) |
(14,649 | ) | (13,700 | ) | (14,279 | ) | ||||||
| Asset impairment and related closure costs (note 3) |
28,298 | 0 | 21,266 | |||||||||
| Other (income), net |
(1,100 | ) | (3,319 | ) | (2,564 | ) | ||||||
| Total costs and expenses, net |
2,025,332 | 1,913,251 | 1,750,726 | |||||||||
| Gain on sale of interest in Maidstone Bakeries (note 4) |
361,075 | 0 | 0 | |||||||||
| Operating income |
872,238 | 525,602 | 478,447 | |||||||||
| Interest (expense) |
(26,642 | ) | (21,134 | ) | (24,558 | ) | ||||||
| Interest income |
2,462 | 1,950 | 4,926 | |||||||||
| Income before income taxes |
848,058 | 506,418 | 458,815 | |||||||||
| Income taxes (note 7) |
200,940 | 186,606 | 150,309 | |||||||||
| Net income |
647,118 | 319,812 | 308,506 | |||||||||
| Net income attributable to noncontrolling interests |
23,159 | 23,445 | 23,828 | |||||||||
| Net income attributable to Tim Hortons Inc. |
$ | 623,959 | $ | 296,367 | $ | 284,678 | ||||||
| Basic earnings per common share attributable to |
$ | 3.59 | $ | 1.64 | $ | 1.55 | ||||||
| Diluted earnings per common share attributable to |
$ | 3.58 | $ | 1.64 | $ | 1.55 | ||||||
| Weighted average number of common shares outstanding – Basic (in thousands) (note 2) |
174,035 | 180,477 | 183,298 | |||||||||
| Weighted average number of common shares outstanding – Diluted (in thousands) (note 2) |
174,215 | 180,609 | 183,492 | |||||||||
| Dividends per common share |
$ | 0.52 | $ | 0.40 | $ | 0.36 | ||||||
See Accompanying Notes to the Consolidated Financial Statements.
108
Table of Contents
TIM HORTONS INC. AND SUBSIDIARIES
Consolidated Balance Sheet
(in thousands of Canadian dollars)
| As at | ||||||||
| January 2, 2011 |
January 3, 2010 |
|||||||
| Assets |
||||||||
| Current assets |
||||||||
| Cash and cash equivalents |
$ | 574,354 | $ | 121,653 | ||||
| Restricted cash and cash equivalents (note 1) |
67,110 | 60,629 | ||||||
| Restricted investments (note 1) |
37,970 | 20,186 | ||||||
| Accounts receivable, net (note 5) |
182,005 | 179,942 | ||||||
| Notes receivable, net (note 6) |
12,543 | 20,823 | ||||||
| Deferred income taxes (note 7) |
7,025 | 3,475 | ||||||
| Inventories and other, net (note 8) |
100,712 | 80,490 | ||||||
| Advertising fund restricted assets (note 20) |
27,402 | 26,681 | ||||||
| Total current assets |
1,009,121 | 513,879 | ||||||
| Property and equipment, net (note 9) |
1,373,670 | 1,494,032 | ||||||
| Notes receivable, net (note 6) |
3,811 | 3,475 | ||||||
| Deferred income taxes (note 7) |
13,730 | 8,919 | ||||||
| Intangible assets, net (note 10) |
5,270 | 8,405 | ||||||
| Equity investments (note 11) |
44,767 | 45,875 | ||||||
| Other assets |
31,147 | 19,706 | ||||||
| Total assets |
$ | 2,481,516 | $ | 2,094,291 | ||||
| Liabilities and Equity |
||||||||
| Current liabilities |
||||||||
| Accounts payable (note 12) |
$ | 142,444 | $ | 135,248 | ||||
| Accrued liabilities: |
||||||||
| Salaries and wages |
20,567 | 23,268 | ||||||
| Taxes |
65,654 | 27,586 | ||||||
| Other (note 12) |
209,663 | 111,401 | ||||||
| Deferred income taxes (note 7) |
2,205 | 376 | ||||||
| Advertising fund restricted liabilities (note 13 and note 20) |
41,026 | 43,944 | ||||||
| Current portion of long-term obligations |
9,937 | 7,821 | ||||||
| Total current liabilities |
491,496 | 349,644 | ||||||
| Long-term obligations |
||||||||
| Long-term debt (note 13) |
344,726 | 336,302 | ||||||
| Advertising fund restricted debt (note 13 and note 20) |
468 | 415 | ||||||
| Capital leases (note 15) |
82,217 | 67,156 | ||||||
| Deferred income taxes (note 7) |
8,237 | 10,159 | ||||||
| Other long-term liabilities (note 12) |
111,930 | 74,929 | ||||||
| Total long-term obligations |
547,578 | 488,961 | ||||||
| Commitments and contingencies (note 16) |
||||||||
| Equity |
||||||||
| Equity of Tim Hortons Inc. |
||||||||
| Common shares ($2.84 stated value per share). Authorized: unlimited shares. Issued: 170,664,295 and 177,318,614, respectively (note 17) |
484,050 | 502,872 | ||||||
| Common shares held in Trust, at cost: 278,082 and 278,500 shares, respectively (note 17) |
(9,542 | ) | (9,437 | ) | ||||
| Retained earnings |
1,105,882 | 796,235 | ||||||
| Accumulated other comprehensive loss |
(143,589 | ) | (120,061 | ) | ||||
| Total equity of Tim Hortons Inc. |
1,436,801 | 1,169,609 | ||||||
| Noncontrolling interests |
5,641 | 86,077 | ||||||
| Total equity |
1,442,442 | 1,255,686 | ||||||
| Total liabilities and equity |
$ | 2,481,516 | $ | 2,094,291 | ||||
See Accompanying Notes to the Consolidated Financial Statements.
Approved on behalf of the Board:
| By: |
/S/ DONALD B. SCHROEDER |
By: |
/S/ MICHAEL J. ENDRES | |||
| Donald B. Schroeder, Director |
Michael J. Endres, Director |
109
Table of Contents
TIM HORTONS INC. AND SUBSIDIARIES
Consolidated Statement of Cash Flows
(in thousands of Canadian dollars)
| Year ended | ||||||||||||
| January 2, 2011 |
January 3, 2010 |
December 28, 2008 |
||||||||||
| Cash flows provided from (used in) operating activities |
||||||||||||
| Net income |
$ | 647,118 | $ | 319,812 | $ | 308,506 | ||||||
| Adjustments to reconcile net income to net cash provided by operating activities |
||||||||||||
| Depreciation and amortization |
118,385 | 113,475 | 103,793 | |||||||||
| Asset impairment (note 3) |
18,352 | 0 | 16,559 | |||||||||
| Stock-based compensation expense |
14,263 | 8,869 | 9,630 | |||||||||
| Equity income, net of cash dividends |
132 | 4,265 | 3,037 | |||||||||
| Deferred income taxes |
1,285 | 25,491 | (12,471 | ) | ||||||||
| Changes in operating assets and liabilities |
||||||||||||
| Restricted cash and cash equivalents |
(6,920 | ) | 789 | (23,820 | ) | |||||||
| Accounts and notes receivable |
(10,923 | ) | (11,432 | ) | (54,680 | ) | ||||||
| Inventories and other |
(29,275 | ) | (329 | ) | (6,081 | ) | ||||||
| Accounts payable and accrued liabilities |
145,544 | (20,494 | ) | 29,553 | ||||||||
| Settlement of cash flow hedges (note 14) |
(4,855 | ) | 0 | 0 | ||||||||
| Gain on sale of interest in Maidstone Bakeries (note 4) |
(361,075 | ) | 0 | 0 | ||||||||
| Other, net |
(6,487 | ) | 2,176 | 11,351 | ||||||||
| Net cash provided from operating activities |
525,544 | 442,622 | 385,377 | |||||||||
| Cash flows (used in) provided from investing activities |
||||||||||||
| Capital expenditures |
(132,912 | ) | (160,458 | ) | (184,538 | ) | ||||||
| Purchase of restricted investments |
(37,832 | ) | (20,136 | ) | (11,881 | ) | ||||||
| Proceeds from sale of restricted investments |
20,240 | 0 | 12,000 | |||||||||
| Principal payments received on notes receivable |
9,808 | 2,821 | 3,939 | |||||||||
| Proceeds from sale of interest in Maidstone Bakeries (note 4) |
475,000 | 0 | 0 | |||||||||
| Cash and cash equivalents of Maidstone Bakeries divested |
(30,411 | ) | 0 | 0 | ||||||||
| Other investing activities |
(7,874 | ) | (22,540 | ) | (13,418 | ) | ||||||
| Net cash used in investing activities |
296,019 | (200,313 | ) | (193,898 | ) | |||||||
| Cash flows (used in) provided from financing activities |
||||||||||||
| Purchase of treasury stock (note 17) |
0 | (16,701 | ) | (165,258 | ) | |||||||
| Purchase of common shares (note 17) |
(242,595 | ) | (113,401 | ) | 0 | |||||||
| Purchase of common shares held in trust (note 17) |
(3,252 | ) | (713 | ) | (3,842 | ) | ||||||
| Purchase of common shares for settlement of restricted stock units (note 18) |
(753 | ) | (477 | ) | (226 | ) | ||||||
| Dividend payments to common shareholders |
(90,304 | ) | (72,506 | ) | (66,086 | ) | ||||||
| Distributions and other to noncontrolling interests |
(22,524 | ) | (30,484 | ) | (25,370 | ) | ||||||
| Proceeds from issuance of shares to noncontrolling interests |
0 | 1,305 | 0 | |||||||||
| Proceeds from issuance of debt, net of issuance costs |
300,823 | 3,507 | 3,796 | |||||||||
| Principal payments on long-term debt obligations |
(307,023 | ) | (6,582 | ) | (7,376 | ) | ||||||
| Net cash used in financing activities |
(365,628 | ) | (236,052 | ) | (264,362 | ) | ||||||
| Effect of exchange rate changes on cash |
(3,234 | ) | (9,321 | ) | 10,618 | |||||||
| Increase (decrease) in cash and cash equivalents |
452,701 | (3,064 | ) | (62,265 | ) | |||||||
| Cash and cash equivalents at beginning of year |
121,653 | 124,717 | 186,982 | |||||||||
| Cash and cash equivalents at end of year |
$ | 574,354 | $ | 121,653 | $ | 124,717 | ||||||
See supplemental cash flow information (note 22).
See Accompanying Notes to the Consolidated Financial Statements.
110
Table of Contents
TIM HORTONS INC. AND SUBSIDIARIES
Consolidated Statement of Equity
(in thousands of Canadian dollars)
| Year ended | ||||||||||||
| January 2, 2011 |
January 3, 2010 |
December 28, 2008 |
||||||||||
| Common shares |
||||||||||||
| Balance at beginning of year |
$ | 502,872 | $ | 0 | $ | 0 | ||||||
| Converted from common stock (note 17) |
0 | 513,318 | 0 | |||||||||
| Repurchase of common shares |
(18,822 | ) | (10,446 | ) | 0 | |||||||
| Balance at end of year |
$ | 484,050 | $ | 502,872 | $ | 0 | ||||||
| Common stock |
||||||||||||
| Balance at beginning of year |
$ | 0 | $ | 289 | $ | 289 | ||||||
| Converted to common shares (note 17) |
0 | (289 | ) | 0 | ||||||||
| Balance at end of year |
$ | 0 | $ | 0 | $ | 289 | ||||||
| Capital in excess of par value |
||||||||||||
| Balance at beginning of year |
$ | 0 | $ | 929,102 | $ | 931,084 | ||||||
| Stock-based compensation |
0 | (322 | ) | (1,982 | ) | |||||||
| Converted to common shares (note 17) |
0 | (928,780 | ) | 0 | ||||||||
| Balance at end of year |
$ | 0 | $ | 0 | $ | 929,102 | ||||||
| Treasury stock (note 17) |
||||||||||||
| Balance at beginning of year |
$ | 0 | $ | (399,314 | ) | $ | (235,155 | ) | ||||
| Purchased during the year |
0 | (16,701 | ) | (165,258 | ) | |||||||
| Reissued during the year (note 18) |
0 | 264 | 1,099 | |||||||||
| Cancelled and retired during the year (note 17) |
0 | 415,751 | 0 | |||||||||
| Balance at end of year |
$ | 0 | $ | 0 | $ | (399,314 | ) | |||||
| Common shares held in Trust (note 18) |
||||||||||||
| Balance at beginning of year |
$ | (9,437 | ) | $ | (12,287 | ) | $ | (14,628 | ) | |||
| Purchased during the year |
(3,252 | ) | (713 | ) | (3,842 | ) | ||||||
| Disbursed or sold from Trust during the year (notes 17 and 18) |
3,147 | 3,563 | 6,183 | |||||||||
| Balance at end of year |
$ | (9,542 | ) | $ | (9,437 | ) | $ | (12,287 | ) | |||
| Retained earnings |
||||||||||||
| Balance at beginning of year |
$ | 796,235 | $ | 677,550 | $ | 458,958 | ||||||
| Net income attributable to Tim Hortons Inc. |
623,959 | 296,367 | 284,678 | |||||||||
| Dividends |
(90,304 | ) | (72,506 | ) | (66,086 | ) | ||||||
| Stock-based compensation |
(235 | ) | (2,221 | ) | 0 | |||||||
| Repurchase of common shares—excess of stated value (note 17) |
(223,773 | ) | (102,955 | ) | 0 | |||||||
| Balance at end of year |
$ | 1,105,882 | $ | 796,235 | $ | 677,550 | ||||||
| Accumulated other comprehensive loss |
||||||||||||
| Balance at beginning of year |
$ | (120,061 | ) | $ | (55,348 | ) | $ | (138,465 | ) | |||
| Other comprehensive income (loss) |
(23,528 | ) | (64,713 | ) | 83,117 | |||||||
| Balance at end of year |
$ | (143,589 | ) | $ | (120,061 | ) | $ | (55,348 | ) | |||
| Total equity of Tim Hortons Inc. |
$ | 1,436,801 | $ | 1,169,609 | $ | 1,139,992 | ||||||
| Noncontrolling interests |
||||||||||||
| Balance at beginning of year |
$ | 86,077 | $ | 91,811 | $ | 93,353 | ||||||
| Net income attributable to noncontrolling interests. |
23,159 | 23,445 | 23,828 | |||||||||
| Capital contributions from noncontrolling interests |
0 | 1,305 | 0 | |||||||||
| Sale of interest in Maidstone Bakeries |
(81,071 | ) | 0 | 0 | ||||||||
| Distributions and other to noncontrolling interests |
(22,524 | ) | (30,484 | ) | (25,370 | ) | ||||||
| Balance at end of year |
$ | 5,641 | $ | 86,077 | $ | 91,811 | ||||||
| Total equity |
$ | 1,442,442 | $ | 1,255,686 | $ | 1,231,803 | ||||||
See Accompanying Notes to the Consolidated Financial Statements.
111
Table of Contents
TIM HORTONS INC. AND SUBSIDIARIES
Consolidated Statement of Equity—Number of Common Shares/Stock of Tim Hortons Inc.
(in thousands of common shares/stock)
| Year ended | ||||||||||||
| January 2, 2011 |
January 3, 2010 |
December 28, 2008 |
||||||||||
| Common shares |
||||||||||||
| Balance at beginning of year |
177,319 | 0 | 0 | |||||||||
| Converted from common stock (note 17) |
0 | 180,997 | 0 | |||||||||
| Repurchased during the year (note 17) |
(6,655 | ) | (3,678 | ) | 0 | |||||||
| Balance at end of year |
170,664 | 177,319 | 0 | |||||||||
| Common stock |
||||||||||||
| Balance at beginning of year |
0 | 193,303 | 193,303 | |||||||||
| Converted to common shares (note 17) |
0 | (193,303 | ) | 0 | ||||||||
| Balance at end of year |
0 | 0 | 193,303 | |||||||||
| Treasury stock (note 17) |
||||||||||||
| Balance at beginning of year |
0 | (11,754 | ) | (6,750 | ) | |||||||
| Purchased during the year |
0 | (560 | ) | (5,036 | ) | |||||||
| Reissued during the year (note 18) |
0 | 8 | 32 | |||||||||
| Cancelled and retired during the year (note 17) |
0 | 12,306 | 0 | |||||||||
| Balance at end of year |
0 | 0 | (11,754 | ) | ||||||||
| Common shares held in Trust (note 17) |
||||||||||||
| Balance at beginning of year |
(279 | ) | (358 | ) | (421 | ) | ||||||
| Purchased during the year |
(91 | ) | (25 | ) | (116 | ) | ||||||
| Disbursed or sold from Trust during year (notes 17 and 18) |
92 | 104 | 179 | |||||||||
| Balance at end of year |
(278 | ) | (279 | ) | (358 | ) | ||||||
| Common shares/stock issued and outstanding |
170,386 | 177,040 | 181,191 | |||||||||
See Accompanying Notes to the Consolidated Financial Statements.
112
Table of Contents
TIM HORTONS INC. AND SUBSIDIARIES
Consolidated Statement of Comprehensive Income
(in thousands of Canadian dollars)
| Year ended | ||||||||||||
| January 2, 2011 |
January 3, 2010 |
December 28, 2008 |
||||||||||
| Net income |
$ | 647,118 | $ | 319,812 | $ | 308,506 | ||||||
| Other comprehensive income (loss) |
||||||||||||
| Translation adjustments |
(22,073 | ) | (62,340 | ) | 83,331 | |||||||
| Unrealized gains (losses) from cash flow hedges: |
||||||||||||
| Net (loss) from change in fair value of derivatives |
(8,412 | ) | (11,152 | ) | (3,204 | ) | ||||||
| Amount of net loss reclassified to earnings during the year |
6,957 | 8,779 | 2,990 | |||||||||
| Total cash flow hedges (loss) |
(1,455 | ) | (2,373 | ) | (214 | ) | ||||||
| Total other comprehensive income (loss) |
(23,528 | ) | (64,713 | ) | 83,117 | |||||||
| Total comprehensive income |
$ | 623,590 | $ | 255,099 | $ | 391,623 | ||||||
| Total comprehensive income attributable to noncontrolling interests |
23,159 | 23,445 | 23,828 | |||||||||
| Total comprehensive income attributable to Tim Hortons Inc. |
$ | 600,431 | $ | 231,654 | $ | 367,795 | ||||||
Income tax (expense)/recovery components netted in the above table are detailed as follows:
| Year ended | ||||||||||||
| January 2, 2011 |
January 3, 2010 |
December 28, 2008 |
||||||||||
| Cash flow hedges: |
||||||||||||
| Income tax recovery from change in fair value of derivatives |
$ | 3,196 | $ | 987 | $ | 3,048 | ||||||
| Income tax expense reclassified to earnings |
$ | (3,368 | ) | $ | (1,602 | ) | $ | (333 | ) | |||
See accompanying Notes to the Consolidated Financial Statements.
113
Table of Contents
TIM HORTONS INC. AND SUBSIDIARIES
Notes to the Consolidated Financial Statements
(in thousands of Canadian dollars, except share and per share data)
NOTE 1 SUMMARY OF SIGNIFICANT ACCOUNTING POLICIES
Description of business
Tim Hortons Inc. is a corporation governed by the Canada Business Corporations Act (the “CBCA”). For periods on or before September 27, 2009, Tim Hortons Inc. was a Delaware corporation (together with its subsidiaries, collectively referred to herein as “THI USA”).
References herein to “Tim Hortons,” or the “Company” refer to THI USA and its subsidiaries for periods on or before September 27, 2009 and to Tim Hortons Inc., the CBCA corporation, and its subsidiaries for periods on or after September 28, 2009, unless specifically noted otherwise.
At 12:00 a.m. on September 28, 2009, THI USA effected a merger that resulted in the conversion of issued and outstanding common stock of THI USA, US$0.001 par value per share, into an equal number of common shares, without par value, in the Company. The Company conducts the business previously conducted by THI USA in substantially the same manner (see note 17). The merger was accounted for as a reorganization of entities under common control; therefore, there was no revaluation of THI USA’s consolidated assets and liabilities, and the Company will continue to use the historical cost basis method of accounting.
The Company’s principal business is the development and franchising and, to a minimal extent, operation of quick service restaurants that serve coffee and other hot and cold beverages, baked goods, sandwiches, soups, and other food products. In addition, the Company has vertically integrated manufacturing, warehouse and distribution operations which supply a significant portion of the system restaurants with food products, including shelf-stable products, and, from one distribution centre, refrigerated and frozen food products, as well as paper and equipment. The Company also controls the real estate underlying a substantial majority of the system restaurants, which generates another source of revenue. As of January 2, 2011, the Company and its restaurant owners operated 3,148 restaurants in Canada (99.5% franchised) and 602 restaurants in the United States (“U.S.”) (99.3% franchised) under the name “Tim Hortons®.” In addition, the Company had 275 primarily self-serve licensed locations in the Republic of Ireland and the United Kingdom as of January 2, 2011.
Fiscal year
The Company’s fiscal year ends on the Sunday nearest to December 31. The Company’s 2010 and 2008 fiscal years both consisted of 52 weeks, and the 2009 fiscal year of the Company consisted of 53 weeks.
Basis of presentation and principles of consolidation
The Company prepares its financial statements in accordance with U.S. GAAP. In the opinion of management, the accompanying Consolidated Financial Statements contain all adjustments (all of which are normal and recurring in nature) necessary to state fairly the Company’s financial position as of January 2, 2011 and January 3, 2010, and the consolidated results of operations, comprehensive income and cash flows for the years ended January 2, 2011, January 3, 2010 and December 28, 2008.
The functional currency of Tim Hortons Inc. is the Canadian dollar, as the majority of the Company’s cash flows are in Canadian dollars. The functional currency of each of the Company’s subsidiaries and legal entities is the local currency in which each subsidiary operates, which is the Canadian dollar, the U.S. dollar or the Euro. The majority of the Company’s operations, restaurants and cash flows are based in Canada, and the Company is primarily managed in Canadian dollars. As a result, the Company’s reporting currency is the Canadian dollar.
The Consolidated Financial Statements include the results and balances of Tim Hortons Inc., its wholly-owned subsidiaries and certain independent operators and joint-ventures consolidated according to Financial
114
Table of Contents
TIM HORTONS INC. AND SUBSIDIARIES
Notes to the Consolidated Financial Statements—(Continued)
(in thousands of Canadian dollars, except share and per share data)
Accounting Standards Board’s (“FASB”) Accounting Standard Codification (“ASC”) 810—Consolidation. Intercompany accounts and transactions among consolidated entities have been eliminated upon consolidation. Investments in non-consolidated affiliates over which the Company exercises significant influence, but for which the Company is not the primary beneficiary and does not have control, are accounted for using the equity method. The Company’s share of the earnings or loss of these non-consolidated affiliates is included in equity income, which is included as part of operating income since these investments are operating ventures closely integrated in the Company’s business operations (see note 11).
Use of estimates
The preparation of Consolidated Financial Statements in conformity with U.S. GAAP requires management to make assumptions and estimates. These assumptions and estimates affect the reported amounts of assets and liabilities and the disclosure of contingent assets and liabilities as of the date of the Consolidated Financial Statements and the reported amounts of revenues and expenses during the reporting periods. Estimates and judgments are inherent in, but not limited to the following: the estimation of the collectability of royalty and other franchise related revenue; legal obligations; income taxes; various other commitments and contingencies; valuations used when assessing potential impairment of long-lived assets; inventory valuations; gift certificate breakage; the estimation of the useful lives of long-lived assets; estimates associated with restaurant closure costs; and, valuations associated with estimating stock-based compensation expenses. While management applies its judgment based on assumptions believed to be reasonable under the circumstances and at the time, actual results could vary from these assumptions or if different assumptions had been used. The Company evaluates and updates its assumptions and estimates based on new events occurring, additional information being obtained, or more experience being acquired.
In the normal course of business, the Company must make continuing estimates of potential future legal obligations and liabilities, which also requires the use of management’s judgment on the outcome of various issues. Management may also use outside legal advice to assist in the estimating process. However, the ultimate outcome of various legal issues could be different than management estimates, and adjustments to income could be required (see note 16).
Cash and cash equivalents
The Company considers short-term investments, which are highly liquid and have original maturities of three months or less, as cash equivalents. The carrying values of cash and cash equivalents approximate their fair value due to the short-term nature of these investments. The Company has approximately $107.8 million (2009 – $54.1 million) in cash and $466.6 million (2009 – $67.6 million) in cash equivalents as at January 2, 2011. The Company limits its counterparty risk associated with cash and cash equivalents by utilizing a number of different financial institutions and limiting the total amount of cash and cash equivalents held at any individual financial institution. The Company continually monitors the credit ratings of its counterparties and adjusts positions if appropriate. The majority of the cash and cash equivalents at January 2, 2011 and January 3, 2010 was held at large Canadian financial institutions.
Restricted cash and cash equivalents and restricted investments
Amounts presented as Restricted cash and cash equivalents and Restricted investments on the Company’s Consolidated Balance Sheet relate to the Company’s Tim Card® quick-pay cash card program. The combined balances as of January 2, 2011 and January 3, 2010 represent the net amount of cash loaded on the cards by
115
Table of Contents
TIM HORTONS INC. AND SUBSIDIARIES
Notes to the Consolidated Financial Statements—(Continued)
(in thousands of Canadian dollars, except share and per share data)
customers, less redemptions. The balances are restricted, and cannot be used for any purpose other than for settlement of obligations under the cash card program. Since the inception of the program, the interest on the restricted cash and cash equivalents and restricted investments has been contributed by the Company to the Company’s advertising and promotion funds to help offset costs associated with this program. Obligations under the cash card program are included in Accrued liabilities, Other on the Consolidated Balance Sheet and are disclosed in note 12. The Company had approximately $31.5 million (2009 – $44.4 million) in restricted cash, $35.6 million (2009 – $16.2 million) in restricted cash equivalents, and $38.0 million (2009 – $20.2 million) in restricted investments at January 2, 2011.
From time to time, the Company invests some of these funds for initial periods in excess of three months, but less than one year. Only restricted cash and cash equivalents balances in excess of expected net redemptions over the investment time horizon are used for such investments, and the Company does not intend to redeem these investments prior to maturity. As a result, these investments are deemed to be held-to-maturity and are recorded at amortized cost on the Consolidated Balance Sheet. The carrying amount of the restricted investments approximates fair value due to the short-term nature of the investments. All restricted investments mature by February 2011.
Increases or decreases in restricted cash and cash equivalents are reflected in Net cash provided from operating activities on the Consolidated Statement of Cash Flows since the funds will be used to fulfill current obligations to customers recorded in Accrued liabilities, Other on the Consolidated Balance Sheet. Changes in the customer obligations are included in Net cash provided from operating activities as the offset to changes in restricted cash and cash equivalents balances. Purchases of and proceeds upon the maturity of restricted investments are included in Net cash used in investment activities on the Consolidated Statement of Cash Flows. Funding for these investments is drawn from restricted cash and cash equivalents balances.
Inventories
Inventories are stated at the lower of cost (moving average) and market and consist primarily of raw materials such as green coffee beans and finished goods such as restaurant food items, new equipment and parts, and paper supplies.
Property and equipment
The Company carries its property and equipment at cost and depreciates and amortizes these assets using the straight-line method over the following estimated useful lives:
| Depreciation Periods(1) | ||
| Building and leasehold improvements | 10 to 40 years or lease term | |
| Restaurant and other equipment | 7 to 10 years | |
| Capital leases | 8 to 40 years or lease term | |
| Computer hardware and software | 3 to 10 years | |
| Advertising fund property and equipment | 3 to 10 years | |
| Manufacturing and other equipment | 4 to 30 years | |
| Construction in progress | Reclassified to above categories when put in use |
| (1) | The Company estimates useful lives on buildings and equipment based on historical data and industry trends. The Company monitors its capitalization and amortization policies to ensure they remain appropriate. Lives may be related to legal or contractual lives or must be estimated by the Company based on specific circumstances. |
116
Table of Contents
TIM HORTONS INC. AND SUBSIDIARIES
Notes to the Consolidated Financial Statements—(Continued)
(in thousands of Canadian dollars, except share and per share data)
Interest and other costs associated with the construction of new restaurants and facilities are capitalized. Major improvements are capitalized, while maintenance and repairs are expensed when incurred. Gains and losses on the disposition of property and equipment are included in Other (income), net on the Consolidated Statement of Operations.
Advertising fund property and equipment includes certain assets purchased or leased by the advertising fund. Due to their long-term nature, these assets have been included in Property and equipment on the Consolidated Balance Sheet rather than Advertising fund restricted assets, which are classified as current assets. See note 13 for a description of collateralized debt amounts associated with the purchase of certain of these assets and note 20 for a general description of the Company’s advertising funds.
Impairment of Long-lived Assets
Long-lived assets are grouped at the lowest level of independent cash flows and tested for impairment whenever an event or circumstance occurs that indicates impairment may exist (“triggering event”), which may include a current expectation that, more likely than not, a long-lived asset or asset group will be sold or otherwise disposed of prior to its estimated useful life.
Restaurant-related long-lived assets are grouped into operating markets as this is the lowest identifiable level of independent cash flows. Events such as prolonged negative same-store sales growth in the market, which is a key operating metric, or prolonged negative cash flows in the operating market, are indicators the Company uses in evaluating whether an impairment may exist. The Company also tests for impairment if it has a higher-than-normal amount of restaurant closures in any one market. The Company considers as well the length of time the Company has been in the market as it takes time to fully establish a market. Generally, if same-store sales decline over time on a consecutive basis, further evaluation may be required, including review of operating market cash flows. The impairment analysis of the triggering events described above differs depending upon whether the affected market is considered a developed market or a developing market. In developed markets, one of the key indicators for the overall health of an operating market is same-store sales growth. In developing markets, the Company assesses a number of factors, including systemwide sales growth, which encompasses new restaurants and same-store sales growth, the stage of growth of the operating market and the average unit sales volume trends, as well as a higher-than-normal amount of restaurant closures in a market. Given the external market conditions present for the majority of the period under review, the Company also makes assessments as to whether declines are an indication of expected long-term performance for the developing market or whether the declines are due to the impact of external market conditions.
Non-restaurant-related assets are grouped based on their ability to generate independent cash flows. In the case of the Company’s manufacturing facilities, they are assessed on a facility-by-facility basis. Corporate assets, which relate primarily to land, buildings, and computer hardware and software systems, are grouped on a consolidated level with all long-lived assets as they support the entire business and independent cash flows are not generated from these specific assets.
If it is determined that a triggering event has occurred, an undiscounted cash flow analysis is completed on the affected asset group to determine if the future expected cash flows of an asset group are sufficient to recover the carrying value of the assets. If it is determined that the undiscounted cash flows are insufficient, then the asset group is deemed to be impaired. The fair value of the property and equipment is estimated using primarily third-party appraisals or the discounted cash flows, as appropriate. If the fair value of asset group is less than the carrying amount, an impairment loss is recognized for the difference between the carrying amount and the fair
117
Table of Contents
TIM HORTONS INC. AND SUBSIDIARIES
Notes to the Consolidated Financial Statements—(Continued)
(in thousands of Canadian dollars, except share and per share data)
value of the asset group. The impairment loss is allocated to the long-lived assets in the group on a pro-rata basis, except when the carrying amount of property and equipment is not reduced below its fair value whenever such fair value is readily determinable.
Leases
For operating leases, minimum lease payments, including minimum scheduled rent increases, are recognized as rent expense on a straight-line basis over the lease term as that term is defined in ASC 840. This term includes certain option periods considered in the lease term and any periods during which the Company has use of the property but is not charged rent by a landlord (“rent holiday”). Contingent rentals are generally based on either a percentage of restaurant sales or as a percentage of restaurant sales in excess of stipulated amounts, and thus are not included in minimum lease payments but are included in rent expense when incurred. Rent incurred during the construction period is expensed. Leasehold improvement incentives paid to the Company by a landlord are recorded as a liability and amortized as a reduction of rent expense over the lease term. No individual lease is material to the Company.
When determining the lease term for purposes of recording depreciation and rent or for evaluating whether a lease is capital or operating, the Company includes option periods for which failure to renew the lease imposes an economic penalty on the Company of such an amount that a renewal appears, at the inception of the lease, to be reasonably assured. For example, such an economic penalty would exist if the Company were to choose not to exercise an option on leased land upon which the Company had constructed a restaurant and, as a result, the Company would lose the ability to use the restaurant.
In the case of property that is leased or subleased by the Company to restaurant owners, minimum lease receipts, including minimum scheduled rent increases, are recorded as rent revenue on a straight-line basis consistent with the treatment of rental payments. Contingent rent revenue is generally based on a percentage of franchised restaurant sales and is recorded when these sales levels are met or exceeded.
Intangibles assets
Intangibles are recorded at fair value at the time they are acquired. Intangibles are amortized on a straight-line basis over periods of up to 12 years. Lives are generally related to legal or contractual lives, but in some cases must be estimated by management based on specific circumstances. The Company tests intangible assets for impairment whenever events or circumstances indicate that an impairment may exist.
Gift certificates and cash cards
The Company has a Tim Card® quick-pay cash card program. Generally, customers can prepay using cash, debit card or credit card for future purchases at participating Tim Hortons restaurants or over the Internet by reloading a dollar value onto their Tim Card, when and as needed. Previously, the Company issued gift certificates, which were generally sold prior to the introduction of the Tim Card. A Tim Card or gift certificate entitles the holder to use the value for purchasing product only, and the amounts generally are nonrefundable and not redeemable for cash. Tim Card and gift certificate holders are not entitled to any interest, dividends or returns on prepaid amounts. There are no expiration dates on the cash cards or gift certificates, and the Company does not charge any service fees that cause a decrease to customer balances or the value of gift certificates.
118
Table of Contents
TIM HORTONS INC. AND SUBSIDIARIES
Notes to the Consolidated Financial Statements—(Continued)
(in thousands of Canadian dollars, except share and per share data)
When a customer uses a Tim Card or a gift certificate to purchase product at a Company-operated restaurant, the Company recognizes the revenue from the sale of the product. When a customer uses a Tim Card or a gift certificate at a franchised restaurant, the Company recognizes revenues, in the form of rents and royalties, arising from the sale of the product.
While the Company will honour all valid cash cards and gift certificate presented for payment, the Company may, based on a historical review after the program has been in place for some time, determine the likelihood of redemption to be remote for certain card balances or gift-certificates (“breakage”) due to, among other factors, long periods of inactivity or based on historical redemption patterns. In these circumstances, to the extent management determines there is no requirement for remitting breakage to government agencies under unclaimed property laws, the obligation for any such breakage may be transferred to the Company’s advertising and promotion funds if related to the Tim Card program or recognized in income if related to gift certificates. The Company determines breakage based on historical redemption patterns and legal requirements governing gift card programs. Once the breakage rate is determined, it is recognized over the estimated life of a Tim Card or gift certificate. No such amounts for breakage were recognized for Tim Card.
Revenue recognition
The timing of revenue recognition for Sales (distribution and Company-operated restaurants and variable interest entities), and Franchise revenues (rents and royalties and franchise fees) does not involve significant estimates and assumptions.
Sales
The Company operates warehouses in Canada to distribute coffee and other dry goods and refrigerated and frozen products to its extensive franchise system. Revenues from distribution sales are recorded when the product is delivered to the restaurant owners or, in certain cases, when the product is delivered to a third-party distributor. Revenues from Company-operated restaurants are recognized upon tender of payment at the time of sale. Sales related to variable interest entities are recognized when product is delivered to a third-party, in the case of our previously-held Maidstone Bakeries joint-venture, or upon the tender of payment at the time of sale in the case of non-owned restaurants that are consolidated in accordance with ASC 810.
Franchise revenues
The Company’s Tim Hortons restaurants are predominantly franchised. The Company grants franchise license or operator agreements to independent operators who in turn pay franchise fees and other payments, which may include payments for equipment, royalties and, in most cases, rents for each restaurant opened. Franchise fees are collected at the time of sale, resale or renovation of the franchised restaurant. Franchise fees and equipment sales are generally recognized as income when each restaurant commences operations and payment is received from the restaurant owner, unless the restaurant owner is participating in the Company’s franchise incentive program (“FIP”) (see below). Rental revenue, excluding contingent rent, is recognized on a straight-line basis. Contingent rent is recognized in the month earned. Royalties, based on a percentage of monthly sales, are recognized as income in the month earned on the accrual basis, and are normally collected within the month or shortly thereafter.
The Company has developed a FIP available to certain of the Company’s U.S. restaurant owners, which provides financing for both the initial franchise fee and the purchase of certain restaurant equipment, furniture,
119
Table of Contents
TIM HORTONS INC. AND SUBSIDIARIES
Notes to the Consolidated Financial Statements—(Continued)
(in thousands of Canadian dollars, except share and per share data)
trade fixtures, and interior signs. The payment for those assets is deferred for a period of 104 weeks from the date of opening. The initial franchise fee is recognized at the time of opening the restaurant and the equipment revenue is recognized after a sustained period of sales levels are achieved, or at the end of the 104 week term, whichever is earlier. The restaurant owner has the option to pay for the initial franchise fee, including interest thereon, on a weekly basis over a period of up to 104 weeks from the opening of the restaurant. The initial franchise fee revenues are recognized at the time of restaurant opening, with consideration for potential uncollectibility. Should the Company determine that a franchise sold under this program is a variable interest entity (“VIE”) and the Company is the primary beneficiary, the Company does not recognize any revenue until the Company is no longer the primary beneficiary and meets the criteria noted above.
The financing is initially recorded at fair value and are subsequently measured at amortized cost. The Company establishes reserves, based on net realizable value, related to the collection of franchise royalties and other franchise-related receivables and commitments when it is not probable that amounts will be collected (see notes 5 and 6).
Effective December 15, 2010, the Company adopted Accounting Standards Update (“ASU”) No. 2010-20—Disclosures about the Credit Quality of Financing Receivables and the Allowance for Credit Losses as codified in ASC 310—Receivables. This update enhances the disclosures that an entity provides regarding the credit quality of its financing receivables, excluding short-term trade receivables, and the related allowance for credit losses. As a result of these amendments, an entity is required to disaggregate by portfolio segment or class certain existing disclosures and provide certain new disclosures about its financing receivables and related allowance for credit losses. This ASU is effective for public companies for interim and annual reporting periods ending on or after December 15, 2010 regarding disclosures as of the end of the reporting period, and for interim and annual reporting periods beginning on or after December 15, 2010, regarding disclosures about activity that occurs during a reporting period. Since this update only relates to disclosures, the adoption of ASU No. 2010-20 did not have a significant impact on the Company’s results from operations or financial position. See note 6 for additional information regarding the impact on related disclosures.
The Company generally controls, either through ownership or by leasing, a significant majority of the real estate on which the Company’s restaurants are located and leases the real estate to its restaurant owners. Rental income is recorded on the accrual basis. Most leases provide for fixed payments with contingent (or percentage) rent after sales exceed certain levels, while others provide for monthly rentals based solely on a percentage of sales. Fixed, or base, rental revenue is recorded on a straight-line basis and contingent rental revenue is recognized when sales exceed certain levels. Rental income included in rents and royalties from restaurant owners is presented in note 15.
The real estate site selection for restaurants is generally controlled by the Company. Franchise owners receive assistance in such areas as purchasing and marketing from Company personnel. These franchise expenses are included in franchise fee costs. Franchise fee revenues are comprised of revenues primarily from the sale of equipment related to establishing a restaurant owner’s business and the initial franchise fee. Restaurant owners may receive other financial assistance, or “relief,” relating to lower rents and royalties and reductions or assistance with certain other operating costs for restaurants in new and developing markets, and the amount of this relief is recorded as a reduction to the Company’s rents and royalties revenues.
120
Table of Contents
TIM HORTONS INC. AND SUBSIDIARIES
Notes to the Consolidated Financial Statements—(Continued)
(in thousands of Canadian dollars, except share and per share data)
The following progression outlines the Company’s franchised locations and system activity for each of the years 2008 through 2010:
| 2010 | 2009 | 2008 | ||||||||||
| Franchise Restaurant Progression |
||||||||||||
| Franchise restaurants in operation—beginning of year |
3,560 | 3,403 | 3,149 | |||||||||
| Franchises opened |
244 | 172 | 265 | |||||||||
| Franchises closed |
(72 | ) | (34 | ) | (36 | ) | ||||||
| Net transfers within the franchised system (primarily resales) |
(2 | ) | 19 | 25 | ||||||||
| Franchise restaurants in operation—end of year |
3,730 | 3,560 | 3,403 | |||||||||
| Company-operated restaurants |
20 | 18 | 34 | |||||||||
| Total systemwide restaurants—end of year(1) |
3,750 | 3,578 | 3,437 | |||||||||
| (1) | Includes various types of standard and non-standard restaurant formats with differing restaurant sizes and menu offerings as well as self-serve kiosks, which serve primarily coffee products and a limited selection of donuts. Collectively, the Company refers to all of these units as “systemwide restaurants.” |
Excluded from the above franchise restaurant progression table are 275 licensed locations in the Republic of Ireland and the United Kingdom as at January 2, 2011 (2009: 291 and 2008: 293).
Cost of sales related to Company-operated restaurant sales, excluding cost of sales from non-owned restaurants consolidated under ASC 810, were $22.5 million, $27.5 million, and $44.9 million for the years ended 2010, 2009 and 2008, respectively.
Variable interest entities
Effective January 4, 2010, the Company adopted FASB Statement of Accounting Standards (“SFAS”) No. 167—Amendments to FASB Interpretation No. 46(R) (“SFAS No. 167”), now codified within ASC 810. This Statement amended Interpretation 46(R) to require an enterprise to perform an analysis to determine whether the enterprise’s variable interest or interests give it a controlling financial interest in a variable interest entity. This analysis identifies the primary beneficiary of a variable interest entity as the enterprise that has both of the following characteristics: (i) the power to direct the activities of a variable interest entity that most significantly impacts the entity’s economic performance; and (ii) the obligation to absorb losses of the entity that could potentially be significant to the variable interest entity or the right to receive benefits from the entity that could potentially be significant to the variable interest entity. Additionally, an enterprise is required to assess whether it has an implicit financial responsibility to ensure that a variable interest entity operates as designed when determining whether it has the power to direct the activities of the variable interest entity that most significantly impact the entity’s economic performance. This statement changed the focus of the assessment to a more qualitative approach, rather than a quantitative approach previously required for determining the primary beneficiary of a variable interest entity; amended certain guidance for determining whether an entity is a variable interest entity; added an additional requirement to assess whether an entity is a variable interest entity on an ongoing basis; and required enhanced disclosures that provides users of financial statements with more transparent information about an enterprise’s involvement in a variable interest entity. The Company has retroactively applied this standard to comparative periods. See note 20 for additional information regarding the impact of the adoption of this standard.
121
Table of Contents
TIM HORTONS INC. AND SUBSIDIARIES
Notes to the Consolidated Financial Statements—(Continued)
(in thousands of Canadian dollars, except share and per share data)
In accordance with ASC 810, the Company analyzes its variable interests, including its equity investments and certain license or operator arrangements with various entities. The Company determines its interests in VIEs, and then assesses whether the Company is considered to be the primary beneficiary of these VIEs. If the Company determines it is the primary beneficiary, the Company consolidates the VIE’s assets, liabilities, results of operations and cash flows (see note 20). If the Company is not the primary beneficiary, the Company accounts for such interests using other applicable U.S. GAAP.
The Company enters into lease arrangements with certain operators who are not required to invest a significant amount of capital. In addition, U.S. restaurant owners participating in the FIP (“FIP Franchisee”) do not have a significant amount of initial capital invested that is not financed directly by the Company. Because the legal entity within which such an operator or FIP Franchisee operates is considered not to be adequately capitalized, that entity is considered a VIE as defined in the Master Glossary of the FASB Codification and according to the provisions in ASC 810. Based on management’s review of the financial statements it receives from these operators and FIP Franchisees, the projections performed by the Company indicate that the Company, in some instances, is the primary beneficiary of expected returns or losses as that term is defined by ASC 810, of these VIEs. Accordingly, the Company has consolidated 274, 277 and 273 restaurants during fiscal 2010, 2009 and 2008, respectively, or approximately 7.3%, 7.7% and 7.9% of the Company’s total systemwide restaurants, during these periods, respectively.
VIEs for which the Company is determined to be the primary beneficiary have an inconsequential impact on consolidated net income and cash flows reported by the Company. The impact of consolidating these VIEs to the Company’s Consolidated Balance Sheet is also not significant. There are a small percentage of restaurants considered to be VIEs for which the Company holds a significant variable interest, but for which the Company is not the primary beneficiary. The Company’s maximum exposure to loss as a result of its involvement with this small percentage of franchise restaurants is also inconsequential.
The Company has no equity interest in any of its restaurant owners. Other than certain lease and debt repayment guarantees provided for specific restaurant owners, none of the Company’s assets serve as collateral for the consolidated restaurants, and creditors of these operators have no recourse to the Company. The guarantees provided as at January 2, 2011 and January 3, 2010 were not significant. The only significant exposure to the Company in connection with these VIEs relates to the collection of amounts due to the Company, which are collected weekly. Generally, the agreements governing the license arrangements can be cancelled by either the restaurant owner or the Company with 30 days notice, further reducing potential exposure to the Company.
In connection with restricted stock unit awards granted to Company employees, the Company established a Trust that purchases and retains common shares of the Company to satisfy the Company’s contractual obligation to deliver shares to settle the awards for most Canadian employees. For accounting purposes, the cost of the shares held by the Trust has been accounted for as a reduction in outstanding common shares, and the Trust has been consolidated in accordance with ASC 810 as a VIE since the Company is the primary beneficiary.
Advertising costs
Advertising costs are expensed as incurred with the exception of media development costs, which are expensed in the month that the advertisement is first communicated (see note 20).
122
Table of Contents
TIM HORTONS INC. AND SUBSIDIARIES
Notes to the Consolidated Financial Statements—(Continued)
(in thousands of Canadian dollars, except share and per share data)
Foreign currency translation and accumulated other comprehensive (loss)
The functional currency of the Company’s U.S. operating subsidiaries is the U.S. dollar and for its Irish subsidiary, it is the Euro. For such entities, the assets and liabilities are translated at the year-end Canadian dollar exchange rates, and the revenues and expenses are translated at average Canadian dollar exchange rates for the period. Translation adjustments resulting from rate differences between the average rate and year-end rate are recorded as a component of Equity and in Other comprehensive income (loss).
Assets and liabilities denominated in a currency other than the functional currency of the legal entity are translated at the period-end exchange rate, and any currency adjustment is recorded in Other (income), net in the Consolidated Statement of Operations.
Components of accumulated other comprehensive loss as at January 2, 2011 and January 3, 2010 included:
| 2010 | 2009 | |||||||
| (in thousands) | ||||||||
| Translation adjustments (losses), net of tax |
$ | (137,804 | ) | $ | (115,731 | ) | ||
| Cash flow hedges, net of tax |
(5,785 | ) | (4,330 | ) | ||||
| $ | (143,589 | ) | $ | (120,061 | ) | |||
Total translation adjustments, net of tax included in other comprehensive income (loss) for the year ended January 2, 2011 and January 3, 2010 were translation losses of $22.1 million and $62.3 million, respectively, and a translation gain of $83.3 million for the year ended December 28, 2008. Included in Other (income), net, was a foreign exchange loss of $0.1 million in 2010 and foreign exchange gains of $0.3 million and $0.7 million in 2009 and 2008, respectively.
Derivative instruments
ASC 815—Derivatives and Hedging (“ASC 815”), requires companies to recognize all derivatives as either assets or liabilities at fair value on the Consolidated Balance Sheet. ASC 815 also permits companies to designate all derivatives that qualify as hedging instruments as fair value hedges, cash flow hedges, or hedges of net investments in foreign operations. This designation is based on the exposure being hedged.
The Company has a policy forbidding speculative trading in derivatives. The Company may enter into derivatives that are not designated as hedging instruments for accounting purposes, but which largely offset the economic impact of certain foreign currency transactions.
The Company limits its counterparty risk associated with its derivative instruments by utilizing a number of different financial institutions. The Company continually monitors its positions, and the credit ratings of its counterparties, and adjusts positions if appropriate. The Company did not have any significant exposure to any individual counterparty at January 2, 2011 or January 3, 2010.
Cash flow hedges: The Company’s exposure to foreign exchange risk is mainly related to fluctuations between the Canadian dollar and the U.S. dollar. The Company is also exposed to changes in interest rates primarily for its investments. The Company seeks to manage its cash flow and income exposures arising from these fluctuations and may use derivative products to reduce the risk of a significant impact on its cash flows or income. The Company does not hedge foreign currency and interest rate exposure in a manner that would
123
Table of Contents
TIM HORTONS INC. AND SUBSIDIARIES
Notes to the Consolidated Financial Statements—(Continued)
(in thousands of Canadian dollars, except share and per share data)
entirely eliminate the effect of changes in foreign currency exchange rates, or interest rates on net income and cash flows. The fair values of derivatives used by the Company are based on quoted market prices for comparable products and have therefore been classified as observable Level 2 inputs as defined by ASC 820—Fair Value Measurements (“ASC 820”) (see note 14). There were no outstanding interest rate related cash flow hedges as at January 2, 2011.
The Company enters into cash flow hedges to reduce the exposure to variability in certain expected future cash flows. The types of cash flow hedges the Company may or has entered into include, but are not limited to: (i) interest rate swaps that effectively converted a portion of its floating rate debt to fixed rate debt and were designed to reduce the impact of interest rate changes on future interest expense prior to being repaid in 2010; (ii) forward foreign exchange contracts that are entered into to fix the price of U.S.-dollar-denominated future purchases; and (iii) interest rate forward contracts that were entered into to fix the future interest payments on the initial issuance of $200 million of the 4.2% Senior Unsecured Notes, Series 1, due June 1, 2017 in 2010.
For cash flow hedges, the effective portion of the gains or losses on derivatives is reported in the cash flow hedges component of Accumulated other comprehensive loss in Total equity of Tim Hortons Inc. and reclassified into earnings in the same period or periods in which the hedged transaction affects earnings. The ineffective portion of gains or losses on derivatives is reported in the Consolidated Statement of Operations. The Company discontinues hedge accounting: (i) when it determines that the cash flow derivative is no longer effective in offsetting changes in the cash flows of a hedged item; (ii) when the derivative expires or is sold, terminated or exercised; (iii) when it is probable that the forecasted transaction will not occur; or (iv) when management determines that designation of the derivative as a hedge instrument is no longer appropriate.
Fair value hedges: The Company may, from time to time, enter into fair value hedges to reduce the exposure to changes in the fair values of certain assets or liabilities. For fair value hedges, the gains or losses on derivatives, as well as the offsetting gains or losses attributable to the risk being hedged, are recognized in current earnings in the Consolidated Statement of Operations in Other (income), net. The fair values of derivatives used by the Company are based on quoted market prices for comparable products and have, therefore, been classified as observable Level 2 inputs as defined by ASC 820. There were no outstanding fair value hedges as at January 2, 2011 and January 3, 2010.
Other derivatives: The Company has a number of total return swaps (“TRS”) outstanding that are intended to reduce the variability of cash flows and, to a lesser extent, earnings associated with stock-based compensation awards that will settle in cash, namely, the tandem stock appreciation rights (“SARs”) that are associated with stock options (see note 18). The TRSs do not qualify as accounting hedges under ASC 815, and, as such, they are being adjusted to fair value in accordance with ASC 815 at the end of each reporting period. The impact of the revaluation is reported in the Consolidated Statement of Operations. The fair value of these derivatives was determined using Level 2 inputs, as defined by ASC 820 (note 14). Changes in the fair value of these derivatives are included in General and administrative expenses as an offset to fair value adjustments of the liability related to tandem SARs. Each TRS has a seven-year term, but each contract allows for partial settlements, at the option of the Company, over the term, without penalty.
Effective January 4, 2010, the Company adopted certain provisions within ASU No. 2010-06—Fair Value Measurements: Improving Disclosures about Fair Value Measurements, as codified in ASC 820. This ASU provides amendments to ASC 820 that require more enhanced disclosures about (i) the different classes of assets and liabilities measured at fair value, (ii) the valuation techniques and inputs used, (iii) the activity in Level 3 fair value measurements, and (iv) the transfers between Levels 1, 2 and 3 fair value measurements. This ASU was
124
Table of Contents
TIM HORTONS INC. AND SUBSIDIARIES
Notes to the Consolidated Financial Statements—(Continued)
(in thousands of Canadian dollars, except share and per share data)
effective for interim or annual reporting periods beginning after December 15, 2009, except for certain disclosures applicable to Level 3 fair value measurements which are effective for fiscal years beginning after December 15, 2010, and for interim periods within those years. The Company adopted all elements of this ASU which did not have a significant impact on the Company’s financial statements or related disclosures (see note 14).
Effective June 15, 2010, the Company adopted ASU No. 2010-11—Scope Exception Related to Embedded Credit Derivatives, as codified in ASC 815 . This ASU clarifies the type of embedded credit derivative that is exempt from embedded derivative bifurcation requirements. Only one form of embedded credit derivative qualifies for the exemption—one that is related only to the subordination of one financial instrument to another. As a result, entities that have contracts containing an embedded credit derivative feature in a form other than such subordination may need to separately account for the embedded credit derivative feature. This ASU was effective for interim periods beginning after June 15, 2010. The adoption of this update did not have a significant impact on the Company’s financial statements or related disclosures (see note 14).
Income taxes
As prescribed in ASC 740—Income Taxes (“ASC 740”), the Company uses the asset and liability method whereby income taxes reflect the expected future tax consequences of temporary differences between the carrying amounts of assets or liabilities for accounting purposes as compared to tax purposes. A deferred income tax asset or liability is determined for each temporary difference based on the currently enacted tax rates that are expected to be in effect when the underlying items of income and expense are expected to be realized, except for a portion of earnings related to foreign operations where repatriation is not contemplated in the foreseeable future. Income taxes reported in the Consolidated Statement of Operations include the current and deferred portions of the expense. Income taxes applicable to items charged or credited to equity are netted with such items. Changes in deferred income taxes related to a change in tax rates are recognized in the period when the tax rate change is enacted. In addition, the Consolidated Statement of Operations contain items that are non-taxable or non-deductible for income tax purposes and, accordingly, cause the income tax provision to be different from what it would be if based on statutory rates.
When considered necessary, the Company records a valuation allowance to reduce deferred tax assets to the balance that is more likely than not to be realized. The Company must make estimates and judgments on future taxable income, considering feasible tax planning strategies and taking into account existing facts and circumstances, to determine the proper valuation allowance. When the Company determines that deferred tax assets could be realized in greater or lesser amounts than recorded, the asset balance and income statement reflect the change in the period such determination is made. Due to changes in facts and circumstances and the estimates and judgments that are involved in determining the proper valuation allowance, differences between actual future events and prior estimates and judgments could result in adjustments to this valuation allowance.
Under the accounting standards for Uncertain Tax Positions contained in ASC 740, a tax benefit from an uncertain tax position may be recognized in the financial statements only if it is more likely than not that the position will be sustained on examination by taxing authorities, based on the technical merits of the position. The tax benefits recognized in the financial statements from such a position are measured based on the largest benefit that has a greater than 50% likelihood of being realized upon ultimate settlement. The standards require that changes in judgment that result in subsequent recognition, derecognition or a change in measurement of a tax position taken in a prior period (including any related interest and penalties) be recognized as a discrete item in the interim period in which the change occurs. The Company records interest and potential penalties related to
125
Table of Contents
TIM HORTONS INC. AND SUBSIDIARIES
Notes to the Consolidated Financial Statements—(Continued)
(in thousands of Canadian dollars, except share and per share data)
unrecognized tax benefits in income tax expense. The standards require that a liability associated with an unrecognized tax benefit be classified as long-term liability except for the liabilities that are expected to be settled within the next twelve months.
Stock-based compensation
The Company’s 2006 Stock Incentive Plan, as amended, (the “2006 Plan”) is an omnibus plan, designed to allow for a broad range of equity-based compensation awards in the form of restricted stock units (“RSU”), stock options, stock appreciation rights (“SARs”, dividend equivalent rights (“DERs”), performance awards and share awards. The Company currently provides compensation to certain employees under the 2006 Plan in the form of restricted stock units and stock options with tandem SARs. In addition, the Company has issued deferred stock units (“DSUs”) to its directors under the Company’s Non-Employee Director Deferred Stock Unit Plan. The Company previously issued restricted stock units to directors, but these were fully vested and settled in November 2008. The Company accounts for stock-based compensation in accordance with the fair value recognition provisions of ASC 718—Compensation—Stock Compensation (“ASC 718”). For additional details, see note 18.
Restricted stock units—RSUs are measured at the fair market value based on the closing price of the Company’s common shares traded on the Toronto Stock Exchange on the first business day preceding the grant date. RSUs are expensed on a straight-line basis over the vesting period except for grants to retirement-eligible employees, which, unless the grant of the RSU is subject to a performance condition, are expensed immediately. These expenses are recorded in General and administrative expenses, consistent with the classification of the related employee compensation expense. RSUs have accompanying DERs. In addition, the Company grants performance-conditioned RSUs to certain of its employees. The performance component is based on prior-year performance and is only used to determine the amount of units granted. All other characteristics of the performance-based RSU are the same as and RSU. RSUs are settled with common shares held by the TDL RSU Employee Benefit Plan Trust or by open market purchase of common shares.
Deferred stock units—DSUs are granted to non-employee members of the Company’s Board of Directors and are expensed on the date of grant since they vest immediately, although they are not payable until a director’s separation from service. DSUs are notional units which track the value of the Company’s common shares. These units are settled in cash based on the value of the Company’s common shares on the Toronto Stock Exchange on the date of the director’s separation of service from the Company. Since the awards are settled in cash, the award is accounted for using the liability method, which results in a revaluation of the liability to fair value each period and expensed. DSUs have accompanying DERs, which are expensed as earned.
Stock options—The Company uses the Black-Scholes-Merton option pricing model to value outstanding options which requires the use of subjective assumptions. These assumptions include the estimated length of time employees will retain their stock options before exercising them (“the expected term”), the expected volatility of the Company’s common share price over the expected term, and the number of options that will ultimately not complete their vesting requirements (“forfeitures”). The awards are accounted for using the liability method, which results in a revaluation of the liability to fair value each period, and are expensed over the vesting period. Stock options with tandem SARs (see below) granted to retirement-eligible employees are expensed immediately. Changes in subjective assumptions, as well as changes in the share price from period to period, can materially affect the estimate of fair value of stock-based compensation and, consequently, the related amount of compensation expense recognized on the Consolidated Statement of Operations. The Company issued stock option awards with tandem SARs for the first time to its named executive officers in fiscal 2008 and to all officers of the Company in fiscal 2009.
126
Table of Contents
TIM HORTONS INC. AND SUBSIDIARIES
Notes to the Consolidated Financial Statements—(Continued)
(in thousands of Canadian dollars, except share and per share data)
Stock appreciation rights—SARs may be granted alone or in conjunction with a stock option. A SAR related to an option terminates upon the expiration, forfeiture, or exercise of the related option, and is exercisable only to the extent that the related option is exercisable. Stock options with tandem SARs enable the employee to exercise the stock option to receive common shares or to exercise the SAR and receive a cash payment in each case of a value equal to the difference between the market price of the share on the exercise date and the exercise price of the stock option.
NOTE 2 EARNINGS PER COMMON SHARE ATTRIBUTABLE TO TIM HORTONS INC.
Basic earnings per common share attributable to Tim Hortons Inc. are computed by dividing net income attributable to Tim Hortons Inc. by the weighted average number of common shares outstanding. Diluted computations are based on the treasury stock method and include assumed issuances of outstanding RSUs and stock options with tandem SARs, as prescribed in ASC 260—Earnings per share, as the sum of: (i) the amount, if any, the employee must pay upon exercise; (ii) the amount of compensation cost attributed to future services and not yet recognized; and (iii) the amount of tax benefits (both current and deferred), if any, that would be credited to contributed surplus assuming exercise of the options, net of shares assumed to be repurchased from the assumed proceeds, when dilutive.
The computations of basic and diluted earnings per common share attributable to Tim Hortons Inc. are shown below:
| Year ended | ||||||||||||
| January 2, 2011 |
January 3, 2010 |
December 28, 2008 |
||||||||||
| (in thousands, except per share data) | ||||||||||||
| Net income attributable to Tim Hortons Inc. for computation of basic and diluted earnings per common share attributable to Tim Hortons Inc. |
$ | 623,959 | $ | 296,367 | $ | 284,678 | ||||||
| Weighted average shares outstanding for computation of basic earnings per common share attributable to Tim Hortons Inc. (in thousands) |
174,035 | 180,477 | 183,298 | |||||||||
| Dilutive impact of restricted stock units (in thousands) |
162 | 132 | 194 | |||||||||
| Dilutive impact of stock options with tandem SARs (in thousands) |
18 | 0 | 0 | |||||||||
| Weighted average shares outstanding for computation of diluted earnings per common share attributable to Tim Hortons Inc. (in thousands) |
174,215 | 180,609 | 183,492 | |||||||||
| Basic earnings per common share attributable to Tim Hortons Inc. |
$ | 3.59 | $ | 1.64 | $ | 1.55 | ||||||
| Diluted earnings per common share attributable to Tim Hortons Inc. |
$ | 3.58 | $ | 1.64 | $ | 1.55 | ||||||
127
Table of Contents
TIM HORTONS INC. AND SUBSIDIARIES
Notes to the Consolidated Financial Statements—(Continued)
(in thousands of Canadian dollars, except share and per share data)
NOTE 3 ASSET IMPAIRMENT AND RELATED CLOSURE COSTS
Fiscal 2010
An impairment review was initiated during the third quarter of 2010 regarding the Company’s Portland, Providence and Hartford markets in the New England region as the same-store sales growth and financial performance of these markets had continued to underperform based on the Company’s expectations. At the completion of this review, the Company determined that the undiscounted future expected cash flows of these markets were insufficient to recover the carrying value of the long-lived assets in these markets, resulting in an asset impairment charge of $18.4 million being recorded in 2010. Additionally, after completing a comprehensive review and analysis of the performance of its U.S. operating segment, the Company closed 34 restaurants and 18 self-serve kiosks in its Hartford and Providence markets in the fourth quarter of 2010 and two restaurants in its Portland market, resulting in closure costs of $9.9 million being recorded in the fourth quarter of 2010. Some of these restaurants previously consolidated and, as a result of these closures, have been deconsolidated. The following table outlines the charges associated with the impairment and restaurant closures:
| Year ended January 2, 2011 | ||||||||||||
| Asset Impairment |
Restaurant closure costs |
Total | ||||||||||
| (in thousands) | ||||||||||||
| Impairment of assets |
$ | 17,770 | $ | 0 | $ | 17,770 | ||||||
| Lease commitments |
0 | 6,228 | 6,228 | |||||||||
| Other |
582 | 3,718 | 4,300 | |||||||||
| Total asset impairment and related closure costs |
$ | 18,352 | $ | 9,946 | $ | 28,298 | ||||||
Fiscal 2008
During the fourth quarter of 2008, the Company initiated a strategic review of its approach to the U.S. market. Upon completion of this review, it was determined that 11 underperforming restaurants in two southern New England markets would be closed. An impairment review was also performed for the remaining assets operating in the two affected southern New England markets. At the conclusion of this review, the Company determined that the undiscounted future expected cash flows in these markets were insufficient to recover the carrying value of these assets, resulting in an impairment charge being recorded. Some of these restaurants previously consolidated and, as a result of these closures, have been deconsolidated. The following table outlines the charges associated with the impairment and restaurant closures:
| Year ended December 28, 2008 | ||||||||||||
| Asset Impairment |
Restaurant closure costs |
Total | ||||||||||
| (in thousands) | ||||||||||||
| Impairment of assets |
$ | 16,559 | $ | 0 | $ | 16,559 | ||||||
| Lease commitments |
0 | 4,501 | 4,501 | |||||||||
| Other |
0 | 206 | 206 | |||||||||
| Total asset impairment and related closure costs |
$ | 16,559 | $ | 4,707 | $ | 21,266 | ||||||
Impairment: The fair values of these asset groups, in both 2010 and 2008, were determined in order to calculate the amount of impairment for the asset group. The most significant asset in these asset groups is property and buildings for which the fair value of the underlying real estate was primarily based on third-party
128
Table of Contents
TIM HORTONS INC. AND SUBSIDIARIES
Notes to the Consolidated Financial Statements—(Continued)
(in thousands of Canadian dollars, except share and per share data)
appraisals of the assets (see note 14). The shortfall of fair value compared to carrying value for each asset group was then allocated to the assets within the respective asset group.
Restaurant closure costs: The estimated liability relating to ongoing lease commitments takes into account sublease assumptions and is discounted. Other costs associated with restaurant closures are primarily severance and related franchise termination costs.
The impairment loss and related restaurant closure costs are included in Asset impairment and related closure costs on the Consolidated Statement of Operations and Consolidated Statement of Cash Flows. They have also been reflected in the U.S. operating segment (see note 21).
The estimated obligations associated with these restaurant closures as at January 2, 2011 are as follows and are included in Accrued liabilities, Other on the Consolidated Balance Sheet:
| 2010 closures | 2008 closures | Total | ||||||||||
| (in thousands) | ||||||||||||
| Obligation outstanding at January 3, 2010 |
$ | 0 | $ | 3,247 | $ | 3,247 | ||||||
| Accruals and other adjustments |
11,282 | (476 | ) | 10,806 | ||||||||
| Payments |
(2,124 | ) | (613 | ) | (2,737 | ) | ||||||
| Obligation outstanding at January 2, 2011 |
$ | 9,158 | $ | 2,158 | $ | 11,316 | ||||||
NOTE 4 SALE OF INTEREST IN MAIDSTONE BAKERIES
In April 2010, the Company received notice from IAWS Group Ltd., a subsidiary of Aryzta AG (“Aryzta”), the Company’s then 50-50 partner under the Maidstone Bakeries joint-venture (“Maidstone Bakeries”), invoking the buy/sell provisions of the joint venture agreements. The Company decided to sell its 50% interest in Maidstone Bakeries for gross cash proceeds of $475 million. The Company’s investment in Maidstone Bakeries at the time of sale was $72.7 million (comprised of the net assets and liabilities, less the applicable noncontrolling interest), resulting in a gain on sale of $402.3 million before taking certain related obligations and taxes into account. The all-cash transaction closed on October 29, 2010.
In connection with the sale of the Company’s interest in Maidstone Bakeries, the Company deferred $41.2 million of the gain on sale as a fair value liability estimate associated with the ongoing supply agreement. The supply agreement covers the Company’s obligation to purchase donuts and Timbits from Maidstone Bakeries and extends to early 2016 and, at the Company’s option, rights can be extended to late 2017. The supply contract deferred liability is being amortized over the remaining term of the obligation to purchase (until early 2016). Approximately $1.3 million was amortized and recognized as a reduction in cost of sales on the Consolidated Statement of Operations in fiscal 2010. Approximately $8.3 million will be amortized in 2011 and 2012, $7.9 million in 2013, $7.6 million in 2014, $7.2 million in 2015 and $0.6 million in 2016. The fair value of the supply agreement was estimated by using an income approach and a discounted cash flow model based on a combination of different earnings scenarios with an 8.6% discount rate. Approximately $8.3 million is recorded as a current liability in Accrued liabilities, Other and the remaining $31.6 million is recorded as a long-term liability in Other long-term liabilities on the Consolidated Balance Sheet (note 12).
129
Table of Contents
TIM HORTONS INC. AND SUBSIDIARIES
Notes to the Consolidated Financial Statements—(Continued)
(in thousands of Canadian dollars, except share and per share data)
The following table summarizes the gain on sale of the Company’s interest in Maidstone Bakeries at the time of sale:
| (in thousands) | ||||
| Gain on sale |
$ | 402,269 | ||
| Maidstone Bakeries supply contract deferred liability |
(41,194 | ) | ||
| Net gain on sale before income taxes |
361,075 | |||
| Income tax expense |
40,621 | |||
| Net gain on sale, net of taxes |
$ | 320,454 | ||
For periods prior to the sale of the Company’s interest in Maidstone Bakeries, the Company was deemed to be the primary beneficiary and consolidated the results of Maidstone Bakeries (note 20). Post-sale, the Company is no longer deemed the primary beneficiary of Maidstone Bakeries and, accordingly, the Company has not consolidated Maidstone Bakeries subsequent to the sale of its 50% interest.
As a result of the sale of the Company’s interest in Maidstone Bakeries, the Company has allocated $30 million to restaurant owners to support the Company’s key relationship with restaurant owners, which was recorded as a reduction of Sales on the Consolidated Statement of Operations and recorded in Accrued liabilities, Other on the Consolidated Balance Sheet (note 12).
NOTE 5 ACCOUNTS RECEIVABLE, NET
Accounts receivable are net of an allowance for doubtful accounts of $1.2 million at January 2, 2011 (January 3, 2010: $1.7 million). The carrying amount of the accounts receivable outstanding approximates fair value due to the short-term nature of these balances.
NOTE 6 NOTES RECEIVABLE, NET
The Company has developed a franchise incentive program (“FIP”) for certain of the Company’s U.S. restaurant owners, which provides financing for both the initial franchise fee and the purchase of certain restaurant equipment, furniture, trades fixtures, and interior signs. The payment for those assets is deferred for a period of 104 weeks from the date of opening, and the restaurant owner has the option to pay for the initial franchise fee on a weekly basis over a period of up to 104 weeks from the opening of the restaurant as well.
Notes receivable arise primarily from the financing of such arrangements under the FIP and from past-due restaurant owner obligations. Most of these notes are generally non-interest bearing and are payable in full at the end of 104 weeks. In certain circumstances, notes have been extended beyond the 104 week period to accommodate the restaurant owner seeking to obtain third-party financing or other arrangements may be made with the restaurant owner. The need for a reserve for uncollectible amounts is reviewed quarterly and on a specific restaurant-owner basis using information available to the Company, including past-due balances, certain restaurant sales and profitability targets, and the financial strength of the restaurant owner. Uncollectible amounts for notes receivable, both principal and interest, are provided for when those amounts are identified as uncollectible and were $0.3 million and $0.1 million at January 2, 2011 and January 3, 2010, respectively. The estimated fair value of the Company’s notes receivable was approximately $16 million and $24 million as at January 2, 2011 and January 3, 2010, respectively.
130
Table of Contents
TIM HORTONS INC. AND SUBSIDIARIES
Notes to the Consolidated Financial Statements—(Continued)
(in thousands of Canadian dollars, except share and per share data)
| 2010 | 2009 | |||||||
| (in thousands) | ||||||||
| Notes receivable, net, short-term |
$ | 12,543 | $ | 20,823 | ||||
| Notes receivable, net, discounted, long-term |
3,811 | 3,475 | ||||||
| $ | 16,354 | $ | 24,298 | |||||
The following tables detail the Company’s notes receivable balances, before reserves, and credit risk profiles as of January 2, 2011 and January 3, 2010.
Disclosure by Portfolio Segment
| 2010 | 2009 | |||||||||||||||||||||||
| Gross | VIEs(2) | Total | Gross | VIEs(2) | Total | |||||||||||||||||||
| (in thousands) | ||||||||||||||||||||||||
| FIPs |
$ | 35,218 | $ | (24,469 | ) | $ | 10,749 | $ | 42,232 | $ | (28,427 | ) | $ | 13,805 | ||||||||||
|
Other(1) |
5,870 | 0 | 5,870 | 11,379 | (750 | ) | 10,629 | |||||||||||||||||
| Notes receivable |
41,088 | (24,469 | ) | 16,619 | 53,611 | (29,177 | ) | 24,434 | ||||||||||||||||
| Allowance |
(577 | ) | 312 | (265 | ) | (540 | ) | 404 | (136 | ) | ||||||||||||||
| Notes receivable, net |
$ | 40,511 | $ | (24,157 | ) | $ | 16,354 | $ | 53,071 | $ | (28,773 | ) | $ | 24,298 | ||||||||||
| (1) | Other notes receivable relate primarily to a note issued in 2009 to a vendor to finance a property sale and notes receivable on various equipment and other financing programs. In 2009, the Company also had a $6.2 million note receivable from the trust fund holding plan assets in connection with the Company’s former supplemental executive retirement program (note 23), which was repaid in full in 2010. |
| (2) | In accordance with ASC 810, certain legal entities of restaurant owners under the franchise incentive program, which do not have additional capital independently owned, are considered to be VIEs of the Company. In cases where the Company is considered to be the primary beneficiary of the VIEs, the Company is required to consolidate these VIEs. As such, various assets and liabilities are eliminated upon the consolidation of these VIEs, the most significant of which are the Notes payable to Tim Hortons Inc., which reduces the Notes receivable, net reported on the Consolidated Balance Sheet (see Note 20). |
Disclosure by Class and Aging
| 2010 | 2009 | |||||||||||||||||||||||
| Gross | VIEs(1) | Total | Gross | VIEs(1) | Total | |||||||||||||||||||
| (in thousands) | ||||||||||||||||||||||||
| Current status (FIPs and other) |
$ | 16,493 | $ | (6,832 | ) | $ | 9,661 | $ | 35,826 | $ | (17,741 | ) | $ | 18,085 | ||||||||||
| Past due status < 90 days (FIPs) |
4,432 | (3,422 | ) | 1,010 | 4,965 | (3,316 | ) | 1,649 | ||||||||||||||||
| Past due status > 90 days (FIPs) |
20,163 | (14,215 | ) | 5,948 | 12,820 | (8,120 | ) | 4,700 | ||||||||||||||||
| Notes receivable |
41,088 | (24,469 | ) | 16,619 | 53,611 | (29,177 | ) | 24,434 | ||||||||||||||||
| Allowance |
(577 | ) | 312 | (265 | ) | (540 | ) | 404 | (136 | ) | ||||||||||||||
| Notes receivable |
$ | 40,511 | $ | (24,157 | ) | $ | 16,354 | $ | 53,071 | $ | (28,773 | ) | $ | 24,298 | ||||||||||
| (1) | In accordance with ASC 810, certain legal entities of restaurant owners under the franchise incentive program, which do not have additional capital independently owned, are considered to be VIEs of the Company. In cases where the Company is considered to be the primary beneficiary of the VIEs, the |
131
Table of Contents
TIM HORTONS INC. AND SUBSIDIARIES
Notes to the Consolidated Financial Statements—(Continued)
(in thousands of Canadian dollars, except share and per share data)
| Company is required to consolidate these VIEs. As such, various assets and liabilities are eliminated upon the consolidation of these VIEs, the most significant of which are the Notes payable to Tim Hortons Inc., which reduces the Notes receivable, net reported on the Consolidated Balance Sheet (see Note 20). |
The Company has experienced a high number of past-due notes under the franchise incentive program. In some cases, the Company will choose to hold the note for longer periods of time than it has historically done to ensure the restaurant has achieved certain profitability targets. If the Company determines that a restaurant owner cannot repay the note, the Company may take back ownership of the restaurant and equipment, which effectively collateralizes the note and, therefore, minimizes the risk to the Company. The fair value of the notes receivable approximate their carrying amounts, indicating that the notes receivable are not impaired, which thereby reduces the Company’s exposure to credit risk.
NOTE 7 INCOME TAXES
The Company reorganized to become a Canadian public company on September 28, 2009. For periods prior to September 28, 2009, the parent company was a U.S. public company (see notes 1 and 18). The provision for income taxes for the fiscal years of 2010 and 2009 consisted of the following:
| Year ended | ||||||||
| January 2, 2011 |
January 3, 2010 |
|||||||
| (in thousands) | ||||||||
| Current |
||||||||
| Canadian (including Canadian taxes on foreign earnings of $43 million) |
$ | 193,571 | $ | 144,959 | ||||
| Foreign |
9,758 | 19,186 | ||||||
| 203,329 | 164,145 | |||||||
| Deferred |
||||||||
| Canadian |
(4,716 | ) | 3,771 | |||||
| Foreign |
2,327 | 18,690 | ||||||
| (2,389 | ) | 22,461 | ||||||
| $ | 200,940 | $ | 186,606 | |||||
The provision for income taxes in the fiscal year 2008 consisted of the following:
| Year ended | ||||
| December 28, 2008 |
||||
| (in thousands) | ||||
| Current |
||||
| U.S. federal |
$ | 616 | ||
| U.S. state and local |
281 | |||
| Foreign (primarily Canada) |
160,417 | |||
| 161,314 | ||||
| Deferred |
||||
| U.S. federal |
(7,986 | ) | ||
| U.S. state and local |
(392 | ) | ||
| Foreign (primarily Canada) |
(2,627 | ) | ||
| (11,005 | ) | |||
| $ | 150,309 | |||
132
Table of Contents
TIM HORTONS INC. AND SUBSIDIARIES
Notes to the Consolidated Financial Statements—(Continued)
(in thousands of Canadian dollars, except share and per share data)
The foreign income tax expense for the years ended January 2, 2011 and January 3, 2010 were U.S. and European, as compared to the year ended December 28, 2008, when the foreign income tax expense was primarily Canadian. The provision for foreign taxes includes withholding taxes. Income subject to Canadian income tax for fiscal year 2010 consisted of Canadian earnings of $465.4 million and a one-time gain from the sale of the Company’s interest in Maidstone Bakeries of $361.1 million. Income before income taxes for the fiscal years 2009 and 2008 was primarily Canadian, in the amount of $435.2 million and $422.5 million, respectively.
The tax-effected temporary differences which gave rise to deferred tax assets and liabilities at each year end consisted of the following:
| 2010 | 2009 | |||||||
| (in thousands) | ||||||||
| Deferred tax assets |
||||||||
| U.S. foreign tax credit carry-forwards |
$ | 2,683 | $ | 21,925 | ||||
| Lease transactions |
46,069 | 40,133 | ||||||
| Property and equipment basis differences |
14,599 | 9,321 | ||||||
| Intangible assets basis differences |
7,934 | 8,715 | ||||||
| Benefit plans |
1,491 | 3,026 | ||||||
| Reserves not currently deductible |
3,741 | 1,829 | ||||||
| Deferred income |
13,636 | 19,320 | ||||||
| Loss carry-forwards |
7,054 | 11,200 | ||||||
| All other |
888 | 1,539 | ||||||
| 98,095 | 117,008 | |||||||
| Valuation allowance |
(37,471 | ) | (58,639 | ) | ||||
| $ | 60,624 | $ | 58,369 | |||||
| Deferred tax liabilities |
||||||||
| Lease transactions |
$ | 28,546 | $ | 24,378 | ||||
| Property and equipment basis differences |
17,670 | 25,890 | ||||||
| Unremitted earnings – foreign operations |
2,742 | 4,638 | ||||||
| All other |
1,353 | 1,604 | ||||||
| $ | 50,311 | $ | 56,510 | |||||
| Net deferred tax assets |
$ | 10,313 | $ | 1,859 | ||||
| Reported in Consolidated Balance Sheet as: |
||||||||
| Deferred income taxes – current asset |
$ | 7,025 | $ | 3,475 | ||||
| Deferred income taxes – long-term asset |
13,730 | 8,919 | ||||||
| Deferred income taxes – current liability |
(2,205 | ) | (376 | ) | ||||
| Deferred income taxes – long-term liability |
(8,237 | ) | (10,159 | ) | ||||
| $ | 10,313 | $ | 1,859 | |||||
Net deferred tax assets increased in 2010 by $8.5 million, primarily as a result of the divestiture of the Company’s interest in Maidstone Bakeries.
A valuation allowance in the amount of $37.5 million (2009 – $58.6 million) has been established primarily on deferred tax assets in the U.S. Based on historical operating results to-date, it is more likely than not that the Company may not entirely benefit from the deferred tax assets in the U.S.
133
Table of Contents
TIM HORTONS INC. AND SUBSIDIARIES
Notes to the Consolidated Financial Statements—(Continued)
(in thousands of Canadian dollars, except share and per share data)
The Company’s Canadian non-capital loss carry-forward of $6.2 million (not tax-effected) will expire in 2030 for federal and provincial purposes. The Company’s U.S. foreign tax credits of $2.7 million will expire in 2016 through 2018, and U.S. state loss carry-forwards of $103 million (not tax-effected) will expire in 2011 through 2030.
A reconciliation of the 2010 and 2009 statutory Canadian and provincial income tax rates of 31% and 33%, respectively, and the U.S. federal income tax rate of 35% to the Company’s effective tax rate for the fiscal year 2008 is shown below:
| Year ended | ||||||||||||
| January 2, 2011 |
January 3, 2010 |
December 28, 2008 |
||||||||||
| (in thousands) | ||||||||||||
| Net income before tax |
$ | 848,058 | $ | 506,418 | $ | 458,815 | ||||||
| Statutory rate |
31.0 | % | 33.0 | % | 35.0 | % | ||||||
| Income taxes at statutory rate |
262,729 | 167,118 | 160,585 | |||||||||
| Taxation difference on foreign earnings(1) |
(4,771 | ) | (12,116 | ) | (19,921 | ) | ||||||
| Provincial, state and local tax rate differentials(2) |
(2,380 | ) | (4,483 | ) | 170 | |||||||
| Change in reserves for uncertain tax positions |
5,716 | 6,388 | 6,258 | |||||||||
| Deferred tax assets and other amounts not benefited for tax purposes(3) (4) |
9,582 | 24,718 | 6,042 | |||||||||
| Tax differential on sale of interest in Maidstone Bakeries |
(71,483 | ) | 0 | 0 | ||||||||
| Other |
1,547 | 4,981 | (2,825 | ) | ||||||||
| Income taxes at effective rate |
$ | 200,940 | $ | 186,606 | $ | 150,309 | ||||||
| Effective tax rate |
23.7 | % | 36.8 | % | 32.8 | % | ||||||
| (1) | Canadian earnings were considered foreign prior to September 28, 2009, the date of the reorganization. |
| (2) | Provincial rate differentials are only applicable commencing for the year end January 3, 2010. State and local differentials are only applicable prior to September 28, 2009. |
| (3) | 2010 and 2008 include amounts for impairment charges. |
| (4) | 2009 includes amounts related to U.S. deferred tax assets which would no longer be recognized as a result of the 2009 reorganization (note 1). |
The effective income tax rate in fiscal 2010 was 23.7% compared to 36.8% in 2009 and 32.8% in fiscal 2008. In 2010, the effective tax rate was lower than 2009, primarily due to the favourable tax treatment of the sale of interest in Maidstone Bakeries in October 2010, partially offset by the cost associated with the U.S. asset impairment charge and related restaurant closures. The 2009 effective tax rate is higher primarily as a result of the tax costs associated with the completion of the public company merger on September 28, 2009, and the subsequent reorganization of the Company and its subsidiaries.
134
Table of Contents
TIM HORTONS INC. AND SUBSIDIARIES
Notes to the Consolidated Financial Statements—(Continued)
(in thousands of Canadian dollars, except share and per share data)
The cumulative amounts of unrecognized tax benefits for ASC 740 purposes (excluding related interest) as of January 2, 2011 and January 3, 2010 were $25.9 million and $21.0 million, respectively (long-term portion of $21.2 million, and $17.5 million, respectively). A reconciliation of the beginning and ending amounts of unrecognized tax benefits (excluding related interest), is as follows:
| 2010 | 2009 | |||||||
| (in thousands) | ||||||||
| Balance at beginning of year |
$ | 21,032 | $ | 20,544 | ||||
| Additions based on tax positions related to the current year |
5,146 | 4,973 | ||||||
| Additions for tax positions of prior years |
1,553 | 3,717 | ||||||
| Reduction for tax positions of prior years |
(672 | ) | (5,845 | ) | ||||
| Settlements and Reductions as a result of a lapse of applicable statute of limitations |
(1,110 | ) | (2,357 | ) | ||||
| Balance at end of year |
$ | 25,949 | $ | 21,032 | ||||
| Reported in the Consolidated Balance Sheet as: |
||||||||
| Accrued liabilities, Taxes |
$ | 4,723 | $ | 3,582 | ||||
| Other long-term liabilities (note 12) |
$ | 21,226 | $ | 17,450 | ||||
| $ | 25,949 | $ | 21,032 | |||||
Included in the balance of unrecognized tax benefits at January 2, 2011 are $0.9 million of uncertain tax positions for which ultimate deductibility or recoverability is highly certain but for which there is uncertainty about the timing of such deductibility or recoverability ($1.0 million as of January 3, 2010). The deferral of the deductibility or recoverability of amounts to a future period would not affect the annual effective rate but would accelerate the payment of tax and related interest and penalties to an earlier period. The taxes paid or withheld would subsequently be recovered when the amounts become ultimately deductible or recoverable.
Of the $25.9 million unrecognized tax benefits at January 2, 2011, approximately $25.0 million would impact the effective tax rate over time, if recognized (2009 – $21.0 million).
The Company accrues interest and potential penalties related to unrecognized tax benefits in income tax expense. As of January 2, 2011 and January 3, 2010, the Company had accrued cumulatively approximately $7.1 million and $6.3 million, respectively, for the potential payment of interest and penalties. During fiscal 2010, the Company accrued an additional $0.8 million in tax expense related to interest and penalties (2009 – $1.4 million).
The determination of income tax expense takes into consideration amounts that may be needed to cover exposure for open tax years. A number of years may elapse before an uncertain tax position, for which the Company has unrecognized tax benefits, is audited and resolved. While it is often difficult to predict the final outcome or the timing of resolution of any particular uncertain tax position, the Company currently believes that its unrecognized tax benefits reflect the outcomes as determined in accordance with ASC 740. Unrecognized tax benefits are adjusted, as well as the related interest and penalties, in light of subsequent changes in facts and circumstances. Settlement of any particular uncertain tax position may require the use of cash. In addition, the resolution of a matter may result in an adjustment to the provision for income taxes that may impact the effective tax rate in the period of resolution. The number of tax years that remain open and subject to tax audits varies depending on the tax jurisdiction. The Canada Revenue Agency is currently conducting an examination of various Canadian subsidiaries of the Company for 2005 and subsequent taxation years. The 2004 audit was
135
Table of Contents
TIM HORTONS INC. AND SUBSIDIARIES
Notes to the Consolidated Financial Statements—(Continued)
(in thousands of Canadian dollars, except share and per share data)
completed for Canada in 2010 and resulted in no material change in taxes. The Internal Revenue Service completed in 2008 its examination of the Wendy’s consolidated tax group which included Tim Hortons Inc. up to September 29, 2006. For federal tax purposes, Canadian and the U.S. tax jurisdictions remain open to examination for taxation years commencing in 2005 and 2007, respectively. In addition, income tax returns filed with various provincial and state jurisdictions are generally open to examination for periods of three to five years subsequent to the filing of the respective return. The Company does not currently expect any material impact on earnings to result from the resolution of matters related to open taxation years, consistent with its ASC 740 analysis; however, it is possible that actual settlements may differ from amounts accrued.
It is reasonably possible that the total amount of unrecognized tax benefits will increase over the next twelve months by up to $6.0 million, plus interest and penalties, as a result of possible tax authority audit and appeal settlements primarily relating to the deductibility of interest and other business expenses, and transfer pricing adjustments. In addition, it is also reasonably possible that unrecognized tax benefits will decrease by up to $8.0 million over the next twelve months primarily related to possible audit settlements with taxation authorities related to scientific research and experimental development investment tax credits, deductibility of business expenses and transfer pricing adjustments. There could be fluctuations in the amount of unrecognized tax benefits over the next twelve months as a result of the timing of the settlement of these tax audits and appeals and, currently, the Company cannot definitively determine the timing or the amount of individual settlements. The Company has, as part of its ASC 740 analysis, made its estimates based on current facts and circumstances and cannot predict with sufficient certainty subsequent or changed facts and circumstances that may affect its estimates.
In accordance with ASC 740, deferred taxes are not provided on undistributed earnings and other temporary differences of certain subsidiaries which are considered to be indefinitely reinvested. Determination of the deferred income taxes on these undistributed earnings and other temporary differences is not practicable as the liability, if any, depends on circumstances existing if and when realization occurs. The amount of these temporary differences was approximately $600 million as at January 2, 2011. This amount may become taxable upon actual or deemed repatriation of assets from the subsidiaries or a sale or liquidation of the subsidiaries. The Company has provided for deferred taxes at January 2, 2011, where applicable, on $204 million of undistributed earnings and other temporary differences that are not indefinitely reinvested.
NOTE 8 INVENTORIES AND OTHER, NET
Inventories and other, net include the following as at January 2, 2011 and January 3, 2010:
| 2010 | 2009 | |||||||
| (in thousands) | ||||||||
| Raw materials |
$ | 29,720 | $ | 11,489 | ||||
| Work-in-process |
204 | 0 | ||||||
| Finished goods |
56,935 | 57,411 | ||||||
| 86,859 | 68,900 | |||||||
| Inventory obsolescence provision |
(1,052 | ) | (2,181 | ) | ||||
| Inventories, net |
85,807 | 66,719 | ||||||
| Prepaids and other (1) |
14,905 | 13,771 | ||||||
| Total Inventories and other, net |
$ | 100,712 | $ | 80,490 | ||||
| (1) | Includes assets held for sale of $8.7 million and $4.6 million, respectively, primarily comprised of land and buildings. |
136
Table of Contents
TIM HORTONS INC. AND SUBSIDIARIES
Notes to the Consolidated Financial Statements—(Continued)
(in thousands of Canadian dollars, except share and per share data)
NOTE 9 PROPERTY AND EQUIPMENT, NET
Property and equipment, at cost, net of impairment charges, at 2010 and 2009 fiscal year ends consisted of the following:
| 2010 | 2009 | |||||||
| (in thousands) | ||||||||
| Land |
$ | 232,899 | $ | 240,148 | ||||
| Buildings and leasehold improvements |
1,251,628 | 1,404,055 | ||||||
| Restaurant and other equipment |
150,589 | 145,916 | ||||||
| Capital leases |
160,138 | 136,477 | ||||||
| Computer hardware and software |
103,452 | 104,667 | ||||||
| Advertising fund property and equipment |
60,181 | 57,687 | ||||||
| Other |
105,747 | 101,059 | ||||||
| Construction-in-progress |
34,895 | 17,860 | ||||||
| 2,099,529 | 2,207,869 | |||||||
| Less: Accumulated depreciation and amortization |
(725,859 | ) | (713,837 | ) | ||||
| $ | 1,373,670 | $ | 1,494,032 | |||||
The Company capitalized $0.2 million of interest and other costs in property and equipment, primarily associated with the construction of new restaurants (2009 – $0.4 million).
The Company’s capitalized software costs, including certain costs associated with internally developed software, are $64.6 million and $63.9 million as at January 2, 2011 and January 3, 2010, respectively, and are included in either Computer hardware and software or Construction-in-progress above. The net book value of these assets is $32.5 million and $35.4 million as at January 2, 2011 and January 3, 2010, respectively.
Capital leases are comprised primarily of buildings. The Company added $29.2 million of additional capital leased assets in 2010 (2009: $13.8 million).
The Company has a commitment of approximately $12.7 million outstanding at January 2, 2011 related to the construction of a new distribution facility in Kingston, Ontario.
In 2010 and 2008, the Company recorded pre-tax property and equipment impairment charges of $17.8 million and $16.6 million, respectively, related to its New England markets in the U.S. operating segment (see note 3).
NOTE 10 INTANGIBLE ASSETS, NET
The table below presents the intangible assets as of January 2, 2011 and January 3, 2010:
| 2010 | 2009 | |||||||
| (in thousands) | ||||||||
| Persona |
$ | 6,455 | $ | 6,455 | ||||
| Exclusivity rights and other license rights |
4,196 | 4,000 | ||||||
| Intellectual property license |
0 | 8,707 | ||||||
| 10,651 | 19,162 | |||||||
| Accumulated amortization |
(5,381 | ) | (10,757 | ) | ||||
| Net carrying amount |
$ | 5,270 | $ | 8,405 | ||||
137
Table of Contents
TIM HORTONS INC. AND SUBSIDIARIES
Notes to the Consolidated Financial Statements—(Continued)
(in thousands of Canadian dollars, except share and per share data)
Persona represents the use of the name and likeness of Ronald V. Joyce, a former owner of the Company. The name and likeness are being amortized over a period of twelve years ending in 2013.
In the fourth quarter of 2009, the Company entered into two separate collaborative arrangements with Kahala Franchise Corp. (“Kahala”), parent company of Cold Stone Creamery, Inc. The nature and purpose of the arrangements is to expand both parties’ co-branding and other development initiatives. The Company has the exclusive development rights in Canada, and certain rights to use licenses within the U.S., to operate ice cream and frozen confections retail outlets. Under the Canadian agreement, the Company acquired the exclusive Cold Stone Creamery® development rights in Canada for $4 million. This exclusivity right is being amortized over a period of 10 years ending in 2019, corresponding with the initial term of the agreement. Other license rights are being amortized over the term of the license.
Payments and receipts regarding collaborative agreements are presented in the Company’s Consolidated Statement of Operations based on the nature and contractual terms of the arrangement, the nature of the payments, and applicable accounting guidance.
For the fiscal years ended January 2, 2011 and January 3, 2010, transactions paid by the Company to Kahala, which include license fees, advertising, royalties and various equipment and product fees, were approximately $3.8 million and $0.2 million, respectively. In addition, the Company paid approximately $15.1 million and $0.5 million to third parties to source the necessary product and equipment required to operate a Cold Store Creamery in 2010 and 2009, respectively. These payments to Kahala and third parties were included in Total costs and expenses, net on the Consolidated Statement of Operations. Transactions related to this collaborative arrangement between restaurant owners and the Company, which includes distribution sales, franchise fees, rents and royalties and advertising levies, were $21.6 million and $1.9 million in 2010 and 2009, respectively, and are included in Revenues on the Consolidated Statement of Operations.
The intellectual property license allows Maidstone Bakeries to use proprietary par-baked technology developed by a third party. The intellectual property license was being amortized over the useful life as determined by the terms of the agreement. This intellectual property license was sold, along with the other assets and liabilities of Maidstone Bakeries, in the fourth quarter of 2010 (note 4).
Total intangibles amortization expense was $1.8 million in 2010, $1.5 million in 2009, and $1.5 million in 2008. The estimated annual intangible amortization expense for 2011 through 2013 is approximately $0.9 million each year, and approximately $0.4 million each year through 2019, the reduction of which reflects the sale of Maidstone Bakeries.
138
Table of Contents
TIM HORTONS INC. AND SUBSIDIARIES
Notes to the Consolidated Financial Statements—(Continued)
(in thousands of Canadian dollars, except share and per share data)
NOTE 11 EQUITY INVESTMENTS
Combined summarized financial information for the Company’s investments accounted for using the equity method is shown below. These investments are almost exclusively in operating ventures closely integrated into the Company’s operations, such as the joint-venture investments described below. These amounts are, in aggregate, at 100% levels. The net income amounts shown below generally exclude income tax expense as the majority of these investments pertain to a partnership or joint venture, in which case ownership percentage of earnings is attributed to the partner or venturer and the associated income tax is included in income taxes on the Consolidated Statement of Operations.
| Year ended | ||||||||||||
| January 2, 2011 |
January 3, 2010 |
December 28, 2008 |
||||||||||
| (in thousands) | ||||||||||||
| Income Statement Information |
||||||||||||
| Revenues |
$ | 41,189 | $ | 41,634 | $ | 40,774 | ||||||
| Expenses attributable to revenues |
$ | (13,366 | ) | $ | (12,908 | ) | $ | (10,218 | ) | |||
| Net Income |
$ | 27,225 | $ | 27,524 | $ | 28,608 | ||||||
| 2010 | 2009 | |||||||
| (in thousands) | ||||||||
| Balance Sheet Information |
||||||||
| Current assets |
$ | 6,455 | $ | 7,197 | ||||
| Non-current assets |
$ | 94,000 | $ | 99,033 | ||||
| Current liabilities |
$ | 1,604 | $ | 2,847 | ||||
| Non-current liabilities |
$ | 9,785 | $ | 10,881 | ||||
The Company’s most significant equity investment is its 50% owned joint venture with Wendy’s International, Inc., which jointly holds real estate underlying Canadian combination restaurants (see note 23). In fiscal 2010, the Company received distributions of $14.3 million, representing the Company’s share, from its partnership with Wendy’s ($16.5 million in 2009 and $15.0 million in 2008).
NOTE 12 ACCOUNTS PAYABLE AND OTHER LIABILITIES
Included within Accounts payable are the following obligations as at January 2, 2011 and January 3, 2010:
| 2010 | 2009 | |||||||
| (in thousands) | ||||||||
| Accounts payable |
$ | 116,884 | $ | 114,973 | ||||
| Construction holdbacks and accruals |
25,560 | 20,275 | ||||||
| $ | 142,444 | $ | 135,248 | |||||
139
Table of Contents
TIM HORTONS INC. AND SUBSIDIARIES
Notes to the Consolidated Financial Statements—(Continued)
(in thousands of Canadian dollars, except share and per share data)
Included within Accrued liabilities, Other are the following current obligations as at January 2, 2011 and January 3, 2010:
| 2010 | 2009 | |||||||
| (in thousands) | ||||||||
| Gift certificate obligations to customers |
$ | 6,012 | $ | 8,348 | ||||
| Cash card obligations to customers |
100,556 | 74,292 | ||||||
| Deferred revenues—leasing |
24,904 | 1,486 | ||||||
| Amounts owing to restaurant owners (note 4) |
30,000 | 0 | ||||||
| Restaurant closure cost accrual (note 3) |
11,316 | 3,247 | ||||||
| Maidstone Bakeries supply contract deferred liability (note 4) |
8,253 | 0 | ||||||
| Other accrued liabilities |
28,622 | 24,028 | ||||||
| $ | 209,663 | $ | 111,401 | |||||
Other accrued liabilities include deferred revenues, deposits, and various equipment and other accruals. The carrying amount of Accounts payable and Accrued liabilities approximates fair value due to the short-term nature of these balances.
Included within Other long-term liabilities are the following obligations as at January 2, 2011 and January 3, 2010:
| 2010 | 2009 | |||||||
| (in thousands) | ||||||||
| Maidstone Bakeries supply contract deferred liability (note 4) |
$ | 31,616 | $ | 0 | ||||
| Accrued rent leveling liability |
26,544 | 25,504 | ||||||
| Uncertain tax position liability(1) (note 7) |
23,635 | 20,667 | ||||||
| Stock-based compensation liabilities (note 18) |
12,453 | 5,200 | ||||||
| Other accrued long-term liabilities(2) |
17,682 | 23,558 | ||||||
| $ | 111,930 | $ | 74,929 | |||||
| (1) | Includes accrued interest of $2,409 and $3,217, respectively. |
| (2) | Other accrued long-term liabilities include deferred revenues and various other accruals. |
NOTE 13 LONG-TERM DEBT
The following table outlines the Company’s long-term debt obligations as at January 2, 2011 and January 3, 2010:
| 2010 | 2009 | |||||||
| (in thousands) | ||||||||
| Senior unsecured notes, series 1 (4.20% coupon rate) |
$ | 302,241 | $ | 0 | ||||
| Term debt |
0 | 300,000 | ||||||
| Other debt |
44,921 | 37,186 | ||||||
| $ | 347,162 | $ | 337,186 | |||||
| Less: current portion (1) |
(2,436 | ) | (884 | ) | ||||
| Long-term debt |
$ | 344,726 | $ | 336,302 | ||||
| (1) | Excludes current portion due under capital leases of $7,501 and $6,937 as of January 2, 2011 and January 3, 2010, respectively. |
140
Table of Contents
TIM HORTONS INC. AND SUBSIDIARIES
Notes to the Consolidated Financial Statements—(Continued)
(in thousands of Canadian dollars, except share and per share data)
The Company had an unsecured five-year senior bank facility (“Senior Bank Facility”) with a syndicate of Canadian and U.S. financial institutions that included a revolving facility of $200 million and US$100 million (“Revolvers”) along with a $300 million (at inception) term loan (“Term Debt”), all of which were due to mature on February 28, 2011.
In the second quarter of 2010, the Company repaid $200 million of the Term Debt, prior to maturity and without penalty. In the fourth quarter of 2010, the Company repaid the remaining $100 million of the Term Debt prior to maturity and without penalty. These prepayments were made primarily with net proceeds from the issuance of $300 million of Senior Unsecured Notes, 4.2% coupon, Series 1, due June 1, 2017 (“Senior Notes”). In addition, in the fourth quarter, the Company terminated its Senior Bank Facility and entered into a new $250 million unsecured, revolving credit facility that matures on December 15, 2014 (“Revolving Bank Facility”).
The Senior Notes were offered on a private placement basis in Canada with a term of seven years, maturing June 1, 2017. In the second quarter of 2010, the Company issued $200 million of Senior Notes for net proceeds of the same. In the fourth quarter of 2010, the Company reopened the Senior Notes and issued an additional $100 million for net proceeds of $102.3 million, which included a premium of $2.3 million. The premium, along with the loss on the interest rate forwards of $4.9 million (see below) and financing fees of approximately $1.8 million, were deferred and are being amortized to interest expense over the term of the Senior Notes. The effective yield including all fees, premium and the impact of the interest rate forwards loss is 4.45%.
The Senior Notes bear a fixed interest rate of 4.20% with interest payable in semi-annual installments, in arrears, which commenced December 1, 2010. The Senior Notes rank equally and pari passu with each other and with the notes of every other series (regardless of their actual time of issue) issued under the Trust Indenture, and, with all other senior unsecured and unsubordinated indebtedness of Tim Hortons Inc. (the “Borrower”), including amounts owing under the Revolving Bank Facility, dated December 13, 2010 (see below), except as to any sinking fund which pertains exclusively to any particular indebtedness of the Borrower and statutory preferred exceptions. The Senior Notes are initially guaranteed by The TDL Group Corp. (“TDL”), the Borrower’s largest Canadian subsidiary. For so long as the Borrower’s and TDL’s third-party revenues represent at least 75% of the consolidated revenues of the Company, as tested quarterly on a rolling twelve-month basis, TDL will remain the sole subsidiary guarantor. To the extent combined third-party revenues of these two entities is less than 75% of consolidated revenues, additional guarantors must be added until 75% of consolidated revenues are reached or exceeded. In each case, the Borrower’s subsidiary with the highest gross revenue must be one of the guarantors. Alternatively, if the Borrower’s third-party revenues reach or exceed 75% of consolidated revenues, the guarantors will be released. There are also certain covenants limiting liens to secure borrowed money (subject to permitted exceptions), and limiting the Company’s ability to undertake certain acquisitions and dispositions (subject to compliance with certain requirements), but there are no financial covenants.
The Senior Notes are redeemable, at the Borrower’s option, at any time, upon not less than 30 days notice, but no more than 60 days notice, at a redemption price equal to the greater of (i) a price calculated to provide a yield to maturity (from the redemption date) equal to the yield on a non-callable Government of Canada bond with a maturity equal to, or as close as possible to, the remaining term to maturity of the Senior Notes, plus 0.30% and (ii) par, together, in each case, with accrued and unpaid interest, if any, to the date fixed for redemption. In the event of a change of control and a resulting rating downgrade to below investment grade, the Borrower will be required to make an offer to repurchase the Senior Notes at a redemption price of 101% of the principal amount, plus accrued and unpaid interest, if any, to the date of redemption.
In March 2010, the Company entered into interest rate forwards with a notional amount of $195 million as a cash flow hedge to limit the interest rate volatility in the period prior to the issuance of the Senior Notes. These
141
Table of Contents
TIM HORTONS INC. AND SUBSIDIARIES
Notes to the Consolidated Financial Statements—(Continued)
(in thousands of Canadian dollars, except share and per share data)
interest rate forwards were settled in June 2010, resulting in a loss of $4.9 million (see note 14), of which $4.4 million remains in Accumulated other comprehensive loss on the Consolidated Balance Sheet. This loss is being recognized in Interest expense over the seven-year term of the Senior Notes as noted above.
In 2006 and 2007, in connection with the Term Debt, the Company entered into interest rate swaps with a notional amount of $130 million (see note 14), which were used to fix a portion of the variable rate Term Debt at 5.04%. Upon prepayment of the Term Debt, the Company also settled these interest rate swaps, resulting in a reclassification of $1.6 million from Other comprehensive loss to Interest (expense) in 2010.
The Company has an unsecured four-year Revolving Bank Facility, with a syndicate of nine Canadian and U.S. financial institutions of which Canadian financial institutions hold approximately 57% of the total funding commitment. The Revolving Bank Facility has the same guarantee structure as the Senior Notes and may be drawn by the Borrower or TDL and as such, has a Tim Hortons Inc. guarantee that can not be released. The Revolving Bank Facility consists of $250.0 million (which includes $25.0 million overdraft availability and $25.0 million letter of credit facility). The Revolving Bank Facility is undrawn, except for approximately $9.6 million (2009: $8.6 million under the Revolvers) to support standby letters of credit and is available for general corporate purposes. The Company incurs commitment fees, whether the facility is used or unused. Under the Revolvers, the commitment fees varied according to the Company’s leverage ratio, whereas under the Revolving Bank Facility the commitment fees vary according to the Company’s credit rating on its Senior Notes and, as at January 2, 2011 and January 3, 2010, equaled 0.38% and 0.08% of the facility amount, respectively.
The Revolver Bank Facility provides variable rate funding options including bankers’ acceptances or LIBOR plus a margin. If certain market conditions caused LIBOR to be unascertainable or not reflective of the cost of funding, the administration agent under the Revolving Bank Facility can cause the borrowing to be the base rate which has a floor of one month LIBOR plus one percent. This facility does not carry a market disruption clause.
The Revolving Bank Facility contains various covenants which, among other things, requires the maintenance of two financial ratios: a consolidated maximum total debt coverage ratio and a minimum fixed charge coverage ratio. The Company was in compliance with these covenants as at January 2, 2011.
The consolidated maximum debt coverage ratio is computed as consolidated total debt divided by net income before interest expense, taxes, depreciation and amortization, and net of discrete non-cash losses and gains or extraordinary losses and gains incurred outside the ordinary course of business (the denominator). Consolidated total debt (the numerator) primarily includes (without duplication) all liabilities for borrowed money, capital lease obligations, letters of credit (whether or not related to borrowed money), the net marked-to-market under swap agreements and guarantee liabilities (excluding those scheduled in the agreement).
The minimum fixed charge coverage is computed as net income excluding net income of variable interest entities and before interest expense, taxes, depreciation and amortization, rent expense, and net of discrete non-cash losses and gains or extraordinary losses and gains incurred outside the ordinary course of business, collectively as the numerator, divided by consolidated fixed charges. Consolidated fixed charges includes interest and rent expense.
The Revolving Bank Facility contains certain covenants that will limit the Company’s ability to, among other things: incur additional indebtedness; create liens; merge with other entities; sell assets; make restricted payments; make certain investments, loans, advances, guarantees or acquisitions; change the nature of its business; enter into transactions with affiliates; or enter into certain restrictive agreements; or pay dividends or
142
Table of Contents
TIM HORTONS INC. AND SUBSIDIARIES
Notes to the Consolidated Financial Statements—(Continued)
(in thousands of Canadian dollars, except share and per share data)
make share repurchases if the Company is not in compliance with the financial covenants, or if such transactions would cause the Company to not be in compliance with the financial covenants.
Events of default under the Revolving Bank Facility include: a default in the payment of the obligations under the Revolving Bank Facility or a change in control of Tim Hortons Inc. Additionally, events of default for the Borrower, TDL or any future Guarantor include: a breach of any representation, warranty or covenant under the Revolving Bank Facility; certain events of bankruptcy, insolvency or liquidation and; any payment default or acceleration of indebtedness if the total amount of such indebtedness unpaid or accelerated exceeds $25.0 million.
The Company’s total debt at January 2, 2011 and January 3, 2010 was $347.2 million and $337.2 million, respectively, which includes $41.7 million and $36.2 million at January 2, 2011 and January 3, 2010, respectively, of debt recorded in accordance with ASC 840—Leases (“ASC 840”). Under ASC 840, the Company is considered to be the owner of certain restaurants leased by the Company from an unrelated lessor because the Company helped to construct some of the structural elements of those restaurants. Accordingly, the Company has included the restaurant construction costs for these restaurants in property and equipment and recorded the lessor’s contributions to the construction costs for these certain restaurants as other debt. The average imputed interest rate for the debt recorded in accordance with ASC 840 is approximately 15.6% (2009: 15.7%). The Company’s weighted average effective interest rate on debt at January 2, 2011 is 5.8% (January 3, 2010 – 4.4%). In addition to debt recorded in accordance with ASC 840 and the Senior Notes or Term Debt, as applicable, the Company had other debt of $3.2 million and $1.0 million as at January 2, 2011 and January 3, 2010, respectively. Based on cash flows and market interest rates, the estimated fair value of the Company’s recorded debt was approximately $381 million at both January 2, 2011 and January 3, 2010.
Future maturities for the Company’s long-term debt, at January 2, 2011 are shown below.
| Long-term debt | ||||
| (in thousands) | ||||
| 2011 |
$ | 2,436 | ||
| 2012 |
1,406 | |||
| 2013 |
1,541 | |||
| 2014 |
1,747 | |||
| 2015 |
2,299 | |||
| Later years |
335,492 | |||
| Total principal repayments |
344,921 | |||
| Premium—Senior Unsecured Notes |
2,241 | |||
| Total |
$ | 347,162 | ||
| Current Portion |
(2,436 | ) | ||
| $ | 344,726 | |||
The Advertising fund had restricted debt of $0.8 million and $7.3 million at January 2, 2011 and January 3, 2010, respectively. In 2010, the debt was primarily related to the Canadian advertising fund for the purchase of certain property and equipment. By January 2, 2011, essentially all of the debt was repaid leaving only debt relating to the leasing of automobiles outstanding. The installments through 2014 are as follows: 2011: $0.3 million; 2012: $0.2 million; 2013: $0.2 million; and 2014: $0.1 million. The estimated fair value of the
143
Table of Contents
TIM HORTONS INC. AND SUBSIDIARIES
Notes to the Consolidated Financial Statements—(Continued)
(in thousands of Canadian dollars, except share and per share data)
advertising fund’s restricted debt approximates book value. See also note 1 for a general description of the related assets and note 20 for a description of the Company’s advertising funds.
NOTE 14 DERIVATIVES AND FAIR VALUE MEASUREMENTS
Derivatives
The Company may enter into derivative instruments with maturities generally not longer than three years to hedge foreign exchange risk, interest rate risk, and the variability in cash flows related to the tandem SARs associated with stock options (see note 18).
Forward currency contracts to sell Canadian dollars and buy US$116.3 million and US$75.0 million were outstanding as of January 2, 2011 and January 3, 2010, respectively, to hedge purchases for the ordinary course of business from third parties. The contracts outstanding at January 2, 2011 mature on various dates through January 2011 and December 2011. The fair value unrealized loss on these forward contracts was $3.5 million as of January 2, 2011 (fair value unrealized loss of $1.4 million as of January 3, 2010).
In 2010, 2009 and 2008, the Company entered into separate total return swaps (“TRSs”) to help manage the variability in cash flows and, to a lesser extent, earnings associated with stock-based compensation awards that will settle in cash, namely, the tandem SARs that are associated with stock options (see note 18). A TRS is a contract that involves the exchange of payments between the Company and a financial institution. The payments under the TRS are: (i) those based on changes in the value of reference assets, which, in this case, are the Company’s common shares; (ii) dividends on the Company’s common shares subject to the TRS, and, (iii) a variable interest rate specified in the contract. The number of the Company’s underlying common shares covered under these contracts is 467,900. The TRSs do not qualify as accounting hedges under ASC 815; and, as such, they are adjusted to fair value each reporting period in accordance with ASC 815. Gains and losses on the fair value adjustment of the TRSs are included in General and administrative expenses. The revaluation resulted in a gain of $3.7 million and $0.5 million in 2010 and 2009, respectively, and a gain of less than $0.1 million in 2008. Each TRS has a seven-year term, but each contract allows for partial settlements over the term, without penalty.
The Company entered into interest rate forwards in early 2010 with a notional amount of $195 million as a cash flow hedge to limit the interest rate volatility in the period prior to the initial issuance of $200 million of the Senior Notes. These interest rate forwards were settled in June 2010, resulting in a loss of $4.9 million. This loss is recorded in Accumulated other comprehensive loss and is being reclassified into Interest expense over the seven-year term of the Senior Notes.
In connection with the Term Debt, the Company entered into interest rate swaps in the amount of $30.0 million and $100.0 million with multiple financial institutions in June 2007 and March 2006, respectively, to help manage its exposure to interest rate volatility. By entering into the interest rate swaps, the Company agreed to receive interest at a variable rate and pay interest at a fixed rate. The interest rate swaps essentially fixed a portion of the interest rate variability on the previously outstanding Term Debt. In connection with the repayment of the Term Debt, these interest rate swaps were settled in 2010 resulting in the reclassification of $1.6 million from Other comprehensive loss to Interest (expense).
144
Table of Contents
TIM HORTONS INC. AND SUBSIDIARIES
Notes to the Consolidated Financial Statements—(Continued)
(in thousands of Canadian dollars, except share and per share data)
Fair Value Measurements
ASC 820 defines fair value, establishes a framework for measuring fair value under U.S. GAAP, and enhances disclosures about fair value measurements. Fair value is defined under ASC 820 as the exchange price that would be received for an asset or paid to transfer a liability (an exit price) in the principal or most advantageous market for the asset or liability in an orderly transaction between market participants on the measurement date. Valuation techniques used to measure fair value under ASC 820 must maximize the use of observable inputs and minimize the use of unobservable inputs. The standard describes a fair value hierarchy based on three levels of inputs. The first two levels are considered observable and the last unobservable. These are used to measure fair value as follows:
| • | Level 1—Quoted prices (unadjusted) in active markets for identical assets or liabilities that the Company has the ability to access at the measurement date. |
| • | Level 2—Inputs, other than Level 1 inputs, that are observable for the assets or liabilities, either directly or indirectly. Level 2 inputs include: quoted market prices for similar assets or liabilities; quoted prices in markets that are not active; or, other inputs that are observable or can be corroborated by observable market data for substantially the full term of the assets or liabilities. |
| • | Level 3—Unobservable inputs that are supported by little or no market activity and that are significant to the fair value of the assets or liabilities. |
In accordance with ASC 815 and ASC 820, the tables below outline the Company’s outstanding derivatives and fair value measurements as at and for the years ended January 2, 2011 and January 3, 2010.
145
Table of Contents
TIM HORTONS INC. AND SUBSIDIARIES
Notes to the Consolidated Financial Statements—(Continued)
(in thousands of Canadian dollars, except share and per share data)
Financial Assets and Liabilities
The following table summarizes the classification and fair value of derivative instruments on the Consolidated Balance Sheet:
| As at January 2, 2011 | As at January 3, 2010 | |||||||||||||||||||||||||||||||||||
| (in thousands) |
Notional value |
Fair
value hierarchy |
Fair value asset (liability) |
Classification
on Consolidated Balance Sheet |
Notional value |
Fair
value hierarchy |
Fair value asset (liability) |
Classification
on Consolidated Balance Sheet |
||||||||||||||||||||||||||||
| Derivatives designated as cash flow hedging instruments(1) |
||||||||||||||||||||||||||||||||||||
| Forward currency contracts(2) |
$ | 119,302 | Level 2 | $ | (3,538 | ) | |
Accounts payable |
|
$ | 85,802 | Level 2 | $ | (1,410 | ) | |
Accounts payable |
| ||||||||||||||||||
| Interest rate swaps(3) |
0 | Level 2 | 0 | N/A | 130,000 | Level 2 | (5,290 | ) | |
Other long- term liabilities |
| |||||||||||||||||||||||||
| Total |
$ | 119,302 | $ | (3,538 | ) | $ | 215,802 | $ | (6,700 | ) | ||||||||||||||||||||||||||
| Income tax effect |
1,087 | |
Deferred income taxes (current asset) |
|
2,370 | |
Deferred income taxes (current asset) |
| ||||||||||||||||||||||||||||
| Net of income taxes |
$ | (2,451 | ) | $ | (4,330 | ) | ||||||||||||||||||||||||||||||
| Derivatives not designated as hedging instruments(1) |
||||||||||||||||||||||||||||||||||||
| TRS (4) |
$ | 14,977 | Level 2 | $ | 4,253 | |
Other long- term assets |
|
$ | 8,958 | Level 2 | $ | 516 | |
Other long- term assets |
| ||||||||||||||||||||
| N/A | Not applicable |
| (1) | In accordance with ASC 815. |
| (2) | Maturities as at January 2, 2011 extend between January 2011 and December 2011. |
| (3) | Settled in 2010. |
| (4) | Maturities of May 2015, May 2016 and May 2017, respectively. |
The Company values most of its derivatives using valuations that are calibrated to the initial trade prices. Subsequent valuations are based on observable inputs to the valuation model. The fair value of forward currency contracts and interest rate swaps are determined using prevailing exchange rates and interest rates. The fair value of each TRS is determined using the Company’s closing common share price on the last business day of the fiscal period. In addition, the Company entered into interest rate forwards during the first quarter of 2010, which were settled during the second quarter of 2010.
146
Table of Contents
TIM HORTONS INC. AND SUBSIDIARIES
Notes to the Consolidated Financial Statements—(Continued)
(in thousands of Canadian dollars, except share and per share data)
The table below summarizes the effect of derivative instruments on the Consolidated Statement of Comprehensive Income for the fiscal year ended January 2, 2011 and January 3, 2010. The table does not include amounts related to ineffectiveness and excluded amounts from effectiveness testing, as they were immaterial:
| Year ended January 2, 2011 | ||||||||||||||
| (in thousands) |
Amount of gain (loss) recognized in OCI(1) |
Amount of net (gain) loss reclassified to earnings |
Location on Consolidated Statement of Operations |
Total effect on OCI(1) |
||||||||||
| Derivatives designated as cash flow hedging instruments under ASC 815 |
||||||||||||||
| Forward currency contracts |
$ | (5,647 | ) | $ | 3,519 | Cost of sales | $ | (2,128 | ) | |||||
| Interest rate swaps |
(1,106 | ) | 6,396 | Interest (expense) | 5,290 | |||||||||
| Interest rate forwards |
(4,855 | ) | 410 | Interest (expense) | (4,445 | ) | ||||||||
| Total |
$ | (11,608 | ) | $ | 10,325 | $ | (1,283 | ) | ||||||
| Income tax effect |
3,196 | (3,368 | ) | Income taxes | (172 | ) | ||||||||
| Net of income taxes |
$ | (8,412 | ) | $ | 6,957 | $ | (1,455 | ) | ||||||
| Year ended January 3, 2010 | ||||||||||||||
| (in thousands) |
Amount of gain (loss) recognized in OCI(1) |
Amount of net (gain) loss reclassified to earnings |
Location on Consolidated Statement of Operations |
Total effect on OCI(1) |
||||||||||
| Derivatives designated as cash flow hedging instruments under ASC 815 |
||||||||||||||
| Forward currency contracts |
$ | (10,962 | ) | $ | 5,444 | Cost of sales | $ | (5,518 | ) | |||||
| Interest rate swaps |
(1,177 | ) | 4,937 | Interest (expense) | 3,760 | |||||||||
| Total |
$ | (12,139 | ) | $ | 10,381 | $ | (1,758 | ) | ||||||
| Income tax effect |
987 | (1,602 | ) | Income taxes | (615 | ) | ||||||||
| Net of income taxes |
$ | (11,152 | ) | $ | 8,779 | $ | (2,373 | ) | ||||||
| (1) | Other comprehensive income. |
Derivatives not designated as hedging instruments under ASC 815 resulted in a gain of $3.7 million and $0.5 million in 2010 and 2009, respectively. These gains were recorded as a reduction to General and administrative expense on the Consolidated Statement of Operations.
147
Table of Contents
TIM HORTONS INC. AND SUBSIDIARIES
Notes to the Consolidated Financial Statements—(Continued)
(in thousands of Canadian dollars, except share and per share data)
Non-financial Assets and Liabilities
The following table summarizes the classification and fair value of non-financial assets and liabilities that were recorded at fair value on a non-recurring basis on the Consolidated Balance Sheet:
| As at January 2, 2011 | ||||||||||
| (in thousands) |
Fair value hierarchy |
Fair value asset (liability) |
Classification on Consolidated Balance Sheet | |||||||
| Long-lived assets(1) |
Level 3 | $ | 6,302 | Inventories and other | ||||||
| Long-lived assets(1) |
Level 3 | $ | 6,796 | Property and equipment, net | ||||||
| Total |
$ | 13,098 | ||||||||
| (1) | The Company recorded an asset impairment charge of $18.4 million in 2010 relating to the long-lived assets of the Company’s Portland, Providence and Hartford markets in the New England region (see note 3). The most significant long-lived assets are property and buildings for which the fair value of the underlying real estate was estimated to be approximately $13.1 million. Management estimated the fair value of the real estate assets by using independent property valuations. These valuations were based on a market comparison approach, which utilized a combination of individual comparative property sales in the region and estimated an applicable discount on the estimated fair value for consideration of potentially selling multiple properties in one or more transactions. As a result, these valuations are considered to be Level 3 valuations on the fair value hierarchy. A 10% change in management’s fair value estimate of the assets would either increase or decrease the value of the assets by less than $2 million. |
In addition, the Company values its assets held for sale at the lower of historical cost and fair value less cost to sell (note 8). When applicable, fair value is generally based on third-party appraisals.
NOTE 15 LEASES
The Company occupies land and buildings and uses equipment under terms of numerous lease agreements expiring on various dates through 2050. Land and building leases generally have an initial term of 10 to 30 years, while land-only lease terms can extend longer. Many of these leases provide for future rent escalations and renewal options. Certain leases require contingent rent, determined as a percentage of sales. Most leases also obligate the Company to pay the cost of maintenance, insurance and property taxes.
Assets leased under capital leases and included in property and equipment, but excluding leasehold improvements, consisted of the following:
| 2010 | 2009 | |||||||
| (in thousands) | ||||||||
| Buildings |
$ | 152,286 | $ | 129,098 | ||||
| Other |
7,852 | 7,411 | ||||||
| Accumulated depreciation |
(50,777 | ) | (45,389 | ) | ||||
| Balance as of end of year |
$ | 109,361 | $ | 91,120 | ||||
148
Table of Contents
TIM HORTONS INC. AND SUBSIDIARIES
Notes to the Consolidated Financial Statements—(Continued)
(in thousands of Canadian dollars, except share and per share data)
At January 2, 2011, future minimum lease payments for all leases, and the present value of the net minimum lease payments for all capital leases, were as follows:
| Capital Leases | Operating Leases | |||||||
| (in thousands) | ||||||||
| 2011 |
$ | 15,611 | $ | 77,767 | ||||
| 2012 |
13,476 | 66,438 | ||||||
| 2013 |
14,034 | 68,226 | ||||||
| 2014 |
12,738 | 64,103 | ||||||
| 2015 |
13,147 | 63,495 | ||||||
| Later years |
89,922 | 483,331 | ||||||
| Total minimum lease payments |
$ | 158,928 | $ | 823,360 | ||||
| Amount representing interest |
(69,210 | ) | ||||||
| Present value of net minimum lease payments |
89,718 | |||||||
| Current portion |
(7,501 | ) | ||||||
| $ | 82,217 | |||||||
Of the total minimum lease obligations noted above, the Company has minimum lease receipts under non-cancelable subleases with lessees of $127 million for capital leases and $555 million for operating leases.
Rent expense consists of rentals for premises and equipment leases. Rent expense for each year is included in operating expenses and amounted to:
| Year ended | ||||||||||||
| January 2, 2011 |
January 3, 2010 |
December 28, 2008 |
||||||||||
| (in thousands) | ||||||||||||
| Minimum rents |
$ | 84,836 | $ | 80,133 | $ | 73,823 | ||||||
| Contingent rents |
71,492 | 68,026 | 65,007 | |||||||||
| $ | 156,328 | $ | 148,159 | $ | 138,830 | |||||||
In connection with the franchising of certain restaurants, the Company has leased or subleased land, buildings and equipment to the related franchise owners. Most leases provide for fixed payments with contingent rent after sales exceed certain levels, while others provide for monthly rentals based on a percentage of sales. Lease terms are generally ten years with one or more five-year renewal options. The franchise owners bear the cost of maintenance, insurance, and property taxes.
At each year end, Company assets included in property and equipment leased under operating leases, including leasehold improvements under operating and capital leases, consisted of the following:
| 2010 | 2009 | |||||||
| (in thousands) | ||||||||
| Land |
$ | 174,038 | $ | 179,188 | ||||
| Buildings and leasehold improvements |
1,138,627 | 1,066,947 | ||||||
| Restaurant equipment |
60,995 | 56,416 | ||||||
| 1,373,660 | 1,302,551 | |||||||
| Accumulated depreciation |
(480,449 | ) | (425,198 | ) | ||||
| $ | 893,211 | $ | 877,353 | |||||
149
Table of Contents
TIM HORTONS INC. AND SUBSIDIARIES
Notes to the Consolidated Financial Statements—(Continued)
(in thousands of Canadian dollars, except share and per share data)
At January 2, 2011, future minimum lease receipts were as follows:
| Operating Leases |
||||
| (in thousands) | ||||
| 2011 |
$ | 236,397 | ||
| 2012 |
206,559 | |||
| 2013 |
177,110 | |||
| 2014 |
146,843 | |||
| 2015 |
112,432 | |||
| Later years |
235,248 | |||
| Total |
$ | 1,114,589 | ||
Rental income for each year is included in rents and royalties revenues and amounted to:
| Year ended | ||||||||||||
| January 2, 2011 |
January 3, 2010 |
December 28, 2008 |
||||||||||
| (in thousands) | ||||||||||||
| Minimum rents |
$ | 268,980 | $ | 256,358 | $ | 236,347 | ||||||
| Contingent rents |
235,056 | 216,389 | 203,058 | |||||||||
| $ | 504,036 | $ | 472,747 | $ | 439,405 | |||||||
NOTE 16 COMMITMENTS AND CONTINGENCIES
The Company has guaranteed certain leases and debt payments, primarily related to restaurant owners, amounting to $1.0 million and $0.5 million at January 2, 2011 and January 3, 2010, respectively. In the event of default by a franchise owner, the Company generally retains the right to acquire possession of the related restaurants. At January 2, 2011 and January 3, 2010, the Company is also the guarantor on $10.3 million and $9.7 million, respectively, in letters of credit and surety bonds with various parties; however, management does not expect any material loss to result from these instruments because management does not believe performance will be required as the underlying event(s) that would require payment are not expected to occur and have not occurred as of January 2, 2011. The length of the lease, loan and other arrangements guaranteed by the Company or for which the Company is contingently liable varies, but generally does not exceed seven years.
The Company has entered into purchase arrangements with some of its suppliers for terms which generally do not exceed one fiscal year. The range of prices and volume of purchases under the agreements may vary according to the Company’s demand for the products and fluctuations in market rates. These agreements help the Company secure pricing and product availability. The Company does not believe these agreements expose the Company to significant risk.
In addition to the guarantees described above, the Company is party to many agreements executed in the ordinary course of business that provide for indemnification of third parties under specified circumstances, such as lessors of real property leased by the Company, distributors, service providers for various types of services (including commercial banking, investment banking, tax, actuarial and other services), software licensors, marketing and advertising firms, securities underwriters and others. Generally, these agreements obligate the Company to indemnify the third parties only if certain events occur or claims are made, as these contingent
150
Table of Contents
TIM HORTONS INC. AND SUBSIDIARIES
Notes to the Consolidated Financial Statements—(Continued)
(in thousands of Canadian dollars, except share and per share data)
events or claims are defined in each of the respective agreements. The Company believes that the resolution of any such claims that might arise in the future, either individually or in the aggregate, would not materially affect the earnings or financial condition of the Company.
On June 12, 2008, a claim was filed against the Company and certain of its affiliates in the Ontario Superior Court of Justice (the “Court”) by two of its franchisees, Fairview Donut Inc. and Brule Foods Ltd., alleging, generally, that the Company’s Always Fresh baking system and expansion of lunch offerings have led to lower franchisee profitability. The claim, which seeks class action certification on behalf of Canadian franchisees, asserts damages of approximately $1.95 billion. Those damages are claimed based on breach of contract, breach of the duty of good faith and fair dealing, negligent misrepresentations, unjust enrichment and price maintenance. The plaintiffs filed a motion for certification of the putative class in May of 2009, and the Company filed its responding materials as well as a motion for summary judgment in November of 2009. The two motions are scheduled to be heard together in August 2011. The Company continues to believe the claim is without merit and will not be successful, and the Company intends to oppose the certification motion and defend the claim vigorously. However, there can be no assurance that the outcome of the claim will be favourable to the Company or that it will not have a material adverse impact on the Company’s financial position or liquidity in the event that the ultimate determinations by the Court and/or appellate court are not in accordance with the Company’s evaluation of this claim.
In addition, the Company and its subsidiaries are parties to various legal actions and complaints arising in the ordinary course of business. Reserves related to the potential resolution of any outstanding legal proceedings are not significant and are included in Accounts payable on the Consolidated Balance Sheet. It is the opinion of the Company that the ultimate resolution of such matters will not materially affect the Company’s financial condition or earnings.
NOTE 17 COMMON SHARES
Corporate Reorganization
At a special meeting of stockholders held on September 22, 2009, THI USA’s stockholders voted to approve the reorganization of the corporate structure of THI USA and its subsidiaries such that the public company parent would be a Canadian company. Pursuant to that approval, THI Mergeco Inc., a Delaware corporation and the then wholly-owned subsidiary of the entity that would become the Canadian public company, merged with and into THI USA, effective at 12:00 a.m. Eastern Time on September 28, 2009 (the “Merger”). In connection with the Merger, the Company, a corporation incorporated under the Canada Business Corporations Act, became the publicly held parent company of the group of companies previously controlled by THI USA. In connection with the Merger, each outstanding share of THI USA’s common stock automatically converted into one common share of the Company. The issuance of common shares (and the associated share purchase rights) was registered under the Securities Act of 1933, as amended, pursuant to the registration statement of the Company on Form S-4 (No. 333-160286), which was declared effective by the U.S. Securities and Exchange Commission on August 12, 2009. The common shares of the Company are traded on both the New York Stock Exchange and the Toronto Stock Exchange under the symbol “THI.”
The Company is authorized to issue an unlimited number of common shares, of which 170,664,295 were outstanding as at January 2, 2011. In addition, the Company is authorized to issue one Class A preferred share and an unlimited number of preferred shares, issuable in series. The Company did not have any preferred shares outstanding as at January 2, 2011. The Merger was accounted for as a reorganization of entities under common control; therefore, there was no revaluation of THI USA’s consolidated assets and liabilities, and the Company
151
Table of Contents
TIM HORTONS INC. AND SUBSIDIARIES
Notes to the Consolidated Financial Statements—(Continued)
(in thousands of Canadian dollars, except share and per share data)
will continue to use the historical cost basis method of accounting. In addition, consistent with Canadian corporate law, treasury shares previously held by THI USA were cancelled and were classified within common shares in the equity section of the Company’s Consolidated Balance Sheet. In addition, the Revolving Credit Facility and stock-based compensation plans were amended to replace THI USA with the Company, and to make certain other modifications in connection with the reorganization and otherwise. These amendments did not result in any change in accounting.
Share repurchase programs
On March 1, 2010, the Company obtained regulatory approval from the Toronto Stock Exchange (“TSX”) to commence its 2010 share repurchase program (“2010 program”) for up to $200 million in common shares, not to exceed the regulatory maximum of 8,817,291 shares, equivalent to 5% of the outstanding common shares as of February 19, 2010. Purchases of common shares are made through a combination of automatic trading plan (10b5-1) purchases and at management’s discretion in compliance with regulatory requirements, given prevailing market, cost, and other considerations. Purchases under the program are made by the Company on any of the TSX, the New York Stock Exchange and/or other Canadian marketplaces, subject to applicable regulatory requirements. In November 2010, the Company received regulatory approval from the TSX to amend its 2010 share repurchase program to increase the maximum number of shares that may be purchased under the program effective November 16, 2010. Under the amended 2010 program, the Company was permitted to spend a maximum of $400 million, subject to the limitation that the Company could not repurchase more than the regulatory maximum of 17,531,446 of its shares (representing 10% of the Company’s “public float” as of February 19, 2010, as defined under TSX rules). The 2010 program commenced March 3, 2010 and is due to end on March 2, 2011, without either the $400 million maximum or the regulatory share maximum having been achieved. All shares purchased pursuant to the 2010 program are cancelled. The 2010 program may also be terminated at the Company’s discretion in compliance with applicable regulatory requirements.
In November 2008, the Company’s Board of Directors approved a 2009 share repurchase program for up to $200 million in shares of common stock. The 2009 program commenced on March 2, 2009 and was suspended between April 2009 and October 2009 until the Company completed a review of its capital allocation activities after the reorganization as a Canadian public company. The program resumed in November 2009 and ended on March 1, 2010.
Details of the shares repurchased under the Company’s publicly-announced share repurchase programs are as follows:
| Shares | Amount | Average Cost | ||||||||||
| (in thousands) | (in dollars) | |||||||||||
| 2009 Program |
||||||||||||
| Fiscal 2009(1) |
4,238 | $ | 130,102 | $ | 30.70 | |||||||
| Fiscal 2010(2) |
1,166 | 36,647 | 31.43 | |||||||||
| 5,404 | 166,749 | 30.86 | ||||||||||
| 2010 Program |
||||||||||||
| Fiscal 2010(2) |
5,489 | $ | 205,948 | $ | 37.52 | |||||||
| (1) | Prior to the reorganization of the Company, approximately $16.7 million Common shares were repurchased in fiscal 2009, which were recorded as treasury shares and subsequently cancelled upon completion of the |
152
Table of Contents
TIM HORTONS INC. AND SUBSIDIARIES
Notes to the Consolidated Financial Statements—(Continued)
(in thousands of Canadian dollars, except share and per share data)
| reorganization. After the reorganization, approximately $113.4 million of Common shares were repurchased in fiscal 2009, of which $10.4 million reduced the stated value of Common shares and the remainder was recorded as a reduction to Retained Earnings. |
| (2) | Approximately $242.6 million of Common shares were repurchased in fiscal 2010, of which $18.8 million reduced the stated value of Common shares and the remainder was recorded as a reduction to Retained earnings, |
In addition, the Company reissued approximately 7,800 treasury shares to Company employees to settle restricted stock units (see note 18) that vested in May 2009 prior to the reorganization. The Company has previously repurchased its common shares from The TDL Employee Benefit Plan Trust (“Trust”) (see note 18 and below) to facilitate the settlement of withholding obligations associated with the settlement of RSUs. The Company did not repurchase any shares from the Trust in 2010 or 2009. The Company also purchased approximately 20,000 common shares in 2010 on the open market to settle RSUs (see note 18) that vested during the year (approximately 15,800 in 2009).
Shares held in Trust
In connection with the RSU awards to Company employees (see note 18), the Company established the Trust to purchase and retain shares to satisfy the Company’s obligation to deliver shares to settle the awards for most Canadian employees. A broker engaged by the trustee of the Trust purchased shares on the open market, as set forth below. These shares will be held by the Trust until the RSUs become vested, at which time they will be disbursed to certain Canadian employees. Occasionally, the Trust may sell shares to the Company to facilitate the remittance of the associated employee withholding obligations.
The following table outlines the activities of the Trust:
| Shares | Amount | Average Cost | ||||||||||
| (in thousands) | (in dollars) | |||||||||||
| Shares held in Trust |
||||||||||||
| Fiscal 2008 |
||||||||||||
| Opening balance |
421 | $ | 14,628 | $ | 34.68 | |||||||
| Purchased |
116 | 3,842 | 33.14 | |||||||||
| Disbursed or sold |
(179 | ) | (6,183 | ) | 34.52 | |||||||
| Closing balance |
358 | $ | 12,287 | $ | 34.30 | |||||||
| Fiscal 2009 |
||||||||||||
| Opening balance |
358 | $ | 12,287 | $ | 34.30 | |||||||
| Purchased |
25 | 713 | 28.94 | |||||||||
| Disbursed |
(104 | ) | (3,563 | ) | 34.15 | |||||||
| Closing balance |
279 | $ | 9,437 | $ | 33.89 | |||||||
| Fiscal 2010 |
||||||||||||
| Opening balance |
279 | $ | 9,437 | $ | 33.89 | |||||||
| Purchased |
91 | 3,252 | 35.43 | |||||||||
| Disbursed |
(92 | ) | (3,147 | ) | 34.13 | |||||||
| Closing balance |
278 | $ | 9,542 | $ | 34.31 | |||||||
153
Table of Contents
TIM HORTONS INC. AND SUBSIDIARIES
Notes to the Consolidated Financial Statements—(Continued)
(in thousands of Canadian dollars, except share and per share data)
For accounting purposes, the cost of the purchase of common shares held by the Trust has been accounted for as a reduction in outstanding common shares, and the Trust has been consolidated in accordance with ASC 810 since the Company is the primary beneficiary (note 20).
Share purchase rights
Pursuant to our shareholder rights plan (the “Rights Plan”), one right to purchase a common share (a “Right”) has been issued in respect of each of the outstanding common shares and an additional Right will be issued in respect of each additional common share issued prior to the Separation Time (as defined below). The purpose of the Rights Plan is to provide holders of our common shares, and our Board of Directors, with the time necessary to ensure that, in the event of a take-over bid (the Canadian term for a tender offer) of the Company, alternatives to the bid which may be in the best interests of our Company are identified and fully explored.
The Rights will become exercisable and begin to trade separately from the associated common shares at the “Separation Time,” which is generally the close of business on the tenth trading day after the earliest to occur of (a) a public announcement that a person or a group of affiliated or associated persons (an “Acquiring Person”) has acquired beneficial ownership of 20% or more of the outstanding common shares other than as a result of (i) a reduction in the number of common shares outstanding, (ii) a Permitted Bid or Competing Permitted Bid (both as defined in the Rights Plan), (iii) acquisitions of common shares in respect of which the Company’s Board of Directors has waived the application of the Rights Plan, or (iv) other specified exempt acquisitions in which shareholders participate on a pro rata basis; (b) the date of commencement of, or the first public announcement of an intention of any person to commence, a take-over bid where the common shares subject to the bid, together with common shares owned by that person (including affiliates, associates and others acting jointly or in concert therewith) would constitute 20% or more of the outstanding common shares; and (c) the date upon which a Permitted Bid or Competing Permitted Bid ceases to be such.
After the Separation Time, each Right entitles the holder thereof to purchase one common share at the “Exercise Price,” which is initially $150 per share. Following a transaction which results in a person becoming an Acquiring Person (a “Flip-in Event”), the Rights will entitle the holder thereof (other than a holder who is an Acquiring Person) to receive, upon exercise, common shares with a market value equal to twice the then exercise price of the Rights. For example, if, at the time of the Flip-in Event, the Exercise Price is $150 per share and the common shares have a market price of $25 per share, the holder of each Right would be entitled to receive $300 per share in market value of the common shares (12 Common Shares) after paying $150 per share for such shares (i.e., the shares may be purchased at a 50% discount). In such event, however, any Rights directly or beneficially owned by an Acquiring Person (including affiliates, associates and others acting jointly or in concert therewith), or a transferee or any such person, will be void. A Flip-in Event does not include acquisitions pursuant to a Permitted Bid or Competing Permitted Bid.
The Rights Plan will remain in effect until September 28, 2018, subject to being reconfirmed by the Company’s shareholders every three years, commencing in 2012.
154
Table of Contents
TIM HORTONS INC. AND SUBSIDIARIES
Notes to the Consolidated Financial Statements—(Continued)
(in thousands of Canadian dollars, except share and per share data)
NOTE 18 STOCK-BASED COMPENSATION
The Company’s 2006 Stock Incentive Plan, as amended (“2006 Plan”) has been in place since the Company’s initial public offering. The 2006 Plan was assumed by the Company upon the completion of the reorganization to a Canadian public company. The 2006 Plan is an omnibus plan, designed to allow for a broad range of equity-based compensation awards in the form of stock options, restricted stock, RSUs, SARs, DERs, performance awards and share awards to eligible employees and directors of the Company or its subsidiaries. Total share-based awards of 1.7 million have been made under the 2006 Plan during fiscal years 2008, 2009 and 2010 to officers and certain employees, of which 0.6 million were granted as RSUs and 1.1 million as stock options with tandem SARs. Dividend equivalent rights have accrued on the RSUs. A total of 2,900,000 common shares were authorized under the 2006 Plan, of which 1,379,181 share-based awards are outstanding as at January 2, 2011.
Total stock-based compensation expense included in General and administrative expense on the Consolidated Statement of Operations is detailed as follows:
| Year ended | ||||||||||||
| January 2, 2011 |
January 3, 2010 |
December 28, 2008 |
||||||||||
| (in thousands) | ||||||||||||
| Restricted stock units |
$ | 6,475 | $ | 5,715 | $ | 8,278 | ||||||
| Stock options and tandem SARs |
5,838 | 1,830 | 631 | |||||||||
| Deferred stock units |
1,950 | 1,324 | 721 | |||||||||
| Total stock-based compensation expense |
$ | 14,263 | $ | 8,869 | $ | 9,630 | ||||||
The Company begins expensing performance-based RSUs at the time the performance measures are set. As a result, the Company began expensing amounts relating to the planned May 2011 grants in March 2010, on management’s determination that the achievement of the performance condition is probable.
The Company has entered into total return swaps (“TRS”) as economic hedges for a portion of its outstanding stock options with tandem SARs (see note 14). The Company recognized gains relating to the TRS of $3.7 million and $0.5 million in 2010 and 2009, respectively, and a gain of less than $0.1 million in 2008.
Details of stock-based compensation grants and settlements in fiscal 2010, 2009 and 2008 are set forth below.
155
Table of Contents
TIM HORTONS INC. AND SUBSIDIARIES
Notes to the Consolidated Financial Statements—(Continued)
(in thousands of Canadian dollars, except share and per share data)
Restricted stock units
The following is a summary of RSU activity for employees granted under the Company’s 2006 Plan for the years ended December 28, 2008, January 3, 2010 and January 2, 2011:
| Restricted
Stock Units |
Weighted Average Grant Value per Unit |
|||||||
| (in thousands) | (in dollars) | |||||||
| 2008 |
||||||||
| Granted |
233 | $ | 33.02 | |||||
| Dividend equivalent rights |
5 | 32.68 | ||||||
| Vested and settled |
(326 | ) | 30.38 | |||||
| Forfeited |
(10 | ) | 32.63 | |||||
| Balance at December 28, 2008 |
406 | $ | 33.82 | |||||
| 2009 |
||||||||
| Granted |
140 | $ | 28.87 | |||||
| Dividend equivalent rights |
5 | 30.54 | ||||||
| Vested and settled |
(234 | ) | 34.41 | |||||
| Forfeited |
(5 | ) | 32.16 | |||||
| Balance at January 3, 2010 |
312 | $ | 31.15 | |||||
| 2010 |
||||||||
| Granted |
189 | $ | 35.04 | |||||
| Dividend equivalent rights |
5 | 36.55 | ||||||
| Vested and settled |
(204 | ) | 32.48 | |||||
| Forfeited |
(9 | ) | 31.38 | |||||
| Balance at January 2, 2011 |
293 | $ | 32.83 | |||||
156
Table of Contents
TIM HORTONS INC. AND SUBSIDIARIES
Notes to the Consolidated Financial Statements—(Continued)
(in thousands of Canadian dollars, except share and per share data)
The Company’s Human Resource and Compensation Committee (the “HRCC”) approved RSU awards, which are reflected in the table above and below. RSUs were not granted in May 2009 to the named executive officers because the performance pre-condition, relating to a required threshold level of operating income, to the grant of the RSUs (prior to grant, referred to as performance-conditioned RSUs) was not satisfied. Also, commencing in 2009, the HRCC and Company management changed the equity award program for the remaining officers of the Company to match that previously approved (in December 2007) for the named executive officers. Namely, the total compensation value of the awards would change to 50% performance-conditioned RSUs (granted “at target” for these officers in 2009) and 50% options with tandem SARs. Both of these factors resulted in a lower number of RSUs being granted in 2009. The following table outlines the RSU grants, excluding the accumulation of DERs on outstanding RSUs, for fiscal 2008, 2009, and 2010:
| Restricted Stock Unit Grants |
Grant Value of Award |
|||||||
| (in thousands) | (in dollars) | |||||||
| 2008 |
||||||||
| May 2008 |
233 | $ | 33.02 | |||||
| Total Granted in 2008 |
233 | $ | 33.02 | |||||
| 2009 |
||||||||
| May 2009 |
140 | $ | 28.87 | |||||
| Total Granted in 2009 |
140 | $ | 28.87 | |||||
| 2010 |
||||||||
| March 2010 |
14 | $ | 32.78 | |||||
| May 2010 |
175 | $ | 35.23 | |||||
| Total Granted in 2010 |
189 | $ | 35.04 | |||||
The fair market value of each award prior to November 2009 was based on the mean of the high and low prices of the Company’s common shares traded on the Toronto Stock Exchange on the day of grant. Grants vest over a maximum 30-month period or shorter. In November 2009, the fair market value of each award was changed to the closing price of the Company’s common shares traded on the Toronto Stock Exchange on the first business day preceding the grant date. With respect to retirement-eligible employees, the expense associated with their grants is accelerated and expensed evenly over the period spanning the grant date and the date that the employee becomes eligible for retirement.
As a result of the reorganization of the Company to a Canadian public company on September 28 2009, the stock-based grants were converted to grants from the new Canadian public company, resulting in a plan modification. This modification did not result in any accounting changes.
In 2010, 2009 and 2008, RSUs were settled by one of the following means: (i) by way of disbursement of shares from The TDL RSU Employee Benefit Plan Trust; (ii) the reissuance of treasury shares (for periods prior to the completion of the reorganization); or (iii) by way of an open market purchase by an agent of the Company on behalf of the eligible employee. The method of settlement is primarily dependent on the jurisdiction where the employee resides, but securities requirements and other factors are also considered.
157
Table of Contents
TIM HORTONS INC. AND SUBSIDIARIES
Notes to the Consolidated Financial Statements—(Continued)
(in thousands of Canadian dollars, except share and per share data)
RSUs that vested during 2010, 2009 and 2008 were settled with the participants in the following manner:
| Restricted Stock Unit (gross settlement) |
RSU Settlement, net of tax |
|||||||||||
| Unit | Amount | |||||||||||
| (in thousands) | ||||||||||||
| 2008 |
||||||||||||
| Settled with shares from The TDL RSU Employee Benefit Plan Trust |
263 | 141 | $ | 4,889 | ||||||||
| Settled by the reissuance of treasury shares |
51 | 32 | 1,099 | |||||||||
| Settled by an open market purchase |
12 | 7 | 226 | |||||||||
| Total restricted stock settlement |
326 | 180 | $ | 6,214 | ||||||||
| 2009 |
||||||||||||
| Settled with shares from The TDL RSU Employee Benefit Plan Trust |
194 | 104 | $ | 3,563 | ||||||||
| Settled by the reissuance of treasury shares |
12 | 8 | 264 | |||||||||
| Settled by an open market purchase |
28 | 16 | 477 | |||||||||
| Total restricted stock settlement |
234 | 128 | $ | 4,304 | ||||||||
| 2010 |
||||||||||||
| Settled with shares from The TDL RSU Employee Benefit Plan Trust |
170 | 92 | $ | 3,147 | ||||||||
| Settled by an open market purchase |
34 | 20 | 753 | |||||||||
| Total restricted stock settlement |
204 | 112 | $ | 3,900 | ||||||||
RSUs are settled by the Company with the participant, after provision (on the account of the participant) for the payment of each participant’s minimum statutory withholding tax requirements.
As of January 2, 2011, total unrecognized compensation cost related to non-vested RSUs outstanding was $4.2 million (2009: $4.6 million) and is expected to be recognized over a weighted-average period of 1.4 years (2009: 1.3 years). The Company expects substantially all of the outstanding RSUs to vest. A total of 204,000 RSUs vested in 2010 (2009: 234,000) with a grant value of $6.6 million (2009: $8.1 million).
158
Table of Contents
TIM HORTONS INC. AND SUBSIDIARIES
Notes to the Consolidated Financial Statements—(Continued)
(in thousands of Canadian dollars, except share and per share data)
Deferred stock units
Non-employee members of the Company’s Board of Directors receive the equity portion of their Board retainers, and may elect to receive the remainder of their Board and Committee compensation, in the form of deferred stock units (“DSUs”). The Company previously issued RSUs to directors, but these were fully vested and settled in November 2008. The following is a summary of DSU activity granted under the Company’s 2006 Non-Employee Director Deferred Stock Unit Plan for the years ended December 28, 2008, January 3, 2010 and January 2, 2011:
| Deferred
Stock Units |
Weighted Average Grant Value per Unit |
|||||||
| (in thousands) | (in dollars) | |||||||
| 2008 |
||||||||
| Balance at December 31, 2007 |
17 | $ | 35.40 | |||||
| Granted |
22 | 33.74 | ||||||
| Dividend equivalent rights |
— | 32.69 | ||||||
| Balance at December 28, 2008 |
39 | $ | 34.45 | |||||
| 2009 |
||||||||
| Granted |
43 | $ | 31.03 | |||||
| Dividend equivalent rights |
1 | 30.57 | ||||||
| Balance at January 3, 2010 |
83 | $ | 32.64 | |||||
| 2010 |
||||||||
| Granted |
28 | $ | 36.00 | |||||
| Dividend equivalent rights |
1 | 36.98 | ||||||
| Settled |
(5 | ) | 32.51 | |||||
| Balance at January 2, 2011 |
107 | $ | 33.57 | |||||
DSUs are expensed on the date of grant since they vest immediately, although they are not payable until a director’s separation from service. DSUs are notional units which track the value of the Company’s common shares. These units are settled in cash based on the value of the Company’s common shares on the Toronto Stock Exchange on the date of the director’s separation of service from the Company. Since the awards are settled in cash, the award is accounted for using the liability method, which results in a revaluation of the liability to fair value each period and expensed immediately. DSUs have dividend equivalent rights, which are expensed as earned and included in the revaluation just described. As at January 2, 2011, the total fair value liability for DSUs was $4.4 million ($2.7 million in 2009) and is included in Other long-term liabilities on the Consolidated Balance Sheet.
Stock options and tandem stock appreciation rights
Stock options with tandem SARs enable the employee to exercise the stock option to receive common shares or to exercise the SAR and receive a cash payment, both of the foregoing equal to the difference between the market price of the share at the date and time of the exercise and the exercise price of the stock option or SAR. Exercise of either the option or SAR will result in cancellation and surrender to the Company of the equivalent amount of the other. The awards are accounted for using the liability method, which results in a revaluation of the liability to fair value each period, and are expensed over the vesting period. Stock options with tandem SARs granted to retirement-eligible employees are expensed immediately.
159
Table of Contents
TIM HORTONS INC. AND SUBSIDIARIES
Notes to the Consolidated Financial Statements—(Continued)
(in thousands of Canadian dollars, except share and per share data)
The stock option/SAR activity table below reflects the stock option/SAR awards approved by the HRCC and exercise activity associated with such awards:
| Stock Options with SARs |
Weighted Average Exercise Price |
|||||||
| (in thousands) | (in dollars) | |||||||
| Granted |
167 | $ | 33.02 | |||||
| Balance at December 28, 2008 |
167 | $ | 33.02 | |||||
| Granted—May 2009 |
534 | $ | 28.87 | |||||
| Granted—November 2009 |
26 | $ | 29.84 | |||||
| Balance at January 3, 2010 |
727 | $ | 29.86 | |||||
| Granted |
403 | $ | 35.23 | |||||
| Exercised |
(35 | ) | 28.87 | |||||
| Cancelled/forfeited |
(9 | ) | 32.24 | |||||
| Balance at January 2, 2011 |
1,086 | $ | 31.87 | |||||
The following table provides a summary of stock options/SARs outstanding:
| Stock option/SARs Expiration Date |
Stock Options with SARs |
Exercise Price |
Total Intrinsic Value |
Weighted Average Remaining Contractual Life |
||||||||||||
| (in thousands) | (in dollars) | (in thousands) | (in years) | |||||||||||||
| May 15, 2015 |
167 | $ | 33.02 | $ | 1,353 | 4.4 | ||||||||||
| May 15, 2016 |
495 | 28.87 | 6,046 | 5.4 | ||||||||||||
| May 15, 2016 |
26 | 29.84 | 292 | 5.3 | ||||||||||||
| May 15, 2017 |
398 | 35.23 | 2,338 | 6.4 | ||||||||||||
| Total stock options/SARs outstanding at January 2, 2011 |
1,086 | $ | 31.87 | $ | 10,029 | 5.6 | ||||||||||
| Total stock options/SARs exercisable at January 2, 2011 |
264 | $ | 30.66 | $ | 3,174 | 5.0 | ||||||||||
A total of 35,000 vested SARs were exercised and cash-settled for approximately $0.3 million in 2010. The associated options were cancelled. As at January 2, 2011, the total fair value liability for stock options/SARs outstanding was $8.0 million ($2.5 million in 2009) and is included in Other long-term liabilities on the Consolidated Balance Sheet.
160
Table of Contents
TIM HORTONS INC. AND SUBSIDIARIES
Notes to the Consolidated Financial Statements—(Continued)
(in thousands of Canadian dollars, except share and per share data)
The option/SAR awards were granted to officers of the Company including both retirement-eligible employees and non-retirement-eligible employees. For purposes of the Black-Scholes-Merton option pricing model, the grant was segregated by grant date and based on retirement eligibility, and the assumptions were adjusted accordingly. All options with tandem SARs granted in 2010, 2009 and 2008 vest over 3 years and expire 7 years from the date of issuance, provided that if an employee retires, the term decreases to the earlier of four years after retirement or expiration of the original term. The fair value of these awards was determined, in accordance with ASC 718, at the grant date and each subsequent remeasurement date by applying the Black-Scholes-Merton option-pricing model. The following assumptions were used to calculate the fair value of outstanding stock options/SARs:
| Year ended | ||||
| January 2, 2011 |
January 3, 2010 | |||
| Expected share price volatility |
13% – 24% | 23% – 28% | ||
| Risk-free interest rate |
1.4% – 2.3% | 1.4% – 2.5% | ||
| Expected life |
0.9 – 4.4 years | 1.9 – 4.4 years | ||
| Expected dividend yield |
1.3% | 1.2% | ||
Expected share price volatility was estimated by using the Company’s historical share price volatility for a period similar to the expected life of the option.
The risk-free interest rate was referenced from Government of Canada bonds with a maturity period similar to the expected life of the options. If an exact match in maturity was not found, the closest two maturities, one before and one after the expected life of the options, were used to extrapolate an estimated risk-free rate.
Expected life is based on the simplified method of estimating a stock option term, in accordance with ASC 718. The simplified method was used as there is insufficient historical detail to be used as an alternative basis to estimating the term.
Expected dividend yields are based on current, approved dividends expressed as a percentage of either the strike price or the closing price at the end of the fiscal period, depending on the date of the assumption.
Forfeitures have been assumed at 0% based on the expected turnover rate of the employees who were granted stock options with tandem SARs.
Awards granted to retirement-eligible employees are expensed on an accelerated basis and expensed evenly over the period spanning the grant date and the date that the employee becomes eligible for retirement. The stock option with tandem SARs awards were revalued to fair value at January 2, 2011 using the closing share price on the Toronto Stock Exchange at the end of fiscal 2010, which was $41.10. The intrinsic value of stock options/SARs is based upon the difference between the closing share price and the exercise price, representing the value an option holder would receive had the options been exercised.
As of January 2, 2011, total unrecognized compensation cost related to non-vested stock options outstanding was $4.4 million (2009: $2.5 million) and is expected to be recognized over a weighted-average period of 2.2 years (2009: 2.2 years). The Company expects substantially all of the remainder of the outstanding stock options to vest. A total of 242,000 (2009: 56,000) stock options/SARs vested in 2010 with an intrinsic value of $2.7 million (2009: nil).
161
Table of Contents
TIM HORTONS INC. AND SUBSIDIARIES
Notes to the Consolidated Financial Statements—(Continued)
(in thousands of Canadian dollars, except share and per share data)
NOTE 19 RETIREMENT PLANS
Certain Company employees participate in various defined contribution plans. Costs for Company employees participating in these plans were approximately $6.9 million for 2010 and $6.6 million for 2009 and 2008, respectively. These costs are included in General and administrative expense on the Consolidated Statement of Operations.
NOTE 20 VARIABLE INTEREST ENTITIES
VIEs for which the Company is the primary beneficiary
Maidstone Bakeries
The Company’s previously-owned 50-50 joint-venture, Maidstone Bakeries, which produces and supplies our restaurant system with par-baked donuts, TimbitsTM , some bread products, and pastries. A significant portion of Maidstone Bakeries manufacturing activities either involves, or is conducted on behalf of, the Company to benefit the Tim Hortons restaurant chain. As such, the Company was subject to terms and conditions under various agreements, including the supply, license and service agreements. Prior to the Company’s disposition of its 50% interest in Maidstone Bakeries on October 29, 2010 (see note 4), the Company was considered to have power (under the accounting principles of ASC 810) over Maidstone Bakeries since the Company determined which par-baked products were to be manufactured by Maidstone Bakeries, exclusively for Tim Hortons restaurants, and at pricing determined by both joint venture parties. Tim Hortons restaurant owners and operators currently purchase all of their par-baked donuts, Timbits, pastries and a significant portion of other bread products from Maidstone Bakeries. For these reasons, the Company concluded that it was the primary beneficiary of Maidstone Bakeries prior to its disposition. The Company’s 50% interest was sold in the fourth quarter of 2010 (see note 4). The Company is no longer the primary beneficiary of Maidstone Bakeries and, accordingly, the Company has not consolidated Maidstone Bakeries subsequent to the sale of its 50% interest and Maidstone Bakeries is no longer considered a related party.
In fiscal 2009, the Company made a capital contribution of $1.3 million to Maidstone Bakeries and had accounts payable outstanding of $3.6 million as at January 3, 2010.
Non-owned restaurants
The Company enters into arrangements, called operator agreements, in which the operator acquires the right to operate a Tim Hortons restaurant, but the Company is the owner of the equipment, signage and trade fixtures. If the legal entity within which such an operator operates does not have additional capital independently owned by the legal entity, it is considered to not be adequately capitalized and that entity is considered a VIE. The operator is required to pay a percentage of the restaurant’s weekly gross sales to the Company, thus exposing the Company to variability in rental and royalty revenues and in the collection of amounts due. The Company has the power to determine which operator will manage these restaurants and for what duration; and, generally both the Company and the operator have the option to terminate the agreement with 30 days notice. The Company is considered to be the primary beneficiary of such legal entities.
In addition, the Company offers a FIP to certain U.S. restaurant owners which allows the restaurant owner to finance both the initial franchise fee and the purchase of certain equipment, signage and trade fixtures. These restaurant owners who participate in the FIP program do not have a significant amount of initial capital within their legal entities that is not financed directly by the Company. As a result, legal entities of restaurant owners under the FIP program, are also considered to be VIEs. To supplement the FIP, the Company may offer additional relief and assistance to restaurant owners in developing markets in the U.S. where the brand is not yet
162
Table of Contents
TIM HORTONS INC. AND SUBSIDIARIES
Notes to the Consolidated Financial Statements—(Continued)
(in thousands of Canadian dollars, except share and per share data)
established and the restaurants have lower sales levels. This additional relief may include assistance with costs of supplies; certain operating expenses, including rents and royalties; and, in certain markets, labour and other costs. The Company is considered to be the primary beneficiary in these circumstances since it absorbs losses and operating expenses of the FIP restaurant owner in the form of additional relief which is netted in the Company’s rents and royalties revenues. The Company is also considered to have power since it determines which U.S. restaurant owners will participate in the FIP program and which will be offered additional relief. Notes receivable from these FIP restaurant owners, which are generally non-interest bearing, are included in the table below.
The Company has consolidated 259 and 290 operator and FIP restaurants as at January 2, 2011 and January 3, 2010, respectively, or approximately 6.9% and 8.1% of the Company’s total systemwide restaurants, respectively. On average, a total of 275 and 277 operator and FIP restaurants were consolidated during fiscal 2010 and 2009, respectively. The Company has no equity interest in any of its restaurant owners. Other than certain lease and debt repayment guarantees provided for specific restaurant owners, none of the Company’s assets serve as collateral for the consolidated restaurants, and creditors of these operators have no recourse to the Company. The guarantees provided as at January 2, 2011 and January 3, 2010 were not significant.
Trust
In connection with restricted stock unit awards granted to Company employees, the Company established The TDL RSU Employee Benefit Plan Trust (“the Trust”), which purchases and retains common shares of the Company to satisfy the Company’s contractual obligation to deliver shares to settle the awards for most Canadian employees. The Company is considered to be the primary beneficiary of the Trust. Since inception, the Trust has been consolidated in accordance with ASC 810 and the cost of the shares held by the Trust of $9.5 million and $9.4 million as at January 2, 2011 and January 3, 2010, respectively, has been accounted for as a reduction in outstanding common shares on the Company’s Consolidated Balance Sheet.
Advertising Funds
The Company participates in two advertising funds established to collect and administer funds contributed for use in advertising and promotional programs designed to increase sales and enhance the reputation of the Company and its restaurant owners. The advertising funds are operated on behalf of the Company and its restaurant owners, with separate advertising funds administered for Canada and the U.S. The Company is the sole shareholder (Canada) and sole member (U.S.) and is considered to be the primary beneficiary of these funds which have historically been consolidated in accordance with ASC 952—Franchisors, and accordingly, the revenues, expenses and cash flows of the advertising funds are generally not included in the Company’s Consolidated Statement of Operations and Cash Flows because the contributions to these advertising funds are designated for specific purposes, and the Company acts, in substance, as an agent with regard to these contributions. The assets and liabilities of these advertising funds have been consolidated in accordance with ASC 810. Company contributions to these advertising funds totaled $4.2 million and $3.9 million in 2010 and 2009, respectively. These advertising funds spent approximately $198.4 million, $190.2 million, and $176.1 million in 2010, 2009 and 2008, respectively. The following table summarizes actual contribution rates to the advertising funds for franchise and Company-operated restaurants:
| Advertising Fund contribution rate(1) as of fiscal year-end |
||||||||||||
| 2010 | 2009 | 2008 | ||||||||||
| Canada |
3.5 | % | 3.5 | %(2) | 3.5 | % | ||||||
| U.S. |
4.0 | % | 4.0 | % | 4.0 | % | ||||||
163
Table of Contents
TIM HORTONS INC. AND SUBSIDIARIES
Notes to the Consolidated Financial Statements—(Continued)
(in thousands of Canadian dollars, except share and per share data)
| (1) | Franchise and license agreements require contributions of up to 4.0% of restaurant sales. Contribution rates for Canadian restaurant owners have been voluntarily reduced to 3.5% of restaurant sales, but the Company retains the right to remove this voluntary rate reduction at any time. |
| (2) | The Company introduced a temporary reduction of 0.25% to the contribution rate for Canadian restaurant owners during July 2009 through December 2009. During this period, the Company continued to collect the full 3.5% contribution. A rebate for this temporary reduction was issued in early 2010 to eligible restaurant owners. |
The assets and liabilities associated with the Company’s consolidated restaurant VIEs (operator and FIP restaurants), advertising funds, and previously consolidated 50-50 bakery joint venture are presented on a gross basis, prior to consolidation adjustments, and are as follows:
| As at | ||||||||||||||||||||
| January 2, 2011 | January 3, 2010 | |||||||||||||||||||
| Restaurant VIEs |
Advertising fund VIEs |
Joint Venture VIE (2) |
Restaurant VIEs |
Advertising fund VIEs |
||||||||||||||||
| Cash and cash equivalents |
$ | 8,087 | $ | 0 | $ | 15,714 | $ | 6,229 | $ | 0 | ||||||||||
| Restricted assets—current |
0 | 27,402 | 0 | 0 | 26,681 | |||||||||||||||
| Other current assets |
4,070 | 0 | 26,751 | 5,268 | 0 | |||||||||||||||
| Property and equipment, net |
31,240 | 12,497 | 141,756 | 29,448 | 18,159 | |||||||||||||||
| Other long-term assets (1) |
1,319 | 2,336 | 2,809 | 4,162 | 1,256 | |||||||||||||||
| Total assets |
$ | 44,716 | $ | 42,235 | $ | 187,030 | $ | 45,107 | $ | 46,096 | ||||||||||
| Notes payable to Tim Hortons Inc.—current (1) |
$ | 22,833 | $ | 0 | $ | 0 | $ | 22,843 | $ | 0 | ||||||||||
| Restricted liabilities—current |
0 | 41,026 | 0 | 0 | 43,944 | |||||||||||||||
| Other current liabilities (1) |
13,201 | 0 | 11,119 | 13,765 | 0 | |||||||||||||||
| Notes payable to Tim Hortons Inc.—long-term (1) |
1,635 | 0 | 0 | 5,584 | 0 | |||||||||||||||
| Restricted liabilities—long-term |
0 | 468 | 0 | 0 | 415 | |||||||||||||||
| Other long-term liabilities |
1,531 | 741 | 7,818 | 639 | 1,737 | |||||||||||||||
| Total liabilities |
39,200 | 42,235 | 18,937 | 42,831 | 46,096 | |||||||||||||||
| Equity of variable interest entities |
5,516 | 0 | 168,093 | 2,276 | 0 | |||||||||||||||
| Total liabilities and equity |
$ | 44,716 | $ | 42,235 | $ | 187,030 | $ | 45,107 | $ | 46,096 | ||||||||||
| (1) | Various assets and liabilities are eliminated upon the consolidation of these variable interest entities, the most significant of which are the Notes payable to Tim Hortons Inc., which reduces the Notes receivable, net reported on the Consolidated Balance Sheet. |
| (2) | Sold in the fourth quarter of 2010 (see note 4). |
The liabilities recognized as a result of consolidating these VIEs do not necessarily represent additional claims on our general assets; rather, they represent claims against the specific assets of the consolidated VIEs. Conversely, assets recognized as a result of consolidating these VIEs do not represent additional assets that could be used to satisfy claims by our creditors as they are not legally included within our general assets.
164
Table of Contents
TIM HORTONS INC. AND SUBSIDIARIES
Notes to the Consolidated Financial Statements—(Continued)
(in thousands of Canadian dollars, except share and per share data)
VIEs for which the Company is not the primary beneficiary
The Company also has investments in certain real estate ventures determined to be VIEs of which the Company is not the primary beneficiary. The most significant of these is TIMWEN Partnership, owned on a 50-50 basis by the Company and Wendy’s International, Inc. (“Wendy’s”) to jointly develop the real estate underlying “combination restaurants” in Canada that offer Tim Hortons and Wendy’s products at one location, typically with separate restaurant owners operating the Tim Hortons and Wendy’s restaurants. Control is considered to be shared by both Tim Hortons and Wendy’s since all significant decisions of the TIMWEN Partnership must be made jointly.
These real estate ventures, including TIMWEN Partnership, are accounted for using the equity method, based on the Company’s ownership percentages, and are included in Equity investments on the Company’s Consolidated Balance Sheet. The maximum exposure to potential losses associated with these non-consolidated VIEs is limited to the Company’s equity investments which amounted to $44.8 million and $45.9 million as at January 2, 2011 and January 3, 2010, respectively. The Company had $0 and $2.4 million of accounts payable outstanding with TIMWEN Partnership as at January 2, 2011 and January 3, 2010, respectively.
NOTE 21 SEGMENT REPORTING
The Company operates exclusively in the food-service industry and has determined that its reportable segments are those that are based on the Company’s methods of internal reporting and management structure and represent the manner in which the Company’s chief decision maker views and evaluates the various aspects of the Company’s business. The Company’s reportable segments are the geographic locations of Canada and the U.S. As set forth in the table below, there are no amounts of revenues shown between reportable segments.
165
Table of Contents
TIM HORTONS INC. AND SUBSIDIARIES
Notes to the Consolidated Financial Statements—(Continued)
(in thousands of Canadian dollars, except share and per share data)
The table below presents information about reportable segments:
| Year ended | ||||||||||||||||||||||||
| January 2, 2011 |
% of total |
January 3, 2010 |
% of total |
December 28, 2008 |
% of total |
|||||||||||||||||||
| (in thousands) | (in thousands) | (in thousands) | ||||||||||||||||||||||
| Revenues |
||||||||||||||||||||||||
| Canada (2) |
$ | 2,114,419 | 83.4 | % | $ | 1,914,210 | 78.5 | % | $ | 1,750,399 | 78.5 | % | ||||||||||||
| U.S |
123,116 | 4.9 | % | 140,491 | 5.8 | % | 122,679 | 5.5 | % | |||||||||||||||
| Total reportable segments |
2,237,535 | 88.2 | % | 2,054,701 | 84.2 | % | 1,873,078 | 84.0 | % | |||||||||||||||
| Variable interest entities (1) |
298,960 | 11.8 | % | 384,152 | 15.8 | % | 356,095 | 16.0 | % | |||||||||||||||
| Total |
$ | 2,536,495 | 100.0 | % | $ | 2,438,853 | 100.0 | % | $ | 2,229,173 | 100.0 | % | ||||||||||||
| Segment Operating Income (Loss) |
||||||||||||||||||||||||
| Canada (1) (2) |
$ | 904,768 | 102.1 | % | $ | 538,292 | 99.1 | % | $ | 512,255 | 105.5 | % | ||||||||||||
| U.S. (3) |
(18,363 | ) | (2.1 | )% | 4,840 | 0.9 | % | (26,488 | ) | (5.5 | %) | |||||||||||||
| Reportable segment operating income |
886,405 | 100.0 | % | 543,132 | 100.0 | % | 485,767 | 100.0 | % | |||||||||||||||
| Variable interest entities (1) |
26,534 | 27,762 | 29,631 | |||||||||||||||||||||
| Corporate charges(4) |
(40,701 | ) | (45,292 | ) | (36,951 | ) | ||||||||||||||||||
| Consolidated Operating Income |
872,238 | 525,602 | 478,447 | |||||||||||||||||||||
| Interest, Net |
(24,180 | ) | (19,184 | ) | (19,632 | ) | ||||||||||||||||||
| Income Taxes |
(200,940 | ) | (186,606 | ) | (150,309 | ) | ||||||||||||||||||
| Net Income |
647,118 | 319,812 | 308,506 | |||||||||||||||||||||
| Net Income Attributable to Noncontrolling Interests |
23,159 | 23,445 | 23,828 | |||||||||||||||||||||
| Net Income Attributable to Tim Hortons |
$ | 623,959 | $ | 296,367 | $ | 284,678 | ||||||||||||||||||
| Capital Expenditures |
||||||||||||||||||||||||
| Canada |
$ | 104,278 | $ | 128,367 | $ | 113,775 | ||||||||||||||||||
| U.S. |
27,242 | 29,604 | 60,472 | |||||||||||||||||||||
| Variable interest entities. |
1,392 | 2,487 | 10,291 | |||||||||||||||||||||
| $ | 132,912 | $ | 160,458 | $ | 184,538 | |||||||||||||||||||
| (1) | While the adoption of ASC 810 (previously SFAS No. 167) (see note 1) resulted in the consolidation of Maidstone Bakeries, the Company’s chief decision maker continued to view and evaluate the performance of the Canadian segment with Maidstone Bakeries accounted for on an equity accounting basis, which reflects 50% of its operating income (consistent with views and evaluations prior to the adoption of the Standard). As a result, the net revenues, and the remaining 50% of operating income of Maidstone Bakeries have been included in Variable interest entities along with revenues and operating income from our non-owned consolidated restaurants. |
| (2) | Includes $361,075 gain on the sale of the Company’s interest in Maidstone Bakeries, partially offset by $30,000 related to the amount committed to restaurant owners in 2010, which was recorded as a reduction of revenues. |
| (3) | Includes $28,298 and $21,266 of asset impairment and related closure costs in 2010 and 2008, respectively. |
166
Table of Contents
TIM HORTONS INC. AND SUBSIDIARIES
Notes to the Consolidated Financial Statements—(Continued)
(in thousands of Canadian dollars, except share and per share data)
| (4) | Corporate charges include certain overhead costs which are not allocated to individual business segments, the impact of certain foreign currency exchange gains and losses, and the operating income from the Company’s wholly-owned Irish subsidiary, which continues to be managed corporately. |
The following table provides a reconciliation of total reportable segment property and equipment, net and total assets to total consolidated property and equipment, net and total consolidated assets, respectively:
| 2010 | 2009 | 2008 | ||||||||||
| (in thousands) | ||||||||||||
| Total property and equipment, net |
||||||||||||
| Canada |
$ | 1,012,322 | $ | 967,879 | $ | 913,823 | ||||||
| U.S. |
324,600 | 356,560 | 402,839 | |||||||||
| Total reportable segment property and equipment, net |
1,336,922 | 1,324,439 | 1,316,622 | |||||||||
| Variable interest entity property and equipment, net |
25,252 | 156,712 | 163,376 | |||||||||
| Corporate property and equipment, net |
11,496 | 12,881 | 13,647 | |||||||||
| Consolidated property and equipment, net |
$ | 1,373,670 | $ | 1,494,032 | $ | 1,493,685 | ||||||
| 2010 | 2009 | 2008 | ||||||||||
| (in thousands) | ||||||||||||
| Total Assets |
||||||||||||
| Canada |
$ | 1,686,209 | $ | 1,373,325 | $ | 1,290,219 | ||||||
| U.S. |
424,089 | 478,395 | 567,557 | |||||||||
| Total reportable segment assets |
2,110,298 | 1,851,720 | 1,857,776 | |||||||||
| Variable interest entity assets |
37,868 | 226,470 | 213,407 | |||||||||
| Corporate assets |
333,350 | 16,101 | 26,511 | |||||||||
| Consolidated total assets |
$ | 2,481,516 | $ | 2,094,291 | $ | 2,097,694 | ||||||
Corporate assets include a nominal amount of assets related to the Company’s wholly-owned Irish subsidiary, which continues to be managed corporately.
Significant non-cash items included in reportable segment operating income and reconciled to total consolidated amounts is as follows:
| Year ended | ||||||||||||
| January 2, 2011 |
January 3, 2010 |
December 28, 2008 |
||||||||||
| (in thousands) | ||||||||||||
| Depreciation and amortization |
||||||||||||
| Canada |
$ | 83,494 | $ | 78,270 | $ | 71,442 | ||||||
| U.S. |
21,394 | 21,999 | 19,666 | |||||||||
| Total reportable segments |
104,888 | 100,269 | 91,108 | |||||||||
| Variable interest entities |
12,112 | 12,450 | 12,028 | |||||||||
| Corporate |
1,385 | 756 | 657 | |||||||||
| $ | 118,385 | $ | 113,475 | $ | 103,793 | |||||||
| Asset impairment—U.S. |
$ | 17,770 | $ | 0 | $ | 16,559 | ||||||
167
Table of Contents
TIM HORTONS INC. AND SUBSIDIARIES
Notes to the Consolidated Financial Statements—(Continued)
(in thousands of Canadian dollars, except share and per share data)
Revenues consisted of the following:
| Year ended | ||||||||||||
| January 2, 2011 |
January 3, 2010 |
December 28, 2008 |
||||||||||
| (in thousands) | ||||||||||||
| Sales |
||||||||||||
| Distribution sales |
$ | 1,434,104 | $ | 1,295,677 | $ | 1,139,072 | ||||||
| Company-operated restaurant sales |
22,186 | 24,236 | 38,327 | |||||||||
| Variable interest entities |
298,954 | 384,152 | 364,482 | |||||||||
| 1,755,244 | 1,704,065 | 1,541,881 | ||||||||||
| Franchise revenues |
||||||||||||
| Rents and royalties |
687,039 | 644,755 | 593,484 | |||||||||
| Franchise fees |
94,212 | 90,033 | 93,808 | |||||||||
| 781,251 | 734,788 | 687,292 | ||||||||||
| Total revenues |
$ | 2,536,495 | $ | 2,438,853 | $ | 2,229,173 | ||||||
NOTE 22 SUPPLEMENTAL CASH FLOW INFORMATION
| Year ended | ||||||||||||
| January 2, 2011 |
January 3, 2010 |
December 28, 2008 |
||||||||||
| (in thousands) | ||||||||||||
| Supplemental disclosures of cash flow information: |
||||||||||||
| Interest paid |
$ | 24,368 | $ | 21,097 | $ | 25,139 | ||||||
| Income taxes paid |
$ | 158,646 | $ | 159,985 | $ | 161,710 | ||||||
| Non-cash investing and financing activities: |
||||||||||||
| Capital lease obligations incurred |
$ | 29,233 | $ | 13,847 | $ | 13,680 | ||||||
NOTE 23 RELATED PARTY TRANSACTIONS
Included in contingent rent expense (see note 15) are expenses associated with the Company’s 50-50 joint venture with Wendy’s for the years ended 2010 and 2009 of $24.0 million and $23.6 million, respectively. The Company had $2.4 million of accounts payable outstanding with this joint venture as at January 2, 2011 ($2.4 million in 2009) and accounts receivable from this joint venture of $0.1 million ($0.2 million in 2009).
In addition, the Company had a $6.2 million note receivable outstanding as at January 3, 2010, which was repaid in 2010, from the trust fund holding plan assets in connection with the termination of the Company’s former supplemental executive retirement plan and settlement of account balances to the participants as a result thereof.
NOTE 24 RECENT ACCOUNTING PRONOUNCEMENTS
In October 2009, the FASB issued ASU No. 2009-13—Multiple Deliverable Revenue Arrangements, as codified in ASC 605—Revenue Recognition. The objective of this ASU is to address the accounting for multiple-deliverable arrangements to enable vendors to account for products or services (deliverables) separately rather than as a combined unit. The ASU also establishes a selling price hierarchy for determining the selling price of a
168
Table of Contents
TIM HORTONS INC. AND SUBSIDIARIES
Notes to the Consolidated Financial Statements—(Continued)
(in thousands of Canadian dollars, except share and per share data)
deliverable and has expanded disclosures related to a vendor’s multiple-deliverable revenue arrangements. This ASU is effective for fiscal years beginning after June 15, 2010, and the Company is currently assessing the potential impact, if any, the adoption of this ASU may have on its Consolidated Financial Statements.
In April 2010, the FASB issued ASU No. 2010-13—Effect of Denominating the Exercise Price of a Share-Based Payment Award in the Currency of the Market in Which the Underlying Equity Security Trades as codified in ASC 718—Compensation—Stock Compensation (“ASC 718”). This update addresses the classification of a share-based payment award with an exercise price denominated in the currency of a market in which the underlying equity security trades. ASC 718 is amended to clarify that a share-based payment award with an exercise price denominated in the currency of a market in which a substantial portion of the entity’s equity securities trades shall not be considered to contain a market, performance, or service condition. Therefore, such an award is not to be classified as a liability if it otherwise qualifies as equity classification. This ASU is effective for fiscal years beginning on or after December 15, 2010, and the Company is currently assessing the potential impact, if any, the adoption of this update may have on its Consolidated Financial Statements.
In April 2010, the FASB issued ASU No. 2010-17—Revenue Recognition—Milestone Method of Revenue Recognition as codified in ASC 605—Revenue Recognition. This update provides guidance on defining a milestone and determining when it may be appropriate to apply the milestone method of revenue recognition for research or development transactions. Consideration that is contingent on achievement of a milestone in its entirety may be recognized as revenue in the period in which the milestone is achieved only if the milestone is judged to meet certain criteria to be considered substantive. Milestones should be considered substantive in their entirety and may not be bifurcated. An arrangement may contain both substantive and nonsubstantive milestones that should be evaluated individually. This ASU is effective for fiscal years beginning on or after June 15, 2010, and the Company is currently assessing the potential impact, if any, the adoption of this update may have on its Consolidated Financial Statements.
169
Table of Contents
TIM HORTONS INC. AND SUBSIDIARIES
Notes to the Consolidated Financial Statements—(Continued)
(in thousands of Canadian dollars, except share and per share data)
NOTE 25 SUBSEQUENT EVENT
On February 23, 2011, the Company obtained regulatory approval from the Toronto Stock Exchange to commence a new share repurchase program (“2011 Program”) for up to $445 million in common shares, not to exceed the regulatory maximum of 14,881,870 shares, representing 10% of the Company’s public float as of February 17, 2011, as defined under the Toronto Stock Exchange rules. The Company’s common shares will be purchased under the 2011 Program through a combination of a 10b5-1 automatic trading plan purchases, as well as purchases at management’s discretion in compliance with regulatory requirements, and given market, cost and other considerations. Repurchases will be made on the Toronto Stock Exchange, the New York Stock Exchange, and/or other Canadian marketplaces, subject to compliance with applicable regulatory requirements. The 2011 Program is due to expire on March 2, 2012, or earlier if the $445 million or the 10% share maximum is reached. Common shares purchased pursuant to the 2011 Program will be cancelled. The 2011 Program may be terminated by the Company at any time, subject to compliance with regulatory requirements. As such, there can be no assurance regarding the total number of shares or the equivalent dollar value of shares that may be repurchased under the 2011 Program.
NOTE 26 QUARTERLY FINANCIAL DATA (UNAUDITED)
| 2010 | ||||||||||||||||
| Q1 | Q2 | Q3 | Q4 | |||||||||||||
| (in thousands, except per share data) | ||||||||||||||||
| Revenues |
||||||||||||||||
| Sales |
$ | 405,948 | $ | 444,344 | $ | 468,000 | $ | 436,952 | ||||||||
| Franchise revenues |
||||||||||||||||
| Rents and royalties |
159,960 | 175,879 | 176,964 | 174,236 | ||||||||||||
| Franchise fees |
16,704 | 19,639 | 25,556 | 32,313 | ||||||||||||
| 176,664 | 195,518 | 202,520 | 206,549 | |||||||||||||
| Total revenues |
582,612 | 639,862 | 670,520 | 643,501 | ||||||||||||
| Asset impairment and related closure costs(1) |
(0 | ) | (0 | ) | (20,888 | ) | (7,410 | ) | ||||||||
| Other costs and expenses, net |
(454,876 | ) | (490,011 | ) | (516,622 | ) | (535,525 | ) | ||||||||
| Gain on sale of interest in Maidstone Bakeries |
0 | 0 | 0 | 361,075 | ||||||||||||
| Operating income |
$ | 127,736 | $ | 149,851 | $ | 133,010 | $ | 461,641 | ||||||||
| Net income attributable to Tim Hortons Inc.(2) |
$ | 78,889 | $ | 94,121 | $ | 73,828 | $ | 377,121 | ||||||||
| Diluted earnings per common share attributable to Tim Hortons Inc.(2) |
$ | 0.45 | $ | 0.54 | $ | 0.42 | $ | 2.19 | ||||||||
170
Table of Contents
TIM HORTONS INC. AND SUBSIDIARIES
Notes to the Consolidated Financial Statements—(Continued)
(in thousands of Canadian dollars, except share and per share data)
| 2009 | ||||||||||||||||
| Q1 | Q2 | Q3 | Q4(3) | |||||||||||||
| (in thousands, except per share data) | ||||||||||||||||
| Revenues |
||||||||||||||||
| Sales |
$ | 391,116 | $ | 425,348 | $ | 422,995 | $ | 464,606 | ||||||||
| Franchise revenues |
||||||||||||||||
| Rents and royalties |
144,164 | 160,824 | 164,114 | 175,653 | ||||||||||||
| Franchise fees |
20,427 | 19,287 | 23,605 | 26,714 | ||||||||||||
| 164,591 | 180,111 | 187,719 | 202,367 | |||||||||||||
| Total revenues |
555,707 | 605,459 | 610,714 | 666,973 | ||||||||||||
| Total costs and expenses, net |
(444,491 | ) | (476,410 | ) | (473,885 | ) | (518,465 | ) | ||||||||
| Operating income |
$ | 111,216 | $ | 129,049 | $ | 136,829 | $ | 148,508 | ||||||||
| Net income attributable to Tim Hortons Inc.(4) |
$ | 66,439 | $ | 77,760 | $ | 61,179 | $ | 90,989 | ||||||||
| Diluted earnings common per share attributable to Tim Hortons Inc. (5) |
$ | 0.37 | $ | 0.43 | $ | 0.34 | $ | 0.51 | ||||||||
| (1) | Asset impairment and related closure costs were recorded in the third quarter of 2010 and the fourth quarter of 2010, respectively, relating to the closure of restaurants in the New England market. |
| (2) | Net income attributable to Tim Hortons Inc. includes an asset impairment of $20.9 million incurred in the third quarter of 2010 (diluted EPS impact $0.12) and $7.4 million of an asset impairment and related closure costs in the fourth quarter of 2010 (diluted EPS impact $0.04). The fourth quarter 2010 net income attributable to Tim Hortons Inc. also includes the after-tax gain on sale of the Company’s 50% interest in Maidstone Bakeries of $320.5 million (diluted EPS impact $1.86) and $24.9 million of an after-tax expense related to the allocation to restaurant owners in connection with the Maidstone Bakeries sale (diluted EPS impact $0.14). |
| (3) | The 2009 fiscal year consisted of 53 weeks. As a result, the fourth quarter of 2009 represents 14 weeks compared to all other quarters in 2009 that represented 13 weeks. The extra operating week impacted revenues and costs and expense by approximately 6% to 7%, respectively. |
| (4) | Net income attributable to Tim Hortons Inc. includes $20.0 million of deferred tax expenses related primarily to a deferred tax valuation allowance due to the reorganization of the Company to a Canadian public company in the third quarter of 2009 (see notes 1 and 7). |
| (5) | Diluted earnings per share was impacted by $0.11 for the deferred tax valuation allowance noted above in the third quarter of 2009. |
171
Table of Contents
TO CONSOLIDATED FINANCIAL STATEMENTS—VALUATION AND QUALIFYING ACCOUNTS
(in thousands)
| Classification |
Balance at Beginning of Year |
Charged (Credited) to Costs & Expenses |
Additions (Deductions) |
Balance at End of Year |
||||||||||||
| (in thousands) | ||||||||||||||||
| Fiscal year ended January 2, 2011: |
||||||||||||||||
| Deferred tax asset valuation allowance |
$ | 58,639 | $ | (18,938 | ) | $ | (2,230 | ) | $ | 37,471 | ||||||
| Allowance for doubtful accounts and notes |
1,794 | 684 | (994 | ) | 1,484 | |||||||||||
| Inventory reserve |
2,181 | 36 | (1,165 | ) | 1,052 | |||||||||||
| $ | 62,614 | $ | (18,218 | ) | $ | (4,389 | ) | $ | 40,007 | |||||||
| Fiscal year ended January 3, 2010: |
||||||||||||||||
| Deferred tax asset valuation allowance |
$ | 62,191 | $ | 4,703 | $ | (8,255 | ) | $ | 58,639 | |||||||
| Allowance for doubtful accounts and notes |
2,125 | 423 | (754 | ) | 1,794 | |||||||||||
| Inventory reserve |
1,402 | 1,338 | (559 | ) | 2,181 | |||||||||||
| $ | 65,718 | $ | 6,464 | $ | (9,568 | ) | $ | 62,614 | ||||||||
| Fiscal year ended December 28, 2008: |
||||||||||||||||
| Deferred tax asset valuation allowance (1) |
$ | 40,845 | $ | 10,418 | $ | 10,928 | $ | 62,191 | ||||||||
| Allowance for doubtful accounts and notes |
2,247 | 1,369 | (1,491 | ) | 2,125 | |||||||||||
| Inventory reserve |
1,757 | 67 | (422 | ) | 1,402 | |||||||||||
| $ | 44,849 | $ | 11,854 | $ | 9,015 | $ | 65,718 | |||||||||
| (1) | In the fiscal year ended December 28, 2008, the increase in the deferred tax asset valuation allowance primarily resulted from increases to temporary differences related to the U.S. operations, and the translation of those amounts from U.S. dollars to Canadian dollars. |
Year-end balances are reflected in the Consolidated Balance Sheets as follows:
| 2010 | 2009 | |||||||
| (in thousands) | ||||||||
| Valuation allowance, deferred income taxes |
$ | 37,471 | $ | 58,639 | ||||
| Deducted from accounts receivable and notes receivable, net |
1,484 | 1,794 | ||||||
| Deducted from inventories and other, net |
1,052 | 2,181 | ||||||
| $ | 40,007 | $ | 62,614 | |||||
172
Table of Contents
Report of Independent Registered Public Accounting Firm
To the Shareholders of Tim Hortons Inc.:
We have audited the accompanying consolidated balance sheets of Tim Hortons Inc. and its subsidiaries as at January 2, 2011 and January 3, 2010, the related consolidated statements of operations, equity, comprehensive income and cash flows for each of the years in the three-year period ended January 2, 2011 and the financial statement schedule to the consolidated financial statements. We also have audited Tim Hortons Inc.'s internal control over financial reporting as of January 2, 2011, based on criteria established in Internal Control—Integrated Framework issued by the Committee of Sponsoring Organizations of the Treadway Commission (COSO). Management is responsible for these financial statements, for maintaining effective internal control over financial reporting, and for its assessment of the effectiveness of internal control over financial reporting, included in the accompanying Management’s Report on Internal Control Over Financial Reporting. Our responsibility is to express an opinion on these consolidated financial statements and an opinion on the company's internal control over financial reporting based on our audits.
We conducted our audits in accordance with the standards of the Public Company Accounting Oversight Board (United States). Those standards require that we plan and perform the audits to obtain reasonable assurance about whether the consolidated financial statements are free of material misstatement and whether effective internal control over financial reporting was maintained in all material respects. Our audits of the consolidated financial statements included examining, on a test basis, evidence supporting the amounts and disclosures in the financial statements, assessing the accounting principles used and significant estimates made by management, and evaluating the overall financial statement presentation. Our audit of internal control over financial reporting included obtaining an understanding of internal control over financial reporting, assessing the risk that a material weakness exists, and testing and evaluating the design and operating effectiveness of internal control based on the assessed risk. Our audits also included performing such other procedures as we considered necessary in the circumstances. We believe that our audits provide a reasonable basis for our opinions.
A company's internal control over financial reporting is a process designed to provide reasonable assurance regarding the reliability of financial reporting and the preparation of financial statements for external purposes in accordance with generally accepted accounting principles. A company's internal control over financial reporting includes those policies and procedures that (i) pertain to the maintenance of records that, in reasonable detail, accurately and fairly reflect the transactions and dispositions of the assets of the company; (ii) provide reasonable assurance that transactions are recorded as necessary to permit preparation of consolidated financial statements in accordance with generally accepted accounting principles, and that receipts and expenditures of the company are being made only in accordance with authorizations of management and directors of the company; and (iii) provide reasonable assurance regarding prevention or timely detection of unauthorized acquisition, use, or disposition of the company's assets that could have a material effect on the financial statements.
Because of its inherent limitations, internal control over financial reporting may not prevent or detect misstatements. Also, projections of any evaluation of effectiveness to future periods are subject to the risk that controls may become inadequate because of changes in conditions, or that the degree of compliance with the policies or procedures may deteriorate.
In our opinion, the consolidated financial statements and schedule referred to above present fairly, in all material respects, the financial position of Tim Hortons Inc. and its subsidiaries as at January 2, 2011 and January 3, 2010, and the results of its operations and its cash flows for each of the years in the three-year period ended January 2, 2011 in conformity with accounting principles generally accepted in the United States of America. Also in our opinion, Tim Hortons Inc. maintained, in all material respects, effective internal control over financial reporting as of January 2, 2011, based on criteria established in Internal Control—Integrated Framework issued by the Committee of Sponsoring Organizations of the Treadway Commission (COSO).
As discussed in Notes 1 and 20 of the consolidated financial statements, Tim Hortons Inc. and its subsidiaries changed the manner in which it accounts for variable interest entities in the year ended January 2, 2011, due to the adoption of FASB Statement of Accounting Standards (“SFAS”) No. 167—Amendments to FASB Interpretation No. 46(R) (“SFAS No. 167”), now codified within ASC 810; and as discussed in Note 1 of the consolidated financial statements, the Company changed the manner in which it accounts for noncontrolling interests in the year ended January 3, 2010, due to the adoption of Accounting Standards Codification 810-10 (formerly FAS 160: Noncontrolling Interests in Consolidated Financial Statements an amendment of ARB No. 51). The Company has retroactively applied this standard to comparative periods.
(Signed) PricewaterhouseCoopers LLP
Chartered Accountants, Licensed Public Accountants
Toronto, Canada
February 25, 2011
173
Table of Contents
| Item 9. | Changes in and Disagreements with Accountants on Accounting and Financial Disclosure |
None.
| Item 9A. | Controls and Procedures |
Disclosure Controls and Procedures
We maintain disclosure controls and procedures (as defined in Rule 13a-15(e) under the Securities Exchange Act of 1934, as amended (the “Exchange Act”)), that are designed to ensure that information that would be required to be disclosed in Exchange Act reports is recorded, processed, summarized and reported within the time periods specified in the SEC’s rules and forms, and that such information is accumulated and communicated to our management, including the Chief Executive Officer and the Chief Financial Officer, as appropriate, to allow timely decisions regarding required disclosure.
As of January 2, 2011, we carried out an evaluation, under the supervision, and with the participation of our management, including our Chief Executive Officer and Chief Financial Officer, of the effectiveness of the design and operation of our disclosure controls and procedures. Based on that evaluation, our Chief Executive Officer and Chief Financial Officer concluded, as of January 2, 2011, that such disclosure controls and procedures were effective.
Report of Management on Internal Control over Financial Reporting
Management of the Company is responsible for establishing and maintaining adequate internal control over financial reporting. Internal control over financial reporting is a process to provide reasonable assurance regarding the reliability of our financial reporting for external purposes in accordance with accounting principles generally accepted in the United States of America. Internal control over financial reporting includes maintaining records that in reasonable detail accurately and fairly reflect our transactions; providing reasonable assurance that transactions are recorded as necessary for preparation of our financial statements; providing reasonable assurance that receipts and expenditures are made in accordance with management authorization; and providing reasonable assurance regarding prevention or timely detection of unauthorized acquisition, use or disposition of our assets that could have a material effect on our financial statements.
Because of its inherent limitations, internal control over financial reporting is not intended to provide absolute assurance that a misstatement of our financial statements would be prevented or detected. Also, projections of any evaluation of effectiveness to future periods are subject to the risk that controls may become inadequate because of changes in conditions or that the degree of compliance with policies or procedures may deteriorate.
As of January 2, 2011, we conducted an evaluation of the effectiveness of our internal control over financial reporting based on the framework and criteria established in Internal Control – Integrated Framework, issued by the Committee of Sponsoring Organizations of the Treadway Commission. This evaluation included review of the documentation of controls, evaluation of the design effectiveness of controls, testing of the operating effectiveness of controls and a conclusion on this evaluation. Based on this evaluation, management concluded that the Company’s internal control over financial reporting was effective as of January 2, 2011.
Our independent registered public accounting firm, PricewaterhouseCoopers LLP, audited the effectiveness of our internal control over financial reporting as of January 2, 2011, as stated in their report set forth in Part II, Item 8 of this Form 10-K on page 173 hereof.
| Item 9B. | Other Information |
On February 23, 2011, consistent with the historical practice of making compensation decisions annually in February, the Board of Directors approved modifications to the compensation of the Chief Executive Officer and the Executive Chairman, and the Human Resource and Compensation Committee (“Compensation Committee” or “Committee”) approved changes to compensation for the Chief Financial Officer and the other named
174
Table of Contents
executive officers. For the CEO and CFO, these changes represent the Committee’s commitment to pay-for-performance and market-competitive compensation. In addition, these increases recognize the continued strong performance, skills, and directly relevant experience of both Mr. Donald B. Schroeder and Ms. Cynthia J. Devine in their current roles. For Mr. Schroeder, the increases also reflect the conclusion of the transition (effective in 2010) of responsibilities and accountabilities with our Executive Chairman, Mr. House. As outlined below, for the fourth consecutive year and, as expected, Mr. House’s 2011 compensation will decline significantly.
With respect to pay-for-performance, the substantial majority of the increases for the CEO and CFO were made to short- and long-term incentive compensation. As a result, on a total compensation basis, at target, 80% of the CEO’s and 73% of the CFO’s 2011 compensation will be “at risk” and dependent upon the Company’s 2011 performance. Also, the long-term equity incentive compensation increases, which are performance-based (as noted above) and also have vesting requirements after grant, represent 75% (for the CEO) and 92% (for the CFO) of their total increases. On a market-competitive basis, the increases will place the CEO below, and CFO at, the Committee’s established principles and guidelines for market-competitive pay, which include benchmarking to the 75th percentile of the relevant comparator group for total compensation and 25th percentile for base pay.
CEO. The following changes to the CEO’s compensation were approved: annual base salary will be $750,000, increased from $650,000; the annual incentive award opportunity under the Company’s Executive Annual Performance Plan, or EAPP, will increase to $1.0 million at target (from $900,000); and, the long-term incentive awards under the Company’s 2006 Stock Incentive Plan (“2006 Plan”) will be $2.0 million at target (from $1.4 million).
Executive Chairman. Partially offsetting reductions were made to the compensation of the Executive Chairman in light of the end of the transition, mentioned above, coupled with the further change in focus of Mr. House’s role to reflect greater emphasis on long-term strategic planning, succession planning, relationships with key stakeholders, and Board responsibilities, as opposed to management activities. His 2011 compensation will be more aligned with non-employee director compensation, as opposed to management-level compensation and, therefore, he will no longer receive incentive-based pay. Mr. House’s compensation for 2011 will consist of: (i) base salary of $300,000 (a reduction from $350,000), and (ii) time-vested restricted share units of $200,000 (a reduction from long-term incentive compensation in the aggregate of $350,000). As mentioned, Mr. House will not receive short-term incentive pay, representing a further reduction from 2010 compensation of $200,000.
CFO. For 2011, Ms. Devine’s annual base salary will be $400,000 (representing an increase of $16,500). Her annual, short-term incentive award opportunity under the EAPP will be $500,000 at target (the same as 2010), and her long-term incentive award opportunity under the 2006 Plan will increase to $600,000 at target (representing an increase of $186,918).
Consistent with the Committee’s established administrative practice, the increases, and for Mr. House, the decrease, in the long-term equity incentive awards will apply immediately, with the first awards to be granted in May 2011 (based on the Company’s 2010 performance). For Mr. Schroeder and Ms. Devine, the value of the May 2011 awards will be divided equally between (i) performance-conditioned restricted stock units at the performance level achieved for 2010 performance of 105%; and, (ii) tandem stock options with stock appreciation rights.
The amount payable under the EAPP for Mr. Schroeder and Ms. Devine for 2011 (payable in February of 2012), is dependent upon the extent to which the Company achieves operating income (as to 75% of the award) and net income (as to 25% of the award) objectives for 2011 that were established in February 2011. As with the EAPP payout, the value of long-term incentive compensation based on 2011 performance will be targeted at the levels described above for Mr. Schroeder and Ms. Devine, but the amount ultimately granted will be dependent upon the extent to which the Company achieves its operating income performance objective for 2011, also established in February 2011.
175
Table of Contents
PART III
| Item 10. | Directors, Executive Officers and Corporate Governance |
The information required by this Item, other than the information set forth below, will be included in the Company’s Form 10-K/A which will be filed no later than 120 days after January 2, 2011. Such information will also be contained in the management proxy circular that we prepare in accordance with Canadian corporate and securities law requirements.
EXECUTIVE OFFICERS OF THE REGISTRANT
| Name |
Age | Position with Company |
Officer Since | |||||||
| Paul D. House |
67 | Executive Chairman | 1985 | |||||||
| Donald B. Schroeder |
64 | President and Chief Executive Officer | 1991 | |||||||
| Cynthia J. Devine |
46 | Chief Financial Officer | 2003 | |||||||
| David F. Clanachan |
49 | Chief Operations Officer, United States and International | 1997 | |||||||
| William A. Moir |
62 | Chief Brand and Marketing Officer | 1990 | |||||||
| Roland M. Walton |
55 | Chief Operations Officer, Canada | 1997 | |||||||
| John M. Hemeon |
46 | Executive Vice President, Supply Chain | 2009 | |||||||
| R. Scott Toop |
56 | Executive Vice President and General Counsel | 2009 | |||||||
| Stephen A. Johnston |
53 | Senior Vice President, Real Estate | 2004 | |||||||
| Brigid V. Pelino |
47 | Senior Vice President, Human Resources | 2001 | |||||||
No arrangements or understandings exist pursuant to which any person has been, or is to be, selected or retained as an officer, except in the event of a change in control of the Company, as provided in the Company’s Change in Control Agreements described in the 2010 management proxy circular under Compensation Discussion and Analysis and under Executive and Director Compensation. The executive officers of the Company are appointed by the Board of Directors.
Paul D. House joined the Company as Vice-President of Marketing in 1985 and occupied various senior management positions leading to his appointment in January 1993 as Chief Operating Officer. He then became President and Chief Operating Officer in 1995, and Chief Executive Officer in November of 2005. Mr. House was named Chairman of the Board in February, 2007. He was a director on the Wendy’s Board from 1998 through February, 2007. Mr. House is a member of the Board of Directors of the Tim Horton Children’s Foundation and serves on the Board of Trustees of Brock University, as well as the Advisory Board for Brock University Business School. Mr. House joined Dairy Queen Canada in 1972 and held various management positions with that company, including to Vice-President of Canadian Operations, responsible for the business in Canada. Mr. House holds a B.A. in Economics from McMaster University. As of March 1, 2008, Mr. House became Executive Chairman of the Company’s Board of Directors.
Donald B. Schroeder joined the Company in 1991 as Vice President of Human Resources and International Development. He was named Executive Vice President of Administration in 1995, responsible for Human Resources, Administration, Manufacturing, and Distribution. Upon the separation of the Company from Wendy’s, Mr. Schroeder also assumed the role of General Counsel, Secretary, and Chief Compliance Officer. Mr. Schroeder was the President of the Tim Horton Children’s Foundation from 1991 to 2008. Mr. Schroeder holds a Bachelor of Laws degree from the University of Western Ontario and a Master of Laws degree from Osgoode Hall Law School. On February 19, 2008, Mr. Schroeder was appointed to the Board of Directors of the Company, and as of March 1, 2008, Mr. Schroeder became the President and Chief Executive Officer of the Company.
176
Table of Contents
Cynthia J. Devine joined the Company in 2003 as Senior Vice President of Finance and Chief Financial Officer, responsible for overseeing accounting, financial reporting, investor relations, financial planning and analysis, treasury, internal audit, and tax and information systems for the Company. She was promoted to Executive Vice President of Finance and Chief Financial Officer in April 2005. As of May 1, 2008, Ms. Devine was appointed as Chief Financial Officer and assumed additional accountability for the Company’s manufacturing operations and vertical integration strategy. These manufacturing operations include Maidstone Coffee, Fruitition, Fruits and Fills, a fondant and fills facility, and the coffee plant in Hamilton, Ontario. Prior to joining the Company, Ms. Devine served as Senior Vice President, Finance for Maple Leaf Foods, a large Canadian food processing company, and from 1999 to 2001, held the position of Chief Financial Officer for Pepsi-Cola® Canada. Ms. Devine, a Canadian Chartered Accountant, holds an Honours Business Administration degree from the University of Western Ontario. Ms. Devine is a member of the Board of Directors of ING Direct Canada.
David F. Clanachan joined the Company in 1992 and held various positions in the Operations Department until he was promoted to the position of Vice President, Operations—Western Ontario in 1997. Prior to that time, he was a Director of Operations for an international food company, with approximately 12 years of experience in the industry. In August 2001, he was promoted to the position of Executive Vice President of Training, Operations Standards and Research & Development. As of May 1, 2008, Mr. Clanachan was appointed as Chief Operations Officer, United States and International. Mr. Clanachan directly oversees operations, restaurant development and growth strategy for the U.S. segment, as well as the international operations and growth strategy. Mr. Clanachan holds a Bachelor of Commerce degree from the University of Windsor. Mr. Clanachan serves on the School of Hospitality and Tourism, Management Policy Advisory Board for the University of Guelph and as a director of the Canadian Hospitality Foundation.
William A. Moir joined the Company in 1990 as Vice President of Marketing, and was promoted to Executive Vice President of Marketing in 1997. As of May 1, 2008, Mr. Moir was appointed as Chief Brand and Marketing Officer, and as the President of the Tim Horton Children’s Foundation and assumed responsibility for research and development, aligning product research and innovation programs with the Company’s brand and marketing activities. Prior to joining the Company, Mr. Moir gained extensive marketing management experience, holding key positions with K-Tel, Shell Oil and Labatt Breweries. He is a director and past Chairman of the Coffee Association of Canada, a director of The Trillium Health Centre Foundation, a director of the Baycrest Foundation, as well as the President of and a member of the Board of Directors of the Tim Horton Children’s Foundation. Mr. Moir holds an Honours Business degree from the University of Manitoba.
Roland M. Walton joined the Company in 1997 as Executive Vice President of Operations, responsible for operations in both Canada and the U.S. As of May 1, 2008, Mr. Walton was appointed as Chief Operations Officer, Canada. Mr. Walton directly oversees operations, restaurant development and growth strategy for the Canadian segment and also assumed responsibility for operations standards and training for the Tim Hortons brand. His restaurant industry experience includes Wendy’s Canada, Pizza Hut® Canada and Pizza Hut USA. In 1995, Mr. Walton held the position of Division Vice President for Pizza Hut USA’s Central Division. Mr. Walton holds a Bachelor of Commerce degree from the University of Guelph.
John M. Hemeon joined the Company in 2009 as Executive Vice President, Supply Chain, responsible for our supply chain infrastructure and operations, including distribution, transportation, and packaging and purchasing. Prior to joining the Company, Mr. Hemeon held positions of progressive accountability with Sysco Food Services (including its predecessor companies) beginning in April 1984, including the position of Vice President, Business Review and Development of Sysco Toronto from July 2004 to January 2005, Senior Vice President of Sysco Food Services of Edmonton from January 2005 to July 2006, and Executive Vice President of Sysco Food Services of Edmonton from July 2006 to until April 2009. Mr. Hemeon holds an executive Master of Business Administration degree from the University of Guelph, Hospitality and Tourism Program.
177
Table of Contents
R. Scott Toop joined the Company in 2009 as Executive Vice President and General Counsel, as head of our legal affairs and responsible for developing, with Mr. Clanachan, the Company’s international growth strategy. Mr. Toop served as the Vice President and Associate General Counsel of Yum! Brands, Inc. from December 2005 until he joined the Company in August 2009, and as Vice President and General Counsel of Kentucky Fried Chicken from 1997 until November 2005. Prior to 1997, Mr. Toop held various senior-level legal positions at PepsiCo, Inc. of increasing accountability and practiced corporate law as an associate at Donovan Leisure Newton & Irvine. Mr. Toop holds a Juris Doctor degree and Master of Business Administration degree, both from Duke University, as well as a Bachelor of Arts degree from Hamilton College.
Stephen A. Johnston joined the Company in 1995 as Corporate Counsel for Atlantic Canada. In early 1998, Mr. Johnston assumed additional accountability for Area Training, and was subsequently promoted to Director, Atlantic Canada Operations in November 1998. In 2004, he assumed the position of Regional Vice President, Atlantic Operations. In 2006, he was appointed as Senior Vice President, Development. Mr. Johnston was admitted to the Nova Scotia Barristers Society in 1986, and he holds a Bachelor of Law degree from the University of New Brunswick and a Bachelor of Commerce degree from Mount Allison University.
Brigid V. Pelino joined the Company in 2001 as Vice President, Human Resources, with responsibility for all aspects of Human Resource strategy for both Canada and the United States. She has been the Senior Vice President, Human Resources since May 2008. Prior to joining the Company, Ms. Pelino worked in increasingly senior level Human Resource positions for Canadian Tire Corporation®, Honeywell International® and General Electric®. Ms. Pelino holds an Honours Bachelors degree in Economics and Accounting and a Masters degree in Industrial Relations, both from the University of Toronto.
Other
All references to our website below do not constitute incorporation by reference of the information contained on the website and should not be considered part of this document.
Certain Corporate Governance Documentation & Practices; Website Disclosure pursuant to NYSE Listed Company Manual
The Board of Directors has adopted and approved Principles of Governance, Governance Guidelines, Standards of Business Practices (Code of Ethics), Code of Business Conduct (applicable to directors) and written charters for its Nominating and Corporate Governance, Audit, and Human Resource and Compensation Committees. In addition, the Audit Committee has adopted a written Audit Committee Pre-Approval Policy with respect to audit and non-audit services to be performed by the Company’s independent auditor (or for purposes of U.S. securities laws, independent registered public accounting firm). All of the foregoing documents are available on the Company’s investor website at www.timhortons-invest.com. A copy of the foregoing will be made available (without charge) to any shareholder upon request by contacting the Secretary of the Company at 874 Sinclair Road, Oakville, Ontario, L6K 2Y1.
Section 303A.11 of the NYSE Listed Company Manual
As a result of the public company reorganization that occurred in September 2009, the Company is a Canadian reporting issuer and qualifies as a foreign private issuer for the purposes of the Exchange Act. Its common shares are listed on the NYSE and the TSX. As a result, the Company is subject to, and complies with, a number of legislative and regulatory corporate governance requirements, policies and guidelines, including those of the TSX, the Canadian Securities Administrators, the NYSE and the SEC, as applicable. In recent years, these legislative and regulatory bodies have proposed and, in many cases, implemented a number of new or modified rules, regulations and policies in the area of corporate governance. These include the corporate governance listing standards of the NYSE, the Sarbanes-Oxley Act of 2002, and the replacement of the TSX guidelines with the guidelines contained in National Policy 58-201 Corporate Governance Guidelines and Multilateral Instrument 52-110 Audit Committees.
178
Table of Contents
The Company has committed to comply with the governance requirements of the NYSE applicable to a U.S. domestic issuer, consistent with its prior practice before the reorganization. Pursuant to Section 303A.11 of the NYSE Listed Company Manual, listed foreign private issuers, such as the Company, must disclose significant differences between their corporate governance practices and those required to be followed by U.S. issuers under the NYSE listing standards. The Company’s corporate governance practices comply with the NYSE requirements applicable to U.S. domestic issuers and are in compliance with applicable rules adopted by the SEC to give effect to the provisions of the Sarbanes-Oxley Act of 2002. The Company also complies with applicable Canadian corporate governance requirements.
Website Disclosure for Item 5.05 of Form 8-K Disclosures
The Company intends to satisfy the disclosure requirement under Item 5.05 of Form 8-K regarding any amendment to, or waiver from, any applicable provision (related to elements listed under Item 406(b) of Regulation S-K) of the Standards of Business Practices (Code of Ethics) that applies to the Company’s principal executive officer, principal financial officer, principal accounting officer or controller, or persons performing similar functions, by posting such information on the Company’s corporate and investor website at www.timhortons-invest.com. The Company will provide a copy of the Standards of Business Practices to any person, without charge, who requests a copy in writing to the Secretary of the Company at 874 Sinclair Road, Oakville, Ontario, L6K 2Y1.
| Item 11. | Executive Compensation |
As a foreign private issuer in the United States, we are deemed to comply with this Item if we provide information required by Items 6.B and 6.E.2 of Form 20-F, with more detailed information provided if otherwise made publicly available or required to be disclosed in Canada. We will be providing information required by Items 6.B and 6.E.2 of Form 20-F in our management proxy circular for our annual meeting to our shareholders and filing it with the Canadian System for Electronic Document Analysis and Retrieval (“SEDAR”), the Canadian equivalent of the SEC’s Next-Generation EDGAR system, at www.sedar.com. In addition, we will be furnishing our management proxy circular to the SEC on Form 8-K. Our executive compensation disclosure will be in compliance with Canadian requirements, which are, in most respects, substantially similar to the U.S. rules. Although we are not required to disclose executive compensation according to the requirements of Regulation S-K that apply to U.S. domestic issuers, we generally attempt to comply with the spirit of those rules when possible and to the extent that they do not conflict with required Canadian disclosure. Information relating to executive compensation will be contained in the Company’s Form 10-K/A, which will be filed no later than 120 days after January 2, 2011.
| Item 12. | Security Ownership of Certain Beneficial Owners and Management and Related Stockholder Matters |
The information required by this Item will be contained in the Company’s Form 10-K/A, which will be filed no later than 120 days after January 2, 2011. This information will also be contained in the management proxy circular that we prepare in accordance with Canadian corporate and securities law requirements.
| Item 13. | Certain Relationships and Related Transactions, and Director Independence |
The information required by this Item will be contained in the Company’s Form 10-K/A, which will be filed no later than 120 days after January 2, 2011. This information will also be contained in the management proxy circular that we prepare in accordance with Canadian corporate and securities law requirements.
179
Table of Contents
| Item 14. | Principal Accounting Fees and Services |
The information required by this Item will be contained in the Company’s Form 10-K/A, which will be filed no later than 120 days after January 2, 2011. This information will also be contained in the management proxy circular that we prepare in accordance with Canadian corporate and securities law requirements.
180
Table of Contents
PART IV
| Item 15. | Exhibits and Financial Statement Schedules |
| (a) (1) | and (2)—The following Consolidated Financial Statements of Tim Hortons Inc. and Subsidiaries, included in Item 8 herein. |
Report of Independent Registered Public Accounting Firm.
Consolidated Statement of Operations—Years ended January 2, 2011, January 3, 2010, and December 28, 2008.
Consolidated Balance Sheet—January 2, 2011 and January 3, 2010.
Consolidated Statement of Cash Flows—Years ended January 2, 2011, January 3, 2010, and December 28, 2008.
Consolidated Statement of Stockholders’ Equity—Years ended January 2, 2011, January 3, 2010, and December 28, 2008.
Consolidated Statement of Comprehensive Income—Years ended January 2, 2011, January 3, 2010, and December 28, 2008.
Notes to the Consolidated Financial Statements.
| (3) | Listing of Exhibits—See Index to Exhibits. |
The management contracts or compensatory plans or arrangements required to be filed as exhibits to this report are denoted in the Index to Exhibits beginning on page 183.
| (b) | Exhibits filed with this report are listed in the Index to Exhibits beginning on page 183. |
| (c) | The following Consolidated Financial Statement Schedule of Tim Hortons Inc. and Subsidiaries is included in Item 15(c): II—Valuation and Qualifying Accounts. |
All other schedules for which provision is made in the applicable accounting regulations of the SEC are not required under the related instructions, are inapplicable, or the information has been disclosed elsewhere.
181
Table of Contents
Pursuant to the requirements of Section 13 or 15(d) of the Securities Exchange Act of 1934, the Registrant has duly caused this report to be signed on its behalf by the undersigned, thereunto duly authorized.
| TIM HORTONS INC. |
||||
| By: | /s/ DONALD B. SCHROEDER |
2/25/11 | ||
| Donald B. Schroeder President and Chief Executive Officer |
||||
Pursuant to the requirements of the Securities Exchange Act of 1934, this report has been signed below by the following persons on behalf of the Registrant and in the capacities and on the dates indicated.
| /S/ DONALD B. SCHROEDER |
2/25/11 |
/s/ CYNTHIA J. DEVINE |
2/25/11 | |||
| Donald B. Schroeder President and Chief Executive Officer and Director |
Cynthia J. Devine Chief Financial Officer and Principal Accounting Officer |
|||||
| /s/ PAUL D. HOUSE* |
2/25/11 | |||||
| Paul D. House, Director and Executive Chairman of the Board | ||||||
| /S/ M. SHAN ATKINS* |
2/25/11 |
/s/ MICHAEL J. ENDRES* |
2/25/11 | |||
| M. Shan Atkins, Director | Michael J. Endres, Director | |||||
| /S/ MOYA M. GREENE* |
2/25/11 |
/s/ FRANK IACOBUCCI* |
2/25/11 | |||
| Moya M. Greene, Director | Frank Iacobucci, Lead Director | |||||
| /S/ JOHN A. LEDERER* |
2/25/11 |
/s/ DAVID H. LEES* |
2/25/11 | |||
| John A. Lederer, Director | David H. Lees, Director | |||||
| /S/ RONALD W. OSBORNE* |
2/25/11 |
/s/ WAYNE C. SALES* |
2/25/11 | |||
| Ronald W. Osborne, Director | Wayne C. Sales, Director | |||||
| /S/ CATHERINE L. WILLIAMS* |
2/25/11 |
|||||
| Catherine L. Williams, Director | ||||||
| *By: | /s/ DONALD B. SCHROEDER |
2/25/11 | ||||||
| Donald B. Schroeder Attorney-in-Fact |
||||||||
182
Table of Contents
TIM HORTONS INC. AND SUBSIDIARIES
INDEX TO EXHIBITS
| Exhibit |
Description |
Where found | ||
| 2(a) | Agreement and Plan of Merger, dated August 6, 2009, by and among the Registrant, THI Mergeco Inc., and Tim Hortons Inc. | Incorporated herein by reference to Annex A of the definitive proxy statement of Tim Hortons Inc. filed with the Commission on August 17, 2009. | ||
| 3(a) | Articles of Incorporation of the Registrant, as amended | Incorporated herein by reference to Exhibit 3.1 to the Current Report on Form 8-K of Tim Hortons Inc. filed with the Commission on September 28, 2009. | ||
| 3(b) | By-Law No. 1 of the Registrant | Incorporated herein by reference to Annex C of the definitive proxy statement of Tim Hortons Inc. filed with the Commission on August 17, 2009. | ||
| 4(a) | Shareholder Rights Plan Agreement, dated August 6, 2009, between the Registrant and Computershare Trust Company of Canada, as Rights Agent | Incorporated herein by reference to Annex D of the definitive proxy statement of Tim Hortons Inc. filed with the Commission on August 17, 2009. | ||
| 4(b) | Trust Indenture, dated June 1, 2010, by and between the Registrant and BNY Trust Company of Canada, as trustee | Incorporated herein by reference to Exhibit 4.1 to the Current Report on Form 8-K of the Registrant filed with the Commission on June 1, 2010. | ||
| 4(c) | First Supplemental Trust Indenture, dated June 1, 2010, by and between the Registrant and BNY Trust Company of Canada, as trustee | Incorporated herein by reference to Exhibit 4.2 to the Current Report on Form 8-K of the Registrant filed with the Commission on June 1, 2010. | ||
| 4(d) | First (Reopening) Supplemental Trust Indenture, dated December 1, 2010, by and between the Registrant and BNY Trust Company of Canada, as trustee | Incorporated herein by reference to Exhibit 4.1 to the Current Report on Form 8-K of the Registrant filed with the Commission on December 1, 2010. | ||
| 4(e) | Supplement to Guarantee, dated December 1, 2010, from The TDL Group Corp. | Incorporated herein by reference to Exhibit 4.2 to the Current Report on Form 8-K of the Registrant filed with the Commission on December 1, 2010. | ||
| 10(a) | Amended and Restated Credit Agreement, dated as of September 28, 2009, among the Registrant, The TDL Group Corp., Tim Hortons USA Inc. and certain lenders and agents named therein | Incorporated by reference to Exhibit 10.1 to the Current Report on Form 8-K of the Registrant filed with the Commission on September 28, 2009. | ||
| 10(b) | Senior Revolving Credit Facility Agreement, dated as of December 13, 2010, among the Registrant and The TDL Group Corp., as borrowers, and certain lenders and agents named therein | Incorporated herein by reference to Exhibit 10.1 to the Current Report on Form 8-K of the Registrant filed with the Commission on December 16, 2010. | ||
| *10(c) | Form of Indemnification Agreement for directors, officers and others, as applicable | Incorporated herein by reference to Exhibit 10.2 to the Current Report on Form 8-K of the Registrant filed with the Commission on September 28, 2009. | ||
183
Table of Contents
| Exhibit |
Description |
Where found | ||
| *10(d) | Form of Employment Agreement by and among The TDL Group Corp., the Registrant and Paul D. House | Incorporated herein by reference to Exhibit 10.3 to the Current Report on Form 8-K of the Registrant filed with the Commission on September 28, 2009. | ||
| *10(e) | Form of Employment Agreement by and among The TDL Group Corp, the Registrant and Donald B. Schroeder | Incorporated herein by reference to Exhibit 10.4 to the Current Report on Form 8-K of the Registrant filed with the Commission on September 28, 2009. | ||
| *10(f) | Form of Employment Agreement by and among The TDL Group Corp., the Registrant and each of Cynthia J. Devine, William A. Moir and Roland M. Walton, respectively | Incorporated herein by reference to Exhibit 10.5 to the Current Report on Form 8-K of the Registrant filed with the Commission on September 28, 2009. | ||
| *10(g) | Form of Employment Agreement by and among The TDL Group Corp., the Registrant and David F. Clanachan | Incorporated herein by reference to Exhibit 10.6 to the Current Report on Form 8-K of the Registrant filed with the Commission on September 28, 2009. | ||
| *10(h) | Form of First Amendment to Employment Agreement by and among The TDL Group Corp., the Registrant and each of Paul D. House and Donald B. Schroeder | Incorporated herein by reference to Exhibit 10(z) to Amendment No. 1 to the Annual Report on Form 10-K for the fiscal year ended January 3, 2010 filed with the Commission on April 1, 2010. | ||
| *10(i) | Form of First Amendment to Employment Agreement by and among The TDL Group Corp., the Registrant and each of Cynthia J. Devine, William A. Moir, Roland M. Walton and David F. Clanachan, dated effective February 24, 2010 | Incorporated herein by reference to Exhibit 10(g) to the Annual Report on Form 10-K of the Registrant filed with the Commission on March 4, 2010. | ||
| *10(j) | 2006 Stock Incentive Plan, as amended effective February 24, 2010 | Incorporated herein by reference to Exhibit 10(h) to the Annual Report on Form 10-K of the Registrant filed with the Commission on March 4, 2010. | ||
| *10(k) | Executive Annual Performance Plan, as amended effective February 24, 2010 | Incorporated herein by reference to Exhibit 10(i) to the Annual Report on Form 10-K of the Registrant filed with the Commission on March 4, 2010. | ||
| *10(l) | Amended and Restated Personal Supplemental Executive Retirement Savings Plan, as amended effective October 29, 2010 | Filed herewith. | ||
| *10(m) | Amended and Restated Non-Employee Director Deferred Stock Unit Plan effective September 28, 2009 | Incorporated herein by reference to Exhibit 10.10 to the Current Report on Form 8-K of the Registrant filed with the Commission on September 28, 2009. | ||
| *10(n) | Equity Plan Assignment and Assumption Agreement, dated September 25, 2009, by and between Tim Hortons Inc., and the Registrant | Incorporated herein by reference to Exhibit 10.11 to the Current Report on Form 8-K of the Registrant filed with the Commission on September 28, 2009. | ||
184
Table of Contents
| Exhibit |
Description |
Where found | ||
| *10(o) | Assignment, Assumption and Amendment of Tim Hortons Inc. U.S. Non-Employee Directors’ Deferred Compensation Plan, dated September 25, 2009, by and between Tim Hortons Inc. and Tim Hortons USA Inc. | Incorporated herein by reference to Exhibit 10.12 to the Current Report on Form 8-K of the Registrant filed with the Commission on September 28, 2009. | ||
| *10(p) | Form of Amended and Restated Deferred Stock Unit Award Agreement (Canadian) | Incorporated herein by reference to Exhibit 10.13 to the Current Report on Form 8-K of the Registrant filed with the Commission on September 28, 2009. | ||
| *10(q) | Form of Amended and Restated Deferred Stock Unit Award Agreement (U.S.) | Incorporated herein by reference to Exhibit 10.14 to the Current Report on Form 8-K of the Registrant filed with the Commission on September 28, 2009. | ||
| *10(r) | Form of Nonqualified Stock Option Award Agreement (2009 Award) | Incorporated herein by reference to Exhibit 10(a) to Form 10-Q for the quarter ended June 28, 2009 filed with the Commission on August 6, 2009. | ||
| *10(s) | Form of Restricted Stock Unit Award Agreement (2009 Award) | Incorporated herein by reference to Exhibit 10(b) to Form 10-Q for the quarter ended June 28, 2009 filed with the Commission on August 6, 2009. | ||
| 10(t) | Form of Tax Sharing Agreement between Tim Hortons Inc. and Wendy’s International, Inc. dated March 29, 2006 | Incorporated herein by reference to Exhibit 10.3 to Form S-1/A, File No. 333-130035 filed with the Commission on February 27, 2006. | ||
| 10(u) | Amendment No. 1 to Tax Sharing Agreement between Tim Hortons Inc. and Wendy’s International, Inc., dated November 7, 2007 | Incorporated herein by reference to Exhibit 10(b) to Form 10-Q for the quarter ended September 30, 2007 filed with the Commission on November 8, 2007. | ||
| *10(v) | Form of Restricted Stock Unit Award Agreement (2010 Award) | Incorporated herein by reference to Exhibit 10(a) to Form 10-Q for the quarter ended July 4, 2010 of the Registrant filed with the Commission on August 12, 2010. | ||
| *10(w) | Form of Nonqualified Stock Option Award Agreement (2010 Award) | Incorporated herein by reference to Exhibit 10(b) to Form 10-Q for the quarter ended July 4, 2010 of the Registrant filed with the Commission on August 12, 2010. | ||
| *10(x) | Form of Restricted Stock Unit Award Agreement (2010 Performance Award—Named Executive Officers) | Incorporated herein by reference to Exhibit 10(aa) to Amendment No. 1 to the Annual Report on Form 10-K for the fiscal year ended January 3, 2010 filed with the Commission on April 1, 2010. | ||
| 10(y) | Acknowledgment, dated as of October 29, 2010, by and among CillRyan’s Bakery Limited, Prophy and Fosters Star Limited | Filed herewith. | ||
| 21 | Subsidiaries of the Registrant | Filed herewith. | ||
| 23 | Consent of PricewaterhouseCoopers LLP | Filed herewith. | ||
| 24 | Powers of Attorney | Filed herewith. | ||
185
Table of Contents
| Exhibit |
Description |
Where found | ||
| 31(a) | Rule 13a-14(a)/15d-14(a) Certification of Chief Executive Officer | Filed herewith. | ||
| 31(b) | Rule 13a-14(a)/15d-14(a) Certification of Chief Financial Officer | Filed herewith. | ||
| 32(a) | Section 1350 Certification of Chief Executive Officer | Filed herewith. | ||
| 32(b) | Section 1350 Certification of Chief Financial Officer | Filed herewith. | ||
| 99 | Safe Harbor under the Private Securities Litigation Reform Act 1995 and Canadian securities laws | Filed herewith. | ||
| * | Denotes management contract or compensatory arrangement. |
186