Attached files
| file | filename |
|---|---|
| EX-31.1 - EX-31.1 - GENERAL NUTRITION CENTERS, INC. | a2202267zex-31_1.htm |
| EX-32.1 - EX-32.1 - GENERAL NUTRITION CENTERS, INC. | a2202267zex-32_1.htm |
| EX-12.1 - EX-12.1 - GENERAL NUTRITION CENTERS, INC. | a2202267zex-12_1.htm |
| EX-21.1 - EX-21.1 - GENERAL NUTRITION CENTERS, INC. | a2202267zex-21_1.htm |
| EX-31.2 - EX-31.2 - GENERAL NUTRITION CENTERS, INC. | a2202267zex-31_2.htm |
| EX-10.32 - EX-10.32 - GENERAL NUTRITION CENTERS, INC. | a2202267zex-10_32.htm |
Use these links to rapidly review the document
TABLE OF CONTENTS
TABLE OF CONTENTS
UNITED STATES
SECURITIES AND EXCHANGE COMMISSION
Washington, D.C. 20549
FORM 10-K
| (Mark One) | ||
ý |
ANNUAL REPORT PURSUANT TO SECTION 13 OR 15(d) OF THE SECURITIES EXCHANGE ACT OF 1934 |
|
For the fiscal year ended December 31, 2010 |
||
OR |
||
o |
TRANSITION REPORT PURSUANT TO SECTION 13 OR 15(d) OF THE SECURITIES EXCHANGE ACT OF 1934 |
|
For the transition period from to |
||
Commission file number: 333-114396
General Nutrition Centers, Inc.
(Exact name of registrant as specified in its charter)
| DELAWARE (state or other jurisdiction of Incorporation or organization) |
72-1575168 (I.R.S. Employer Identification No.) |
|
300 Sixth Avenue Pittsburgh, Pennsylvania (Address of principal executive offices) |
15222 (Zip Code) |
Registrant's telephone number, including area code: (412) 288-4600
Securities registered pursuant to section 12(b) of the Act: None
Securities registered pursuant to section 12(g) of the Act: None
Indicate by check mark if the registrant is a well-known seasoned issuer, as defined in Rule 405 of the Securities Act. Yes o No ý
Indicate by check mark if the registrant is not required to file reports pursuant to Section 13 or 15(d) of the Act. Yes ý No o
Indicate by check mark whether the registrant (1) has filed all reports required to be filed by Section 13 or 15(d) of the Securities Exchange Act of 1934 during the preceding 12 months (or for such shorter period that the registrant was required to file such reports), and (2) has been subject to such filing requirements for the past 90 days. Yes o No ý
Indicate by check mark whether the registrant has submitted electronically and posted on its corporate Web site, if any, every Interactive Data File required to be submitted and posted pursuant to Rule 405 of Regulation S-T (§232.405 of this chapter) during the preceding 12 months (or for such shorter period that the registrant was required to submit and post such files). Yes o No o
Indicate by check mark if disclosure of delinquent filers pursuant to Item 405 of Regulation S-K (229.405 of this chapter) is not contained herein, and will not be contained, to the best of registrant's knowledge, in definitive proxy or information statements incorporated by reference in Part III of this Form 10-K or any amendment to this Form 10-K. ý
Indicate by check mark whether the registrant is a large accelerated filer, an accelerated filer, or a non-accelerated filer. See definition of "accelerated filer and large accelerated filer" in Rule 12b-2 of the Exchange Act. (Check one):
| Large accelerated filer o | Accelerated filer o | Non-accelerated filer ý (Do not check if a smaller reporting company) |
Smaller reporting company o |
Indicate by check mark whether the registrant is a shell company (as defined in Rule 12b-2 of the Act). Yes o No ý
As of February 25, 2011, all of the registrant's common equity was privately held, and there was no public market for the registrant's common equity nor any publicly available quotations for the registrant's common equity. As a result, the registrant is unable to calculate the aggregate market value of the registrant's common stock held by non-affiliates as of February 25, 2011. As of February 25, 2011, 100 shares of the registrant's common stock, par value $0.01 per share (the "Common Stock"), were outstanding. All shares of the registrant's Common Stock are held by GNC Corporation.
2
This Annual Report on Form 10-K contains forward-looking statements within the meaning of the Private Securities Litigation Reform Act of 1995 with respect to our financial condition, results of operations and business. Forward-looking statements include statements that may relate to our plans, objectives, goals, strategies, future events, future revenues or performance, capital expenditures, financing needs and other information that is not historical information. Discussions containing such forward-looking statements may be found in Items 1, 2, 3, 7 and 7A hereof, as well as within this report generally. Forward-looking statements can often be identified by the use of terminology such as "subject to," "believe," "anticipate," "plan," "expect," "intend," "estimate," "project," "may," "will," "should," "would," "could," "can," the negatives thereof, variations thereon and similar expressions, or by discussions of strategy.
All forward-looking statements, including, without limitation, our examination of historical operating trends, are based upon our current expectations and various assumptions. We believe there is a reasonable basis for our expectations and beliefs, but they are inherently uncertain. We may not realize our expectations and our beliefs may not prove correct. Actual results could differ materially from those described or implied by such forward-looking statements. The following uncertainties and factors, among others (including those set forth under "Risk Factors"), could affect future performance and cause actual results to differ materially from those matters expressed in or implied by forward-looking statements:
- •
- significant competition in our industry;
- •
- unfavorable publicity or consumer perception of our products;
- •
- increases in the cost of borrowings and limitations on availability of additional debt or equity capital;
- •
- our debt levels and restrictions in our debt agreements;
- •
- the incurrence of material product liability and product recall costs;
- •
- loss or retirement of key members of management;
- •
- costs of compliance and our failure to comply with new and existing governmental regulations, including but not limited
to, tax regulations;
- •
- costs of litigation and the failure to successfully defend lawsuits and other claims against us;
- •
- the failure of our franchisees to conduct their operations profitably and limitations on our ability to terminate or
replace under-performing franchisees;
- •
- economic, political and other risks associated with our international operations;
- •
- our failure to keep pace with the demands of our customers for new products and services;
- •
- disruptions in our manufacturing system or losses of manufacturing certifications;
- •
- disruptions in our distribution network;
- •
- the lack of long-term experience with human consumption of ingredients in some of our products;
- •
- increases in the frequency and severity of insurance claims, particularly claims for which we are
self-insured;
- •
- the failure to adequately protect or enforce our intellectual property rights against competitors;
3
- •
- changes in raw material costs and pricing of our products;
- •
- failure to successfully execute our growth strategy, including any delays in our planned future growth, testing and
development of our new store formats, any inability to expand our franchise operations or attract new franchisees, or any inability to expand our company-owned retail operations;
- •
- changes in applicable laws relating to our franchise operations;
- •
- damage or interruption to our information systems;
- •
- the impact of current economic conditions on our business;
- •
- natural disasters, unusually adverse weather conditions, pandemic outbreaks, boycotts and geo-political
events; and
- •
- our failure to maintain effective internal controls.
Consequently, forward-looking statements should be regarded solely as our current plans, estimates and beliefs. You should not place undue reliance on forward-looking statements. We cannot guarantee future results, events, levels of activity, performance or achievements. We do not undertake and specifically decline any obligation to update, republish or revise forward-looking statements to reflect future events or circumstances or to reflect the occurrences of unanticipated events.
Throughout this report, we use market data and industry forecasts and projections that were obtained from surveys and studies conducted by third parties and from publicly available industry and general publications. Although we believe that the sources are reliable, we have not independently verified the information contained therein. We note that estimates, in particular as they relate to general expectations concerning our industry, involve risks and uncertainties and are subject to change based on various factors, including those discussed under the heading "Risk Factors" in this report.
GNC
Based on our worldwide network of more than 7,200 locations and our GNC.com website, we believe we are the leading global specialty retailer of health and wellness products, including vitamins, minerals, and herbal supplements ("VMHS") products, sports nutrition products, and diet products. Our diversified, multi-channel business model derives revenue from product sales through domestic company-owned retail stores, domestic and international franchise activities, third-party contract manufacturing, e-commerce and corporate partnerships. We believe that the strength of our GNC brand, which is distinctively associated with health and wellness, combined with our stores and website, give us broad access to consumers and uniquely position us to benefit from the favorable trends driving growth in the nutritional supplements industry and the broader health and wellness sector. Our broad and deep product mix, which is focused on high-margin, premium, value-added nutritional products, is sold under our GNC proprietary brands, including Mega Men®, Ultra Mega®, GNC WELLbeING®, Pro Performance®, Pro Performance® AMP and Longevity Factors™, and under nationally recognized third-party brands.
Based on the information we compiled from the public securities filings of our primary competitors, our network of domestic retail locations is approximately twelve times larger than the next largest U.S. specialty retailer of nutritional supplements and provides a leading platform for our vendors to distribute their products to their target consumer. Our close relationship with our vendor
4
partners has enabled us to negotiate first-to-market opportunities. In addition, our in-house product development capabilities enable us to offer our customers proprietary merchandise that can only be purchased through our locations or on our website. Since the nutritional supplement consumer often requires knowledgeable customer service, we also differentiate ourselves from mass and drug retailers with our well-trained sales associates who are aided by in-store technology. We believe that our expansive retail network, differentiated merchandise offering and quality customer service result in a unique shopping experience that is distinct from our competitors.
Our principal executive offices are located at 300 Sixth Avenue, Pittsburgh, Pennsylvania 15222, and our telephone number is (412) 288-4600. We also maintain a website at GNC.com. The contents of our website are not incorporated by reference in this report and shall not be deemed "filed" under the Exchange Act.
In this report, unless the context requires otherwise, references to "we," "us," "our," "Company" or "GNC" refer to General Nutrition Centers, Inc. and its subsidiaries.
Corporate History
We are a holding company and all of our operations are conducted through our operating subsidiaries.
On February 8, 2007, GNC Parent Corporation, our ultimate parent company at that time, entered into an Agreement and Plan of Merger (the "Merger Agreement") with GNC Acquisition Inc. and its parent company, GNC Acquisition Holdings Inc. ("Holdings" or our "Parent"). On March 16, 2007, the merger (the "Merger") was consummated. Pursuant to the Merger Agreement, as amended, GNC Acquisition Inc. was merged with and into GNC Parent Corporation, with GNC Parent Corporation as the surviving corporation. Subsequently on March 16, 2007, GNC Parent Corporation was converted into a Delaware limited liability company and renamed GNC Parent LLC.
As a result of the Merger, Holdings became the sole equity holder of GNC Parent LLC and the ultimate parent company of both GNC Corporation, our direct parent company ("GNC Corporation"), and us. The outstanding capital stock of Holdings is beneficially owned by Ares Corporate Opportunities Fund II L.P. ("Ares"), an affiliate of Ares Management LLC ("Ares Management"), Ontario Teachers' Pension Plan Board ("OTPP"), certain institutional investors, certain of our directors and certain former stockholders of GNC Parent Corporation, including members of our management. Refer to Note 1, "Nature of Business", and Item 12, "Security Ownership of Certain Beneficial Owners and Management and Related Stockholders Matters", to our consolidated financial statements included in this report for additional information.
Holdings and each of its stockholders is party to a stockholders agreement, which was amended and restated on February 12, 2008 (the "Amended and Restated Stockholders Agreement"). Among other things, the stockholders agreement contains certain restrictions on transfer of shares of Holdings' capital stock, and provides that each of Ares and OTPP has the right to designate four members of Holdings' board of directors (or, at the option of each, five members of the board of directors, one of which shall be independent) for so long as they or their respective affiliates each own a certain percentage of the outstanding common stock of Holdings. For additional information, see Item 13, "Certain Relationships and Related Transactions and Director Independence — Stockholders Agreement".
GNC Parent Corporation was formed as a Delaware corporation in November 2006 to acquire all the outstanding common stock of GNC Corporation.
We were formed in October 2003 and GNC Corporation was formed as a Delaware corporation in November 2003 by Apollo Management V, L.P. ("Apollo"), an affiliate of Apollo and members of our management to acquire General Nutrition Companies, Inc. from Numico USA, Inc.,
5
a wholly owned subsidiary of Koninklijke (Royal) Numico N.V. (collectively, "Numico"). In December 2003, we purchased all of the outstanding equity interests of General Nutrition Companies, Inc. In connection with a corporate reorganization, General Nutrition Companies, Inc. was merged with and into us in December 2008, with us surviving the merger.
General Nutrition Companies, Inc. was founded in 1935 by David Shakarian who opened its first health food store in Pittsburgh, Pennsylvania. Since that time, the number of stores has continued to grow, and General Nutrition Companies, Inc. began producing its own vitamin and mineral supplements as well as foods, beverages, and cosmetics. General Nutrition Companies, Inc. was acquired in August 1999 by Numico Investment Corp. and, prior to its acquisition, was a publicly traded company listed on the Nasdaq National Market.
Industry Overview
We operate within the large and growing U.S. nutritional supplements industry. According to Nutrition Business Journal's Supplement Business Report 2010, our industry generated $26.9 billion in sales in 2009 and an estimated $28.7 billion in 2010, and is projected to grow at an average annual rate of approximately 5.3% through 2015. Our industry is highly fragmented, and we believe this fragmentation provides large operators, like us, the ability to compete more effectively due to scale advantages. We generate a significant portion of our sales revenue from strong performing sports nutrition and VMHS products.
According to Nutrition Business Journal, sports nutrition products represented approximately 10.9% of the total U.S. nutritional supplements industry in 2009, and the category is expected to grow at a 7.2% CAGR from 2010 to 2015, representing the second-fastest growing product category in the nutritional supplements industry. By way of comparison, sports nutrition products, grouped in a manner consistent with Nutrition Business Journal's data, generated approximately 43% of our company-owned retail sales for 2010.
According to Nutrition Business Journal, VMHS products represented approximately 60.8% of the total U.S. nutritional supplement industry in 2009, and the category is expected to grow at a 5.3% CAGR from 2010 to 2015. By way of comparison, VMHS products, grouped in a manner consistent with Nutrition Business Journal's data, generated approximately 40% of our company-owned retail sales for 2010.
We expect several key demographic, healthcare, and lifestyle trends to drive the continued growth of our industry. These trends include:
- •
- Increasing awareness of nutritional supplements across major age and lifestyle segments of the U.S.
population. We believe that, primarily as a result of increased media coverage, awareness of the benefits of nutritional supplements is
growing among active, younger populations, providing the foundation for our future customer base. Based on our Gold Card Program data, customers age 19 to 29 years old represented approximately
26% of our sales in 2010, which is an increase of 8% from 2006. In addition, the average age of the U.S. population is increasing and data from the United States Census Bureau indicates that the
number of Americans age 65 or older is expected to increase by approximately 52% from 2000 to 2015. We believe that these consumers are likely to increasingly use nutritional supplements, particularly
VMHS products, and generally have higher levels of disposable income to pursue healthier lifestyles.
- •
- Increased focus on fitness and healthy living. We believe that consumers are trying to lead more active lifestyles and becoming increasingly focused on healthy living, nutrition and supplementation. According to the Nutrition Business Journal's Supplement Business Report 2010, 18% of the United States adult population were regular or heavy users of vitamins in
6
2009, up from 15% in 2008. We believe that growth in our industry will continue to be driven by consumers who increasingly embrace health and wellness as an important part of their lifestyles.
Participants in our industry include specialty retailers, supermarkets, drugstores, mass merchants, multi-level marketing organizations, online retailers, mail-order companies and a variety of other smaller participants. The nutritional supplements sold through these channels are divided into four major product categories: VMHS; sports nutrition products; diet products; and other wellness products. Most supermarkets, drugstores and mass merchants have narrow nutritional supplement product offerings limited primarily to simple vitamins and herbs, with less knowledgeable sales associates than specialty retailers. We believe that the market share of supermarkets, drugstores and mass merchants over the last five years has remained relatively constant.
Business Overview
The following charts illustrate the percentage of our net revenue generated by our three segments and the percentage of our net U.S. retail nutritional supplements revenue generated by our product categories for the year ended December 31, 2010:
Revenue by Segment
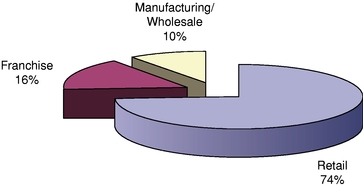
U.S. Retail Revenue by Product*
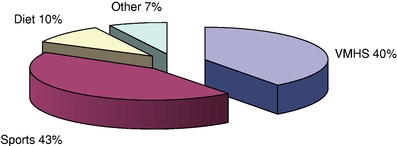
- *
- includes domestic retail and GNC.com
Throughout 2010, we did not have a material concentration of sales from any single product or product line.
7
Retail Locations
As of December 31, 2010, there were 7,260 GNC store locations globally, including:
- •
- 2,748 company-owned stores in the United States (all 50 states, the District of Columbia, and Puerto Rico);
- •
- 169 company-owned stores in Canada;
- •
- 903 domestic franchise stores;
- •
- 1,437 international franchise stores in 46 countries (includes distribution centers where retail sales are made); and
- •
- 2,003 GNC franchise "store-within-a-store" locations under our strategic alliance with Rite Aid Corporation ("Rite Aid").
Most of our company-owned and franchise U.S. stores are between 1,000 and 2,000 square feet and are primarily located in shopping malls and strip shopping centers. Based on the information we compiled from the public securities filings of our primary competitors, we have approximately twelve times the domestic store base of the next largest U.S. specialty retail competitor.
Website
In December 2005, we started selling products through our website, GNC.com, and re-launched the platform in September 2009, with the overall objective of increasing traffic, conversion rates and functionality. This additional sales channel has enabled us to market and sell our products in regions where we have limited or no retail operations. Some of the products offered on our website may not be available at our retail locations, enabling us to broaden the assortment of products available to our customers. The ability to purchase our products through the internet also offers a convenient method for repeat customers to evaluate and purchase new and existing products. Internet purchases are fulfilled and shipped directly from our distribution centers to our consumers using a third-party courier service. To date, we believe that most of the sales generated by our website are incremental to the revenues from our retail locations.
Franchise Activities
We generate income from franchise activities primarily through product sales to franchisees, royalties on franchise retail sales and franchise fees. To assist our franchisees in the successful operation of their stores and to protect our brand image, we offer a number of services to franchisees including training, site selection, construction assistance and accounting services. We believe that our franchise program enhances our brand awareness and market presence and will enable us to continue to expand our store base internationally with limited capital expenditures. Over the last several years, we realigned our domestic franchise system with our corporate strategies and re-acquired or closed unprofitable or non-compliant franchise stores in order to improve the financial performance of the franchise system.
Franchise Store-Within-a-Store Locations
To increase brand awareness and promote access to customers who may not frequent specialty nutrition stores, we entered into a strategic alliance in December 1998 with Rite Aid to open our GNC franchise store-within-a-store locations. Through this strategic alliance, we generate revenues from fees paid by Rite Aid for new store-within-a-store openings, sales to Rite Aid of our products at wholesale prices, the manufacturing of Rite Aid private label products and retail sales of certain consigned inventory. In 2007, we extended our alliance with Rite Aid through 2014 with a
8
five year option. At December 31, 2010, Rite Aid had opened 848 of an additional 1,125 stores that Rite Aid committed to open by December 31, 2014.
Marketing
We market our proprietary brands of nutritional products through an integrated marketing program that includes internet, print, and radio media, storefront graphics, direct mailings to members of our Gold Card loyalty program, and point of purchase promotional materials.
Manufacturing and Distribution
With our sophisticated manufacturing and distribution facilities supporting our retail stores, we are a vertically integrated producer and supplier of high-quality nutritional supplements. By controlling the production and distribution of our proprietary products, we can control product quality, monitor delivery times and maintain appropriate inventory levels. In addition, our broad, retail footprint provides a captive network for the introduction for new proprietary products. In 2010, we entered into an agreement with PetSmart in connection with the development, manufacture and distribution of nutritional supplements for pets. Our partnership with PetSmart will enable us to leverage our existing manufacturing and distribution capabilities and extend the GNC brand into the pet care market.
Products
We offer a wide range of high-quality nutritional supplements sold under our GNC proprietary brand names, including Mega Men®, Ultra Mega®, GNC WELLbeING®, Pro Performance®, Pro Performance® AMP, Longevity Factors™ and Preventive Nutrition®, and under nationally recognized third-party brand names. We report our sales in four major nutritional supplement categories: VMHS; sports nutrition; diet; and other wellness. In addition, our retail sales offer an extensive mix of brands, including over 1,800 SKUs across multiple categories and products. This variety is designed to provide our customers with a vast selection of products to fit their specific needs and to generate a high number of transactions with purchases from multiple product categories. Sales of our proprietary brands at our company-owned stores represented approximately 55%, 56%, and 51% of our net retail product revenues for the years ended 2010, 2009 and 2008, respectively. We have arrangements with our vendors to provide third-party products on an as needed basis. We are not dependent on any one vendor for a material amount of our third-party products.
Consumers may purchase a GNC Gold Card in any U.S. GNC store or at GNC.com for $15.00. A Gold Card allows a consumer to save 20% on all store and online purchases on the day the card is purchased and during the first seven days of every month for a year. Gold Card members also receive personalized mailings and e-mails with product news, nutritional information, and exclusive offers.
Products are delivered to our retail stores through our distribution centers located in Leetsdale, Pennsylvania; Anderson, South Carolina; and Phoenix, Arizona. Our distribution centers support our company-owned stores as well as franchise stores and Rite Aid locations. Our distribution fleet delivers our finished goods and third-party products through our distribution centers to our company-owned and domestic franchise stores on a weekly or biweekly basis depending on the sales volume of the store. Each of our distribution centers has a quality control department that monitors products received from our vendors to ensure they meet our quality standards.
9
Based on data collected from our point of sales systems, below is a comparison of our company-owned domestic retail product sales by major product category, and the percentages of our company-owned domestic retail product sales for the years shown:
| |
Year ended December 31, | |||||||||||||||||||
|---|---|---|---|---|---|---|---|---|---|---|---|---|---|---|---|---|---|---|---|---|
| |
2010
|
2009
|
2008
|
|||||||||||||||||
| |
(dollars in millions) |
|||||||||||||||||||
U.S Retail Product Categories: |
||||||||||||||||||||
VMHS Products |
$ | 496.1 | 39.9 | % | $ | 496.4 | 42.7 | % | $ | 465.2 | 41.3 | % | ||||||||
Sports Nutrition Products |
531.3 | 42.7 | % | 443.4 | 38.2 | % | 410.1 | 36.4 | % | |||||||||||
Diet Products |
122.3 | 9.8 | % | 128.0 | 11.0 | % | 148.2 | 13.2 | % | |||||||||||
Other Wellness Products |
93.5 | 7.6 | % | 94.3 | 8.1 | % | 102.0 | 9.1 | % | |||||||||||
Total U.S. Retail revenues |
$ | 1,243.2 | 100.0 | % | $ | 1,162.1 | 100.0 | % | $ | 1,125.5 | 100.0 | % | ||||||||
The data above represents the majority of the revenue reported for the domestic portion of our retail segment. The table above excludes additional revenue, primarily wholesale sales revenue to our military commissary locations, and certain revenue adjustments that are recorded to ensure conformity with U.S. GAAP, including deferral of our Gold Card revenue to match the twelve month discount period of the card, and a reserve for customer returns. These amounts were $6.5 million for 2010, $5.7 million for 2009, and $4.7 million for 2008. These items are recurring in nature, and we expect to record similar adjustments in the future.
VMHS
We sell vitamins and minerals in single vitamin and multi vitamin form and in different potency levels. Our vitamin and mineral products are available in liquid, tablets, soft gelatin, hard-shell capsules and powder forms, and are available in traditional bottle packaging form or in customized daily packet form ("Vitapak®"). Many of our special vitamin and mineral formulations, such as Mega Men®, Ultra Mega® and GNC WELLbeING® are available only at GNC locations and on GNC.com. In addition to our selection of VMHS products with unique formulations, we also offer the full range of standard "alphabet" vitamins. We sell herbal supplements in various solid dosage and soft gelatin capsules, tea, and liquid forms. We have consolidated our traditional herbal offerings under a single umbrella brand, Herbal Plus®. In addition to the Herbal Plus® line, we offer a full line of whole food-based supplements and top selling herb and natural remedy products.
We also offer a variety of specialty products in our GNC and Preventive Nutrition® product lines. These products emphasize third-party research and literature regarding the positive benefits from certain ingredients. These offerings include products designed to provide nutritional support to specific areas of the body, such as joints, the heart and blood vessels, and the digestive system. Overall, GNC-branded proprietary products constituted 81% of our VMHS sales in 2010.
Sports Nutrition Products
Sports nutrition products are designed to be taken in conjunction with an exercise and fitness regimen. We typically offer a broad selection of sports nutrition products, such as protein and weight gain powders, sports drinks, sports bars and high potency vitamin formulations, including GNC brands such as Pro Performance®, Pro Performance® AMP and popular third-party products. Our Pro Performance® branded products, which represented 36% of our sports nutrition product sales in 2010, are available only at GNC locations and on GNC.com.
10
Diet Products
Our wide variety of diet products consist of various formulas designed to supplement the diet and exercise plans of weight conscious consumers. We typically offer a variety of diet products, including pills, meal replacements, shakes, diet bars, energy tablets and cleansing products. Our retail stores offer our proprietary and third-party products suitable for different diet and weight management approaches, and products designed to increase thermogenesis (a change in the body's metabolic rate measured in terms of calories) and metabolism.
The diet category is cyclical with new products generating short-term sales growth before generally declining over time, making sales trends within this category less predictable than in our other product categories. We derive the majority of our diet sales from third-party products. Our GNC proprietary line, Total Lean™, is more focused on meal replacement and represents a more stable line of business. Over time, we have reduced our exposure to the diet category. In 2010, company-owned retail sales from diet products accounted for 10% of sales, down significantly from 27% of sales in 2001.
Other Wellness Products
Other wellness products represent a comprehensive category that consists of sales of our Gold Card preferred membership and sales of other nonsupplement products, including cosmetics, food items, health management products, books and DVDs.
Product Development
We strongly believe that introduction of innovative, high quality, clinically proven, superior performing products is a key driver of our business. Customers widely credit us as being a leader in offering premium health products and rate the availability of a wide variety of products as one of our biggest strengths. We identify shifting consumer trends through market research and through interactions with our customers and leading industry vendors to assist in the development, manufacturing and marketing of our new products. Our dedicated innovation team independently drives the development of proprietary products by collaborating with vendors to provide raw materials, clinical and product development support for proprietary GNC-branded products. We also work with our vendors to ensure a steady flow of third-party products with preferred distribution rights are made available to us for a limited period of time. During 2010 and 2009, we targeted our product development efforts on specialty vitamins, women's nutrition, sports nutrition and condition specific products, resulting in the introduction of the GNC WELLbeING®, Pro Performance® AMP and Longevity Factors™ lines.
Research and Development
We have an internal research and development group that performs scientific research on potential new products and enhancements to existing products, in part to assist our product development team in creating new products, and in part to support claims that may be made as to the purpose and function of the product. See Note 2, "Basis of Presentation and Summary of Significant Accounting Policies," to our consolidated financial statements included in this report.
Segments
We generate revenues from our three segments, Retail, Franchise, and Manufacturing/Wholesale. The following chart outlines our segments and the historical contribution to our consolidated revenues by those segments, after intercompany eliminations. For a description of operating income (loss) by segment, our total assets by segment, total revenues by geographic
11
area, and total assets by geographic area, see Note 19, "Segments", to our consolidated financial statements included in this report.
| |
Year ended December 31, | ||||||||||||||||||
|---|---|---|---|---|---|---|---|---|---|---|---|---|---|---|---|---|---|---|---|
| |
2010
|
2009
|
2008
|
||||||||||||||||
| |
(dollars in millions) |
||||||||||||||||||
Retail |
$ | 1,344.4 | 73.8 | % | $ | 1,256.3 | 73.6 | % | $ | 1,219.3 | 73.6 | % | |||||||
Franchise |
293.8 | 16.1 | % | 264.2 | 15.5 | % | 258.0 | 15.6 | % | ||||||||||
Manufacturing/Wholesale (Third Party) |
184.2 | 10.1 | % | 186.5 | 10.9 | % | 179.4 | 10.8 | % | ||||||||||
Total |
$ | 1,822.4 | 100.0 | % | $ | 1,707.0 | 100.0 | % | $ | 1,656.7 | 100.0 | % | |||||||
Retail
Our Retail segment generates revenues primarily from sales of products to customers at our company-owned stores in the United States and Canada, and in the United States through our website, GNC.com.
Locations
As of December 31, 2010, we operated 2,917 company-owned stores across all 50 states and in Canada, Puerto Rico and Washington, D.C. Most of our U.S. company owned stores are between 1,000 and 2,000 square feet and are located primarily in shopping malls and strip shopping centers. Traditional shopping mall and strip shopping center locations generate a large percentage of our total retail sales. With the exception of our downtown stores, virtually all of our company-owned stores follow one of two consistent formats, one for mall locations and one for strip shopping center locations. We are, however, developing and testing new store formats to (i) enhance the consumer's shopping experience with a larger and more modern, functional store layout and an enhanced assortment of merchandise, and (ii) secure major trade area market share with a high visibility, high traffic retail location that builds on the consumer's perception of the GNC brand as a destination for health and wellness. The new store formats will showcase the GNC brand and will range in size from approximately 2,000 square feet to 3,000 square feet depending on location. We believe the new store formats will complement our existing 1,500 square foot "modern design" store locations in our traditional real estate locations, such as malls and in-line strip centers.
We periodically redesign our store graphics to better identify with our GNC customers and provide product information to allow the consumer to make educated decisions regarding product purchases and usage. Our product labeling is consistent within our product lines and the stores are designed to present a unified approach to packaging with emphasis on added information for the consumer. As an ongoing practice, we continue to reset and upgrade all of our company owned stores to maintain a more modern and customer friendly layout, while promoting our GNC Live Well® theme.
Franchise
Our Franchise segment is comprised of our domestic and international franchise operations. Our Franchise segment generates revenues from franchise activities primarily through product sales to franchisees, royalties on franchise retail sales and franchise fees.
As a means of enhancing our operating performance and building our store base, we began opening franchise locations in 1988. As of December 31, 2010, there were 2,340 franchise stores operating, including 903 stores in the United States and 1,437 international franchise stores
12
operating in 46 countries (including distribution centers where retail sales are made). Approximately 89% of our franchise stores in the United States are in strip shopping centers and are typically between 1,000 and 2,000 square feet. The international franchise stores are typically smaller and, depending upon the country and cultural preferences, are located in mall, strip center, street or store-within-a-store locations. In addition, some international franchisees sell on the internet in their respective countries. Typically, our international stores have a store format and signage similar to our U.S. franchise stores. To assist our franchisees in the successful operation of their stores and to protect our brand image, we offer site selection, construction assistance, accounting services and a three-part training program, which consists of classroom instruction and training in a company-owned location, both of which occur prior to the franchise store opening, and actual on-site training during the first week of operations of the franchise store. We believe we have good relationships with our franchisees, as evidenced by our franchisee renewal rate of 91% between 2005 and 2010. We do not rely heavily on any single franchise operator in the United States, since the largest franchisee owns and/or operates 10 store locations.
All of our franchise stores in the United States offer both our proprietary products and third-party products, with a product selection similar to that of our company-owned stores. Our international franchise stores are offered a more limited product selection than our franchise stores in the United States with the product selection heavily weighted toward proprietary products. Products are distributed to our franchise stores in the United States through our distribution centers and transportation fleet in the same manner as our company-owned stores. Products distributed to our international franchise stores are delivered to the franchisee's freight forwarder at the United States port of deportation, at which point our responsibility for the delivery of the products ends.
Franchises in the United States
Revenues from our franchisees in the United States accounted for approximately 63% of our total franchise revenues for the year ended December 31, 2010. In 2010, new franchisees in the United States were required to pay an initial fee of $40,000 for a franchise license. Existing GNC franchise operators may purchase an additional franchise license for a $30,000 fee. We typically offer limited financing to qualified franchisees in the United States for terms of up to five years. Once a store begins operations, franchisees are required to pay us a continuing royalty of 6% of sales and contribute 3% of sales to a national advertising fund. Our standard franchise agreements for the United States are effective for a ten-year period with two five-year renewal options. At the end of the initial term and each of the renewal periods, the renewal fee is generally 33% of the franchisee fee that is then in effect. The franchisee renewal option is at our election for all franchise agreements executed after December 1995. Franchisees must meet certain conditions in order to exercise the franchisee renewal option. Our franchisees in the United States receive limited geographical exclusivity and are required to follow the GNC store format.
Franchisees must meet certain minimum standards and duties prescribed by our franchise operations manual and we conduct periodic field visit reports to ensure our minimum standards are maintained. Generally, we enter into a five-year lease with one five-year renewal option with landlords for our franchise locations in the United States. This allows us to secure space at cost-effective rates, which we sublease to our franchisees at cost. By subleasing to our franchisees, we have greater control over the location and have greater bargaining power for lease negotiations than an individual franchisee typically would have. In addition, we can elect not to renew subleases for underperforming locations. If a franchisee does not meet specified performance and appearance criteria, the franchise agreement outlines the procedures under which we are permitted to terminate the franchise agreement. In these situations, we may take possession of the location, inventory and equipment, and operate the store as a company-owned store or re-franchise the location. In 2010, we terminated 44 franchise agreements, 26 of which were converted into company-owned stores.
13
The offering and sale of our franchises in the United States are regulated by the Federal Trade Commission (the "FTC") and various state authorities. See Item 1, "— Government Regulation — Franchise Regulation".
International Franchises
Revenues from our international franchisees accounted for approximately 37% of our total franchise revenues for the year ended December 31, 2010. In 2010, new international franchisees were required to pay an initial fee of approximately $25,000 for a franchise license for each full size store and average continuing royalty fees of approximately 5% of retail sales, with fees and royalties varying depending on the country and the store type. Our franchise program has enabled us to expand into international markets with limited capital expenditures. We expanded our international presence from 858 international franchise locations at the end of 2005 to 1,437 international locations (including distribution centers where retail sales are made) as of December 31, 2010. We typically generate less revenue from franchises outside the United States due to lower international royalty rates and the franchisees purchasing a smaller percentage of products from us compared to our domestic franchisees.
Franchisees in international locations enter into development agreements with us for either full-size stores, a store-within-a-store at a host location, wholesale distribution center operations or internet distribution rights. The development agreement grants the franchisee the right to develop a specific number of stores in a territory, often the entire country. The international franchisee then enters into a franchise agreement for each location. The full-size store franchise agreement has an initial ten-year term with two five-year renewal options. At the end of the initial term and renewal periods, the international franchisee has the option to renew the agreement at 33% of the franchise fee that is then in effect. Franchise agreements for international store-within-a-store locations have an initial term of five years, with two five-year renewal options. At the end of the initial term and each of the renewal periods, the international franchisee of a store-within-a-store location has the option to renew the agreement for up to a maximum of 50% of the franchise fee that is then in effect. Our international franchisees often receive exclusive franchising rights to the entire country franchise, excluding U.S. military bases. Our international franchisees must meet minimum standards and duties similar to our U.S. franchisees. Our international franchise agreements and international operations may be regulated by various country, local and international laws. See Item 1, "— Government Regulation — Franchise Regulation".
Manufacturing/Wholesale
Our Manufacturing/Wholesale segment is comprised of our manufacturing operations in South Carolina and our wholesale sales business. This segment supplies our Retail and Franchise segments as well as various third parties with finished products. Our Manufacturing/Wholesale segment generates revenues through sales of manufactured products to third parties, and the sale of our proprietary and third-party brand products to Rite Aid, PetSmart and www.drugstore.com. Our wholesale operations are supported primarily by our Anderson, South Carolina distribution center.
Manufacturing
Our sophisticated manufacturing and warehousing facilities support our Retail and Franchise segments and enable us to control the production and distribution of our proprietary products, to better control costs, protect product quality, monitor delivery times and maintain appropriate inventory levels. Our unique combination of in-house development of products, vertically integrated infrastructure and innovation capabilities support our business strategy and enable the rapid development of proprietary products. We operate two main manufacturing facilities in the United
14
States, one in Greenville, South Carolina and one in Anderson, South Carolina. We utilize our plants primarily for the production of proprietary products. Our manufacturing operations are designed to allow low-cost production of a variety of products of different quantities, sizes and packaging configurations while maintaining strict levels of quality control. Our manufacturing procedures are designed to promote consistency and quality in our finished goods. We conduct sample testing on raw materials and finished products, including weight, purity and micro bacterial testing. Our manufacturing facilities also service our wholesale operations, including the manufacture and supply of Rite Aid private label products for distribution to Rite Aid locations and proprietary products for distribution to PetSmart locations. We use our available capacity at these facilities to produce products for sale to third-party customers.
The principal raw materials used in the manufacturing process are natural and synthetic vitamins, herbs, minerals and gelatin. We maintain multiple sources for the majority of our raw materials, with the remaining being single-sourced due to the uniqueness of the material. During 2010, no one vendor supplied more than 10% of our raw materials. Our distribution fleet delivers raw materials and components to our manufacturing facilities and also delivers our finished goods and third-party products to our distribution centers.
Wholesale
Franchise Store-Within-a-Store Locations. To increase brand awareness and promote access to customers who may not frequent specialty nutrition stores, we entered into a strategic alliance with Rite Aid to open GNC franchise store-within-a-store locations. As of December 31, 2010, we had 2,003 store-within-a-store locations. Through this strategic alliance, we generate revenues from sales to Rite Aid of our products at wholesale prices, the manufacture of Rite Aid private label products, retail sales of certain consigned inventory and license fees. We are Rite Aid's sole supplier for the PharmAssure vitamin brand and a number of Rite Aid private label supplements. In May 2007, we extended our alliance with Rite Aid through 2014 with a five year option. At December 31, 2010, Rite Aid had opened 848 of an additional 1,125 stores that Rite Aid has committed to open by December 31, 2014.
Distribution Agreement with drugstore.com. Our current internet distribution agreement with drugstore.com, inc. was recently renewed through June 2013. Through this strategic alliance, www.drugstore.com was the exclusive internet retailer of our proprietary products and certain other nutritional supplements until June 2005, when this exclusive relationship was terminated. This continued alliance allows us to access a larger base of customers, who may not otherwise live close to, or have the time to visit, a GNC store and provides an internet distribution channel in addition to GNC.com. We generate revenues from the distribution agreement with drugstore.com, inc. through sales of third-party products on a wholesale basis and through retail sales of our proprietary products on a consignment basis.
Employees
As of December 31, 2010, we had a total of 5,308 full-time and 7,778 part-time employees, of whom approximately 10,484 were employed in the domestic portion of our Retail segment; 39 were employed in our Franchise segment; 1,343 were employed in our Manufacturing/Wholesale segment; 487 were employed in corporate support functions; and 733 were employed in Canada. None of our employees belongs to a union or is a party to any collective bargaining or similar agreement. We consider our relationships with our employees to be good.
15
Competition
The U.S. nutritional supplements retail industry is a large, highly fragmented and growing industry, with no single industry participant accounting for a majority of total industry retail sales. Competition is based primarily on price, quality and assortment of products, customer service, marketing support and availability of new products. In addition, the market is highly sensitive to the introduction of new products.
We compete with publicly owned and privately owned companies, which are highly fragmented in terms of geographical market coverage and product categories. We compete with other specialty retailers, supermarkets, drugstores, mass merchants, multi-level marketing organizations, mail-order companies, other internet sites and a variety of other smaller participants. We believe that the market is highly sensitive to the introduction of new products. In the United States, many of our competitors have national brands that are heavily advertised and are manufactured by large pharmaceutical and food companies and other retailers. Most supermarkets, drugstores and mass merchants have narrow product offerings limited primarily to simple vitamins, herbs and popular third-party diet products. Our international competitors also include large international pharmacy chains and major international supermarket chains as well as other large U.S.-based companies with international operations. Our wholesale and manufacturing operations also compete with other wholesalers and manufacturers of third-party nutritional supplements.
Trademarks and Other Intellectual Property
We believe trademark protection is particularly important to the maintenance of the recognized brand names under which we market our products. We own or have rights to material trademarks or trade names that we use in conjunction with the sale of our products, including the GNC brand name. We also rely upon trade secrets, know-how, continuing technological innovations and licensing opportunities to develop and maintain our competitive position. We protect our intellectual property rights through a variety of methods, including trademark, patent and trade secret laws, as well as confidentiality agreements and proprietary information agreements with vendors, employees, consultants and others who have access to our proprietary information. Protection of our intellectual property often affords us the opportunity to enhance our position in the marketplace by precluding our competitors from using or otherwise exploiting our technology and brands. We are also a party to several intellectual property license agreements relating to certain of our products. For example, we are a party to license agreements entered into in connection with the Numico acquisition pursuant to which we license certain patent rights to Numico and Numico licenses to us specific patent rights and proprietary information. These license agreements generally continue until the expiration of the licensed patent, if applicable, or we elect to terminate the agreement, or upon the mutual consent of the parties. The patents we own generally have a term of 20 years from their filing date, although none of our owned or licensed patents are currently associated with a material portion of our business. The duration of our trademark registrations is generally 10, 15 or 20 years, depending on the country in which the marks are registered, and the registrations can be renewed by us. The scope and duration of our intellectual property protection varies throughout the world by jurisdiction and by individual product.
Insurance and Risk Management
We purchase insurance to cover standard risks in the nutritional supplements industry, including policies to cover general products liability, workers' compensation, auto liability and other casualty and property risks. Our insurance rates are dependent upon our safety record as well as trends in the insurance industry. We also maintain workers' compensation insurance and auto insurance policies that are retrospective in that the cost per year will vary depending on the frequency and severity of claims in the policy year. Prior to the Numico acquisition, we were
16
covered by some of Numico's insurance policies. Following the completion of the Numico acquisition, we obtained our own insurance policies to replace those Numico policies, including policies for general product liability. We currently maintain product liability insurance and general liability insurance.
We face an inherent risk of exposure to product liability claims in the event that, among other things, the use of products sold by GNC results in injury. With respect to product liability coverage, we carry insurance coverage typical of our industry and product lines. Our coverage involves self-insured retentions with primary and excess liability coverage above the retention amount. We have the ability to refer claims to most of our vendors and their insurers to pay the costs associated with any claims arising from such vendors' products. In most cases, our insurance covers such claims that are not adequately covered by a vendor's insurance and provides for excess secondary coverage above the limits provided by our product vendors.
We self-insure certain property and casualty risks due to our analysis of the risk, the frequency and severity of a loss and the cost of insurance for the risk. We believe that the amount of self-insurance is not significant and will not have an adverse impact on our performance. In addition, we may from time to time self-insure liability with respect to specific ingredients in products that we may sell.
Government Regulation
Product Regulation
Domestic
The processing, formulation, safety, manufacturing, packaging, labeling, advertising and distribution of our products are subject to regulation by one or more federal agencies, including the Federal Drug Administration (the "FDA"), the FTC, the Consumer Product Safety Commission, the United States Department of Agriculture (the "USDA") and the Environmental Protection Agency (the "EPA"), and by various agencies of the states and localities in which our products are sold.
The Dietary Supplement Health and Education Act of 1994 ("DSHEA") established a new framework governing the composition, safety, labeling, manufacturing and marketing of dietary supplements. Generally, under DSHEA, dietary ingredients that were marketed in the United States prior to October 15, 1994 may be used in dietary supplements without notifying the FDA. "New" dietary ingredients (i.e., dietary ingredients that were "not marketed in the United States before October 15, 1994") must be the subject of a new dietary ingredient notification submitted to the FDA unless the ingredient has been "present in the food supply as an article used for food" without being "chemically altered". A new dietary ingredient notification must provide the FDA evidence of a "history of use or other evidence of safety" establishing that use of the dietary ingredient "will reasonably be expected to be safe". A new dietary ingredient notification must be submitted to the FDA at least 75 days before the initial marketing of the new dietary ingredient. The FDA may determine that a new dietary ingredient notification does not provide an adequate basis to conclude that a dietary ingredient is reasonably expected to be safe. Such a determination could prevent the marketing of such dietary ingredient. The FDA has announced that it plans to issue a guidance governing notification of new dietary ingredients. While it is not mandatory to comply with FDA guidance, it is a strong indication of the FDA's current views on the topic of the guidance, including its position on enforcement. Depending upon the recommendations made in the guidance, particularly those relating to animal or human testing, such guidance could make it more difficult for us to successfully provide notification of new dietary ingredients.
The Dietary Supplement Safety Act (S 3002), introduced in February 2010, would repeal the provision of DSHEA that permits the sale of all dietary ingredients sold in dietary supplements
17
marketed in the United States prior to October 15, 1994, and instead permit the sale of only those dietary ingredients included on a list of Accepted Dietary Ingredients to be issued and maintained by the FDA. The bill also would allow the FDA to: impose a fine of twice the gross profits earned by a distributor on sales of any dietary supplement found to violate the law; require a distributor to submit a yearly report on all non-serious Adverse Event Reports ("AERs") received during the year to the FDA; and allow the FDA to recall any dietary supplement it determines with "a reasonable probability" would cause serious adverse health consequences or is adulterated or misbranded. The bill also would require any dietary supplement distributor to register with the FDA and submit a list of the ingredients in and copies of the labels of its dietary supplements to the FDA and thereafter update such disclosures yearly and submit any new dietary supplement product labels to the FDA before marketing any dietary supplement product. If this bill is reintroduced and enacted, it could severely restrict the number of dietary supplements available for sale and increase our costs and potential penalties associated with selling dietary supplements.
The FDA or other agencies could take actions against products or product ingredients that in its determination present an unreasonable health risk to consumers that would make it illegal for us to sell such products. In addition, the FDA could issue consumer warnings with respect to the products or ingredients in such products that are sold in our stores. For example, in May 2009, the FDA warned consumers to stop using Hydroxycut diet products, which are produced by Iovate and were sold in our stores. Iovate issued a voluntary recall, with which we fully complied. Sales of the recalled Hydroxycut products amounted to approximately $57.8 million, or 4.7% of our retail sales in 2008, and $18.8 million, or 4.2% of our retail sales in the first four months of 2009. Through December 31, 2010, we estimate that we had refunded approximately $3.5 million to our retail customers and approximately $1.6 million to our wholesale customers for Hydroxycut product returns.
DSHEA permits "statements of nutritional support" to be included in labeling for dietary supplements without FDA pre-market approval. Such statements must be submitted to the FDA within 30 days of marketing. Such statements may describe how a particular dietary ingredient affects the structure, function or general well-being of the body, or the mechanism of action by which a dietary ingredient may affect body structure, function, or well-being, but may not expressly or implicitly represent that a dietary supplement will diagnose, cure, mitigate, treat or prevent a disease. A company that uses a statement of nutritional support in labeling must possess scientific evidence substantiating that the statement is truthful and not misleading. If the FDA determines that a particular statement of nutritional support is an unacceptable drug claim or an unauthorized version of a "health claim", or, if the FDA determines that a particular claim is not adequately supported by existing scientific data or is false or misleading, we would be prevented from using the claim.
In addition, DSHEA provides that so-called "third-party literature", e.g., a reprint of a peer-reviewed scientific publication linking a particular dietary ingredient with health benefits, may be used "in connection with the sale of a dietary supplement to consumers" without the literature being subject to regulation as labeling. The literature: (1) must not be false or misleading; (2) may not "promote" a particular manufacturer or brand of dietary supplement; (3) must present a balanced view of the available scientific information on the subject matter; (4) if displayed in an establishment, must be physically separate from the dietary supplements; and (5) should not have appended to it any information by sticker or any other method. If the literature fails to satisfy each of these requirements, we may be prevented from disseminating such literature with our products, and any dissemination could subject our product to regulatory action as an illegal drug.
In June 2007, pursuant to the authority granted to the FDA by DSHEA, the FDA published detailed Current Good Manufacturing Practice ("GMP") regulations that govern the manufacturing, packaging, labeling and holding operations of dietary supplement manufacturers. The GMP
18
regulations, among other things, impose significant recordkeeping requirements on manufacturers. The GMP requirements are in effect for all manufacturers, and the FDA is conducting inspections of dietary supplement manufacturers pursuant to these requirements. There remains considerable uncertainty with respect to the FDA's interpretation of the regulations and their actual implementation in manufacturing facilities. In addition, the FDA's interpretation of the regulations will likely change over time as the agency becomes more familiar with the industry and the regulations. The failure of a manufacturing facility to comply with the GMP regulations renders products manufactured in such facility "adulterated," and subjects such products and the manufacturer to a variety of potential FDA enforcement actions. In addition, under the Food Safety Modernization Act ("FSMA"), which was signed on December 27, 2010, the manufacturing of dietary ingredients contained in dietary supplements will be subject to similar or even more burdensome manufacturing requirements, which will likely increase the costs of dietary ingredients and will subject suppliers of such ingredients to more rigorous inspections and enforcement.
The FDA has broad authority to enforce the provisions of federal law applicable to dietary supplements, including powers to issue a public warning or notice of violation letter to a company, publicize information about illegal products, detain products intended for import, request a recall of illegal products from the market, and request the Department of Justice to initiate a seizure action, an injunction action, or a criminal prosecution in the U.S. courts. The FSMA expands the reach and regulatory powers of the FDA with respect to the production of food, including dietary supplements. The expanded reach and regulatory powers include the FDA's ability to order mandatory recalls, administratively detain domestic products and administratively revoke manufacturing facility registrations, effectively enjoining manufacturing of dietary ingredients and dietary supplements without judicial process. The FDA has yet to exercise such expanded reach and regulatory powers. The regulation of dietary supplements may increase or become more restrictive in the future.
The FTC exercises jurisdiction over the advertising of dietary supplements and over-the-counter drugs. In recent years, the FTC has instituted numerous enforcement actions against dietary supplement companies for failure to have adequate substantiation for claims made in advertising or for the use of false or misleading advertising claims. We continue to be subject to three consent orders issued by the FTC. In 1984, the FTC instituted an investigation of General Nutrition, Incorporated, one of our then existing subsidiaries, alleging deceptive acts and practices in connection with the advertising and marketing of certain of its products. General Nutrition, Incorporated accepted a proposed consent order, under which it agreed to refrain from, among other things, making certain claims with respect to certain of its products unless the claims are based on and substantiated by competent and reliable scientific evidence. We also entered into a consent order in 1970 with the FTC, which generally addressed "iron deficiency anemia" type products. As a result of routine monitoring by the FTC, disputes arose concerning our compliance with these orders and with regard to advertising for certain hair care products. While we believe that General Nutrition, Incorporated, at all times, operated in material compliance with the orders, it entered into a settlement in 1994 with the FTC to avoid protracted litigation. As a part of this settlement, General Nutrition, Incorporated entered into a consent decree and paid, without admitting liability, a civil penalty in the amount of $2.4 million and agreed to adhere to the terms of the 1970 and 1989 consent orders and to abide by the provisions of the settlement document concerning hair care products. We do not believe that future compliance with the outstanding consent decrees will materially affect our business operations.
The FTC continues to monitor our advertising and, from time to time, requests substantiation with respect to such advertising to assess compliance with the various outstanding consent decrees and with the Federal Trade Commission Act. Our policy is to use advertising that complies with the consent decrees and applicable regulations. Nevertheless, there can be no assurance that inadvertent failures to comply with the consent decrees and applicable regulations will not occur.
19
Some of the products sold by franchise stores are purchased by franchisees directly from other vendors and these products do not flow through our distribution centers. Although franchise contracts contain strict requirements for store operations, including compliance with federal, state and local laws and regulations, we cannot exercise the same degree of control over franchisees as we do over our company-owned stores.
As a result of our efforts to comply with applicable statutes and regulations, we have from time to time reformulated, eliminated or relabeled certain of our products and revised certain provisions of our sales and marketing program.
Foreign
Our products sold in foreign countries are also subject to regulation under various national, local, and international laws that include provisions governing, among other things, the formulation, manufacturing, packaging, labeling, advertising and distribution of dietary supplements and over-the-counter drugs. Government regulations in foreign countries may prevent or delay the introduction, or require the reformulation, of certain of our products.
New Legislation or Regulation
Legislation may be introduced which, if passed, would impose substantial new regulatory requirements on dietary supplements. For example, although not yet reintroduced in this session of Congress, bills have been repeatedly proposed in past sessions of Congress which would subject the dietary ingredient dehydroepiandrosterone ("DHEA") to the requirements of the Controlled Substances Act, which would prevent the sale of products containing DHEA. In March 2009, the General Accounting Office (the "GAO") issued a report that made four recommendations to enhance the FDA's oversight of dietary supplements. The GAO recommended that the Secretary of the Department of Health and Human Services direct the Commissioner of the FDA to: (1) request authority to require dietary supplement companies to identify themselves as a dietary supplement company and update this information annually, provide a list of all dietary supplement products they sell and a copy of the labels and update this information annually, and report all adverse events related to dietary supplements; (2) issue guidance to clarify when an ingredient is considered a new dietary ingredient, the evidence needed to document the safety of new dietary ingredients, and appropriate methods for establishing ingredient identity; (3) provide guidance to industry to clarify when products should be marketed as either dietary supplements or conventional foods formulated with added dietary ingredients; and (4) coordinate with stakeholder groups involved in consumer outreach to identify additional mechanisms for educating consumers about the safety, efficacy, and labeling of dietary supplements, implement these mechanisms, and assess their effectiveness. These recommendations could lead to increased regulation by the FDA or future legislation concerning dietary supplements
We cannot determine what effect additional domestic or international governmental legislation, regulations, or administrative orders, when and if promulgated, would have on our business in the future. New legislation or regulations may require the reformulation of certain products to meet new standards, require the recall or discontinuance of certain products not capable of reformulation, impose additional record keeping, or require expanded documentation of the properties of certain products, expanded or different labeling, or scientific substantiation.
Franchise Regulation
We must comply with regulations adopted by the FTC and with several state laws that regulate the offer and sale of franchises. The FTC's Trade Regulation Rule on Franchising and certain state laws require that we furnish prospective franchisees with a franchise offering circular containing
20
information prescribed by the Trade Regulation Rule on Franchising and applicable state laws and regulations.
We also must comply with a number of state laws that regulate some substantive aspects of the franchisor-franchisee relationship. These laws may limit a franchisor's business practices in a number of ways, including limiting the ability to:
- •
- terminate or not renew a franchise without good cause;
- •
- interfere with the right of free association among franchisees;
- •
- disapprove the transfer of a franchise;
- •
- discriminate among franchisees with regard to franchise terms and charges, royalties, and other fees; and
- •
- place new stores near existing franchises.
To date, these laws have not precluded us from seeking franchisees in any given area and have not had a material adverse effect on our operations. Bills intended to regulate certain aspects of franchise relationships have been introduced into Congress on several occasions during the last decade, but none have been enacted. Revisions to the FTC rule have also been proposed by the FTC and currently are in the comment stage of the rulemaking process.
Our international franchise agreements and franchise operations are regulated by various foreign laws, rules and regulations. These laws may limit a franchisor's business practices in a number of ways. To date, these laws have not precluded us from seeking franchisees in any given area and have not had a material adverse effect on our operations.
Environmental Compliance
In March 2008, the South Carolina Department of Health and Environmental Control ("DHEC") requested that we investigate contamination associated with historical activities at our South Carolina facility. These investigations have identified chlorinated solvent impacts in soils and groundwater that extend offsite from our facility. We are awaiting DHEC approval of the scope of additional investigations in order to understand the extent of these impacts and develop appropriate remedial measures for DHEC approval. At this state of the investigation, however, it is not possible to estimate the timing and extent of any remedial action that may be required, the ultimate cost of remediation, or the amount of our potential liability.
In addition to the foregoing, we are subject to numerous federal, state, local and foreign environmental and health and safety laws and regulations governing its operations, including the handling, transportation and disposal of our non-hazardous and hazardous substances and wastes, as well as emissions and discharges from its operations into the environment, including discharges to air, surface water and groundwater. Failure to comply with such laws and regulations could result in costs for remedial actions, penalties or the imposition of other liabilities. New laws, changes in existing laws or the interpretation thereof, or the development of new facts or changes in their processes could also cause us to incur additional capital and operating expenditures to maintain compliance with environmental laws and regulations and environmental permits. We are also subject to laws and regulations that impose liability and cleanup responsibility for releases of hazardous substances into the environment without regard to fault or knowledge about the condition or action causing the liability. Under certain of these laws and regulations, such liabilities can be imposed for cleanup of previously owned or operated properties, or for properties to which substances or wastes that were sent in connection with current or former operations at its facilities. The presence of contamination from such substances or wastes could also adversely affect our ability to sell or lease its properties, or to use them as collateral for financing. From time to time, we
21
have incurred costs and obligations for correcting environmental and health and safety noncompliance matters and for remediation at or relating to certain of its properties or properties at which its waste has been disposed. However, compliance with the provisions of national, state, and local environmental laws and regulations has not had a material effect upon our capital expenditures, earnings, financial position, liquidity or competitive position. We believe we are currently in compliance with our environmental obligations pursuant to environmental and health and safety laws and regulations in all material respects, and that any liabilities for noncompliance will not have a material adverse effect on our business or financial performance.
The following risk factors could cause our financial performance to differ significantly from the goals, plans, objectives, intentions and expectations expressed in this report. If any of the following risks and uncertainties actually occur, our business, financial condition or operating results could be harmed substantially.
Risks Relating to Our Business and Industry
We may not effectively manage our growth, which could materially harm our business.
We expect that our business will continue to grow, which may place a significant strain on our management, personnel, systems and resources. We must continue to improve our operational and financial systems and managerial controls and procedures, and we will need to continue to expand, train and manage our technology and workforce. We must also maintain close coordination among our technology, compliance, accounting, finance, marketing and sales organizations. We cannot assure you that we will manage our growth effectively. If we fail to do so, our business could be materially harmed.
Our continued growth will require an increased investment by us in technology, facilities, personnel and financial and management systems and controls. It also will require expansion of our procedures for monitoring and assuring our compliance with applicable regulations, and we will need to integrate, train and manage a growing employee base. The expansion of our existing businesses, any expansion into new businesses and the resulting growth of our employee base will increase our need for internal audit and monitoring processes that are more extensive and broader in scope than those we have historically required. We may not be successful in identifying or implementing all of the processes that are necessary. Further, unless our growth results in an increase in our revenues that is proportionate to the increase in our costs associated with this growth, our operating margins and profitability will be adversely affected.
We operate in a highly competitive industry. Our failure to compete effectively could adversely affect our market share, revenues, and growth prospects.
The U.S. nutritional supplements retail industry is large and highly fragmented. Participants include specialty retailers, supermarkets, drugstores, mass merchants, multi level marketing organizations, on-line merchants, mail-order companies and a variety of other smaller participants. We believe that the market is also highly sensitive to the introduction of new products, which may rapidly capture a significant share of the market. In the United States, we also compete for sales with heavily advertised national brands manufactured by large pharmaceutical and food companies, as well as other retailers. In addition, as some products become more mainstream, we experience increased price competition for those products as more participants enter the market. Our international competitors include large international pharmacy chains, major international supermarket chains, and other large U.S. based companies with international operations. Our wholesale and manufacturing operations compete with other wholesalers and manufacturers of
22
third-party nutritional supplements. We may not be able to compete effectively and our attempt to do so may require us to reduce our prices, which may result in lower margins. Failure to effectively compete could adversely affect our market share, revenues and growth prospects.
Unfavorable publicity or consumer perception of our products and any similar products distributed by other companies could cause fluctuations in our operating results and could have a material adverse effect on our reputation, the demand for our products, and our ability to generate revenues.
We are highly dependent upon consumer perception of the safety and quality of our products, as well as similar products distributed by other companies. Consumer perception of products can be significantly influenced by scientific research or findings, national media attention and other publicity about product use. A product may be received favorably, resulting in high sales associated with that product that may not be sustainable as consumer preferences change. Future scientific research or publicity could be unfavorable to our industry or any of our particular products and may not be consistent with earlier favorable research or publicity. A future research report or publicity that is perceived by our consumers as less favorable or that questions earlier research or publicity could have a material adverse effect on our ability to generate revenues. For example, sales of some of our products, such as those containing ephedra, were initially strong, but decreased as a result of negative publicity and an ultimate ban of such products by the FDA. As such, period-to-period comparisons of our results should not be relied upon as a measure of our future performance. Adverse publicity in the form of published scientific research or otherwise, whether or not accurate, that associates consumption of our products or any other similar products with illness or other adverse effects, that questions the benefits of our or similar products, or that claims that such products are ineffective could have a material adverse effect on our reputation, the demand for our products and our ability to generate revenues.
Our failure to appropriately respond to changing consumer preferences and demand for new products could significantly harm our customer relationships and product sales.
Our business is particularly subject to changing consumer trends and preferences. Our continued success depends in part on our ability to anticipate and respond to these changes, and we may not be able to respond in a timely or commercially appropriate manner to these changes. If we are unable to do so, our customer relationships and product sales could be harmed significantly.
Furthermore, the nutritional supplements industry is characterized by rapid and frequent changes in demand for products and new product introductions. Our failure to accurately predict these trends could negatively impact consumer opinion of our stores as a source for the latest products. This could harm our customer relationships and cause losses to our market share. The success of our new product offerings depends upon a number of factors, including our ability to accurately anticipate customer needs; innovate and develop new products; successfully commercialize new products in a timely manner; price our products competitively; manufacture and deliver our products in sufficient volumes and in a timely manner; and differentiate our product offerings from those of our competitors.
If we do not introduce new products or make enhancements to meet the changing needs of our customers in a timely manner, some of our products could become obsolete, which could have a material adverse effect on our revenues and operating results.
23
Our substantial debt could adversely affect our results of operations and financial condition and otherwise adversely impact our operating income and growth prospects.
As of December 31, 2010, our total consolidated long-term debt (including current portion) was approximately $1,058.5 million, and we had an additional $44.9 million available under our $60.0 million senior revolving credit facility (the "Revolving Credit Facility") after giving effect to $8.8 million utilized to secure letters of credit and a $6.3 million commitment from subsidiaries of Lehman Brothers Holdings Inc. (collectively, "Lehman") that we do not expect Lehman will fund.
All of the debt under our senior credit facility, consisting of a $675.0 million term loan facility (the "Term Loan Facility") and the Revolving Credit Facility (together with the Term Loan Facility, the "Senior Credit Facility"), bears interest at variable rates. Our unhedged debt is subject to additional interest expense if these rates increase significantly, which could also reduce our ability to borrow additional funds.
Our substantial debt could have material consequences on our financial condition. For example, it could:
- •
- make it more difficult for us to satisfy our obligations with respect to the Senior Floating Rate Toggle Notes due 2014
(the "Senior Notes") and the 10.75% Senior Subordinated Notes due 2015 (the "Senior Subordinated Notes");
- •
- increase our vulnerability to general adverse economic and industry conditions;
- •
- require us to use all or a large portion of our cash flow from operations to pay principal and interest on our debt,
thereby reducing the availability of our cash flow to fund working capital, capital expenditures, and other business activities;
- •
- limit our flexibility in planning for, or reacting to, changes in our business and the industry in which we operate
- •
- restrict us from making strategic acquisitions or exploiting business opportunities;
- •
- place us at a competitive disadvantage compared to our competitors that have less debt; and
- •
- limit our ability to borrow additional funds or pay cash dividends.
For additional information regarding the interest rates and maturity dates of our existing debt, see "Management's Discussion and Analysis of Financial Condition and Results of Operations — Liquidity and Capital Resources".
We and our subsidiaries may be able to incur additional debt in the future, including collateralized debt. Although the Senior Credit Facility and the indentures governing the Senior Notes and the Senior Subordinated Notes contain restrictions on the incurrence of additional debt, these restrictions are subject to a number of qualifications and exceptions. If additional debt is added to our current level of debt, the risks described above would increase.
On February 7, 2011, we announced that we intend to enter into, subject to market and other conditions, the Refinancing (as defined in this report). We currently expect to use the proceeds from the Refinancing, if consummated, to, among other things, refinance our existing indebtedness. We currently expect to consummate the Refinancing in March 2011; however, there can be no assurance that we will complete the Refinancing either on terms acceptable to us or at all. Our inability to complete the Refinancing or to complete it on terms that we find favorable could increase the risks described above. See "Liquidity and Capital Resources — Cash Used in Financing Activities — Proposed Refinancing".
24
Our ability to continue to access credit on the terms previously obtained for the funding of our operations and capital projects may be limited due to changes in credit markets.
In recent periods, the credit markets and the financial services industry have experienced disruption characterized by the bankruptcy, failure, collapse or sale of various financial institutions, increased volatility in securities prices, diminished liquidity and credit availability and intervention from the United States and other governments. Continued concerns about the systemic impact of potential long-term or widespread downturn, energy costs, geopolitical issues, the availability and cost of credit, the global commercial and residential real estate markets and related mortgage markets and reduced consumer confidence have contributed to increased market volatility. The cost and availability of credit has been and may continue to be adversely affected by these conditions. We cannot be certain that funding for our capital needs will be available from our existing financial institutions and the credit markets if needed, and if available, to the extent required, and on acceptable terms. The Revolving Credit Facility matures in March 2012. If we cannot renew or refinance this facility upon its maturity or, more generally, obtain funding when needed, in each case on acceptable terms, we may be unable to continue our current rate of growth and store expansion, which may have an adverse effect on our revenues and results of operations.
On February 7, 2011, we announced that we intend to enter into, subject to market and other conditions, the Refinancing. We currently expect to use the proceeds from the Refinancing, if consummated, to, among other things, refinance our existing indebtedness. We currently expect to consummate the Refinancing in March 2011; however, there can be no assurance that we will complete the Refinancing either on terms acceptable to us or at all. See "Liquidity and Capital Resources — Cash Used in Financing Activities — Proposed Refinancing".
We require a significant amount of cash to service our debt. Our ability to generate cash depends on many factors beyond our control and, as a result, we may not be able to make payments on our debt obligations.
We may be unable to generate sufficient cash flow from operations or to obtain future borrowings under our credit facilities or otherwise in an amount sufficient to enable us to pay our debt or to fund our other liquidity needs. In addition, because we conduct our operations through our operating subsidiaries, we depend on those entities for dividends and other payments to generate the funds necessary to meet our financial obligations, including payments on our debt. Under certain circumstances, legal and contractual restrictions, as well as the financial condition and operating requirements of our subsidiaries, may limit our ability to obtain cash from our subsidiaries. If we do not have sufficient liquidity, we may need to refinance or restructure all or a portion of our debt on or before maturity, sell assets, or borrow more money, which we may not be able to do on terms satisfactory to us or at all. In addition, any refinancing could be at higher interest rates and may require us to comply with more onerous covenants which could further restrict our business operations.
If we are unable to meet our obligations with respect to our debt, we could be forced to restructure or refinance our debt, seek equity financing or sell assets. A default on any of our debt obligations could trigger certain acceleration clauses and cause those and our other obligations to become immediately due and payable. Upon an acceleration of any of our debt, we may not be able to make payments under our other outstanding debt.
25
Restrictions in the agreements governing our existing and future indebtedness may prevent us from taking actions that we believe would be in the best interest of our business.
The agreements governing our existing indebtedness contain and the agreements governing our future indebtedness will likely contain customary restrictions on us or our subsidiaries, including covenants that restrict us or our subsidiaries, as the case may be, from:
- •
- incurring additional indebtedness and issuing preferred stock;
- •
- granting liens on our assets;
- •
- making investments;
- •
- consolidating or merging with, or acquiring, another business;
- •
- selling or otherwise disposing of our assets;
- •
- paying dividends and making other distributions to our stockholders;
- •
- entering into transactions with our affiliates; and
- •
- incurring capital expenditures in excess of limitations set within the agreement.
Our ability to comply with these covenants and other provisions of the Senior Credit Facility and the indentures governing the Senior Notes and the Senior Subordinated Notes may be affected by changes in our operating and financial performance, changes in general business and economic conditions, adverse regulatory developments or other events beyond our control. The breach of any of these covenants could result in a default under our debt, which could cause those and other obligations to become immediately due and payable. In addition, these restrictions may prevent us from taking actions that we believe would be in the best interest of our business and may make it difficult for us to successfully execute our business strategy or effectively compete with companies that are not similarly restricted.
We depend on the services of key executives and changes in our management team could affect our business strategy and adversely impact our performance and results of operations.
Our senior executives are important to our success because they have been instrumental in setting our strategic direction, operating our business, identifying, recruiting and training key personnel, identifying opportunities and arranging necessary financing. Losing the services of any of these individuals could adversely affect our business until a suitable replacement is hired. We believe that our senior executives could not be replaced quickly with executives of equal experience and capabilities. We do not maintain key person life insurance policies on any of our executives.
If our risk management methods are not effective, our business, reputation and financial results may be adversely affected.
We have methods to identify, monitor and manage our risks; however, these methods may not be fully effective. Some of our risk management methods may depend upon evaluation of information regarding markets, customers or other matters that are publicly available or otherwise accessible by us. That information may not in all cases be accurate, complete, up-to-date or properly evaluated. If our methods are not fully effective or we are not successful in monitoring or evaluating the risks to which we are or may be exposed, our business, reputation, financial condition and operating results could be materially and adversely affected. In addition, our insurance policies may not provide adequate coverage.
26
Compliance with new and existing governmental regulations could increase our costs significantly and adversely affect our results of operations.
The processing, formulation, manufacturing, packaging, labeling, advertising and distribution of our products are subject to federal laws and regulation by one or more federal agencies, including the FDA, the FTC, the Consumer Product Safety Commission, the USDA and the EPA. These activities are also regulated by various state, local and international laws and agencies of the states and localities in which our products are sold. Government regulations may prevent or delay the introduction, or require the reformulation, of our products, which could result in lost revenues and increased costs to us. For instance, the FDA regulates, among other things, the composition, safety, labeling and marketing of dietary supplements (including vitamins, minerals, herbs and other dietary ingredients for human use). The FDA may not accept the evidence of safety for any new dietary ingredient that we may wish to market, may determine that a particular dietary supplement or ingredient presents an unacceptable health risk, and may determine that a particular claim or statement of nutritional value that we use to support the marketing of a dietary supplement is an impermissible drug claim, is not substantiated, or is an unauthorized version of a "health claim". See "Business — Government Regulation — Product Regulation" for additional information. Any of these actions could prevent us from marketing particular dietary supplement products or making certain claims or statements with respect to those products. The FDA could also require us to remove a particular product from the market. Any future recall or removal would result in additional costs to us, including lost revenues from any products that we are required to remove from the market, any of which could be material. Any product recalls or removals could also lead to liability, substantial costs and reduced growth prospects.
Additional or more stringent regulations of dietary supplements and other products have been considered from time to time. These developments could require reformulation of some products to meet new standards, recalls or discontinuance of some products not able to be reformulated, additional record keeping requirements, increased documentation of the properties of some products, additional or different labeling, additional scientific substantiation, adverse event reporting or other new requirements. Any of these developments could increase our costs significantly. The FDA has announced that it plans to publish a guidance governing the notification of new dietary ingredients. Although FDA guidance is not mandatory, it is a strong indication of the FDA's current views on the topic discussed in the guidance, including its position on enforcement. Depending on its recommendations, particularly those relating to animal or human testing, such guidance could also raise our costs and negatively impact our business in several ways, including the potential that the FDA might seek to enjoin the manufacturing of our products because of violation of the GMP regulations until the FDA determines that we are in compliance and can resume manufacturing. We may not be able to comply with the new rules without incurring additional expenses, which could be significant. For example, the Dietary Supplement Safety Act (S 3002) was introduced in February 2010 and contains many restrictive provisions on the sale of dietary supplements, including, but not limited to, provisions that limit the dietary ingredients acceptable for use in dietary supplements, increased fines for violations of the DSHEA, and increased registration and reporting requirements with the FDA. If reintroduced and enacted, this bill could severely restrict the number of dietary supplements available for sale and increase our costs and potential penalties associated with selling dietary supplements.
Our failure to comply with FTC regulations and existing consent decrees imposed on us by the FTC could result in substantial monetary penalties and could adversely affect our operating results.
The FTC exercises jurisdiction over the advertising of dietary supplements and has instituted numerous enforcement actions against dietary supplement companies, including us, for failure to
27
have adequate substantiation for claims made in advertising or for the use of false or misleading advertising claims. As a result of these enforcement actions, we are currently subject to three consent decrees that limit our ability to make certain claims with respect to our products and required us in the past to pay civil penalties and other amounts in the aggregate amount of $3.0 million. See "Business — Government Regulation — Product Regulation" for more information. Failure by us or our franchisees to comply with the consent decrees and applicable regulations could occur from time to time. Violations of these orders could result in substantial monetary penalties, which could have a material adverse effect on our financial condition or results of operations.
We may incur material product liability claims, which could increase our costs and adversely affect our reputation, revenues, and operating income.
As a retailer, distributor and manufacturer of products designed for human consumption, we are subject to product liability claims if the use of our products is alleged to have resulted in injury. Our products consist of vitamins, minerals, herbs and other ingredients that are classified as foods or dietary supplements and are not subject to pre-market regulatory approval in the United States. Our products could contain contaminated substances, and some of our products contain ingredients that do not have long histories of human consumption. Previously unknown adverse reactions resulting from human consumption of these ingredients could occur.
In addition, third-party manufacturers produce many of the products we sell. As a distributor of products manufactured by third parties, we may also be liable for various product liability claims for products we do not manufacture. Although our purchase agreements with our third-party vendors typically require the vendor to indemnify us to the extent of any such claims, any such indemnification is limited by its terms. Moreover, as a practical matter, any such indemnification is dependent on the creditworthiness of the indemnifying party and its insurer, and the absence of significant defenses by the insurers. We may be unable to obtain full recovery from the insurer or any indemnifying third party in respect of any claims against us in connection with products manufactured by such third party.
We have been and may be subject to various product liability claims, including, among others, that our products include inadequate instructions for use or inadequate warnings concerning possible side effects and interactions with other substances. For example, as of December 31, 2010, there were 50 pending lawsuits related to Hydroxycut in which GNC had been named, including 44 individual, largely personal injury claims and six putative class action cases. See "Business — Legal Proceedings". Any product liability claim against us could result in increased costs and could adversely affect our reputation with our customers, which in turn could adversely affect our revenues and operating income.
We may experience product recalls, which could reduce our sales and margin and adversely affect our results of operations.
We may be subject to product recalls, withdrawals or seizures if any of the products we formulate, manufacture or sell are believed to cause injury or illness or if we are alleged to have violated governmental regulations in the manufacturing, labeling, promotion, sale or distribution of such products. For example, in May 2009, the FDA warned consumers to stop using Hydroxycut diet products, which are produced by Iovate Health Sciences, Inc. ("Iovate") and were sold in our stores. Iovate issued a voluntary recall, with which we fully complied. Sales of the recalled Hydroxycut products amounted to approximately $57.8 million, or 4.7% of our retail sales in 2008, and $18.8 million, or 4.2% of our retail sales in the first four months of 2009. We provided refunds or gift cards to consumers who returned these products to our stores. In the second quarter of 2009, we experienced a reduction in sales and margin due to this recall as a result of accepting
28
returns of products from customers and a loss of sales as a replacement product was not available. Through December 31, 2010, we estimate that we have refunded approximately $3.5 million to our retail customers and approximately $1.6 million to our wholesale customers for Hydroxycut product returns. Our results of operations may continue to be affected by the Hydroxycut recall. Any additional recall, withdrawal or seizure of any of the products we formulate, manufacture or sell would require significant management attention, would likely result in substantial and unexpected expenditures and could materially and adversely affect our business, financial condition or results of operations. Furthermore, a recall, withdrawal or seizure of any of our products could materially and adversely affect consumer confidence in our brands and decrease demand for our products.
Our operations are subject to environmental and health and safety laws and regulations that may increase our cost of operations or expose us to environmental liabilities.
Our operations are subject to environmental and health and safety laws and regulations, and some of our operations require environmental permits and controls to prevent and limit pollution of the environment. We could incur significant costs as a result of violations of, or liabilities under, environmental laws and regulations, or to maintain compliance with such environmental laws, regulations, or permit requirements. For example, in March 2008, the South Carolina DHEC requested that we investigate contamination associated with historical activities at our South Carolina facility. These investigations have identified chlorinated solvent impacts in soils and groundwater that extend offsite from our facility. We are continuing these investigations in order to understand the extent of these impacts and develop appropriate remedial measures for DHEC approval. At this stage of the investigation, however, it is not possible to accurately estimate the timing and extent of any remedial action that may be required, the ultimate cost of remediation or the amount of our potential liability.
In addition to the foregoing, we are subject to numerous federal, state, local, and foreign environmental and health and safety laws and regulations governing our operations, including the handling, transportation, and disposal of our non-hazardous and hazardous substances and wastes, as well as emissions and discharges from its operations into the environment, including discharges to air, surface water, and groundwater. Failure to comply with such laws and regulations could result in costs for remedial actions, penalties, or the imposition of other liabilities. New laws, changes in existing laws or the interpretation thereof, or the development of new facts or changes in their processes could also cause us to incur additional capital and operating expenditures to maintain compliance with environmental laws and regulations and environmental permits. We also are subject to laws and regulations that impose liability and cleanup responsibility for releases of hazardous substances into the environment without regard to fault or knowledge about the condition or action causing the liability. Under certain of these laws and regulations, such liabilities can be imposed for cleanup of previously owned or operated properties, or for properties to which substances or wastes that were sent in connection with current or former operations at its facilities. The presence of contamination from such substances or wastes could also adversely affect our ability to sell or lease our properties, or to use them as collateral for financing.
We are not insured for a significant portion of our claims exposure, which could materially and adversely affect our operating income and profitability.
We have procured insurance independently for the following areas: (1) general liability; (2) product liability; (3) directors and officers liability; (4) property insurance; (5) workers' compensation insurance; and (6) various other areas. In addition, although we believe that we will continue to be able to obtain insurance in these areas in the future, because of increased selectivity by insurance providers, we may only be able to obtain such insurance at increased rates and/or with reduced coverage levels. Furthermore, we are self-insured for other areas,
29
including: (1) medical benefits; (2) physical damage to our tractors, trailers, and fleet vehicles for field personnel use; and (3) physical damages that may occur at company owned stores. We are not insured for some property and casualty risks due to the frequency and severity of a loss, the cost of insurance, and the overall risk analysis. In addition, we carry product liability insurance coverage that requires us to pay deductibles/retentions with primary and excess liability coverage above the deductible/retention amount. Because of our deductibles and self-insured retention amounts, we have significant exposure to fluctuations in the number and severity of claims. We currently maintain product liability insurance with a retention of $3.0 million per claim with an aggregate cap on retained loss of $10.0 million. We could raise our deductibles/retentions, which would increase our already significant exposure to expense from claims. If any claim exceeds our coverage, we would bear the excess expense, in addition to our other self-insured amounts. If the frequency or severity of claims or our expenses increase, our operating income and profitability could be materially adversely affected. See "Business — Legal Proceedings".
Because we rely on our manufacturing operations to produce nearly all of the proprietary products we sell, disruptions in our manufacturing system or losses of manufacturing certifications could adversely affect our sales and customer relationships.
Our manufacturing operations produced approximately 35% of the products we sold for each of the years ended December 31, 2010 and 2009. Other than powders and liquids, nearly all of our proprietary products are produced in our manufacturing facility located in Greenville, South Carolina. During 2010, no one vendor supplied more than 10% of our raw materials. In the event any of our third-party suppliers or vendors becomes unable or unwilling to continue to provide raw materials in the required volumes and quality levels or in a timely manner, we would be required to identify and obtain acceptable replacement supply sources. If we are unable to identify and obtain alternative supply sources, our business could be adversely affected. Any significant disruption in our operations at our Greenville, South Carolina facility for any reason, including regulatory requirements, an FDA determination that the facility is not in compliance with GMPs, the loss of certifications, power interruptions, fires, hurricanes, war or other force of nature, could disrupt our supply of products, adversely affecting our sales and customer relationships.
An increase in the price and shortage of supply of key raw materials could adversely affect our business.
Our products are composed of certain key raw materials. If the prices of these raw materials were to increase significantly, it could result in a significant increase to us in the prices our contract manufacturers and third-party manufacturers charge us for our GNC-branded products and third-party products. Raw material prices may increase in the future and we may not be able to pass on such increases to our customers. A significant increase in the price of raw materials that cannot be passed on to customers could have a material adverse effect on our results of operations and financial condition. In addition, if we no longer are able to obtain products from one or more of our suppliers on terms reasonable to us or at all, our revenues could suffer. Events such as the threat of political or social unrest, or the perceived threat thereof, may also have a significant impact on raw material prices and transportation costs for our products. In addition, the interruption in supply of certain key raw materials essential to the manufacturing of our products may have an adverse impact on our suppliers' ability to provide us with the necessary products needed to maintain our customer relationships and an adequate level of sales.
30
A significant disruption to our distribution network or to the timely receipt of inventory could adversely impact sales or increase our transportation costs, which would decrease our profits.
We rely on our ability to replenish depleted inventory in our stores through deliveries to our distribution centers from vendors and then from the distribution centers or direct ship vendors to our stores by various means of transportation, including shipments by sea and truck. Unexpected delays in those deliveries or increases in transportation costs (including through increased fuel costs) could significantly decrease our ability to make sales and earn profits. In addition, labor shortages in the transportation industry or long-term disruptions to the national and international transportation infrastructure that lead to delays or interruptions of deliveries could negatively affect our business.
If we fail to protect our brand name, competitors may adopt trade names that dilute the value of our brand name, and prosecuting or defending infringement claims could cause us to incur significant expenses or prevent us from manufacturing, selling or using some aspect of our products, which could adversely affect our revenues and market share.
We have invested significant resources to promote our GNC brand name in order to obtain the public recognition that we have today. Because of the differences in foreign trademark laws concerning proprietary rights, our trademark may not receive the same degree of protection in foreign countries as it does in the United States. Also, we may not always be able to successfully enforce our trademark against competitors or against challenges by others. For example, third parties are challenging our "GNC Live Well" trademark in foreign jurisdictions. Our failure to successfully protect our trademark could diminish the value and effectiveness of our past and future marketing efforts and could cause customer confusion. This could in turn adversely affect our revenues and profitability.
We are currently and may in the future be subject to intellectual property litigation and infringement claims, which could cause us to incur significant expenses or prevent us from manufacturing, selling or using some aspect of our products. Claims of intellectual property infringement also may require us to enter into costly royalty or license agreements. However, we may be unable to obtain royalty or license agreements on terms acceptable to us or at all. Claims that our technology or products infringe on intellectual property rights could be costly and would divert the attention of management and key personnel, which in turn could adversely affect our revenues and profitability.
A substantial amount of our revenue is generated from our franchisees, and our revenues could decrease significantly if our franchisees do not conduct their operations profitably or if we fail to attract new franchisees.
As of December 31, 2010 and 2009, approximately 32% of our retail locations were operated by franchisees. Our franchise operations generated approximately 16.1% and 15.5% of our revenues for the years ended December 31, 2010 and 2009, respectively. Our revenues from franchise stores depend on the franchisees' ability to operate their stores profitably and adhere to our franchise standards. In the twelve months ended December 31, 2010, a net 48 domestic franchise stores were closed. The closing of franchise stores or the failure of franchisees to comply with our policies could adversely affect our reputation and could reduce the amount of our franchise revenues. These factors could have a material adverse effect on our revenues and operating income.
If we are unable to attract new franchisees or to convince existing franchisees to open additional stores, any growth in royalties from franchise stores will depend solely upon increases in revenues at existing franchise stores, which could be minimal. In addition, our ability to open
31
additional franchise locations is limited by the territorial restrictions in our existing franchise agreements as well as our ability to identify additional markets in the United States and other countries. If we are unable to open additional franchise locations, we will have to sustain additional growth internally by attracting new and repeat customers to our existing locations.
Franchisee support of our marketing and advertising programs is critical for our success.
The support of our franchisees is critical for the success of our marketing programs and other strategic initiatives we seek to undertake, and the successful execution of these initiatives will depend on our ability to maintain alignment with our franchisees. While we can mandate certain strategic initiatives through enforcement of our franchise agreements, we need the active support of our franchisees if the implementation of these initiatives is to be successful. In addition, our efforts to build alignment with franchisees may result in a delay in the implementation of our marketing and advertising programs and other key initiatives. Although we believe that our current relationships with our franchisees are generally good, there can be no assurance that our franchisees will continue to support our marketing programs and strategic initiatives. The failure of our franchisees to support our marketing programs and strategic initiatives could adversely affect our ability to implement our business strategy and could materially harm our business, results of operations and financial condition.
Our franchisees are independent operators and we have limited influence over their operations.
Our revenues substantially depend upon our franchisees' sales volumes, profitability and financial viability. However, our franchisees are independent operators and we cannot control many factors that impact the profitability of their stores. Pursuant to the franchise agreements, we can, among other things, mandate signage, equipment and hours of operation, establish operating procedures and approve suppliers, distributors and products. However, the quality of franchise store operations may be diminished by any number of factors beyond our control. Consequently, franchisees may not successfully operate stores in a manner consistent with our standards and requirements or standards set by federal, state and local governmental laws and regulations. In addition, franchisees may not hire and train qualified managers and other personnel. While we ultimately can take action to terminate franchisees that do not comply with the standards contained in our franchise agreements, any delay in identifying and addressing problems could harm our image and reputation, and our franchise revenues and results of operations could decline.
Franchise regulations could limit our ability to terminate or replace under-performing franchises, which could adversely impact franchise revenues.
Our franchise activities are subject to federal, state and international laws regulating the offer and sale of franchises and the governance of our franchise relationships. These laws impose registration, extensive disclosure requirements and bonding requirements on the offer and sale of franchises. In some jurisdictions, the laws relating to the governance of our franchise relationship impose fair dealing standards during the term of the franchise relationship and limitations on our ability to terminate or refuse to renew a franchise. We may, therefore, be required to retain an under-performing franchise and may be unable to replace the franchisee, which could adversely impact franchise revenues. In addition, we cannot predict the nature and effect of any future legislation or regulation on our franchise operations.
32
We have limited influence over the decision of franchisees to invest in other businesses or incur excessive indebtedness.
Our franchisees are independent operators and, therefore, we have limited influence over their ability to invest in other businesses or incur excessive indebtedness. In some cases, these franchisees have used the cash generated by their stores to expand their other businesses or to subsidize losses incurred by such businesses. Additionally, as independent operators, franchisees do not require our consent to incur indebtedness. Consequently, our franchisees have in the past, and may in the future, experience financial distress as a result of over leveraging. To the extent that our franchisees use the cash from their stores to subsidize their other businesses or experience financial distress, due to over-leverage or otherwise, it could negatively affect (1) our operating results as a result of delayed or reduced payments of royalties, advertising fund contributions and rents for properties we lease to them, (2) our future revenue, earnings and cash flow growth and (3) our financial condition. In addition, lenders that are adversely affected by franchisees who default on their indebtedness may be less likely to provide current or prospective franchisees necessary financing on favorable terms or at all.
If we cannot open new company owned stores on schedule and profitably, or if our new store formats are not successful, our planned future growth will be impeded, which would adversely affect sales.
Our growth is dependent on both increases in sales in existing stores and the ability to open profitable new stores. Increases in sales in existing stores are dependent on factors such as competition, store operations and other factors discussed in these Risk Factors. Our ability to timely open new stores and to expand into additional market areas depends in part on the following factors: the availability of attractive store locations; the absence of occupancy delays; the ability to negotiate acceptable lease terms; the ability to identify customer demand in different geographic areas; the hiring, training and retention of competent sales personnel; the effective management of inventory to meet the needs of new and existing stores on a timely basis; general economic conditions; and the availability of sufficient funds for expansion. Many of these factors are beyond our control. In addition, the costs associated with opening and operating our new store formats are higher than the costs associated with opening and operating our standard modern-design stores. Delays or failures in opening new stores, including our new store formats, or achieving lower than expected sales in new stores and new store formats, or drawing a greater than expected proportion of sales in new stores or new store formats from our existing stores, could materially adversely affect our growth and profitability. In addition, we may not anticipate all of the challenges imposed by the expansion of our operations and, as a result, may not meet our targets for opening new stores, remodeling or relocating stores or expanding profitably.
Some of our new stores may be located in areas where we have little or no meaningful experience or brand recognition. Those markets may have different competitive conditions, market conditions, consumer tastes and discretionary spending patterns than our existing markets, which may cause our new stores to be less successful than stores in our existing markets. Alternatively, many of our new stores will be located in areas where we have existing stores. Although we have experience in these markets, increasing the number of locations in these markets may result in inadvertent over-saturation of markets and temporarily or permanently divert customers and sales from our existing stores, thereby adversely affecting our overall financial performance.
Our operating results and financial condition could be adversely affected by the financial and operational performance of Rite Aid.
As of December 31, 2010, Rite Aid operated 2,003 GNC franchise "store-within-a-store" locations and has committed to open additional franchise "store-within-a-store" locations. Revenue
33
from sales to Rite Aid (including license fee revenue for new store openings) represented approximately 3.5% of total revenue for the year ended December 31, 2010. Any liquidity and operational issues that Rite Aid may experience could impair its ability to fulfill its obligations and commitments to us, which would adversely affect our operating results and financial condition.
Economic, political and other risks associated with our international operations could adversely affect our revenues and international growth prospects.
As of December 31, 2010, we had 169 company-owned Canadian stores and 1,437 international franchise stores in 46 countries. We derived 11.1% and 10.2% of our revenues for the years ended December 31, 2010 and 2009, respectively, from our international operations. As part of our business strategy, we intend to expand our international franchise presence. Our international operations are subject to a number of risks inherent to operating in foreign countries, and any expansion of our international operations will increase the effects of these risks. These risks include, among others:
- •
- political and economic instability of foreign markets;
- •
- foreign governments' restrictive trade policies;
- •
- inconsistent product regulation or sudden policy changes by foreign agencies or governments;
- •
- the imposition of, or increase in, duties, taxes, government royalties or non-tariff trade barriers;
- •
- difficulty in collecting international accounts receivable and potentially longer payment cycles;
- •
- difficulty of enforcing contractual obligations of foreign franchisees;
- •
- increased costs in maintaining international franchise and marketing efforts;
- •
- problems entering international markets with different cultural bases and consumer preferences;
- •
- fluctuations in foreign currency exchange rates; and
- •
- operating in new, developing or other markets in which there are significant uncertainties regarding the interpretation, application and enforceability of laws and regulations relating to contract and intellectual property rights.
Any of these risks could have a material adverse effect on our international operations and our growth strategy.
We may be unable to successfully expand our operations into China and other new markets.
If the opportunity arises, we may expand our operations into new and high-growth markets including, but not limited to, China. For example, we have commenced the process of product registrations and wholesale sales in China. However, there is no assurance that we will expand our operations in China and other markets in our desired time frame. To expand our operations into new markets, we may enter into business combination transactions, make acquisitions or enter into strategic partnerships, joint ventures or alliances, any of which may be material. We may enter into these transactions to acquire other businesses or products to expand our products or take advantage of new developments and potential changes in the industry. Although our Parent has entered into a non-binding term sheet with an affiliate of Bright Food (Group) Co., Ltd. ("BFG") to market and sell nutritional supplements in China through a joint venture, the definitive
34
documentation for the joint venture was not executed on the timeframe that we had expected and there can be no assurances that we will enter into a joint venture with BFG or any other party. Our lack of experience operating in new markets and our lack of familiarity with local economic, political and regulatory systems could prevent us from achieving the results that we expect on our anticipated timeframe or at all. If we are unsuccessful in expanding into new or high growth markets, it could adversely affect our operating results and financial condition.
Our network and communications systems are dependent on third-party providers and are vulnerable to system interruption and damage, which could limit our ability to operate our business and could have a material adverse effect on our business, financial condition or results of operations.
Our systems and operations and those of our third-party Internet service providers are vulnerable to damage or interruption from fire, flood, earthquakes, power loss, server failure, telecommunications and Internet service failure, acts of war or terrorism, computer viruses and denial-of-service attacks, physical or electronic breaches, sabotage, human error and similar events. Any of these events could lead to system interruptions, processing and order fulfillment delays and loss of critical data for us, our suppliers, or our Internet service providers, and could prevent us from processing customer purchases. Any significant interruption in the availability or functionality of our website or our customer processing, distribution, or communications systems, for any reason, could seriously harm our business, financial condition, and operating results. The occurrence of any of these factors could have a material adverse effect on our business, financial condition or results of operations.
Because we are dependent on third-party service providers for the implementation and maintenance of certain aspects of our systems and operations and because some of the causes of system interruptions may be outside of our control, we may not be able to remedy such interruptions in a timely manner, if at all. As we rely on our third-party service providers, computer and communications systems and the Internet to conduct our business, any system disruptions could have a material adverse effect on our business, financial condition or results of operations.
Privacy protection is increasingly demanding, and the introduction of electronic payment exposes us to increased risk of privacy and/or security breaches as well as other risks.
The protection of customer, employee, vendor, franchisee and other business data is critical to us. Federal, state, provincial and international laws and regulations govern the collection, retention, sharing and security of data that we receive from and about our employees, customers, vendors and franchisees. The regulatory environment surrounding information security and privacy has been increasingly demanding in recent years, and may see the imposition of new and additional requirements. Compliance with these requirements may result in cost increases due to necessary systems changes and the development of new processes to meet these requirements by us and our franchisees. In addition, customers and franchisees have a high expectation that we will adequately protect their personal information. If we or our service provider fail to comply with these laws and regulations or experience a significant breach of customer, employee, vendor, franchisee or other company data, our reputation could be damaged and result in an increase in service charges, suspension of service, lost sales, fines or lawsuits.
The use of credit payment systems makes us more susceptible to a risk of loss in connection with these issues, particularly with respect to an external security breach of customer information that we or third parties (including those with whom we have strategic alliances) under arrangements with us control. In the event of a security breach, theft, leakage, accidental release or other illegal activity with respect to employee, customer, vendor, franchisee third party, with whom we have strategic alliances or other company data, we could become subject to various claims, including
35
those arising out of thefts and fraudulent transactions, and may also result in the suspension of credit card services. This could harm our reputation as well as divert management attention and expose us to potentially unreserved claims and litigation. Any loss in connection with these types of claims could be substantial. In addition, if our electronic payment systems are damaged or cease to function properly, we may have to make significant investments to fix or replace them, and we may suffer interruptions in our operations in the interim. In addition, we are reliant on these systems, not only to protect the security of the information stored, but also to appropriately track and record data. Any failures or inadequacies in these systems could expose us to significant unreserved losses, which could result in an earnings and stock price decline. Our brand reputation would likely be damaged as well.
Complying with recently enacted healthcare reform legislation could increase our costs and have a material adverse effect on our business, financial condition or results of operations.
Recently enacted healthcare reform legislation could significantly increase our costs and have a material adverse effect on our business, financial condition and results of operations by requiring us either to provide health insurance coverage to our employees or to pay certain penalties for electing not to provide such coverage. Because these new requirements are broad, complex, subject to certain phase-in rules and may be challenged by legal actions in the coming months and years, it is difficult to predict the ultimate impact that this legislation will have on our business and operating costs. We cannot assure you that this legislation or any alternative version that may ultimately be implemented will not materially increase our operating costs. This legislation could also adversely affect our employee relations and ability to compete for new employees if our response to this legislation is considered less favorable than the responses or health benefits offered by employers with whom we compete for talent.
General economic conditions, including a prolonged weakness in the economy, may affect consumer purchases, which could adversely affect our sales and the sales of our business partners.
Our results, and those of our business partners to whom we sell, are dependent on a number of factors impacting consumer spending, including general economic and business conditions; consumer confidence; wages and employment levels; the housing market; consumer debt levels; availability of consumer credit; credit and interest rates; fuel and energy costs; energy shortages; taxes; general political conditions, both domestic and abroad; and the level of customer traffic within department stores, malls and other shopping and selling environments. Consumer product purchases, including purchases of our products, may decline during recessionary periods. A prolonged downturn or an uncertain outlook in the economy may materially adversely affect our business and our revenues and profits.
Natural disasters (whether or not caused by climate change), unusually adverse weather conditions, pandemic outbreaks, terrorist acts and global political events could cause permanent or temporary distribution center or store closures, impair our ability to purchase, receive or replenish inventory, or cause customer traffic to decline, all of which could result in lost sales and otherwise adversely affect our financial performance.
The occurrence of one or more natural disasters, such as hurricanes, fires, floods and earthquakes (whether or not caused by climate change), unusually adverse weather conditions, pandemic outbreaks, terrorist acts or disruptive global political events, such as civil unrest in countries in which our suppliers are located, or similar disruptions could adversely affect our operations and financial performance. To the extent these events result in the closure of one or more of our distribution centers, a significant number of stores, a manufacturing facility or our
36
corporate headquarters, or impact one or more of our key suppliers, our operations and financial performance could be materially adversely affected through an inability to make deliveries to our stores and through lost sales. In addition, these events could result in increases in fuel (or other energy) prices or a fuel shortage, delays in opening new stores, the temporary lack of an adequate work force in a market, the temporary or long-term disruption in the supply of products from some local and overseas suppliers, the temporary disruption in the transport of goods from overseas, delay in the delivery of goods to our distribution centers or stores, the temporary reduction in the availability of products in our stores and disruption to our information systems. These events also could have indirect consequences, such as increases in the cost of insurance, if they were to result in significant loss of property or other insurable damage.
Item 1B. Unresolved Staff Comments.
None.
As of December 31, 2010, there were 7,260 GNC store locations globally (including distribution centers where retail sales are made). In our Retail segment, all but one of our company-owned stores are located on leased premises that typically range in size from 1,000 to 2,000 square feet. In our Franchise segment, primarily all of our franchise stores in the United States and Canada are located on premises we lease and then sublease to our respective franchisees. All of our franchise stores in the remaining international markets are owned or leased directly by our franchisees. No single store is material to our operations.
37
As of December 31, 2010, our company-owned and franchise stores in the United States and Canada (excluding store-within-a-store locations) and our other international franchise stores consisted of:
United States and Canada
|
Company- Owned Retail |
Franchise
|
International
|
Franchise*
|
|||||||||
|---|---|---|---|---|---|---|---|---|---|---|---|---|---|
Alabama |
35 | 11 | Aruba | 1 | |||||||||
Alaska |
7 | 5 | Australia | 39 | |||||||||
Arizona |
53 | 6 | Azerbaijan | 1 | |||||||||
Arkansas |
22 | 4 | Bahamas | 3 | |||||||||
California |
230 | 125 | Bahrain | 3 | |||||||||
Colorado |
66 | 9 | Bolivia | 10 | |||||||||
Connecticut |
41 | 4 | Brunei | 2 | |||||||||
Delaware |
15 | 3 | Cayman Islands | 2 | |||||||||
District of Columbia |
6 | 1 | Chile | 137 | |||||||||
Florida |
222 | 96 | Costa Rica | 16 | |||||||||
Georgia |
92 | 45 | Cyprus | 3 | |||||||||
Hawaii |
21 | 0 | Dominican Republic | 19 | |||||||||
Idaho |
7 | 4 | El Salvador | 10 | |||||||||
Illinois |
103 | 45 | Ghana | 1 | |||||||||
Indiana |
57 | 22 | Guam | 1 | |||||||||
Iowa |
26 | 4 | Guatemala | 32 | |||||||||
Kansas |
26 | 6 | Honduras | 4 | |||||||||
Kentucky |
40 | 7 | Hong Kong | 57 | |||||||||
Louisiana |
40 | 11 | India | 39 | |||||||||
Maine |
8 | 0 | Indonesia | 40 | |||||||||
Maryland |
55 | 20 | Israel | 2 | |||||||||
Massachusetts |
60 | 5 | Kuwait | 5 | |||||||||
Michigan |
78 | 36 | Lebanon | 7 | |||||||||
Minnesota |
62 | 11 | Malaysia | 59 | |||||||||
Mississippi |
22 | 11 | Mexico | 382 | |||||||||
Missouri |
41 | 21 | Mongolia | 5 | |||||||||
Montana |
5 | 4 | Nigeria | 2 | |||||||||
Nebraska |
10 | 11 | Oman | 2 | |||||||||
Nevada |
20 | 10 | Pakistan | 6 | |||||||||
New Hampshire |
15 | 5 | Panama | 6 | |||||||||
New Jersey |
84 | 33 | Peru | 54 | |||||||||
New Mexico |
20 | 2 | Philippines | 35 | |||||||||
New York |
166 | 41 | Qatar | 5 | |||||||||
North Carolina |
99 | 24 | Saudi Arabia | 49 | |||||||||
North Dakota |
7 | 0 | Singapore | 60 | |||||||||
Ohio |
111 | 40 | South Korea | 151 | |||||||||
Oklahoma |
27 | 12 | Spain | 10 | |||||||||
Oregon |
25 | 5 | Taiwan | 34 | |||||||||
Pennsylvania |
153 | 31 | Thailand | 28 | |||||||||
Puerto Rico |
24 | 0 | Trinidad | 3 | |||||||||
Rhode Island |
14 | 1 | Turkey | 63 | |||||||||
South Carolina |
30 | 22 | Turks & Caicos | 1 | |||||||||
South Dakota |
5 | 0 | UAE | 7 | |||||||||
Tennessee |
42 | 25 | Venezuela | 37 | |||||||||
Texas |
199 | 83 | Vietnam | 2 | |||||||||
Utah |
27 | 4 | |||||||||||
Vermont |
4 | 0 | |||||||||||
Virginia |
85 | 20 | |||||||||||
Washington |
55 | 12 | |||||||||||
West Virginia |
20 | 3 | |||||||||||
Wisconsin |
60 | 3 | |||||||||||
Wyoming |
6 | 0 | |||||||||||
Canada |
169 | 2 | |||||||||||
Total |
2,917 | 905 | Total | 1,435 | |||||||||
- *
- includes distribution centers where retail sales are made
38
In our Manufacturing/Wholesale segment, we lease facilities for manufacturing, packaging, warehousing and distribution operations. We manufacture a majority of our proprietary products at an approximately 300,000 square-foot facility in Greenville, South Carolina. We also lease an approximately 630,000 square-foot complex located in Anderson, South Carolina, for packaging, materials receipt, lab testing, warehousing and distribution. Both the Greenville and Anderson facilities are leased on a long-term basis pursuant to "fee-in-lieu-of-taxes" arrangements with the counties in which the facilities are located, but we retain the right to purchase each of the facilities at any time during the lease for $1.00, subject to a loss of tax benefits. We lease an approximately 217,000 square-foot distribution center in Leetsdale, Pennsylvania and a 112,000 square-foot distribution center in Phoenix, Arizona. We also lease space at a distribution center in Canada.
We lease three small regional sales offices in Fort Lauderdale, Florida; Tustin, California; and Mississauga, Ontario. None of the regional sales offices is larger than 6,500 square feet. Our 253,000 square-foot corporate headquarters in Pittsburgh, Pennsylvania, is owned by Gustine Sixth Avenue Associates, Ltd., a Pennsylvania limited partnership, of which we are a limited partner entitled to share in 75% of the partnership's profits or losses. The partnership's ownership of the land and buildings, and the partnership's interest in the ground lease to us, are all encumbered by a mortgage in the original principal amount of $17.9 million, with an outstanding balance of $5.7 million as of December 31, 2010. This partnership is included in our consolidated financial statements.
We are engaged in various legal actions, claims and proceedings arising in the normal course of business, including claims related to breach of contracts, products liabilities, intellectual property matters and employment-related matters resulting from our business activities. As with most actions such as these, an estimation of any possible and/or ultimate liability cannot always be determined. We continue to assess the requirement to account for additional contingencies in accordance with the standard on contingencies. If we are required to make a payment in connection with an adverse outcome in these matters, it could have a material impact on our financial condition and operating results.
As a manufacturer and retailer of nutritional supplements and other consumer products that are ingested by consumers or applied to their bodies, we have been and are currently subjected to various product liability claims. Although the effects of these claims to date have not been material to us, it is possible that current and future product liability claims could have a material adverse impact on our business or financial condition. We currently maintain product liability insurance with a deductible/retention of $3.0 million per claim with an aggregate cap on retained loss of $10.0 million. We typically seek and have obtained contractual indemnification from most parties that supply raw materials for our products or that manufacture or market products we sell. We also typically seek to be added, and have been added, as an additional insured under most of such parties' insurance policies. We are also entitled to indemnification by Numico for certain losses arising from claims related to products containing ephedra or Kava Kava sold prior to December 5, 2003. However, any such indemnification or insurance is limited by its terms and any such indemnification, as a practical matter, is limited to the creditworthiness of the indemnifying party and its insurer, and the absence of significant defenses by the insurers. We may incur material products liability claims, which could increase our costs and adversely affect our reputation, revenues and operating income.
Hydroxycut Claims. On May 1, 2009, the FDA issued a warning on several Hydroxycut-branded products manufactured by Iovate. The FDA warning was based on 23 reports of liver injuries from consumers who claimed to have used the products between 2002 and 2009. As a result, Iovate voluntarily recalled 14 Hydroxycut-branded products. Following the recall, GNC was
39
named, among other defendants, in approximately 60 lawsuits related to Hydroxycut-branded products in 13 states. Iovate previously accepted GNC's tender request for defense and indemnification under its purchasing agreement with GNC and, as such, Iovate has accepted GNC's request for defense and indemnification in the Hydroxycut matters. GNC's ability to obtain full recovery in respect of any claims against GNC in connection with products manufactured by Iovate under the indemnity is dependent on Iovate's insurance coverage, the creditworthiness of its insurer, and the absence of significant defenses by such insurer. To the extent GNC is not fully compensated by Iovate's insurer, it can seek recovery directly from Iovate. GNC's ability to fully recover such amounts may be limited by the creditworthiness of Iovate.
As of December 31, 2010, there were 50 pending lawsuits related to Hydroxycut in which GNC had been named: 44 individual, largely personal injury claims and six putative class action cases, generally inclusive of claims of consumer fraud, misrepresentation, strict liability and breach of warranty. Of the 130 individual plaintiffs in the lawsuits, three have asserted specific damage claims; two claims range from $50,000 to $75,000 (excluding costs and interest), and one claim asserts $5 million of actual and compensatory damages and $10 million of treble and/or punitive damages.
The following 44 personal injury matters were filed by individuals claiming injuries from use and consumption of Hydroxycut-branded products:
- •
- Christopher and Dana Hamilton v. Iovate Health Sciences USA, Inc., et al., U.S. District Court, Northern District
of Ohio, 09CV1944 (filed August 18, 2009);
- •
- Hector Manuel Abarca and Diana Curiel v. Iovate Health Sciences USA, Inc., et al., U.S. District Court, Northern
District of California, 09CV3861 (filed August 21, 2009);
- •
- Jessica Rogoff v. General Nutrition Centers, Inc., et al., Superior Court of the State of California, County of Los
Angeles, BC422842 (filed September 29, 2009);
- •
- Lucretia Ballou v. Muscletech Research and Development, Inc., et al., U.S. District Court, Western District of
Louisiana, 09CV1996 (filed December 3, 2009);
- •
- Clinton Davis v. GNC Corporation, et al., U.S. District Court, Eastern District of Pennsylvania, 09CV5055 (filed
November 11, 2009);
- •
- Michael Fyalka v. Iovate Health Sciences, et al., U.S. District Court, Southern District of Illinois, 09CV944 (filed
November 10, 2009);
- •
- Monica Fay Stepter v. Iovate Health Sciences, USA, Inc., et al., 17th Judicial District Court,
Parish of LaFourche, Louisiana (filed November 25, 2009);
- •
- Andrew Nolley v. Muscletech Research and Development, et al., U.S. District Court, Northern District of Mississippi,
09CV140 (filed December 18, 2009);
- •
- Kerry Donald v. Iovate Health Sciences Group, et al., Supreme Court of the State of New York, Kings County (filed
January 22, 2010);
- •
- Casey Slyter v. GNC Corporation, et al., U.S. District Court, District of Kansas, 10CV2065 (filed January 29,
2010);
- •
- Debra Rutherford, et al. v. Muscletech Research and Development, Inc., U.S. District Court, Northern District of
Alabama, 10CV370 (filed February 19, 2010);
- •
- Amber Lutz, et al. v. General Nutrition Centers, Inc., et al., Superior Court of California, County of Orange,
30-2010 00357532 (filed March 26, 2010);
- •
- Shannon Justers, et al. v. General Nutrition Centers, Inc., et al., Superior Court of California, County of Orange, 30-2010 00357521 (filed March 26, 2010);
40
- •
- William Crowell, et al. v. General Nutrition Centers, Inc., et al., Superior Court of California, County of Orange,
30-2010 00357528 (filed March 26, 2010);
- •
- Scott Rosenthal, et al. v. General Nutrition Centers, Inc., et al., Superior Court of California, County of San
Francisco, CGC 10-498138 (filed March 26, 2010);
- •
- Richard Limpert, et al. v. General Nutrition Centers, Inc., et al., Superior Court of California, County of San
Francisco, CGC 10-498137 (filed March 26, 2010);
- •
- Savoen Roeun, et al. v. General Nutrition Centers, Inc., et al., Superior Court of California, County of San
Francisco, CGC 10-497919 (filed March 19, 2010);
- •
- Phillip Sims v. GNC Corporation, et al., U.S. District Court, District of New Jersey, 10CV1728 (filed April 5,
2010);
- •
- Donna Natali v. GNC Corporation, et al., Superior Court of New Jersey, Atlantic County,
ATL-L-001499-10 (filed April 5, 2010);
- •
- Matthew Carhart v. GNC Corporation, et al., Court of Common Pleas Philadelphia County, 10-0402210 (filed
April 15, 2010);
- •
- Michael Brown v. GNC Corporation, et al., Court of Common Pleas Philadelphia County, 10-0402217 (filed
April 15, 2010);
- •
- Alan D'Alessio, Jr. v. GNC Corporation, et al., Court of Common Pleas Philadelphia County, 10-0402214 (filed
April 15, 2010);
- •
- Ralph Lewis v. GNC Corporation, et al., Court of Common Pleas Philadelphia County, 10-0601213 (filed
June 14, 2010);
- •
- Brett Hallinan v. GNC Corporation, et al., Superior Court of New Jersey, Atlantic County, Case No. L00264610 (filed
June 21, 2010);
- •
- Steve Snow v. General Nutrition Centers, Inc., et al., U.S. District Court, Western District of Kentucky, 10CV78
(filed April 29, 2010);
- •
- Anthony Polk, et al. v. General Nutrition Centers, Inc., et al., Superior Court of California, County of Orange,
30-2010 00366003 (filed April 23, 2010);
- •
- Jeff Kendall, et al. v. General Nutrition Centers, Inc., et al., Superior Court of California, County of Orange,
30-2010 00361004 (filed April 8, 2010);
- •
- Victor Rendon and Edwin Soto v. General Nutrition Centers, Inc., et al., Superior Court of California, County of
Orange, 30-2010 00365988 (filed April 23, 2010);
- •
- Ziomara Taveras, et al. v. General Nutrition Centers, Inc., et al., Superior Court of California, County of Orange,
30-2010 00367623 (filed April 29, 2010);
- •
- Kristina Vidrine v. GNC Corporation, et al., Court of Common Pleas Philadelphia County,10-040463 (filed
April 29, 2010);
- •
- Nicole Addison, et al. v. GNC Corporation, et al., Superior Court of California, County of Orange,
30-2010-00395135-CU-PL-CXC (filed July 30, 2010);
- •
- Wilbert Rankin, et al. v. GNC Corporation, et al., U.S. District Court, Northern District of Alabama, 10CV2361 (filed
August 31, 2010);
- •
- Steven Goldstein, et al. v. Iovate Health Sciences Group, et al., Superior Court of California, County of Los Angeles, BC445525 (filed September 16, 2010);
41
- •
- Andrea Saunders v. GNC Corporation, et al., Court of Common Pleas Philadelphia County, 10-0603308 (Amended
Complaint filed on or after August 18, 2010);
- •
- Miguel Rivera v. Iovate Health Sciences Group, et al., Superior Court of California, County of Orange,
30-2010-00411926-CU-PL-CXC (filed September 27, 2010);
- •
- Velma J. Carter, et al. v. Muscletech Research and Development, Inc., et al., U.S. District Court, Northern
District of Alabama, 10CV2655 (filed September 27, 2010);
- •
- Lloyd Eagan v. Iovate Health Science, Inc., et al., Superior Court of New Jersey, Middlesex County, Case No.
L7295-10 (filed September 30, 2010);
- •
- Barbra Muza v. General Nutrition Centers, Inc., Court of Common Pleas Allegheny County,
GD-10-21510 (filed November 18, 2010);
- •
- Carla M. Benson GNC Corporation, et al., Court of Common Pleas Philadelphia County, 10-1104602 (filed
December 3, 2010);
- •
- Michael Moran, et al. v. Iovate Health Sciences Group, et al., Superior Court of California, County of Los Angeles,
BC449590; (filed November 16, 2010);
- •
- Diego Carlos, et al. v. Iovate Health Sciences Group, et al., Superior Court of California, County of Los Angeles,
BC452019; (filed December 29, 2010);
- •
- Jonathan Pugh, et al. v. Muscletech Research and Development, Inc., et al., U.S. District Court, Northern District
of Alabama, 10CV3611 (filed December 29, 2010);,
- •
- Maurice Harris v. Iovate Health Sciences, et al., U.S. District Court, Southern District of New York, 10CV9698 (filed
December 30, 2010); and,
- •
- Marek Kosciesza v. GNC Corporation, et al., Superior Court of New Jersey, Atlantic County, L-13-11mt (filed December 28, 2010).
The following six putative class actions generally include claims of consumer fraud, misrepresentation, strict liability and breach of warranty:
- •
- Andrew Dremak, et al. v. Iovate Health Sciences Group, Inc., et al., U.S. District Court, Southern District of
California, 09CV1088 (filed May 19, 2009);
- •
- Enjoli Pennier, et al. v. Iovate Health Sciences, et al., U.S. District Court, Eastern District of Louisiana, 09CV3533
(filed May 13, 2009);
- •
- Alejandro M. Jimenez, et al. v. Iovate Health Sciences, Inc., et al., U.S. District Court, Eastern District of
California, 09CV1473 (filed May 28, 2009);
- •
- Amy Baker, et al. v. Iovate Health Sciences USA, Inc., et al., U.S. District Court, Northern District of Alabama,
09CV872 (filed May 4, 2009);
- •
- Kyle Davis and Sara Carreon, et al. v. Iovate Health Sciences USA, Inc., et al., U.S. District Court, Northern
District of Alabama, 09CV896 (filed May 7, 2009); and
- •
- Lenny Charles Gunn, Tonya Rhoden, and Nicholas Atelevich, et al., v. Iovate Health Sciences Group, Inc., et al., U.S. District Court, Southern District of California, 09CV2337 (filed October 24, 2009).
By court order dated October 6, 2009, the United States Judicial Panel on Multidistrict Litigation consolidated pretrial proceedings of many of the pending actions (including the above-listed GNC class actions) in the Southern District of California (In re: Hydroxycut Marketing and Sales Practices Litigation, MDL No. 2087). Any liabilities that may arise from these matters are not probable or reasonably estimable at this time.
42
Item 4. [Removed and Reserved]
None.
Item 5. Market for Registrant's Common Equity, Related Stockholder Matters and Issuer Purchases of Securities.
There is no established public trading market for our common stock. As of February 25, 2011, 100 shares of our Common Stock were outstanding, all of which are held by GNC Corporation. As of December 31, 2010, there was one holder of our common stock and there were 41 holders of our Parent's common stock. See Item 12, "Security Ownership of Certain Beneficial Owners and Management and Related Stockholder Matters" included in this report.
Dividends
In March 2010, our board of directors declared a $28.4 million dividend to GNC Corporation with a payment date of March 23, 2010. In July 2009, our board of directors declared a $13.6 million dividend to GNC Corporation with a payment date of August 30, 2009. Holdings was the final recipient of these dividends. The dividends were paid with cash generated from operations.
Any dividends that we may pay in the future will be subject to the determination and approval of our board of directors. We are subject to certain restrictions on our ability to pay dividends under the terms of the Senior Credit Facility, Senior Notes and Senior Subordinated Notes.
Securities Authorized for Issuance under Equity Compensation Plans
Upon completion of the Merger, our Parent adopted the GNC Acquisition Holdings Inc. 2007 Stock Incentive Plan (the "2007 Stock Plan"). The purpose of the 2007 Stock Plan is to enable us to attract and retain highly qualified personnel who will contribute to our success. The 2007 Stock Plan provides for the granting of stock options, restricted stock and other stock-based awards. The 2007 Stock Plan is available to certain eligible employees, directors, consultants or advisors as determined by the administering committee of our Parent's board of directors. The total number of shares of our Parent's Class A common stock reserved and available under the 2007 Stock Plan is 10,419,178 shares. Stock options under the 2007 Stock Plan generally are granted with exercise prices at or above fair market value, typically vest over a four or five-year period and expire ten years from the date of grant. No stock appreciation rights, restricted stock, deferred stock or performance shares have been granted under the 2007 Stock Plan.
Plan category
|
Number of securities to be issued upon exercise of outstanding options warrants and rights |
Weighted-average exercise price of outstanding options, warrants and rights |
Number of securities remaining available for future issuance under equity compensation plans (excluding securities reflected in the first column) |
|||||||
|---|---|---|---|---|---|---|---|---|---|---|
Equity compensation plans approved by security holders |
9,344,188 | (1) | $ | 7.60 | 1,057,168 | |||||
Equity compensation plans not approved by security holders |
6,375 |
$ |
5.00 |
(2) |
— |
|||||
- (1)
- Consists
of options to purchase shares of our Parent's Class A common stock granted pursuant to the GNC Acquisition Holdings Inc. 2007 Stock
Incentive Plan.
- (2)
- Plus accrued and unpaid dividends through the date of exercise.
43
On September 1, 2009, David Berg joined the Company as its Executive Vice President of Global Business Development and Chief Operating Officer, International. In connection with his employment, our Parent's compensation committee granted Mr. Berg certain options (the "Preferred Stock Options") to purchase 12,750 shares of our Parent's Series A preferred stock pursuant to the terms of a preferred stock option agreement (the "Preferred Stock Option Agreement"). The Preferred Stock Options are not governed by the 2007 Stock Plan, and the grant was not approved by our or our Parent's security holders. The Preferred Stock Options have an exercise price equal to $5.00 per share (plus accrued and unpaid dividends through the date of exercise). A portion of the Preferred Stock Options vested on the first anniversary of his employment. The balance vests on the second anniversary; provided that Mr. Berg is permitted to exercise his vested Preferred Stock Options only within the seven day period following each vesting date. If Mr. Berg does not exercise his vested Preferred Stock Options within such exercise period, then such vested Preferred Stock Options terminate and expire. See Item 11, "Executive Compensation — Employment and Separation Agreements".
On September 8, 2010, pursuant to the terms of the Preferred Stock Option Agreement, Mr. Berg exercised options to purchase 4,749 shares of our Parent's Series A preferred stock at an exercise price of $5.00 per share plus accrued and unpaid dividends through September 7, 2010 for an aggregate purchase price of $33,480.
Item 6. Selected Financial Data.
The selected consolidated financial data presented below as of December 31, 2010 and 2009 and for the years ended December 31, 2010, 2009 and 2008 are derived from our audited consolidated financial statements and footnotes included in this report. The selected consolidated financial data presented below as of December 31, 2007 and 2006, and for the periods from March 16, 2007 to December 31, 2007 (the "2007 Successor Period" and, collectively with the years ended December 31, 2010, 2009 and 2008, the "Successor Periods") and from January 1, 2007 to March 15, 2007, and for the year ended December 31, 2006, are derived from our audited consolidated financial statements and footnotes, which are not included in this report. The selected consolidated financial data as of December 31, 2006 and for the period January 1, 2007 to March 15, 2007 and for the year ended December 31, 2006 represent the period during which GNC Parent Corporation was owned by an investment fund managed by Apollo Management V, L.P. ("Apollo").
Holdings, together with its wholly owned subsidiary, GNC Acquisition Inc., entered into the Merger Agreement with GNC Parent Corporation on February 8, 2007. On March 16, 2007, the Merger was consummated. As a result of the Merger, the consolidated statement of operations for the successor period includes the following: interest and amortization expense resulting from the issuance of the Senior Notes and the Senior Subordinated Notes; and amortization of intangible assets related to the Merger. Further, as a result of purchase accounting, the fair values of our assets on the date of the Merger became their new cost basis.
44
You should read the following financial information together with the information under Item 7, "Management's Discussion and Analysis of Financial Condition and Results of Operations" and our consolidated financial statements and their related notes.
| |
Successor |
|
Predecessor | |||||||||||||||||||
|---|---|---|---|---|---|---|---|---|---|---|---|---|---|---|---|---|---|---|---|---|---|---|
| |
Year Ended December 31, 2010 |
Year Ended December 31, 2009 |
Year Ended December 31, 2008 |
March 16- December 31, 2007 |
|
January 1- March 15, 2007 |
Year Ended December 31, 2006 |
|||||||||||||||
| |
|
(dollars in millions) |
|
|
|
|||||||||||||||||
| |
|
|
|
|
|
|
|
|||||||||||||||
| |
|
|
|
|
|
|
|
|||||||||||||||
Statement of Operations Data: |
||||||||||||||||||||||
Revenue |
||||||||||||||||||||||
Retail |
$ | 1,344.4 | $ | 1,256.3 | $ | 1,219.3 | $ | 909.3 | $ | 259.3 | $ | 1,122.7 | ||||||||||
Franchising |
293.8 | 264.2 | 258.0 | 193.9 | 47.2 | 232.3 | ||||||||||||||||
Manufacturing/Wholesale |
184.2 | 186.5 | 179.4 | 119.8 | 23.3 | 132.1 | ||||||||||||||||
Total revenue |
1,822.4 | 1,707.0 | 1,656.7 | 1,223.0 | 329.8 | 1,487.1 | ||||||||||||||||
Cost of sales, including costs of warehousing distribution and occupancy |
1,180.0 | 1,116.4 | 1,082.6 | 814.2 | 212.2 | 983.5 | ||||||||||||||||
Gross profit |
642.4 | 590.6 | 574.1 | 408.8 | 117.6 | 503.6 | ||||||||||||||||
Compensation and related benefits |
273.6 | 263.0 | 249.8 | 195.8 | 64.3 | 260.8 | ||||||||||||||||
Advertising and promotion |
51.4 | 50.0 | 55.1 | 35.0 | 20.5 | 50.7 | ||||||||||||||||
Other selling, general and administrative |
99.6 | 96.5 | 98.7 | 71.3 | 17.3 | 92.4 | ||||||||||||||||
Other (income) expense(1) |
(0.3 | ) | (0.1 | ) | 0.7 | (0.4 | ) | (0.1 | ) | 0.5 | ||||||||||||
Merger related costs |
— | — | — | — | 34.6 | — | ||||||||||||||||
Strategic alternative costs |
3.5 | — | — | — | — | — | ||||||||||||||||
Operating income (loss) |
214.6 | 181.2 | 169.8 | 107.1 | (19.0 | ) | 99.2 | |||||||||||||||
Interest expense, net |
65.5 | 70.0 | 83.0 | 75.5 | 43.0 | 39.6 | ||||||||||||||||
Income (loss) before income taxes |
149.1 | 111.2 | 86.8 | 31.6 | (62.0 | ) | 59.6 | |||||||||||||||
Income tax expense (benefit) |
50.9 | 41.6 | 32.0 | 12.6 | (10.7 | ) | 22.2 | |||||||||||||||
Net income (loss) |
$ | 98.2 | $ | 69.6 | $ | 54.8 | $ | 19.0 | $ | (51.3 | ) | $ | 37.4 | |||||||||
Balance Sheet Data: |
||||||||||||||||||||||
Cash and cash equivalents |
$ | 150.6 | $ | 75.1 | $ | 42.3 | $ | 28.9 | $ | 24.1 | ||||||||||||
Working capital(2) |
443.0 | 382.6 | 305.1 | 258.1 | 249.5 | |||||||||||||||||
Total assets |
2,382.5 | 2,303.6 | 2,292.0 | 2,239.6 | 968.8 | |||||||||||||||||
Total current and non-current long-term debt |
1,058.5 | 1,059.8 | 1,084.7 | 1,087.0 | 431.4 | |||||||||||||||||
Stockholder's equity |
796.4 | 717.5 | 652.1 | 608.7 | 312.3 | |||||||||||||||||
Statement of Cash Flows: |
||||||||||||||||||||||
Net cash provided by (used in) operating activities |
$ | 141.7 | $ | 114.0 | $ | 77.4 | $ | 92.0 | $ | (50.9 | ) | $ | 73.6 | |||||||||
Net cash used in investing activities |
(36.1 | ) | (42.2 | ) | (60.4 | ) | (1,671.4 | ) | (6.2 | ) | (23.4 | ) | ||||||||||
Net cash (used in) provided by financing activities |
(30.1 | ) | (39.3 | ) | (3.4 | ) | 1,598.7 | 42.8 | (112.2 | ) | ||||||||||||
Other Data: |
||||||||||||||||||||||
Capital expenditures(3) |
$ | 32.5 | $ | 28.7 | $ | 48.7 | $ | 28.9 | $ | 5.7 | $ | 23.8 | ||||||||||
Number of stores (at end of period) |
||||||||||||||||||||||
Company-owned stores(4) |
2,917 | 2,832 | 2,774 | 2,745 | 2,699 | 2,688 | ||||||||||||||||
Franchised stores(4) |
2,340 | 2,216 | 2,144 | 2,056 | 2,018 | 2,007 | ||||||||||||||||
Franchised store-within-a-store locations(4) |
2,003 | 1,869 | 1,712 | 1,358 | 1,266 | 1,227 | ||||||||||||||||
- (1)
- Other
(income) expense includes foreign currency (gain) loss for all of the periods presented. Other (income) expense for the year ended December 31,
2006 includes a $1.2 million loss on the sale of our Australian manufacturing facility.
- (2)
- Working
capital represents current assets less current liabilities.
- (3)
- Capital expenditures for the year ended December 31, 2008 include approximately $10.1 million incurred in conjunction with our store register upgrade program.
45
- (4)
- The following table summarizes our stores for the periods indicated:
| |
Successor |
|
Predecessor | |||||||||||||||||||
|---|---|---|---|---|---|---|---|---|---|---|---|---|---|---|---|---|---|---|---|---|---|---|
| |
Year Ended December 31, 2010 |
Year Ended December 31, 2009 |
Year Ended December 31, 2008 |
March 16- December 31, 2007 |
|
January 1- March 15, 2007 |
Year Ended December 31, 2006 |
|||||||||||||||
Company-owned stores |
||||||||||||||||||||||
Beginning of period balance |
2,832 | 2,774 | 2,745 | 2,699 | 2,688 | 2,650 | ||||||||||||||||
New store openings |
101 | 45 | 71 | 64 | 18 | 54 | ||||||||||||||||
Franchise conversions(a) |
24 | 53 | 33 | 44 | 17 | 80 | ||||||||||||||||
Store closings(b) |
(40 | ) | (40 | ) | (75 | ) | (62 | ) | (24 | ) | (96 | ) | ||||||||||
End of period balance |
2,917 | 2,832 | 2,774 | 2,745 | 2,699 | 2,688 | ||||||||||||||||
Franchised stores |
||||||||||||||||||||||
Domestic |
||||||||||||||||||||||
Beginning of period balance |
909 | 954 | 978 | 1,022 | 1,046 | 1,156 | ||||||||||||||||
Store openings(b) |
42 | 31 | 41 | 16 | 4 | 5 | ||||||||||||||||
Store closings(c) |
(48 | ) | (76 | ) | (65 | ) | (60 | ) | (28 | ) | (115 | ) | ||||||||||
End of period balance |
903 | 909 | 954 | 978 | 1,022 | 1,046 | ||||||||||||||||
International |
||||||||||||||||||||||
Beginning of period balance |
1,307 | 1,190 | 1,078 | 996 | 961 | 858 | ||||||||||||||||
Store openings |
232 | 187 | 198 | 115 | 44 | 169 | ||||||||||||||||
Store closings |
(102 | ) | (70 | ) | (86 | ) | (33 | ) | (9 | ) | (66 | ) | ||||||||||
End of period balance |
1,437 | 1,307 | 1,190 | 1,078 | 996 | 961 | ||||||||||||||||
Store-within-a-store (Rite Aid) |
||||||||||||||||||||||
Beginning of period balance |
1,869 | 1,712 | 1,358 | 1,266 | 1,227 | 1,149 | ||||||||||||||||
Store openings |
150 | 177 | 401 | 101 | 39 | 80 | ||||||||||||||||
Store closings |
(16 | ) | (20 | ) | (47 | ) | (9 | ) | (2 | ) | ||||||||||||
End of period balance |
2,003 | 1,869 | 1,712 | 1,358 | 1,266 | 1,227 | ||||||||||||||||
Total Stores |
7,260 | 6,917 | 6,630 | 6,159 | 5,983 | 5,922 | ||||||||||||||||
- (a)
- Stores
that were acquired from franchisees and subsequently converted into company-owned stores.
- (b)
- Includes
corporate store locations acquired by franchisees.
- (c)
- Includes franchise stores closed and acquired by us.
Item 7. Management's Discussion and Analysis of Financial Condition and Results of Operations.
You should read the following discussion in conjunction with Item 6, "Selected Financial Data" and our consolidated financial statements and the related notes thereto. The discussion in this section contains forward-looking statements that involve risks and uncertainties. See Item 1A, "Risk Factors" in this report for a discussion of important factors that could cause actual results to differ materially from those described or implied by the forward-looking statements contained herein. We urge you to review the information set forth in "Forward Looking Statements" and Item 1A, "Risk Factors" included elsewhere in this report.
Business Overview
We are a global specialty retailer of nutritional supplements, which include VMHS, sports nutrition products, diet products, and other wellness products. We derive our revenues principally from product sales through our company-owned stores and online through GNC.com, franchise activities, and sales of products manufactured in our facilities to third parties. We sell products through a worldwide network of more than 7,200 locations operating under the GNC brand name.
46
Revenues and Operating Performance from our Segments
We measure our operating performance primarily through revenues and operating income from our three segments, Retail, Franchise, and Manufacturing/Wholesale, and through the management of unallocated costs from our warehousing, distribution and corporate segments, as follows:
- •
- Retail: Retail revenues are generated by sales to
consumers at our company-owned stores and online through GNC.com. Although we believe that our retail and franchise businesses are not seasonal in nature, historically we have experienced, and expect
to continue to experience, a variation in our net sales and operating results from quarter to quarter, with the first half of the year being stronger than the second half of the year. According to
Nutrition Business Journal's Supplement Business Report 2010, our industry is expected to grow at an annual average rate of approximately 5.3% through 2015. As a leader in our industry, we expect our
organic retail revenue growth to be consistent with projected industry growth as a result of our disproportionate market share, scale economies in purchasing and advertising, strong brand awareness
and vertical integration.
- •
- Franchise: Franchise revenues are generated primarily
from:
- (1)
- product
sales to our franchisees;
- (2)
- royalties
on franchise retail sales; and
- (3)
- franchise fees, which are charged for initial franchise awards, renewals, and transfers of franchises.
As described above, our industry is expected to grow at an annual average rate of approximately 5.3% through 2015. Although we do not anticipate the number of our domestic franchise stores to grow substantially, we expect to achieve domestic franchise store revenue growth consistent with projected industry growth, which will be generated by royalties on franchise retail sales and product sales to our existing franchisees. As a result of our efforts to expand our international presence and provisions in our international franchising agreements requiring franchisees to open additional stores, we have increased our international store base in recent periods and expect to continue to increase the number of our international franchise stores over the next five years. We believe this will result in additional franchise fees associated with new store openings and increased revenues from product sales to, and royalties from, new franchisees. As our existing international franchisees continue to open additional stores, we also anticipate that franchise revenue from international operations will be driven by increased product sales to, and royalties from, our franchisees. Since our international franchisees pay royalties to us in U.S. dollars, any strengthening of the U.S. dollar relative to our franchisees' local currency may offset some of the growth in royalty revenue.
- •
- Manufacturing/Wholesale: Manufacturing/Wholesale revenues are generated through sales of manufactured products to third parties, generally for third-party private label brands, and the sale of our proprietary and third-party products to and through Rite Aid and www.drugstore.com, and the sale of our proprietary products to and through PetSmart. License fee revenue from the opening of GNC franchise store-within-a-store locations within Rite Aid stores is also recorded in this segment. Our revenues generated by our manufacturing and wholesale operations are subject to our available manufacturing capacity.
A significant portion of our business infrastructure is comprised of fixed operating costs. Our vertically-integrated distribution network and manufacturing capacity can support higher sales volume without significant incremental costs. We therefore expect our operating expenses to grow at a lesser rate than our revenues, resulting in positive operating leverage.
47
The following trends and uncertainties in our industry could affect our operating performance as follows:
- •
- broader consumer awareness of health and wellness issues and rising healthcare costs may increase the use of the products
we offer and positively affect our operating performance;
- •
- interest in, and demand for, condition-specific products based on scientific research may positively affect our operating
performance if we can timely develop and offer such condition specific products;
- •
- the effects of favorable and unfavorable publicity on consumer demand with respect to the products we offer may have
similarly favorable or unfavorable effects on our operating performance;
- •
- a lack of long-term experience with human consumption of ingredients in some of our products could create
uncertainties with respect to the health risks, if any, related to the consumption of such ingredients and negatively affect our operating performance;
- •
- increased costs associated with complying with new and existing governmental regulation may negatively affect our
operating performance; and
- •
- a decline in disposable income available to consumers may lead to a reduction in consumer spending and negatively affect our operating performance.
Executive Overview
Our recent results of operations reflect steady growth, including through a difficult economic environment and despite a short-term reduction in revenue that we experienced in 2009 due to the Hydroxycut recall. For the year ended December 31, 2010, we achieved revenue growth of 6.8%, operating income growth of 18.4% and net income growth of 41.0% compared to the same period in 2009. Operating income growth resulted from higher sales and margins in our retail and franchise segments and effective cost controls on unallocated expenses. Net income growth resulted primarily from higher operating income, lower interest expense, and a lower effective tax rate.
Recent revenue growth in our domestic retail segment has been driven primarily by increases in the sports nutrition category resulting from new product introductions. In addition, we have experienced significant growth in our GNC.com business primarily as a result of our redesigned website. Our domestic retail comparable store sales increased 5.6% in 2010 compared to 2009. Included in this increase is a 26.2% increase in our GNC.com business. In recent periods, our domestic franchise business has achieved increased product sales despite a lower store base. Sales in the international franchise business have grown steadily as a result of an increased store base and strong organic sales growth.
Our manufacturing strategy is designed to provide our stores with proprietary products at the lowest possible cost, and utilize additional capacity to promote production efficiencies and enhance our position in the third-party contract business. Under this strategy, our third-party manufacturing sales grew 3.8% and 38.7% in 2009 and 2008, respectively, over the prior year periods. For the year ended December 31, 2010, our manufacturing segment experienced reduced sales in contract manufacturing compared to 2009, partially offset by higher product sales to Rite Aid, www.drugstore.com and PetSmart. The reduction in the contract manufacturing business reflects a transition period during which we are moving from low margin commodity contracts to higher margin, specialty product contracts.
We also continue to invest in opportunities to expand our brand beyond our existing domestic company-owned footprint and partner with companies like PepsiCo and PetSmart to develop new
48
and innovative products. We believe that these ventures represent attractive growth opportunities. For the year ended December 31, 2010, we incurred $3.2 million of start up expenses related to agreements with PepsiCo, in connection with the development of a new brand of fortified coconut water called Phenom, and with PetSmart, in connection with the development, manufacture and distribution of nutritional supplements for pets.
In addition to the above, we incurred $3.5 million of non-recurring expenses, principally related to the exploration of strategic alternatives.
Related Parties
Management Services Agreement. Upon consummation of the Merger, we entered into a management services agreement with our Parent. Under the agreement, our Parent provides us and its subsidiaries with certain services in exchange for an annual fee of $1.5 million, as well as customary fees for services rendered in connection with certain major financial transactions, plus reimbursement of expenses and a tax gross-up relating to a non-tax deductible portion of the fee. For each of the years ended December 31, 2010 and 2009, $1.5 million was paid pursuant to this agreement.
Credit Facility. Upon consummation of the Merger, we entered into the Senior Credit Facility, under which various funds related to one of our sponsors, Ares, are lenders. Under the Senior Credit Facility, these affiliated funds have made term loans to us in the amount of $65.0 million and $62.1 million, as of the consummation of the Merger and December 31, 2010, respectively. In addition, as of December 31, 2010, an aggregate of $2.9 million in principal and $11.0 million in interest has been paid to affiliates of Ares in respect of amounts borrowed under the Senior Credit Facility. Borrowings under the Senior Credit Facility have accrued interest at a weighted average rate of 4.6% per year.
Proposed Refinancing. On February 7, 2011, we announced that we intend to enter into, subject to market and other conditions, the Refinancing. We currently expect to use the proceeds from the Refinancing, if consummated, to, among other things, refinance our existing indebtedness, including the term loans held by Ares. We currently expect to consummate the Refinancing in March 2011; however, there can be no assurance that we will complete the Refinancing either on terms acceptable to us or at all. See "Liquidity and Capital Resources — Cash Used in Financing Activities — Proposed Refinancing."
Lease Agreements. At December 31, 2010, General Nutrition Centres Company, a wholly owned subsidiary of us, was party to 19 lease agreements, as lessee, with Cadillac Fairview Corporation, a direct wholly owned subsidiary of OTPP, as lessor, with respect to properties located in Canada. For the years ended December 31, 2010, 2009 and 2008, we paid $2.8 million, $2.4 million and $2.5 million, respectively, under the lease agreements and as of December 31, 2010, the aggregate future minimum lease payments under the lease agreements was $19.3 million. Each lease was negotiated in the ordinary course of business on an arm's length basis.
Product Purchases. During our 2010 and 2009 fiscal years, we purchased certain fish oil and probiotics products manufactured by Lifelong Nutrition, Inc. ("Lifelong") for resale under our proprietary brand name GNC WELLbeING®. Carmen Fortino, who serves as one of our directors, was the Managing Director, a member of the board of directors and a stockholder of Lifelong's parent company. The aggregate value of the products we purchased from Lifelong was $2.3 and $3.3 million for the 2010 and 2009 fiscal years, respectively. Effective December 31, 2010, Lifelong's parent company was sold to a third party and Mr. Fortino resigned his positions at Lifelong.
Product Development and Distribution Agreement. On June 3, 2010, General Nutrition Corporation, a wholly owned subsidiary of us, and Lifelong entered into a Product Development
49
and Distribution Agreement (the "Lifelong Agreement"), pursuant to which General Nutrition Corporation and Lifelong will develop a branded line of supplements to be manufactured by Lifelong. As described above, Mr. Fortino was the Managing Director, a member of the board of directors and a stockholder of Lifelong's parent company. Products manufactured under the Lifelong Agreement and sold in our stores will be purchased by us from Lifelong; products sold outside of our stores will be subject to certain revenue sharing arrangements. For the year ended December 31, 2010, we made $1.3 million in product purchases from Lifelong under the Lifelong Agreement. Effective December 31, 2010, Lifelong's parent company was sold to a third party and Mr. Fortino resigned his positions at Lifelong.
Results of Operations
The following information presented as of December 31, 2010, 2009 and 2008 and for the years then ended was derived from our audited consolidated financial statements and accompanying notes.
The following information may contain financial measures other than in accordance with generally accepted accounting principles, and should not be considered in isolation from or as a substitute for our historical consolidated financial statements. In addition, the adjusted combined operating results may not reflect the actual results we would have achieved absent the adjustments and may not be predictive of future results of operations. We present this information because we use it to monitor and evaluate our ongoing operating results and trends, and believe it provides investors with an understanding of our operating performance over comparative periods.
As discussed in Note 19, "Segments", to our consolidated financial statements, we evaluate segment operating results based on several indicators. The primary key performance indicators are revenues and operating income or loss for each segment. Revenues and operating income or loss, as evaluated by management, exclude certain items that are managed at the consolidated level, such as warehousing and transportation costs, impairments, and other corporate costs. The following discussion compares the revenues and the operating income or loss by segment, as well as those items excluded from the segment totals.
Same store sales growth reflects the percentage change in same store sales in the period presented compared to the prior year period. Same store sales are calculated on a daily basis for each store and exclude the net sales of a store for any period if the store was not open during the same period of the prior year. We also include our internet sales, as generated through GNC.com and www.drugstore.com, in our domestic company-owned same store sales calculation. When a store's square footage has been changed as a result of reconfiguration or relocation in the same mall or shopping center, the store continues to be treated as a same store. If, during the period presented, a store was closed, relocated to a different mall or shopping center, or converted to a franchise store or a company-owned store, sales from that store up to and including the closing day or the day immediately preceding the relocation or conversion are included as same store sales as long as the store was open during the same period of the prior year. We exclude from the calculation sales during the period presented that occurred on or after the date of relocation to a different mall or shopping center or the date of a conversion.
50
Results of Operations
(Dollars in millions and percentages expressed as a percentage of total net revenues)
| |
Year Ended December 31, | ||||||||||||||||||||
|---|---|---|---|---|---|---|---|---|---|---|---|---|---|---|---|---|---|---|---|---|---|
| |
2010 | 2009 | 2008 | ||||||||||||||||||
Revenues: |
|||||||||||||||||||||
Retail |
$ | 1,344.4 | 73.8 | % | $ | 1,256.3 | 73.6 | % | $ | 1,219.3 | 73.6 | % | |||||||||
Franchise |
293.8 | 16.1 | % | 264.2 | 15.5 | % | 258.0 | 15.6 | % | ||||||||||||
Manufacturing/Wholesale: |
|||||||||||||||||||||
Intersegment revenues |
209.5 | 11.5 | % | 201.3 | 11.8 | % | 180.1 | 10.9 | % | ||||||||||||
Third Party |
184.2 | 10.1 | % | 186.5 | 10.9 | % | 179.4 | 10.8 | % | ||||||||||||
Subtotal Manufacturing/Wholesale |
393.7 | 21.6 | % | 387.8 | 22.7 | % | 359.5 | 21.7 | % | ||||||||||||
Intersegment elimination(1) |
(209.5 | ) | -11.5 | % | (201.3 | ) | -11.8 | % | (180.1 | ) | -10.9 | % | |||||||||
Total revenues |
1,822.4 | 100.0 | % | 1,707.0 | 100.0 | % | 1,656.7 | 100.0 | % | ||||||||||||
Operating expenses: |
|||||||||||||||||||||
Cost of sales, including warehousing, distribution and occupancy costs |
1,180.0 | 64.8 | % | 1,116.4 | 65.4 | % | 1,082.6 | 65.3 | % | ||||||||||||
Compensation and related benefits |
273.6 | 15.0 | % | 263.0 | 15.4 | % | 249.8 | 15.1 | % | ||||||||||||
Advertising and promotion |
51.4 | 2.8 | % | 50.0 | 2.9 | % | 55.1 | 3.3 | % | ||||||||||||
Other selling, general and administrative expenses |
91.8 | 5.0 | % | 86.7 | 5.1 | % | 87.8 | 5.3 | % | ||||||||||||
Strategic alternative costs |
3.5 | 0.2 | % | — | — | — | — | ||||||||||||||
Amortization expense |
7.8 | 0.4 | % | 9.8 | 0.6 | % | 10.9 | 0.7 | % | ||||||||||||
Foreign currency (gain) loss |
(0.3 | ) | — | (0.1 | ) | — | 0.7 | — | |||||||||||||
Transaction related costs |
— | 0.0 | % | — | 0.0 | % | — | 0.0 | % | ||||||||||||
Total operating expenses |
1,607.8 | 88.2 | % | 1,525.8 | 89.4 | % | 1,486.9 | 89.7 | % | ||||||||||||
Operating income: |
|||||||||||||||||||||
Retail |
181.9 | 10.0 | % | 153.1 | 9.0 | % | 140.9 | 8.5 | % | ||||||||||||
Franchise |
95.3 | 5.2 | % | 80.8 | 4.7 | % | 80.8 | 4.9 | % | ||||||||||||
Manufacturing/Wholesale |
69.4 | 3.8 | % | 73.5 | 4.3 | % | 67.4 | 4.1 | % | ||||||||||||
Unallocated corporate and other costs: |
|||||||||||||||||||||
Warehousing and distribution costs |
(55.0 | ) | -3.0 | % | (53.6 | ) | -3.1 | % | (54.2 | ) | -3.3 | % | |||||||||
Corporate costs |
(77.0 | ) | -4.4 | % | (72.6 | ) | -4.3 | % | (65.1 | ) | -3.9 | % | |||||||||
Merger related costs |
— | 0.0 | % | — | 0.0 | % | — | 0.0 | % | ||||||||||||
Subtotal unallocated corporate and other costs, net |
(132.0 | ) | -7.4 | % | (126.2 | ) | -7.4 | % | (119.3 | ) | -7.2 | % | |||||||||
Total operating income |
214.6 | 11.6 | % | 181.2 | 10.6 | % | 169.8 | 10.3 | % | ||||||||||||
Interest expense, net |
65.5 | 70.0 | 83.0 | ||||||||||||||||||
Income before income taxes |
149.1 | 111.2 | 86.8 | ||||||||||||||||||
Income tax expense |
50.9 | 41.6 | 32.0 | ||||||||||||||||||
Net income |
$ | 98.2 | $ | 69.6 | $ | 54.8 | |||||||||||||||
- (1)
- Intersegment revenues are eliminated from consolidated revenue.
Note: The numbers in the above table have been rounded to millions. All calculations related to the Results of Operations for the year-over-year comparisons below were derived from unrounded data and could occasionally differ immaterially if you were to use the table above for these calculations.
Comparison of the Years Ended December 31, 2010 and 2009
Revenues
Our consolidated net revenues increased $115.4 million, or 6.8%, to $1,822.4 million for the year ended December 31, 2010 compared to $1,707.0 million for the same period in 2009. The
51
increase was the result of increased sales in our Retail and Franchise segments, partially offset by a decline in our Manufacturing/Wholesale segment.
Retail. Revenues in our Retail segment increased $88.1 million, or 7.0%, to $1,344.4 million for the year ended December 31, 2010 compared to $1,256.3 million for the same period in 2009. Domestic retail revenue increased $64.8 million as a result of an increase in our same store sales and $17.1 million from our non-same store sales. The same store sales increase includes GNC.com revenue, which increased $12.2 million, or 26.2%, to $59.0 million, compared to $46.8 million in 2009. Sales increases occurred primarily in the vitamin and sports nutrition categories. Our domestic company-owned same store sales, including our internet sales, improved by 5.6% for the year ended December 31, 2010 compared to the same period in 2009. Canadian retail revenue increased by $6.1 million in U.S. dollars, primarily due to the weakening of the U.S. dollar from 2009 to 2010. In local currency, Canadian retail revenue declined by CAD $3.3 million. This decline was primarily a result of a CAD $5.6 million, or 5.7%, decline in company owned same store sales, partially offset by an increase of CAD $2.3 million in non-same store sales. Our company-owned store base increased by 83 domestic stores to 2,748 compared to 2,665 at December 31, 2009, primarily due to new store openings and franchise store acquisitions, and by 2 Canadian stores to 169 at December 31, 2010 compared to 167 at December 31, 2009.
Franchise. Revenues in our Franchise segment increased $29.6 million, or 11.2%, to $293.8 million for the year ended December 31, 2010 compared to $264.2 million for the same period in 2009. Domestic franchise revenue increased by $7.2 million, or 4.0%, to $185.9 million in 2010, compared to $178.7 million in 2009, primarily due to higher wholesale revenues and fees. There were 903 stores at December 31, 2010 compared to 909 stores at December 31, 2009. International franchise revenue increased by $22.4 million, or 26.2%, to $107.9 million in 2010, compared to $85.5 million in 2009, primarily the result of increases in product sales and royalties. Our international franchise store base increased by 130 stores to 1,437 at December 31, 2010 compared to 1,307 at December 31, 2009.
Manufacturing/Wholesale. Revenues in our Manufacturing/Wholesale segment, which includes third-party sales from our manufacturing facility in South Carolina, as well as wholesale sales to Rite Aid, www.drugstore.com and PetSmart, decreased $2.3 million, or 1.2%, to $184.2 million for the year ended December 31, 2010 compared to $186.5 million for 2009. Third-party sales decreased in the South Carolina manufacturing plant by $15.3 million due primarily to our transition from low margin commodity products to higher margin, specialty product contracts, and other revenue decreased by $1.1 million. This was partially offset by an increase in wholesale revenue of $14.1 million.
Cost of Sales
Consolidated cost of sales, which includes product costs, costs of warehousing and distribution and occupancy costs, increased $63.6 million, or 5.7%, to $1,180.0 million for the year ended December 31, 2010 compared to $1,116.4 million for the same period in 2009. Consolidated cost of sales, as a percentage of net revenue, was 64.8% for the year ended December 31, 2010 compared to 65.4% for the year ended December 31, 2009. Consolidated cost of sales increased primarily due to higher sales volumes, higher lease related costs as a result of operating 85 more stores at December 31, 2010 than 2009, and higher fulfillment costs related to increased web sales.
Selling, General and Administrative ("SG&A") Expenses
Our consolidated SG&A expenses, including compensation and related benefits, advertising and promotion expense, other SG&A expenses, and amortization expense, increased $18.6 million, or 4.5%, to $428.1 million, for the year ended December 31, 2010 compared to $409.5 million for
52
the same period in 2009. These expenses, as a percentage of net revenue, were 23.5% for the year ended December 31, 2010 compared to 24.0% for the year ended December 31, 2009.
Compensation and related benefits. Compensation and related benefits increased $10.6 million, or 4.0%, to $273.6 million for the year ended December 31, 2010 compared to $263.0 million for the same period in 2009. The increase was due to increases of: (1) $8.9 million in base wages and related payroll taxes to support our increased store base and sales volume and to comply with the increases in minimum wage rates; (2) $1.0 million in health insurance costs; and (3) $0.7 million in other compensation expenses.
Advertising and promotion. Advertising and promotion expenses increased $1.4 million, or 2.7%, to $51.4 million for the year ended December 31, 2010 compared to $50.0 million during the same period in 2009. Advertising expense increased primarily as a result of increases in media and production costs of $1.4 million, in store signage costs of $1.3 million, and other advertising costs of $0.6 million, partially offset by decreases in print advertising costs of $1.9 million.
Other SG&A. Other SG&A expenses, including amortization expense, increased $3.1 million, or 3.3%, to $99.6 million for the year ended December 31, 2010 compared to $96.5 million for the year ended December 31, 2009. Increases in other SG&A expenses included telecom expense of $1.1 million, commissions of $2.1 million, credit card fees of $1.6 million, and other expense of $2.0 million. These were partially offset by decreases in amortization and depreciation expense of $3.0 million and bad debt expense of $0.7 million.
Strategic alternative costs. In addition to the above, we incurred $3.5 million of non-recurring expenses, principally related to the exploration of strategic alternatives.
Foreign Currency (Gain) Loss
Foreign currency (gain) loss for the years ended December 31, 2010 and 2009 resulted primarily from accounts payable activity with our Canadian subsidiary. We recognized income of $0.3 million and $0.1 million for the years ended December 31, 2010 and 2009, respectively.
Operating Income
As a result of the foregoing, consolidated operating income increased $33.4 million, or 18.4%, to $214.6 million for the year ended December 31, 2010 compared to $181.2 million for the same period in 2009. Operating income, as a percentage of net revenue, was 11.8% and 10.6% for the years ended December 31, 2010 and 2009, respectively.
Retail. Operating income increased $28.8 million, or 18.8%, to $181.9 million for the year ended December 31, 2010 compared to $153.1 million for the same period in 2009. The increase was primarily the result of higher dollar margins on increased sales volumes offset by increases in occupancy costs, compensation costs and other SG&A expenses.
Franchise. Operating income increased $14.5 million, or 17.9%, to $95.3 million for the year ended December 31, 2010 compared to $80.8 million for the same period in 2009. This increase was due to increases in royalty income, franchise fees, higher dollar margins on increased product sales to franchisees and reductions in bad debt expenses and amortization expense.
Manufacturing/Wholesale. Operating income decreased $4.1 million, or 5.5%, to $69.4 million for the year ended December 31, 2010 compared to $73.5 million for the same period in 2009. This decrease was primarily the result of lower dollar margins on decreased sales volumes from our South Carolina manufacturing facility.
53
Warehousing and Distribution Costs. Unallocated warehousing and distribution costs increased $1.4 million, or 2.7%, to $55.0 million for the year ended December 31, 2010 compared to $53.6 million for the same period in 2009. The increase in costs was primarily due to increases in distribution wages and fuel costs.
Corporate Costs. Corporate overhead costs increased $4.4 million, or 6.1%, to $77.0 million for the year ended December 31, 2010 compared to $72.6 million for the same period in 2009. This increase was due to increases in compensation expenses, incentives, and health insurance costs offset by decreases in other SG&A expenses. In addition, we incurred $3.5 million of non-recurring expenses, principally related to the exploration of strategic alternatives.
Interest Expense
Interest expense decreased $4.5 million, or 6.3%, to $65.5 million for the year ended December 31, 2010 compared to $70.0 million for the same period in 2009. This decrease was primarily attributable to decreases in interest rates on the variable portion of our debt in 2010 compared to 2009.
Income Tax Expense
We recognized $50.9 million of income tax expense (or 34.1% of pre-tax income) during the year ended December 31, 2010 compared to $41.6 million (or 37.4% of pre-tax income) for the same period in 2009. During 2010, we recorded a valuation allowance adjustment of $3.1 million, which reduced income tax expense. This valuation allowance adjustment reflected a change in circumstances that caused a change in judgment about the realizability of certain deferred tax assets related to state net operating losses. As a result of being able to fully utilize our remaining federal net operating losses in 2009, we were able to realize additional federal income tax benefits during 2010 related to certain federal tax credits and incentives.
Net Income
As a result of the foregoing, consolidated net income increased $28.6 million to $98.2 million for the year ended December 31, 2010 compared to $69.6 million for the same period in 2009.
Comparison of the Years Ended December 31, 2009 and 2008
Revenues
Our consolidated net revenues increased $50.3 million, or 3.0%, to $1,707.0 million for the year ended December 31, 2009 compared to $1,656.7 million for the same period in 2008. The increase was the result of increased sales in all of our segments.
Retail. Revenues in our Retail segment increased $37.0 million, or 3.0%, to $1,256.3 million for the year ended December 31, 2009 compared to $1,219.3 million for the same period in 2008. The increase from 2008 to 2009 included an increase of $31.6 million in our same store sales and an increase of $5.9 million from our non-same store sales. The same store sales increase includes GNC.com revenue, which increased $10.8 million, or 29.9%, to $46.8 million, compared to $36.0 million in 2008. Sales increases occurred in the major product categories of VMHS and sports nutrition. Sales in the diet category were negatively impacted by the Hydroxycut recall that occurred in May 2009. Our domestic company-owned same store sales, including our internet sales, improved by 2.8% for the year ended December 31, 2009 compared to the same period in 2008. For the year ended December 31, 2009, Canadian retail revenue decreased by $0.5 million in U.S. dollars, primarily due to the volatility of the U.S. dollar. In local currency, however, Canadian retail revenue increased by CAD $6.3 million. This increase was primarily a result of an increase of
54
CAD $0.7 million, or 0.8%, in company-owned same store sales, and an increase of CAD $5.6 million in our non-same store sales. Our company-owned store base increased by 51 domestic stores to 2,665 compared to 2,614 at December 31, 2008, primarily due to new store openings and franchise store acquisitions, and by seven Canadian stores to 167 at December 31, 2009 compared to 160 at December 31, 2008, primarily due to new store openings.
Franchise. Revenues in our Franchise segment increased $6.2 million, or 2.4%, to $264.2 million for the year ended December 31, 2009 compared to $258.0 million for the same period in 2008. Domestic franchise revenue decreased by $1.4 million, to $178.7 million in 2010, compared to $180.1 million in 2009, as increased product sales were more than offset by lower franchise fee revenue. Domestic royalty income was flat despite operating 45 fewer stores during 2009 compared to 2008. There were 909 stores at December 31, 2009 compared to 954 stores at December 31, 2008. International franchise revenue increased by $7.6 million, to $85.5 million in 2010, compared to $77.9 million in 2009, as a result of increases in product sales, partially offset by lower franchise fee revenue. International royalty income increased $0.5 million for the 2009 period compared to the 2008 period as sales increases in our franchisees' respective local currencies were impacted by the strengthening of the U.S. dollar from 2008 to 2009. Our international franchise store base increased by 117 stores to 1,307 at December 31, 2009 compared to 1,190 at December 31, 2008.
Manufacturing/Wholesale. Revenues in our Manufacturing/Wholesale segment, which includes third-party sales from our manufacturing facility in South Carolina, as well as wholesale sales to Rite Aid and www.drugstore.com, increased $7.1 million, or 4.0%, to $186.5 million for the year ended December 31, 2009 compared to $179.4 million for the same period in 2008. Sales increased in the South Carolina plant by $4.4 million, and revenues associated with Rite Aid increased by $1.4 million. This increase was due to increases in wholesale and consignment sales to Rite Aid of $4.6 million, partially offset by lower initial and renewal license fee revenue of $3.2 million as a result of Rite Aid opening 197 fewer franchise store-within-a-stores in 2009 compared to 2008. In addition, sales to www.drugstore.com increased by $1.3 million in 2009 compared to 2008.
Cost of Sales
Consolidated cost of sales, which includes product costs, costs of warehousing and distribution and occupancy costs, increased $33.8 million, or 3.1%, to $1,116.4 million for the year ended December 31, 2009 compared to $1,082.6 million for the same period in 2008. Consolidated cost of sales, as a percentage of net revenue, was 65.4% for the year ended December 31, 2009 compared to 65.3% for the year ended December 31, 2008. The increase in cost of sales was due primarily to increased products costs resulting from higher sales volumes and raw material costs and increased occupancy costs resulting from higher depreciation expense and lease-related costs.
Selling, General and Administrative Expenses
Our consolidated SG&A expenses, including compensation and related benefits, advertising and promotion expense, other SG&A expenses, and amortization expense, increased $5.9 million, or 1.5%, to $409.5 million, for the year ended December 31, 2009 compared to $403.6 million for the same period in 2008. These expenses, as a percentage of net revenue, were 24.0% for the year ended December 31, 2009 compared to 24.4% for the year ended December 31, 2008.
Compensation and related benefits. Compensation and related benefits increased $13.2 million, or 5.3%, to $263.0 million for the year ended December 31, 2009 compared to $249.8 million for the same period in 2008. The increase was due to: (1) $8.5 million in base wages to support our increased store base and sales volume and to comply with the increases in minimum wage rates; (2) $1.4 million in health insurance costs; (3) $1.2 million in commissions and
55
incentive expense; and (4) $1.0 million in other wage related expenditures. In addition, 2008 expenses included a $1.1 million reduction in base wages due to a change in our vacation policy effective March 31, 2008.
Advertising and promotion. Advertising and promotion expenses decreased $5.1 million, or 9.1%, to $50.0 million for the year ended December 31, 2009 compared to $55.1 million during the same period in 2008. Advertising expense decreased primarily as a result of decreases in media costs of $2.3 million and print advertising costs of $3.4 million, partially offset by increases in other advertising costs of $0.6 million.
Other SG&A. Other SG&A expenses, including amortization expense, decreased $2.2 million, or 2.3%, to $96.5 million for the year ended December 31, 2009 compared to $98.7 million for the year ended December 31, 2008. Decreases in bad debt expense of $2.3 million, amortization expense of $1.2 million and other selling expenses of $0.3 million were partially offset by increases in telecommunications expenses of $1.9 million due to the installation of a new point of sale register system in 2008 and professional fees of $0.8 million. In addition, other SG&A expenses for the year ended December 31, 2009 included a $1.1 million gain from proceeds received from the Visa/Mastercard antitrust litigation settlement.
Foreign Currency (Gain) Loss
Foreign currency (gain) loss for the years ended December 31, 2009 and 2008 resulted primarily from accounts payable activity with our Canadian subsidiary. We recognized income of $0.1 million for the year ended December 31, 2009 and a loss of $0.7 million for the year ended December 31, 2008.
Operating Income
As a result of the foregoing, consolidated operating income increased $11.4 million, or 6.7%, to $181.2 million for the year ended December 31, 2009 compared to $169.8 million for the same period in 2008. Operating income, as a percentage of net revenue, was 10.6% for the year ended December 31, 2009 and 10.3% for the year ended December 31, 2008.
Retail. Operating income increased $12.2 million, or 8.7%, to $153.1 million for the year ended December 31, 2009 compared to $140.9 million for the same period in 2008. The increase was primarily the result of higher dollar margins on increased sales volumes and reduced advertising spending, partially offset by increases in occupancy costs, compensation costs and other SG&A expenses.
Franchise. Operating income was unchanged at $80.8 million for each of the years ended December 31, 2009 and 2008.
Manufacturing/Wholesale. Operating income increased $6.1 million, or 9.0%, to $73.5 million for the year ended December 31, 2009 compared to $67.4 million for the same period in 2008. This increase was primarily the result of increased margins from our South Carolina manufacturing facility, partially offset by decreases in Rite Aid license fee revenue.
Warehousing and Distribution Costs. Unallocated warehousing and distribution costs decreased $0.6 million, or 1.3%, to $53.6 million for the year ended December 31, 2009 compared to $54.2 million for the same period in 2008. The decrease was primarily due to decreases in fuel costs.
Corporate Costs. Corporate overhead costs increased $7.5 million, or 11.7%, to $72.6 million for the year ended December 31, 2009 compared to $65.1 million for the same period in 2008. The
56
increase was primarily due to an increase in compensation expense and professional fees in 2009. In addition, compensation expenses for the year ended December 31, 2008 included a $1.1 million reduction due to a change in our vacation policy effective March 31, 2008.
Interest Expense
Interest expense decreased $13.0 million, or 15.7%, to $70.0 million for the year ended December 31, 2009 compared to $83.0 million for the same period in 2008. This decrease was primarily attributable to decreases in interest rates on our variable rate debt in 2009 compared to 2008 and $25.3 million in principal payments during 2009.
Income Tax Expense
We recognized $41.6 million of income tax expense (or 37.4% of pre-tax income) during the year ended December 31, 2009 compared to $32.0 million (or 36.9% of pre-tax income) for the same period in 2008. For the year ended December 31, 2009, a $0.5 million discrete tax benefit was recorded, while a $2.0 million discrete tax benefit was recorded for the year ended December 31, 2008.
Net Income
As a result of the foregoing, consolidated net income increased $14.8 million to $69.6 million for the year ended December 31, 2009 compared to $54.8 million for the same period in 2008.
Liquidity and Capital Resources
At December 31, 2010, we had $150.6 million in cash and cash equivalents and $443.0 million in working capital compared to $75.1 million in cash and cash equivalents and $382.6 million in working capital at December 31, 2009. The $60.4 million increase in our working capital was driven by increases in our inventory, accounts receivable, and cash and a decrease in our accrued interest. This was offset by increases in our current portion of long-term debt and accrued payroll and related liabilities.
At December 31, 2009, we had $75.1 million in cash and cash equivalents and $382.6 million in working capital compared to $42.3 million in cash and cash equivalents and $305.1 million in working capital at December 31, 2008. The $77.5 million increase in our working capital was driven by increases in our inventory and cash and a decrease in our accrued interest, accounts payable and current portion of long-term debt. This was partially offset by a decrease in our deferred taxes.
We expect to fund our operations through internally generated cash and, if necessary, from borrowings under the Revolving Credit Facility. At December 31, 2010, we had $44.9 million available under the Revolving Credit Facility, after giving effect to $8.8 million utilized to secure letters of credit and a $6.3 million commitment Lehman that we do not expect Lehman will fund.
We expect that our primary uses of cash in the near future will be for the purposes of fulfilling debt service requirements, capital expenditures and working capital requirements. In March 2010 and July 2009, our board of directors declared $28.4 million and $13.6 million, respectively, of dividends to GNC Corporation with payment dates of March 23, 2010 and August 30, 2009, respectively. Holdings was the final recipient of this dividend. The dividends were paid with cash generated from operations.
We currently anticipate that cash generated from operations, together with amounts available under the Revolving Credit Facility (excluding Lehman's commitment), will be sufficient for the term of the facility, which matures on March 15, 2012, to meet our operating expenses, capital expenditures and debt service obligations as they become due. However, our ability to make
57
scheduled payments of principal on, to pay interest on, or to refinance our debt and to satisfy our other debt obligations will depend on our future operating performance, which will be affected by general economic, financial and other factors beyond our control. We are currently in compliance with our debt covenant reporting and compliance obligations under the Revolving Credit Facility.
On February 7, 2011, we announced that we intend to enter into, subject to market and other conditions, the Refinancing. We currently expect to use the proceeds from the Refinancing, if consummated, to, among other things, refinance our existing indebtedness. We currently expect to consummate the Refinancing in March 2011; however, there can be no assurance that we will complete the Refinancing either on terms acceptable to us or at all. See "Cash Used in Financing Activities — Proposed Refinancing".
Cash Provided by Operating Activities
Cash provided by operating activities was $141.7 million, $114.0 million, and $77.4 million during the years ended December 31, 2010, 2009 and 2008 respectively. The changes between each of the periods were primarily due to changes in net income and in working capital accounts. Net income increased $28.6 million for the year ended December 31, 2010 compared to the same period in 2009. Net income increased $14.8 million for the year ended December 31, 2009 compared to the same period in 2008.
For the year ended December 31, 2010, inventory increased $26.2 million compared to the same period in 2009 as a result of increases in our finished goods and a decrease in our reserves. Accounts receivable increased $10.1 million, primarily due to increased sales to franchisees. Accrued liabilities increased by $9.2 million, primarily due to increased deferred revenue.
For the year ended December 31, 2009, inventory increased $15.7 million compared to the same period in 2008 as a result of increases in our finished goods and a decrease in our reserves. Accounts payable decreased $28.1 million, primarily due to the timing of disbursements. Accrued liabilities increased by $0.8 million, primarily due to increased deferred revenue.
For the year ended December 31, 2008, inventory increased $48.2 million compared to the same period in 2007 as a result of increases in our finished goods and work in process inventories. Accounts payable increased $22.0 million, primarily due to of increases in inventory. Accrued liabilities decreased by $16.1 million, primarily due to of decreases in accrued payroll related to the timing of the pay with year end.
Cash Used in Investing Activities
We used cash from investing activities of $36.1 million, $42.2 million, and $60.4 million for the years ended December 31, 2010, 2009 and 2008, respectively. We used cash of $3.1 million, $11.3 million and $10.8 million for the years ended December 31, 2010, 2009 and 2008, respectively, related to payments to former stockholders in connection with the Merger. Capital expenditures, which were primarily for improvements to our retail stores and our South Carolina manufacturing facility and which represent the majority of our remaining cash used in investing activities, were $32.5 million, $28.7 million, and $48.7 million for the years ended December 31, 2010, 2009 and 2008, respectively. In 2008, we invested $1.0 million in the purchase of certain intangible assets from a third party.
Our capital expenditures typically consist of certain periodic updates in our company-owned stores and ongoing upgrades and improvements to our manufacturing facilities.
In each of 2011 and 2012, we expect our capital expenditures to range between $40 and $50 million, which includes costs associated with growing our domestic square footage. We
58
anticipate funding our 2011 capital requirements with cash flows from operations and, if necessary, borrowings under our Senior Credit Facility.
Cash Used in Financing Activities
We used cash of $1.7 million in 2010 for payments on long-term debt. A $28.4 million dividend was declared by our board of directors and paid in March 2010 to GNC Corporation.
We used cash of $39.3 million in 2009 for payments on long-term debt, including $3.8 million for an excess cash payment in March 2009 under the requirements of the Senior Credit Facility. In addition, we repaid the outstanding $5.4 million balance on the Revolving Credit Facility in May 2009 and made $14.0 million in optional repayments on the Senior Credit facility ($9.0 million in June 2009 and $5.0 million in December 2009). A $13.6 million dividend was declared in July 2009 by our board of directors and paid in August 2009 to GNC Corporation.
We used cash from financing activities of $8.0 million in 2008 for required payments on long term debt and received $5.4 million from borrowings under the Revolving Credit Facility.
$735.0 Million Senior Credit Facility. The Senior Credit Facility consists of the Term Loan Facility and the Revolving Credit Facility. As of December 31, 2010 and 2009, $8.8 million and $7.9 million were pledged to secure letters of credit, respectively. The Term Loan Facility will mature in September 2013. The Revolving Credit Facility will mature in March 2012. The Senior Credit Facility permits us to prepay a portion or all of the outstanding balance without incurring penalties (except LIBOR breakage costs). Subject to certain exceptions, the Senior Credit Facility requires that 100% of the net cash proceeds from certain asset sales, casualty insurance, condemnations and debt issuances, and a specified percentage (ranging from 50% to 0% based on a defined leverage ratio) of excess cash flow (as defined in the agreement) for each fiscal year must be used to pay down outstanding borrowings. GNC Corporation and our existing and future direct and indirect domestic subsidiaries have guaranteed our obligations under the Senior Credit Facility. In addition, the Senior Credit Facility is collateralized by first priority pledges (subject to permitted liens) of our equity interests and the equity interests of our domestic subsidiaries.
All borrowings under the Senior Credit Facility bear interest, at our option, at a rate per annum equal to (i) the higher of (x) the prime rate (as publicly announced by JPMorgan Chase Bank, N.A. as its prime rate in effect) and (y) the federal funds effective rate, plus 0.50% per annum plus, at December 31, 2010, in each case, applicable margins of 1.25% per annum for the Term Loan Facility and 1.0% per annum for the Revolving Credit Facility or (ii) adjusted LIBOR plus 2.25% per annum for the Term Loan Facility and 2.0% per annum for the Revolving Credit Facility. In addition to paying interest on outstanding principal under the Senior Credit Facility, we are required to pay a commitment fee to the lenders under the Revolving Credit Facility in respect of unutilized revolving loan commitments at a rate of 0.50% per annum.
The Senior Credit Facility contains customary covenants, including incurrence covenants and certain other limitations on the ability of GNC Corporation, us, and our subsidiaries to incur additional debt, guarantee other obligations, grant liens on assets, make investments or acquisitions, dispose of assets, make optional payments or modifications of other debt instruments, pay dividends or other payments on capital stock, engage in mergers or consolidations, enter into sale and leaseback transactions, enter into arrangements that restrict our and our subsidiaries' ability to pay dividends or grant liens, engage in transactions with affiliates and change the passive holding company status of GNC Corporation.
The Senior Credit Facility contains events of default, including (subject to customary cure periods and materiality thresholds) defaults based on (1) the failure to make payments under the Senior Credit Facility when due, (2) breaches of covenants, (3) inaccuracies of representations and
59
warranties, (4) cross-defaults to other material indebtedness, (5) bankruptcy events, (6) material judgments, (7) certain matters arising under the Employee Retirement Income Security Act of 1974, as amended, (8) the actual or asserted invalidity of documents relating to any guarantee or security document, (9) the actual or asserted invalidity of any subordination terms supporting the Senior Credit Facility and (10) the occurrence of a change in control. If any such event of default occurs, the lenders would be entitled to accelerate the facilities and take various other actions, including all actions permitted to be taken by a collateralized creditor. If certain bankruptcy events occur, the facilities will automatically accelerate.
Senior Notes. In connection with the Merger, we completed a private offering of $300.0 million of the Senior Notes. The Senior Notes are our senior non collateralized obligations and are effectively subordinated to all of our existing and future collateralized debt, including the Senior Credit Facility, to the extent of the assets securing such debt, rank equally with all our existing and future non collateralized senior debt and rank senior to all our existing and future senior subordinated debt, including the Senior Subordinated Notes. The Senior Notes are guaranteed on a senior non collateralized basis by each of our existing and future domestic subsidiaries (as defined in the Senior Notes indenture). If we fail to make payments on the Senior Notes, the notes guarantors must make them instead.
We may elect in our sole discretion to pay interest on the Senior Notes in cash, entirely by increasing the principal amount of the Senior Notes or issuing Senior Notes ("PIK interest"), or on 50% of the outstanding principal amount of the Senior Notes in cash and on 50% of the outstanding principal amount of the Senior Notes by increasing the principal amount of the Senior Notes or by issuing Senior Notes ("partial PIK interest"). Cash interest on the Senior Notes accrues at six-month LIBOR plus 4.5% per annum, and PIK interest, if any, accrues at six-month LIBOR plus 5.25% per annum. If we elect to pay PIK interest or partial PIK interest, it will increase the principal amount of the Senior Notes or issue Senior Notes in an aggregate principal amount equal to the amount of PIK interest for the applicable interest payment period (rounded up to the nearest $1,000) to holders of the Senior Notes on the relevant record date. To date, we have elected to pay cash interest. The Senior Notes are treated as having been issued with original issue discount for U.S. federal income tax purposes.
We may redeem some or all of the Senior Notes at any time, at specified redemption prices. If we experience certain kinds of changes in control, we must offer to purchase the Senior Notes at 101% of par plus accrued interest to the purchase date.
The Senior Notes indenture contains certain limitations and restrictions on our and our restricted subsidiaries' ability to incur additional debt beyond certain levels, pay dividends, redeem or repurchase our stock or subordinated indebtedness or make other distributions, dispose of assets, grant liens on assets, make investments or acquisitions, engage in mergers or consolidations, enter into arrangements that restrict our ability to pay dividends or grant liens, and engage in transactions with affiliates. In addition, the Senior Notes indenture restricts our and certain of our subsidiaries' ability to declare or pay dividends to our or their stockholders.
Senior Subordinated Notes. In connection with the Merger, we completed a private offering of $110.0 million of the Senior Subordinated Notes. The Senior Subordinated Notes are our senior subordinated non collateralized obligations and are subordinated to all our existing and future senior debt, including our Senior Credit Facility and the Senior Notes, and rank equally with all of our existing and future senior subordinated debt and rank senior to all our existing and future subordinated debt. The Senior Subordinated Notes are guaranteed on a senior subordinated non collateralized basis by each of our existing and future domestic subsidiaries (as defined in the Senior Subordinated Notes indenture). If we fail to make payments on the Senior Subordinated Notes, the notes guarantors must make them instead. Interest on the Senior Subordinated Notes
60
accrues at the rate of 10.75% per year from March 16, 2007 and is payable semi-annually in arrears on March 15 and September 15 of each year, beginning on September 15, 2007.
We may redeem some or all of the Senior Subordinated Notes at any time, at specified redemption prices. If we experience certain kinds of changes in control, we must offer to purchase the Senior Subordinated Notes at 101% of par plus accrued interest to the purchase date.
The Senior Subordinated Notes indenture contains certain limitations and restrictions on our and our restricted subsidiaries' ability to incur additional debt beyond certain levels, pay dividends, redeem or repurchase our stock or subordinated indebtedness or make other distributions, dispose of assets, grant liens on assets, make investments or acquisitions, engage in mergers or consolidations, enter into arrangements that restrict our ability to pay dividends or grant liens and engage in transactions with affiliates. In addition, the Senior Subordinated Notes indenture restricts our and certain of our subsidiaries' ability to declare or pay dividends to our stockholders.
Proposed Refinancing. On February 7, 2011, we announced that we intend to enter into, subject to market and other conditions, a financing transaction with certain lenders. We currently expect the transaction to consist of a $1.2 billion term loan facility with a term of seven years and an $80 million revolving credit facility with a term of five years. We currently expect to use the proceeds from the new facility, if consummated, together with cash on hand, to refinance our existing indebtedness, including all outstanding indebtedness under the Senior Credit Facility, the Senior Notes and the Senior Subordinated Notes, to fund a dividend to our Parent for the redemption of a portion of its Series A preferred stock, and to pay related fees and expenses. We refer to this transaction and the expected use of proceeds collectively as the "Refinancing". We currently expect to consummate the Refinancing in March 2011; however, there can be no assurance that we will complete the Refinancing either on terms acceptable to us or at all.
Contractual Obligations
The following table summarizes our future minimum non-cancelable contractual obligations at December 31, 2010:
| |
Payments due by period | |||||||||||||||
|---|---|---|---|---|---|---|---|---|---|---|---|---|---|---|---|---|
(in millions)
|
Total
|
Less than 1 year |
1-3 years
|
4-5 years
|
After 5 years
|
|||||||||||
Long-term debt obligations(1) |
$ | 1,060.1 | $ | 28.1 | $ | 621.4 | $ | 300.6 | $ | 110.0 | ||||||
Scheduled interest payments(2) |
177.6 | 59.1 | 99.9 | 18.6 | — | |||||||||||
Operating lease obligations(3) |
430.8 | 110.9 | 153.8 | 88.5 | 77.6 | |||||||||||
Purchase commitments(4)(5) |
19.8 | 9.7 | 4.3 | 4.0 | 1.8 | |||||||||||
|
$ | 1,688.3 | $ | 207.8 | $ | 879.4 | $ | 411.7 | $ | 189.4 | ||||||
- (1)
- These
balances consist of the following debt obligations: (a) $644.4 million for the Senior Credit Facility based on a variable interest rate;
(b) $300.0 million for our Senior Notes based on a variable interest rate; (c) $110.0 million for our Senior Subordinated Notes with a fixed interest rate; and
(d) $5.7 million for our mortgage with a fixed interest rate. Repayment of the Senior Credit Facility is based on the current amortization schedule and does not take into account any
unscheduled payments that may occur due to our future cash positions.
- (2)
- The interest that will accrue on the long-term obligations includes variable rate payments, which are estimated using the associated LIBOR index as of December 31, 2010. The Senior Credit Facility uses the three month LIBOR index while the Senior Notes use the six month LIBOR index. Also included in the scheduled interest payments is the activity associated with
61
our interest rate swap agreements which also use the three month LIBOR index and the six month LIBOR index.
- (3)
- These
balances consist of the following operating leases: (a) $414.6 million for company-owned retail stores; (b) $66.9 million
for franchise retail stores, which is offset by $66.9 million of sublease income from franchisees; and (c) $16.2 million relating to various leases for tractors/trailers,
warehouses, automobiles, and various equipment at our facilities. Operating lease obligations exclude insurance, taxes, maintenance, percentage rent and other costs. These amounts are subject to
fluctuation from year to year. For each of the years ended December 31, 2008, 2009 and 2010, respectively, these amounts collectively represented approximately 36% of the aggregate costs
associated with our company-owned retail store operating leases.
- (4)
- These
balances consist of $10.6 million of advertising and $9.2 million related to a management services agreement. In connection with the
Merger, we entered into a management services agreement with Holdings, pursuant to which we agreed to pay an annual fee of $1.5 million in consideration for certain management and advisory
services. See Item 13, "Certain Relationships and Related Transactions — Management Services Agreement".
- (5)
- We are unable to make a reasonably reliable estimate as to when cash settlement with taxing authorities may occur for our unrecognized tax benefits. Also, certain other long term liabilities, included in our consolidated balance sheet relate principally to the fair value of our interest rate swap agreement, and rent escalation liabilities, and we are unable to estimate the timing of these payments. Therefore, these long term liabilities are not included in the table above. See Note 5, "Income Taxes", and Note 13, "Other Long Term Liabilities", to the Consolidated Financial Statements for additional information.
On February 7, 2011, we announced that we intend to enter into, subject to market and other conditions, the Refinancing. We currently expect to use the proceeds from the transaction, if consummated, to, among other things, refinance our existing indebtedness. We currently expect to consummate the Refinancing in March 2011; however, there can be no assurance that we will complete the Refinancing either on terms acceptable to us or at all. See "Liquidity and Capital Resources — Cash Used in Financing Activities — Proposed Refinancing".
In addition to the obligations set forth in the table above, we have entered into employment agreements with certain executives that provide for compensation and certain other benefits. Under certain circumstances, including a change in control, some of these agreements provide for severance or other payments, if those circumstances would ever occur during the term of the employment agreement.
Off Balance Sheet Arrangements
As of December 31, 2010 and 2009, we had no relationships with unconsolidated entities or financial partnerships, such as entities often referred to as structured finance or special purpose entities, which would have been established for the purpose of facilitating off balance sheet arrangements, or other contractually narrow or limited purposes. We are, therefore, not materially exposed to any financing, liquidity, market, or credit risk that could arise if we had engaged in such relationships.
62
Effect of Inflation
Inflation generally affects us by increasing costs of raw materials, labor, and equipment. We do not believe that inflation had any material effect on our results of operations in the periods presented in our consolidated financial statements.
Critical Accounting Estimates
You should review the significant accounting policies described in the notes to our consolidated financial statements under the heading "Basis of Presentation and Summary of Significant Accounting Policies" included in this report.
Use of Estimates
Certain amounts in our financial statements require management to use estimates, judgments, and assumptions that affect the reported amounts of assets and liabilities at the date of the financial statements and the reported amounts of revenues and expenses during the periods presented. Our accounting policies are described in the notes to our consolidated financial statements under the heading "Basis of Presentation and Summary of Significant Accounting Policies" included elsewhere in this report. Our critical accounting policies and estimates are described in this section. An accounting estimate is considered critical if:
- •
- the estimate requires management to make assumptions about matters that were uncertain at the time the estimate was made;
- •
- different estimates reasonably could have been used; or
- •
- changes in the estimate that would have a material impact on our financial condition or our results of operations are likely to occur from period to period.
Management believes that the accounting estimates used are appropriate and the resulting balances are reasonable. However, actual results could differ from the original estimates, requiring adjustments to these balances in future periods.
Revenue Recognition
We operate primarily as a retailer, through company-owned stores, franchise stores, and to a lesser extent, as a wholesaler. In addition, we offer products domestically through GNC.com. We apply the provisions of the standard on revenue recognition, which requires the following:
- •
- Persuasive evidence of an arrangement exists.
- •
- Delivery has occurred or services have been rendered.
- •
- The price is fixed or determinable.
- •
- Collectability is reasonably assured.
We recognize revenues in our Retail segment at the moment a sale to a customer is recorded. Gross revenues are reduced by actual customer returns and a provision for estimated future customer returns, which is based on management's estimates after a review of historical customer returns. These estimates are based on historical sales return data, applied to current period sales subject to returns provisions per our company policy. Our customer returns allowance was $2.2 million and $2.4 million at December 31, 2010 and 2009, respectively. The impact of customer returns on revenue was immaterial for each of the years ended December 31, 2010, 2009 and 2008. We recognize revenues on product sales to franchisees and other third parties when the risk of loss, title and insurable risks have transferred to the franchisee or third party. We recognize
63
revenues from franchise fees at the time a franchise store opens or at the time of franchise renewal or transfer, as applicable.
Inventories
Where necessary, we adjust the carrying value of our inventory to the lower of cost or net realizable value. These estimates require us to make approximations about the future demand for our products in order to categorize the status of such inventory items as slow moving, obsolete, or in excess of need. These future estimates are subject to the ongoing accuracy of management's forecasts of market conditions, industry trends, and competition. While we make estimates of future demand based on historical experience, current expectations and assumptions that we believe are reasonable, if actual demand or market conditions differ from these expectations and assumptions, actual results could differ from our estimates. We are also subject to volatile changes in specific product demand as a result of unfavorable publicity, government regulation, and rapid changes in demand for new and improved products or services. Our inventory reduction for obsolescence and shrinkage was $11.0 million and $9.6 million at December 31, 2010 and 2009, respectively. This represented 2.8% and 2.5% of our gross inventory value at each period, respectively. The change from period to period is primarily the result of inventory fluctuations and management of inventory movement throughout our system. The impact on cost of goods sold as a result of these allowances was immaterial for each of the years ended December 31, 2010, 2009 and 2008.
Accounts Receivable and Allowance for Doubtful Accounts
The majority of our retail revenues are received as cash or cash equivalents. The majority of our franchise revenues are billed to the franchisees with varying terms for payment. We offer financing to qualified domestic franchisees with the initial purchase of a franchise location. The notes are demand notes, payable monthly over periods of five to seven years. We generate a significant portion of our revenue from ongoing product sales to franchisees and third-party customers. An allowance for doubtful accounts is established based on regular evaluations of our franchisees' and third-party customers' financial health, the current status of trade receivables, and any historical write-off experience. We maintain both specific and general reserves for doubtful accounts. General reserves are based upon our historical bad debt experience, overall review of our aging of accounts receivable balances, general economic conditions of our industry, or the geographical regions and regulatory environments of our third-party customers and franchisees. Management's estimates of the franchisees' financial health include forecasts of the customers' and franchisees' future operating results and the collectability of receivables from them. While we believe that our business operations and communication with customers and franchisees allows us to make reasonable estimates of their financial health, actual results could differ from those predicted by management, and actual bad debt expense could differ from forecasted results. Our allowance for doubtful accounts was $1.6 million and $1.8 million at December 31, 2010 and 2009, respectively. Changes in the allowance from period to period are primarily a result of the composition of customers and their financial health. Bad debt expense was immaterial for each of the years ended December 31, 2010, 2009 and 2008.
Impairment of Long-Lived Assets
Long-lived assets, including fixed assets and intangible assets with finite useful lives, are evaluated periodically by us for impairment whenever events or changes in circumstances indicate that the carrying amount of any such asset may not be recoverable. If the sum of the undiscounted future cash flows is less than the carrying value, we recognize an impairment loss, measured as the amount by which the carrying value exceeds the fair value of the asset. These estimates of cash flow require significant management judgment and certain assumptions about future volume,
64
revenue and expense growth rates, foreign exchange rates, devaluation and inflation. While we make estimates based on historical experience, current expectations and assumptions that we believe are reasonable, if actual results, including future cash flows, differ from our estimates, our estimates may differ from actual impairment recognized. There has been no impairment recorded in the years ended December 31, 2010, 2009 or 2008.
Self-Insurance
We have procured insurance for such areas as: (1) general liability; (2) product liability; (3) directors and officers liability; (4) property insurance; and (5) ocean marine insurance. We are self-insured for such areas as: (1) medical benefits; (2) workers' compensation coverage in the State of New York with a stop loss of $250,000; (3) physical damage to our tractors, trailers and fleet vehicles for field personnel use; and (4) physical damages that may occur at the corporate store locations. We are not insured for certain property and casualty risks due to the frequency and severity of a loss, the cost of insurance and the overall risk analysis. Our associated liability for this self-insurance was not significant as of December 31, 2010 and 2009. Prior to 2003, General Nutrition Companies, Inc. was included as an insured under several of its then ultimate parent's global insurance policies.
We carry product liability insurance with a retention of $3.0 million per claim with an aggregate cap on retained losses of $10.0 million. We carry general liability insurance with retention of $110,000 per claim with an aggregate cap on retained losses of $600,000. The majority of our workers' compensation and auto insurance are in a deductible/retrospective plan. We reimburse the insurance company for the workers' compensation and auto liability claims, subject to a $250,000 and $100,000 loss limit per claim, respectively.
As part of the medical benefits program, we contract with national service providers to provide benefits to our employees for all medical, dental, vision and prescription drug services. We then reimburse these service providers as claims are processed from our employees. We maintain a specific stop loss provision of $250,000 per incident with a maximum limit up to $2.0 million per participant, per benefit year, respectively. We have no additional liability once a participant exceeds the $2.0 million ceiling. We utilize a review of historical claims, including the timing of claims reported versus payment of claims, to estimate future liabilities related to our medical benefit program. While we make these estimates based on historical experience, current expectations and assumptions that we believe are reasonable, actual results could differ from our estimates. Our liability for medical claims is included as a component of accrued benefits as described in Note 10, "Accrued Payroll and Related Liabilities", to our consolidated financial statements included in this report, and was $1.9 million and $2.0 million as of December 31, 2010 and 2009, respectively.
Goodwill and Indefinite-Lived Intangible Assets
On an annual basis, we perform a valuation of the goodwill and indefinite lived intangible assets associated with our operating segments. To the extent that the fair value associated with the goodwill and indefinite lived intangible assets is less than the recorded value, we write down the value of the asset. The valuation of the goodwill and indefinite lived intangible assets is affected by, among other things, our business plan for the future, and estimated results of future operations. Changes in the business plan or operating results that are different than the estimates used to develop the valuation of the assets may result in an impact on their valuation. While we make these estimates based on historical experience, current expectations and assumptions that we believe are reasonable, if actual results, including future operating results, differ from our estimates, our estimates may differ from actual impairment recognized.
65
We conduct impairment testing annually at the beginning of the fourth quarter, using third quarter results. In the event of declining financial results and market conditions, we could be required to recognize impairments to our goodwill and intangible assets. The most recent valuation was performed at October 1, 2010, and no impairment was found. There was also no impairment found during 2010, 2009 or 2008. See Note 7, "Goodwill and Intangible Assets", to our audited consolidated financial statements included elsewhere in this report. We do not currently expect to incur additional impairment charges in the foreseeable future; however, the risks relating to our business, as described above under "Risk Factors", could have a negative effect on our business and operating results which could affect the valuation of our intangibles.
Leases
We have various operating leases for company owned and franchise store locations and equipment. Store leases generally include amounts relating to base rental, percent rent and other charges such as common area maintenance fees and real estate taxes. Periodically, we receive varying amounts of reimbursements from landlords to compensate us for costs incurred in the construction of stores. We amortize these reimbursements as an offset to rent expense over the life of the related lease. We determine the period used for the straight-line rent expense for leases with option periods and conform it to the term used for amortizing improvements.
Income Taxes
We compute our annual tax rate based on the statutory tax rates and tax planning opportunities available to us in the various jurisdictions in which we earn income. Significant judgment is required in determining our annual tax rate and in evaluating uncertainty in our tax positions. We recognize a benefit for tax positions that we believe will more likely than not be sustained upon examination. The amount of benefit recognized is the largest amount of benefit that we believe has more than a 50% probability of being realized upon settlement. We regularly monitor our tax positions and adjust the amount of recognized tax benefit based on our evaluation of information that has become available since the end of our last financial reporting period. The annual tax rate includes the impact of these changes in recognized tax benefits. The difference between the amount of benefit taken or expected to be taken in a tax return and the amount of benefit recognized for financial reporting represents unrecognized tax benefits. These unrecognized tax benefits are presented in the balance sheet principally within accrued income taxes.
We record valuation allowances to reduce deferred tax assets to the amount that is more likely than not to be realized. When assessing the need for valuation allowances, we consider future taxable income and ongoing prudent and feasible tax planning strategies. Should a change in circumstances lead to a change in judgment about the realizability of deferred tax assets in future years, we would adjust related valuation allowances in the period that the change in circumstances occurs, along with a corresponding increase or charge to income.
Recently Issued Accounting Pronouncements
Fair Value
In January 2010, the FASB issued ASU 2010-06 "Improving Disclosures about Fair Value Measurements". ASU 2010-06 requires additional disclosures about fair value measurements including transfers in and out of Levels 1 and 2 and more disaggregation for the different types of financial instruments. This ASU became effective for annual and interim reporting periods beginning after December 15, 2009 for most of the new disclosures and for periods beginning after December 15, 2010 for the new Level 3 disclosures. Comparative disclosures are not required in
66
the first year the disclosures are required. The adoption of this standard did not have any impact on our financial statements.
Other
In December 2009, the FASB issued ASU No. 2009-17, "Improvements to Financial Reporting by Enterprises Involved with Variable Interest Entities", which incorporates into the FASB Codification amendments to FASB Interpretation No. 46(R), "Consolidation of Variable Interest Entities", made by Statement of Financial Accounting Standard No. 167, "Accounting for Variable Interest Entities", to require that a comprehensive qualitative analysis be performed to determine whether a holder of variable interests in a variable interest entity also has a controlling financial interest in that entity. In addition, the amendments require that the same type of analysis be applied to entities that were previously designated as qualified special-purpose entities. The amendments were effective as of January 1, 2010. The adoption of ASU No. 2009-17 did not have a material impact on our consolidated financial position, results of operations, and cash flows.
Item 7A. Quantitative and Qualitative Disclosures About Market Risk.
Market risk represents the risk of changes in the value of market risk sensitive instruments caused by fluctuations in interest rates, foreign exchange rates and commodity prices. Changes in these factors could cause fluctuations in the results of our operations and cash flows. In the ordinary course of business, we are primarily exposed to foreign currency and interest rate risks. We do not use derivative financial instruments in connection with these commodity market risks.
We are exposed to market risks from interest rate changes on our variable rate debt. Although changes in interest rates do not impact our operating income, the changes could affect the fair value of our interest rate swaps and interest payments. As of December 31, 2010 we had fixed rate debt of $115.7 million and variable rate debt of $942.8 million. In conjunction with the Merger, we entered into interest rate swaps, effective April 2, 2007, which effectively convert a portion of the variable LIBOR component of the effective interest rate on two $150.0 million notional portions of our debt under the Term Loan Facility to a fixed rate over a specified term. Each of these $150.0 million notional amounts has a three month LIBOR tranche conforming to the interest payment dates on the Term Loan Facility. During September 2008, we entered into two new forward agreements with start dates of the expiration dates of the pre-existing interest rate swap agreements (April 2009 and April 2010). In September 2008, we also entered into a new interest rate swap agreement with an effective date of September 30, 2008 that effectively converted an additional notional amount of $100.0 million of debt from a floating to a fixed interest rate. The $100.0 million notional amount has a three month LIBOR tranche conforming to the interest payment dates on the Term Loan Facility. In June 2009, we entered into a new swap agreement with an effective date of September 15, 2009. The $150.0 million notional amount has a six month LIBOR tranche conforming to the interest payment dates on the Senior Notes.
These agreements are summarized in the following table:
Derivative
|
Total Notional Amount
|
Term
|
Counterparty Pays
|
Company Pays
|
||||||
|---|---|---|---|---|---|---|---|---|---|---|
| Interest Rate Swap | $150.0 million | April 2009-April 2011 | 3 month LIBOR | 3.07 | % | |||||
| Interest Rate Swap | $150.0 million | April 2010-April 2011 | 3 month LIBOR | 3.41 | % | |||||
| Interest Rate Swap | $100.0 million | September 2008-September 2011 | 3 month LIBOR | 3.31 | % | |||||
| Interest Rate Swap | $150.0 million | September 2009-September 2012 | 6 month LIBOR | 2.68 | % | |||||
Interest Rate Market Risk
A portion of our debt is subject to changing interest rates. Although changes in interest rates do not impact our operating income, the changes could affect the fair value of such debt and
67
related interest payments. Based on our variable rate debt balance as of December 31, 2010, a 1.0% change in interest rates would increase or decrease our annual interest cost by $3.9 million.
Foreign Exchange Rate Market Risk
We are subject to the risk of foreign currency exchange rate changes in the conversion from local currencies to the U.S. dollar of the reported financial position and operating results of our non-U.S. based subsidiaries. We are also subject to foreign currency exchange rate changes for purchases of goods and services that are denominated in currencies other than the U.S. dollar. The primary currency to which we are exposed to fluctuations is the Canadian Dollar. The fair value of our net foreign investments and our foreign denominated payables would not be materially affected by a 10% adverse change in foreign currency exchange rates for the periods presented.
68
Item 8. Financial Statements and Supplementary Data.
69
Report of Independent Registered Public Accounting Firm
To the Shareholder and Board of Directors of General Nutrition Centers, Inc.:
In our opinion, the accompanying consolidated balance sheets and the related consolidated statements of operations, stockholder's equity and comprehensive income (loss) and of cash flows present fairly, in all material respects, the financial position of General Nutrition Centers, Inc. and its subsidiaries at December 31, 2010 and 2009, and the results of their operations and their cash flows for each of the three years in the period ended December 31, 2010 in conformity with accounting principles generally accepted in the United States of America. In addition, in our opinion, the financial statement schedule listed in the index appearing under item 15(a)(2) for the years ended December 31, 2010, 2009 and 2008, presents fairly, in all material respects, the information set forth therein when read in conjunction with the related consolidated financial statements. Also in our opinion, the Company maintained, in all material respects, effective internal control over financial reporting as of December 31, 2010, based on criteria established in Internal Control — Integrated Framework issued by the Committee of Sponsoring Organizations of the Treadway Commission (COSO). The Company's management is responsible for these financial statements and financial statement schedule, for maintaining effective internal control over financial reporting and for its assessment of the effectiveness of internal control over financial reporting, included in Management's Report on Internal Control over Financial Reporting appearing under item 9A. Our responsibility is to express opinions on these financial statements, on the financial statement schedule, and on the Company's internal control over financial reporting based on our integrated audits (which were integrated audits in 2010 and 2009). We conducted our audits in accordance with the standards of the Public Company Accounting Oversight Board (United States). Those standards require that we plan and perform the audits to obtain reasonable assurance about whether the financial statements are free of material misstatement and whether effective internal control over financial reporting was maintained in all material respects. Our audits of the financial statements included examining, on a test basis, evidence supporting the amounts and disclosures in the financial statements, assessing the accounting principles used and significant estimates made by management, and evaluating the overall financial statement presentation. Our audit of internal control over financial reporting included obtaining an understanding of internal control over financial reporting, assessing the risk that a material weakness exists, and testing and evaluating the design and operating effectiveness of internal control based on the assessed risk. Our audits also included performing such other procedures as we considered necessary in the circumstances. We believe that our audits provide a reasonable basis for our opinions.
A company's internal control over financial reporting is a process designed to provide reasonable assurance regarding the reliability of financial reporting and the preparation of financial statements for external purposes in accordance with generally accepted accounting principles. A company's internal control over financial reporting includes those policies and procedures that (i) pertain to the maintenance of records that, in reasonable detail, accurately and fairly reflect the transactions and dispositions of the assets of the company; (ii) provide reasonable assurance that transactions are recorded as necessary to permit preparation of financial statements in accordance with generally accepted accounting principles, and that receipts and expenditures of the company are being made only in accordance with authorizations of management and directors of the company; and (iii) provide reasonable assurance regarding prevention or timely detection of unauthorized acquisition, use, or disposition of the company's assets that could have a material effect on the financial statements.
Because of its inherent limitations, internal control over financial reporting may not prevent or detect misstatements. Also, projections of any evaluation of effectiveness to future periods are subject to the risk that controls may become inadequate because of changes in conditions, or that the degree of compliance with the policies or procedures may deteriorate.
/s/
PricewaterhouseCoopers LLP
Pittsburgh, Pennsylvania
February 25, 2011
70
GENERAL NUTRITION CENTERS, INC. AND SUBSIDIARIES
Consolidated Balance Sheets
(in thousands, except share data)
| |
December 31, | |||||||||
|---|---|---|---|---|---|---|---|---|---|---|
| |
2010
|
2009
|
||||||||
Current assets: |
||||||||||
Cash and cash equivalents |
$ | 150,641 | $ | 75,089 | ||||||
Receivables, net (Note 3) |
104,633 | 94,355 | ||||||||
Inventories, net (Note 4) |
381,787 | 370,492 | ||||||||
Prepaids and other current assets (Note 6) |
39,625 | 42,219 | ||||||||
Total current assets |
676,686 | 582,155 | ||||||||
Long-term assets: |
||||||||||
Goodwill (Note 7) |
625,241 | 624,753 | ||||||||
Brands (Note 7) |
720,000 | 720,000 | ||||||||
Other intangible assets, net (Note 7) |
147,224 | 154,370 | ||||||||
Property, plant and equipment, net (Note 8) |
193,428 | 199,581 | ||||||||
Deferred financing fees, net (Note 2) |
14,129 | 18,411 | ||||||||
Deferred tax assets, net (Note 5) |
— | — | ||||||||
Other long-term assets (Note 9) |
5,767 | 4,332 | ||||||||
Total long-term assets |
1,705,789 | 1,721,447 | ||||||||
Total assets |
$ | 2,382,475 | $ | 2,303,602 | ||||||
Current liabilities: |
||||||||||
Accounts payable |
$ | 98,295 | $ | 95,904 | ||||||
Accrued payroll and related liabilities (Note 10) |
25,610 | 22,277 | ||||||||
Accrued interest (Note 12) |
13,372 | 14,552 | ||||||||
Current portion, long-term debt (Note 12) |
28,070 | 1,724 | ||||||||
Deferred revenue and other current liabilities (Note 11) |
68,341 | 65,130 | ||||||||
Total current liabilities |
233,688 | 199,587 | ||||||||
Long-term liabilities: |
||||||||||
Long-term debt (Note 12) |
1,030,429 | 1,058,085 | ||||||||
Deferred tax liabilities, net (Note 5) |
288,015 | 288,894 | ||||||||
Other long-term liabilities (Note 13) |
33,950 | 39,520 | ||||||||
Total long-term liabilities |
1,352,394 | 1,386,499 | ||||||||
Total liabilities |
1,586,082 | 1,586,086 | ||||||||
Stockholder's equity: |
||||||||||
Common stock, $0.01 par value, 1,000 shares authorized, 100 shares issued and outstanding (Note 17) |
— | — | ||||||||
Paid-in-capital |
598,101 | 594,932 | ||||||||
Retained earnings |
199,572 | 129,783 | ||||||||
Accumulated other comprehensive loss (Note 17) |
(1,280 | ) | (7,199 | ) | ||||||
Total stockholder's equity |
796,393 | 717,516 | ||||||||
Total liabilities and stockholder's equity |
$ | 2,382,475 | $ | 2,303,602 | ||||||
The accompanying notes are an integral part of the consolidated financial statements.
71
GENERAL NUTRITION CENTERS, INC. AND SUBSIDIARIES
Consolidated Statements of Operations
(in thousands)
| |
Year ended December 31, | |||||||||
|---|---|---|---|---|---|---|---|---|---|---|
| |
2010
|
2009
|
2008
|
|||||||
Revenue |
$ | 1,822,396 | $ | 1,707,007 | $ | 1,656,729 | ||||
Cost of sales, including costs of warehousing, distribution and occupancy |
1,180,033 | 1,116,437 | 1,082,630 | |||||||
Gross profit |
642,363 | 590,570 | 574,099 | |||||||
Compensation and related benefits |
273,579 | 263,046 | 249,793 | |||||||
Advertising and promotion |
51,392 | 50,034 | 55,060 | |||||||
Other selling, general and administrative |
99,623 | 96,454 | 98,732 | |||||||
Strategic alternative costs |
3,480 | — | — | |||||||
Foreign currency (gain) loss |
(296 | ) | (155 | ) | 733 | |||||
Operating income |
214,585 | 181,191 | 169,781 | |||||||
Interest expense, net (Note 12) |
65,529 | 69,953 | 83,000 | |||||||
Income before income taxes |
149,056 | 111,238 | 86,781 | |||||||
Income tax expense (Note 5) |
50,883 | 41,619 | 32,001 | |||||||
Net income |
$ | 98,173 | $ | 69,619 | $ | 54,780 | ||||
The accompanying notes are an integral part of the consolidated financial statements.
72
GENERAL NUTRITION CENTERS, INC. AND SUBSIDIARIES
Consolidated Statements of Stockholder's Equity and Comprehensive Income
(in thousands, except
share data)
| |
Common Stock | |
|
Accumulated Other Comprehensive Income/(Loss) |
Total Stockholder's Equity |
||||||||||||||||
|---|---|---|---|---|---|---|---|---|---|---|---|---|---|---|---|---|---|---|---|---|---|
| |
Paid-in- Capital |
Retained Earnings |
|||||||||||||||||||
| |
Shares
|
Dollars
|
|||||||||||||||||||
Balance at December 31, 2007 |
100 | $ | — | $ | 590,593 | $ | 18,984 | $ | (852 | ) | $ | 608,725 | |||||||||
Comprehensive income: |
|||||||||||||||||||||
Net income |
— | — | — | 54,780 | — | 54,780 | |||||||||||||||
Unrealized loss on derivatives designated and qualified as cash flow hedges, net of tax of $4,829 |
— | — | — | — | (8,438 | ) | (8,438 | ) | |||||||||||||
Foreign currency translation adjustments |
— | — | — | — | (4,767 | ) | (4,767 | ) | |||||||||||||
Comprehensive income |
— | — | — | — | — | 41,575 | |||||||||||||||
Return of capital to GNC Corporation |
— | — | (832 | ) | — | — | (832 | ) | |||||||||||||
Non-cash stock-based compensation |
— | — | 2,594 | — | — | 2,594 | |||||||||||||||
Balance at December 31, 2008 |
100 | $ | — | $ | 592,355 | $ | 73,764 | $ | (14,057 | ) | $ | 652,062 | |||||||||
Comprehensive income: |
|||||||||||||||||||||
Net income |
— | — | — | 69,619 | — | 69,619 | |||||||||||||||
Unrealized gain on derivatives designated and qualified as cash flow hedges, net of tax of $1,537 |
— | — | — | — | 2,686 | 2,686 | |||||||||||||||
Foreign currency translation adjustments |
— | — | — | — | 4,172 | 4,172 | |||||||||||||||
Comprehensive income |
76,477 | ||||||||||||||||||||
Return of capital to GNC Corporation |
— | — | (278 | ) | — | — | (278 | ) | |||||||||||||
Non-cash stock-based compensation |
— | — | 2,855 | — | — | 2,855 | |||||||||||||||
Dividend payment |
— | — | — | (13,600 | ) | — | (13,600 | ) | |||||||||||||
Balance at December 31, 2009 |
100 | $ | — | $ | 594,932 | $ | 129,783 | $ | (7,199 | ) | $ | 717,516 | |||||||||
Comprehensive income: |
|||||||||||||||||||||
Net income |
— | — | — | 98,173 | — | 98,173 | |||||||||||||||
Unrealized gain on derivatives designated and qualified as cash flow hedges, net of tax of $2,625 |
— | — | — | — | 4,585 | 4,585 | |||||||||||||||
Foreign currency translation adjustments |
— | — | — | — | 1,334 | 1,334 | |||||||||||||||
Comprehensive income |
104,092 | ||||||||||||||||||||
Non-cash stock-based compensation |
— | — | 3,169 | — | — | 3,169 | |||||||||||||||
Dividend payment |
— | — | — | (28,384 | ) | — | (28,384 | ) | |||||||||||||
Balance at December 31, 2010 |
100 | $ | — | $ | 598,101 | $ | 199,572 | $ | (1,280 | ) | $ | 796,393 | |||||||||
The accompanying notes are an integral part of the consolidated financial statements.
73
GENERAL NUTRITION CENTERS, INC. AND SUBSIDIARIES
Consolidated Statements of Cash Flows
(in thousands)
| |
Year ended December 31, | |||||||||||
|---|---|---|---|---|---|---|---|---|---|---|---|---|
| |
2010
|
2009
|
2008
|
|||||||||
CASH FLOWS FROM OPERATING ACTIVITIES: |
||||||||||||
Net income |
$ | 98,173 | $ | 69,619 | $ | 54,780 | ||||||
Adjustments to reconcile net income to net cash provided by operating activities: |
||||||||||||
Depreciation expense |
39,206 | 36,906 | 31,562 | |||||||||
Amortization of intangible assets |
7,787 | 9,759 | 10,891 | |||||||||
Amortization of deferred financing fees |
4,282 | 4,104 | 3,907 | |||||||||
Amortization of original issue discount |
412 | 374 | 339 | |||||||||
Increase in provision for inventory losses |
16,250 | 11,151 | 14,406 | |||||||||
Non-cash stock-based compensation |
3,169 | 2,855 | 2,594 | |||||||||
(Decrease) increase in provision for losses on accounts receivable |
(811 | ) | (2,540 | ) | 253 | |||||||
(Increase) decrease in net deferred taxes |
(8,132 | ) | 21,431 | 24,371 | ||||||||
Changes in assets and liabilities: |
||||||||||||
Increase in receivables |
(10,145 | ) | (3,488 | ) | (5,371 | ) | ||||||
Increase in inventory, net |
(26,161 | ) | (15,661 | ) | (48,248 | ) | ||||||
Decrease (increase) in other working capital |
7,341 | 6,650 | (15,746 | ) | ||||||||
(Decrease) increase in accounts payable |
2,338 | (28,119 | ) | 22,075 | ||||||||
Decrease in interest payable |
(1,180 | ) | (1,193 | ) | (2,365 | ) | ||||||
Increase (decrease) in accrued liabilities |
9,186 | 2,109 | (16,083 | ) | ||||||||
Net cash provided by operating activities |
141,715 | 113,957 | 77,365 | |||||||||
CASH FLOWS FROM INVESTING ACTIVITIES: |
||||||||||||
Capital expenditures |
(32,522 | ) | (28,682 | ) | (48,666 | ) | ||||||
Merger of the Company (Note 1) |
(3,096 | ) | (11,268 | ) | (10,842 | ) | ||||||
Franchise store conversions |
177 | 239 | 404 | |||||||||
Acquisition of intangibles |
— | — | (1,000 | ) | ||||||||
Store acquisition costs |
(632 | ) | (2,463 | ) | (321 | ) | ||||||
Net cash used in investing activities |
(36,073 | ) | (42,174 | ) | (60,425 | ) | ||||||
CASH FLOWS FROM FINANCING ACTIVITIES: |
||||||||||||
Return of capital to Parent company |
— | (278 | ) | (832 | ) | |||||||
Dividend payment |
(28,384 | ) | (13,600 | ) | — | |||||||
Borrowings (payments) from revolving credit facility |
— | (5,375 | ) | 5,375 | ||||||||
Payments on long-term debt |
(1,721 | ) | (19,952 | ) | (7,974 | ) | ||||||
Financing fees |
— | (45 | ) | — | ||||||||
Net cash used in financing activities |
(30,105 | ) | (39,250 | ) | (3,431 | ) | ||||||
Effect of exchange rate on cash and cash equivalents |
15 | 249 | (56 | ) | ||||||||
Net increase in cash and cash equivalents |
75,552 | 32,782 | 13,453 | |||||||||
Beginning balance, cash and cash equivalents |
75,089 | 42,307 | 28,854 | |||||||||
Ending balance, cash and cash equivalents |
$ | 150,641 | $ | 75,089 | $ | 42,307 | ||||||
The accompanying notes are an integral part of the consolidated financial statements.
74
NOTE 1. NATURE OF BUSINESS
General Nature of Business. General Nutrition Centers, Inc. ("GNC" or the "Company"), a Delaware corporation, is a leading specialty retailer of nutritional supplements, which include: vitamins, minerals and herbal supplements ("VMHS"), sports nutrition products, diet products and other wellness products.
The Company's organizational structure is vertically integrated as the operations consist of purchasing raw materials, formulating and manufacturing products and selling the finished products through its retail, franchising and manufacturing/wholesale segments. The Company operates primarily in three segments: Retail; Franchising; and Manufacturing/Wholesale. Corporate retail store operations are located in North America and Puerto Rico and in addition the Company offers products domestically through GNC.com and www.drugstore.com. Franchise stores are located in the United States and 46 international countries. The Company operates its primary manufacturing facilities in South Carolina and distribution centers in Arizona, Pennsylvania and South Carolina. The Company manufactures the majority of its branded products, but also merchandises various third-party products. Additionally, the Company licenses the use of its trademarks and trade names.
The processing, formulation, packaging, labeling and advertising of the Company's products are subject to regulation by one or more federal agencies, including the Food and Drug Administration (the "FDA"), the Federal Trade Commission (the "FTC"), the Consumer Product Safety Commission, the United States Department of Agriculture and the Environmental Protection Agency. These activities are also regulated by various agencies of the states and localities in which the Company's products are sold.
Merger of the Company. On February 8, 2007, GNC Parent Corporation, our ultimate parent company at the time, entered into an Agreement and Plan of Merger (the "Merger Agreement") with GNC Acquisition Inc. and its parent company, GNC Acquisition Holdings Inc. ("Parent"), pursuant to which GNC Acquisition Inc. agreed to merge with and into GNC Parent Corporation, and as a result GNC Parent Corporation would continue as the surviving corporation and a wholly owned subsidiary of Parent (the "Merger"). The purchase equity contribution was made by Ares Corporate Opportunities Fund II, L.P. ("Ares") and Ontario Teachers' Pension Plan Board ("OTPP"), together with additional institutional investors and certain management of the Company. The transaction closed on March 16, 2007 and was accounted for under the purchase method of accounting. The transaction occurred between unrelated parties and no common control existed. The merger consideration (excluding acquisition costs of $13.7 million) totaled $1.65 billion, including the repayment of existing debt and other liabilities, and was funded with a combination of equity contributions and the issuance of new debt.
The Company was subject to certain tax adjustments that were settled upon filing of the predecessor's final tax return, and receipt of the tax refund associated with that return. Also, pursuant to the Merger Agreement, the Company agreed to pay additional consideration for amounts refunded from tax returns. During the period from March 16 to December 31, 2007, the Company paid $25.9 million in additional consideration for total cash paid for the Merger of $1,642.1 million. In 2010, 2009 and 2008, pursuant to the Merger Agreement, $3.1 million, $11.3 million, and $10.8 million of additional consideration was paid, respectively. The Merger Agreement requires payments to former shareholders and optionholders in lieu of income tax payments made for utilizing net operating losses ("NOL's") created as a result of the Merger.
Pursuant to the Merger Agreement, as amended, GNC Acquisition Inc. was merged with and into GNC Parent Corporation with GNC Parent Corporation surviving the Merger. Subsequently on March 16, 2007, GNC Parent Corporation was converted into a Delaware limited liability company and renamed GNC Parent LLC.
75
NOTE 2. BASIS OF PRESENTATION AND SUMMARY OF SIGNIFICANT ACCOUNTING POLICIES
Basis of Presentation
The accompanying consolidated financial statements and footnotes have been prepared by the Company in accordance with accounting principles generally accepted in the United States of America ("U.S. GAAP") and with the instructions to Form 10-K and Regulation S-X. The Company's normal reporting period is based on a calendar year.
Summary of Significant Accounting Policies
Principles of Consolidation. The consolidated financial statements include the accounts of the Company and all of its subsidiaries and a variable interest entity. All material intercompany transactions have been eliminated in consolidation.
The Company has no relationships with unconsolidated entities or financial partnerships, such as entities often referred to as structured finance or special purpose entities, which would have been established for the purpose of facilitating off balance sheet arrangements, or other contractually narrow or limited purposes.
Use of Estimates. The preparation of financial statements in conformity with U.S. GAAP requires management to make estimates and assumptions. Accordingly, these estimates and assumptions affect the reported amounts of assets and liabilities and disclosure of contingent assets and liabilities at the date of the financial statements, and the reported amounts of revenues and expenses during the reporting period. Some of the most significant estimates pertaining to the Company include the valuation of inventories, the allowance for doubtful accounts, income tax valuation allowances, leases, self insurance liability, and the recoverability of long-lived assets. On a regular basis, management reviews its estimates utilizing currently available information, changes in facts and circumstances, historical experience and reasonable assumptions. After such reviews and if deemed appropriate, those estimates are adjusted accordingly. Actual results could differ from those estimates.
Cash and Cash Equivalents. The Company considers cash and cash equivalents to include all cash and liquid deposits and investments with a maturity of three months or less. The majority of payments due from banks for third-party credit cards process within 24-48 hours, except for transactions occurring on a Friday, which are generally processed the following Monday. All credit card transactions are classified as cash and the amounts due from these transactions totaled $2.4 million and $2.1 million at December 31, 2010 and 2009, respectively.
Book overdrafts of $3.6 million and $0.7 million as of December 31, 2010 and 2009, respectively, represent checks issued that had not been presented for payment to the banks and are classified as accounts payable in the Company's consolidated balance sheet. The Company typically funds these overdrafts through normal collections of funds or transfers from bank balances at other financial institutions. Under the terms of the Company's facilities with its banks, the respective financial institutions are not legally obligated to honor the book overdraft balances as of December 31, 2010 and 2009, or any balance on any given date.
Inventories. Inventory components consist of raw materials, finished product and packaging supplies. Inventories are stated at the lower of cost or market on a first in/first out basis ("FIFO"). Cost is determined using a standard costing system which approximates actual costs. The Company regularly reviews its inventory levels in order to identify slow moving and short dated products, expected length of time for product sell through and future expiring product. Upon
76
NOTE 2. BASIS OF PRESENTATION AND SUMMARY OF SIGNIFICANT ACCOUNTING POLICIES (Continued)
analysis, the Company adjusts the carrying value for such inventory. When adjustments are considered necessary, after such reviews, the inventory balances are adjusted and reflected net in the accompanying financial statements.
Accounts Receivable and Allowance for Doubtful Accounts. The Company sells product to its franchisees and, to a lesser extent, various third parties. See Note 3, "Receivables", for the components of accounts receivable. To determine the allowance for doubtful accounts in accordance with the standard on impairment of receivables, factors that affect collectability from the Company's franchisees or third-party customers include their financial strength, payment history, reported sales and the overall retail economy. The Company establishes an allowance for doubtful accounts for franchisees based on an assessment of the franchisees' operations which includes analysis of their operating cash flows, sales levels, and status of amounts due to the Company, such as rent, interest and advertising. In addition, the Company considers the franchisees' inventory and fixed assets, which the Company can use as collateral in the event of a default by the franchisee. An allowance for international franchisees is calculated based on unpaid, non collateralized amounts associated with their receivable balance. An allowance for receivable balances due from third parties is recognized, if considered necessary, based on facts and circumstances. These allowances are deducted from the related receivables and reflected net in the accompanying financial statements.
Notes Receivable. The Company offers financing to qualified franchisees in connection with the initial purchase of a franchise store. The notes offered by the Company to its franchisees are demand notes, payable monthly over a period ranging from five to seven years. Interest accrues principally at an annual rate that ranges from 8.0% to 13.75%, based on the amount of initial deposit, and is payable monthly. Allowances for these receivables are recognized in accordance with the Company's policy described in Accounts Receivable and Allowance for Doubtful Accounts above.
Property, Plant and Equipment. Property, plant and equipment expenditures are recorded at cost. The remaining useful lives ranged from one year to sixteen years across all asset classes with the exception of buildings, whose useful lives ranged from fifteen to thirty seven years. Depreciation and amortization are recognized using the straight-line method over the estimated useful life of the property. Fixtures are depreciated over three to fifteen years, and equipment is generally depreciated over ten years. Computer equipment and software costs are generally depreciated over three to five years. Amortization of improvements to retail leased premises is recognized using the straight-line method over the estimated useful life of the improvements, or over the life of the related leases including renewals that are reasonably assured, whichever period is shorter. Buildings are depreciated over forty years and building improvements are depreciated over the remaining useful life of the building. The Company records tax depreciation in conformity with the provisions of applicable tax law.
Expenditures that materially increase the value or clearly extend the useful life of property, plant and equipment are capitalized in accordance with the policies outlined above. Repair and maintenance costs incurred in the normal operations of business are expensed as incurred. Gains from the sale of property, plant and equipment are recognized in current operations.
The Company recognized depreciation expense of property, plant and equipment of $39.2 million, $36.9 million, and $31.6 million for the years ended December 31, 2010, 2009 and 2008, respectively.
77
NOTE 2. BASIS OF PRESENTATION AND SUMMARY OF SIGNIFICANT ACCOUNTING POLICIES (Continued)
Goodwill and Intangible Assets. Goodwill represents the excess of purchase price over the fair value of identifiable net assets of acquired entities. Goodwill and intangible assets with indefinite useful lives are not amortized, but instead are tested for impairment at least annually. The Company completes its annual impairment test in the fourth quarter. The Company records goodwill and franchise rights upon the acquisition of franchisee stores when the consideration given to the franchisee exceeds the fair value of the identifiable assets acquired and liabilities assumed of the store. This goodwill is accounted for in accordance with the above policy. See Note 7, "Goodwill, Brands, and Other Intangible Assets, Net".
Long-lived Assets. The Company periodically performs reviews of underperforming businesses and other long-lived assets, including amortizable intangible assets, for impairment pursuant to the provisions of the standard related to the accounting for impairment on disposal of long lived assets. Factors the Company considers important that may trigger an impairment review include: significant changes in the manner of its use of assets of the strategy for its overall business; significant negative industry or economic trends; store closings; or under-performing business trends. These reviews may include an analysis of the current operations and capacity utilization, in conjunction with an analysis of the markets in which the businesses are operating. A comparison is performed of the undiscounted projected cash flows of the current operating forecasts to the net book value of the related assets. If it is determined that the full value of the assets may not be recoverable, an appropriate charge to adjust the carrying value of the long-lived assets to fair value may be required.
Revenue Recognition. The Company operates predominately as a retailer, through company-owned stores, franchise stores and sales through its website, GNC.com and to a lesser extent through wholesale operations.
The Retail segment recognizes revenue at the moment a sale to a customer is recorded. These revenues are recorded via the Company's point of sale system. Gross revenues are netted against actual customer returns and an allowance for expected customer returns. The Company records a reserve for expected customer returns based on management's estimate, which is derived from historical return data. Revenue is deferred on sales of the Company's Gold Cards and subsequently amortized over 12 months. The length of the amortization period is determined based on matching the discounts associated with the Gold Card program to the revenue deferral during the 12 month membership period. For an annual fee, the card provides customers with a 20% discount on all products purchased, both on the date the card is purchased and certain specified days of every month.
The Company also sells gift cards to its customers. Revenue from gift cards is recognized when the gift card is redeemed. These gift cards do not have expiration dates. Based upon historical redemption rates, a small percentage of gift cards will never be redeemed, referred to as "breakage". The Company first sold gift cards in late 2001 and the Company began to recognize gift card breakage revenue in 2008, when the likelihood of redemption became remote and amounts were not escheatable. Total revenue includes $0.3 million for each of the years ended December 31, 2010 and 2009, and $0.6 million for the year ended December 31, 2008 related to recognition of gift card breakage revenue.
The Franchise segment generates revenues through product sales to franchisees, royalties, franchise fees and interest income on the financing of the franchise locations. See Note 20, "Franchise Revenue". These revenues are netted by actual franchisee returns and an allowance for projected returns. The franchisees purchase a majority of the products they sell from the Company
78
NOTE 2. BASIS OF PRESENTATION AND SUMMARY OF SIGNIFICANT ACCOUNTING POLICIES (Continued)
at wholesale prices. Revenue on product sales to franchisees is recognized when risk of loss, title and insurable risks have transferred to the franchisee. Franchise fees are recognized by the Company at the time of a franchise store opening. Interest on the financing of franchisee notes receivable is recognized as it becomes due and payable. Gains from the sale of company-owned stores to franchisees are recognized in accordance with the standard on accounting for sales of real estate. This standard requires gains on sales of corporate stores to franchisees to be deferred until certain criteria are satisfied regarding the collectability of the related receivable and the seller's remaining obligations. Remaining sources of franchise income, including royalties, are recognized as earned.
The Manufacturing/Wholesale segment sells product primarily to the other Company segments and third-party customers. Revenue is recognized when risk of loss, title and insurable risks have transferred to the customer, net of estimated returns and allowances. The Company also has a consignment arrangement with certain customers and revenue is recognized when products are sold to the ultimate customer.
Cost of Sales. The Company purchases products directly from third-party manufacturers as well as manufactures its own products. The Company's cost of sales includes product costs, costs of warehousing and distribution and occupancy costs. The cost of manufactured products includes depreciation expense related to the manufacturing facility and related equipment.
Vendor Allowances. The Company enters into two main types of arrangements with certain vendors, the most significant of which results in the Company receiving credits as sales rebates based on arrangements with such vendors. The Company also enters into arrangements with certain vendors through which the Company receives rebates for purchases during the year typically based on volume discounts. As the right of offset exists under these arrangements, rebates received under both arrangements are recorded as a reduction in the vendors' accounts payable balances on the balance sheet and represent the estimated amounts due to GNC under the rebate provisions of such contracts. The corresponding rebate income is recorded as a reduction of cost of goods sold based on inventory turnover, in accordance with the provisions of the standard on accounting by a reseller for cash consideration received from a vendor. For volume rebates, the appropriate level of such income is derived from the level of actual purchases made by GNC from suppliers. The amount recorded as a reduction to cost of goods sold was $40.0 million, $34.1 million, and $29.3 million for the years ended December 31, 2010, 2009 and 2008, respectively.
Distribution and Shipping Costs. The Company bills franchisees and third-party customers shipping and transportation costs and reflects these charges in revenue. The unreimbursed costs that are associated with these costs are included in cost of sales.
Research and Development. Research and development costs arising from internally generated projects are expensed by the Company as incurred. The Company recognized $0.5 million, $0.4 million, and $0.9 million for the years ended December 31, 2010, 2009 and 2008, respectively. These costs are included in Other SG&A costs in the accompanying financial statements.
Advertising Expenditures. The Company recognizes advertising, promotion and marketing program costs the first time the advertising takes place with exception to the costs of producing advertising, which are expensed as incurred during production. The Company administers national advertising funds on behalf of its franchisees. In accordance with the franchisee contracts, the
79
NOTE 2. BASIS OF PRESENTATION AND SUMMARY OF SIGNIFICANT ACCOUNTING POLICIES (Continued)
Company collects advertising fees from the franchisees and utilizes the proceeds to coordinate various advertising and marketing campaigns. The Company recognized $51.4 million, $50.0 million, and $55.1 million for the years ended December 31, 2010, 2009 and 2008, respectively, net of approximately $11.0 million annually from the national advertising fund.
Leases. The Company has various operating leases for company-owned and franchise store locations and equipment. Store leases generally include amounts relating to base rental, percent rent and other charges such as common area maintenance fees and real estate taxes. Periodically, the Company receives varying amounts of reimbursements from landlords to compensate the Company for costs incurred in the construction of stores. These reimbursements are amortized by the Company as an offset to rent expense over the life of the related lease. The Company determines the period used for the straight-line rent expense for leases with option periods and conforms it to the term used for amortizing improvements.
The Company leases an approximately 300,000 square-foot-facility in Greenville, South Carolina where the majority of its proprietary products are manufactured. The Company also leases a 630,000 square foot complex located in Anderson, South Carolina, for packaging, materials receipt, lab testing, warehousing, and distribution. Both the Greenville and Anderson facilities are leased on a long-term basis pursuant to "fee-in-lieu-of-taxes" arrangements with the counties in which the facilities are located, but the Company retains the right to purchase each of the facilities at any time during the lease for $1.00, subject to a loss of tax benefits. As part of a tax incentive arrangement, the Company assigned the facilities to the counties and leases them back under operating leases. The Company leases the facilities from the counties where located, in lieu of paying local property taxes. Upon exercising its right to purchase the facilities back from the counties, the Company will be subject to the applicable taxes levied by the counties. In accordance with the standards on the accounting for leases, the purchase option in the lease agreements prevent sale-leaseback accounting treatment. As a result, the original cost basis of the facilities remains on the balance sheet and continues to be depreciated.
The Company leases a 217,000 square foot distribution center in Leetsdale, Pennsylvania and a 112,000 square foot distribution center in Phoenix, Arizona. The company also leases warehouse space in Canada. The Company also has operating leases for its fleet of distribution tractors and trailers and fleet of field management vehicles. In addition, the Company also has a minimal amount of leased office space in California, Florida, and Canada. The expense associated with leases that have escalating payment terms is recognized on a straight-line basis over the life of the lease. See Note 15, "Long-Term Lease Obligations".
Contingencies. In accordance with the standards on contingencies the Company accrues a loss contingency if it is probable and can be reasonably estimated or a liability had been incurred at the date of the financial statements if those financial statements have not been issued. If both of the conditions above are not met, or if an exposure to loss exists in excess of the amount accrued, disclosure of the contingency shall be made when there is at least a reasonable possibility that a loss or an additional loss may have been incurred. The Company accrues costs that are part of legal settlements when the settlement is probable.
Pre-Opening Expenditures. The Company recognizes the cost associated with the opening of new stores as incurred. These costs are charged to expense and are not material for the periods presented. Franchise store pre-opening costs are incurred by the franchisees.
80
NOTE 2. BASIS OF PRESENTATION AND SUMMARY OF SIGNIFICANT ACCOUNTING POLICIES (Continued)
Deferred Financing Fees. In conjunction with the Merger, $29.3 million in costs related to the financing of debt were capitalized and are being amortized over the life of the debt. Accumulated amortization as of December 31, 2010 and 2009 was $15.2 million and $10.9 million, respectively.
Income Taxes. The Company accounts for income taxes in accordance with the standards on income taxes. As prescribed by these standards, the Company utilizes the asset and liability method of accounting for income taxes. Under the asset and liability method, deferred tax assets and liabilities are recognized for the estimated future tax consequences attributable to differences between the financial statements carrying amounts of existing assets and liabilities and their respective tax bases. Deferred tax assets and liabilities are measured using enacted tax rates in effect for the year in which those temporary differences are expected to be recovered or settled. See Note 5, "Income Taxes".
For the year ended December 31, 2010, the Company will file a consolidated federal income tax return. For state income tax purposes, the Company will file on both a consolidated and separate return basis in the states in which it conducts business. The Company filed in a consistent manner in 2009 and 2008.
It is the Company's policy to recognize interest and penalties related to uncertain tax positions as a component of income tax expense. See Note 5, "Income Taxes", for additional information regarding the change in unrecognized tax benefits.
Self-Insurance. The Company has procured insurance for such areas as: (1) general liability; (2) product liability; (3) directors and officers liability; (4) property insurance; and (5) ocean marine insurance. The Company is self-insured for such areas as: (1) medical benefits; (2) worker's compensation coverage in the State of New York with a stop loss of $250,000; (3) physical damage to the Company's tractors, trailers and fleet vehicles for field personnel use; and (4) physical damages that may occur at the corporate store locations. The Company is not insured for certain property and casualty risks due to the Company's assessment of frequency and severity of a loss, the cost of insurance and the overall risk analysis.
The Company carries product liability insurance with a retention of $3.0 million per claim with an aggregate cap on retained losses of $10.0 million. The Company carries general liability insurance with retention of $110,000 per claim with an aggregate cap on retained losses of $600,000. The majority of the Company's workers' compensation and auto insurance are in a deductible/retrospective plan. The Company reimburses the insurance company for the workers compensation and auto liability claims, subject to a $250,000 and $100,000 loss limit per claim, respectively.
As part of the medical benefits program, the Company contracts with national service providers to provide benefits to its employees for all medical, dental, vision and prescription drug services. The Company then reimburses these service providers as claims are processed from Company employees. The Company maintains a specific stop loss provision of $250,000 per individual per plan year with a maximum lifetime benefit limit of $2.0 million per individual. The Company has no additional liability once a participant exceeds the $2.0 million ceiling. The Company's liability for medical claims is included as a component of accrued benefits in Note 10, "Accrued Payroll and Related Liabilities", and was $1.9 million and $2.0 million as of December 31, 2010 and 2009, respectively.
81
NOTE 2. BASIS OF PRESENTATION AND SUMMARY OF SIGNIFICANT ACCOUNTING POLICIES (Continued)
Stock Compensation. The Company utilizes the Black-Scholes model to calculate the fair value of options. The resulting compensation cost is recognized in the Company's financial statements over the option vesting period.
Foreign Currency. For all foreign operations, the functional currency is the local currency. In accordance with the standard on foreign currency matters, assets and liabilities of those operations, denominated in foreign currencies, are translated into U.S. dollars using period-end exchange rates, and income and expenses are translated using the average exchange rates for the reporting period. Gains or losses resulting from foreign currency transactions are included in results of operations.
Strategic alternative costs. The Company recognizes expenses incurred in the exploration of strategic alternatives as they are incurred. In 2010, the Company recognized $3.5 million of these expenses.
Financial Instruments and Derivatives. On January 1, 2009, the Company adopted the revised accounting standards on disclosure of derivative instruments and hedging activities. This new standard expands the current disclosure requirements. This new standard provides for an enhanced understanding of (1) how and why an entity uses derivative instruments, (2) how derivative instruments and related hedged items are accounted for under previous standards and their related interpretations, and (3) how derivative instruments affect an entity's financial position, financial performance, and cash flows.
As part of the Company's financial risk management program, it uses certain derivative financial instruments. The Company does not enter into derivative transactions for speculative purposes and holds no derivative instruments for trading purposes. The Company uses derivative financial instruments to reduce its exposure to market risk for changes in interest rates primarily in respect of its long term debt obligations. The Company tries to manage its interest rate risk in order to balance its exposure to both fixed and floating rates while minimizing its borrowing costs. Floating-to-fixed interest rate swap agreements, designated as cash flow hedges of interest rate risk, are entered into from time to time to hedge the Company's exposure to interest rate changes on a portion of the Company's floating rate debt. These interest rate swap agreements convert a portion of the Company's floating rate debt to fixed rate debt. Interest rate floors designated as cash flow hedges involve the receipt of variable-rate amounts from a counterparty if interest rates fall below the strike rate on the contract in exchange for an upfront premium. The Company records the fair value of these contracts as an asset or a liability, as applicable, in the balance sheet, with the offset to accumulated other comprehensive income (loss), net of tax. The Company measures hedge effectiveness by assessing the changes in the fair value or expected future cash flows of the hedged item. The ineffective portions, if any, are recorded in interest expense in the current period.
Derivatives designated as hedging instruments have been recorded in the consolidated balance sheet at fair value as follows:
| |
|
Fair Value | |||||||
|---|---|---|---|---|---|---|---|---|---|
| |
Balance Sheet Location
|
December 31, 2010
|
December 31, 2009
|
||||||
| |
|
(in thousands) |
|||||||
Interest Rate Products |
Other current liabilities | $ | 4,395 | $ | — | ||||
Interest Rate Products |
Other long-term liabilities | $ | 3,074 | $ | 14,679 | ||||
82
NOTE 2. BASIS OF PRESENTATION AND SUMMARY OF SIGNIFICANT ACCOUNTING POLICIES (Continued)
The Company has interest rate swap agreements outstanding that effectively converted notional amounts of an aggregate $550.0 million of debt from floating to fixed interest rates. The four outstanding agreements mature between April 2011 and September 2012. During the second quarter of 2009, the Company entered into one of its derivative contracts that consisted of an interest rate swap with a bought floor that effectively converted a notional amount of $150.0 million of the Senior Floating Rate Toggle Notes due 2014 (the "Senior Notes") from a floating to a fixed rate, effective September 2009. The floor is intended to replicate the optionality present in the original debt agreement, providing an equivalent offset in the interest payments.
Amounts reported in accumulated other comprehensive income related to derivatives will be reclassified to interest expense as interest payments are made on the Company's variable-rate debt. During the year ending December 31, 2011, the Company estimates that an additional $6.6 million will be reclassified as an increase to interest expense under the Company's current debt structure.
Components of gains and losses recorded in the consolidated balance sheet and consolidated income statements for the years ended December 31, 2010 and 2009 are as follows:
2010
Derivatives in Cash Flow Hedging Relationships |
Amount of Gain or (Loss) Recognized in OCI on Derivative (Effective Portion) |
Location of Gain or (Loss) Reclassified from Accumulated OCI into Income (Effective Portion) |
Amount of Gain or (Loss) Reclassified from Accumulated OCI into Income (Effective Portion) |
||||||
|---|---|---|---|---|---|---|---|---|---|
| (in thousands) |
|||||||||
Interest Rate Products |
$ | (7,393 | ) | Interest income/ (expense) | $ | (14,602 | ) | ||
2009
Derivatives in Cash Flow Hedging Relationships |
Amount of Gain or (Loss) Recognized in OCI on Derivative (Effective Portion) |
Location of Gain or (Loss) Reclassified from Accumulated OCI into Income (Effective Portion) |
Amount of Gain or (Loss) Reclassified from Accumulated OCI into Income (Effective Portion) |
||||||
|---|---|---|---|---|---|---|---|---|---|
| (in thousands) |
|||||||||
Interest Rate Products |
$ | (9,024 | ) | Interest income/ (expense) | $ | (13,247 | ) | ||
During the years ended December 31, 2010 and 2009, there was no amount recorded as ineffective from accumulated other comprehensive income.
Under the Company's agreements with its derivative counterparty, if the Company defaults on any of its indebtedness, including default where repayment of the indebtedness has not been accelerated by the lender, then the Company could also be declared in default on its derivative obligations.
As of December 31, 2010, the settlement value of derivatives in a net liability position related to these agreements was $10.6 million, including accrued interest of $2.9 million but excluding adjustments for nonperformance risk. If the Company had breached any of these provisions at December 31, 2010, it could have been required to settle its obligations under the agreements at
83
NOTE 2. BASIS OF PRESENTATION AND SUMMARY OF SIGNIFICANT ACCOUNTING POLICIES (Continued)
their full termination value, which approximates the fair value of derivatives including accrued interest.
Recently Issued Accounting Pronouncements
Fair Value
In January 2010, the FASB issued ASU 2010-06 "Improving Disclosures about Fair Value Measurements". ASU 2010-06 requires additional disclosures about fair measurements including transfers in and out of Levels 1 and 2 and more disaggregation for the different types of financial instruments. This ASU became effective for annual and interim reporting periods beginning after December 15, 2009 for most of the new disclosures and for periods beginning after December 15, 2010 for the new Level 3 disclosures. Comparative disclosures are not required in the first year the disclosures are required. The adoption of this standard did not have any impact on the Company's consolidated financial statements.
Other
In December 2009, the FASB issued ASU No. 2009-17, "Improvements to Financial Reporting by Enterprises Involved with Variable Interest Entities", which incorporates into the FASB Codification amendments to FASB Interpretation No. 46(R), "Consolidation of Variable Interest Entities", made by Statement of Financial Accounting Standard No. 167, "Accounting for Variable Interest Entities", to require that a comprehensive qualitative analysis be performed to determine whether a holder of variable interests in a variable interest entity also has a controlling financial interest in that entity. In addition, the amendments require that the same type of analysis be applied to entities that were previously designated as qualified special-purpose entities. The amendments were effective as of January 1, 2010. The adoption of ASU No. 2009-17 did not have a material impact on the Company's consolidated financial position, results of operations, and cash flows.
NOTE 3. RECEIVABLES
Receivables at each respective period consisted of the following:
| |
December 31, | ||||||
|---|---|---|---|---|---|---|---|
| |
2010
|
2009
|
|||||
| |
(in thousands) |
||||||
Trade receivables |
$ | 100,545 | $ | 90,832 | |||
Other |
3,711 | 4,889 | |||||
Allowance for doubtful accounts |
(1,564 | ) | (1,789 | ) | |||
Related party |
1,941 | 423 | |||||
|
$ | 104,633 | $ | 94,355 | |||
84
NOTE 4. INVENTORIES, NET
Inventories at each respective period consisted of the following:
| |
December 31, | ||||||
|---|---|---|---|---|---|---|---|
| |
2010
|
2009
|
|||||
| |
(in thousands) |
||||||
Finished product ready for sale |
$ | 319,050 | $ | 311,422 | |||
Work-in-process, bulk product and raw materials |
57,165 | 53,515 | |||||
Packaging supplies |
5,572 | 5,555 | |||||
|
$ | 381,787 | $ | 370,492 | |||
NOTE 5. INCOME TAXES
Deferred income taxes reflect the net tax effects of temporary differences between the carrying amount of assets and liabilities for financial reporting purposes and the amounts used for income tax purposes.
Significant components of the Company's deferred tax assets and liabilities at each respective period consisted of the following:
| |
December 31, 2010 | December 31, 2009 | |||||||||||||||||||
|---|---|---|---|---|---|---|---|---|---|---|---|---|---|---|---|---|---|---|---|---|---|
| |
Assets
|
Liabilities
|
Net
|
Assets
|
Liabilities
|
Net
|
|||||||||||||||
| |
(in thousands) |
||||||||||||||||||||
Deferred tax: |
|||||||||||||||||||||
Current assets (liabilities): |
|||||||||||||||||||||
Operating reserves |
$ | 3,018 | $ | — | $ | 3,018 | $ | 2,906 | $ | — | $ | 2,906 | |||||||||
Deferred revenue |
2,257 | — | 2,257 | 1,727 | — | 1,727 | |||||||||||||||
Prepaid expenses |
— | (7,032 | ) | (7,032 | ) | — | (10,170 | ) | (10,170 | ) | |||||||||||
Accrued worker compensation |
2,270 | — | 2,270 | 2,167 | — | 2,167 | |||||||||||||||
Foreign tax credits |
208 | — | 208 | 1,035 | — | 1,035 | |||||||||||||||
Interest rate swap |
1,600 | — | 1,600 | — | — | — | |||||||||||||||
Other |
2,970 | (1,284 | ) | 1,686 | 3,401 | (1,688 | ) | 1,713 | |||||||||||||
Total current |
$ | 12,323 | $ | (8,316 | ) | $ | 4,007 | $ | 11,236 | $ | (11,858 | ) | $ | (622 | ) | ||||||
Non-current assets (liabilities): |
|||||||||||||||||||||
Intangibles |
$ | — | $ | (312,119 | ) | $ | (312,119 | ) | $ | — | $ | (308,724 | ) | $ | (308,724 | ) | |||||
Fixed assets |
8,285 | — | 8,285 | 5,255 | — | 5,255 | |||||||||||||||
Stock compensation |
3,871 | — | 3,871 | 2,705 | — | 2,705 | |||||||||||||||
Net operating loss carryforwards |
7,432 | — | 7,432 | 8,100 | — | 8,100 | |||||||||||||||
Interest rate swap |
1,119 | — | 1,119 | 5,343 | — | 5,343 | |||||||||||||||
Other |
9,882 | (2,067 | ) | 7,815 | 5,957 | — | 5,957 | ||||||||||||||
Valuation allowance |
(4,418 | ) | — | (4,418 | ) | (7,530 | ) | — | (7,530 | ) | |||||||||||
Total non-current |
$ | 26,171 | $ | (314,186 | ) | $ | (288,015 | ) | $ | 19,830 | $ | (308,724 | ) | $ | (288,894 | ) | |||||
Total net deferred taxes |
$ | 38,494 | $ | (322,502 | ) | $ | (284,008 | ) | $ | 31,066 | $ | (320,582 | ) | $ | (289,516 | ) | |||||
As of December 31, 2010 and 2009, the Company had deferred tax assets relating to state NOLs in the amount of $7.4 million and $8.1 million, respectively. With the exception of $3.0 million and $0.6 million of deferred tax assets as of December 31, 2010 and 2009, respectively, a valuation
85
NOTE 5. INCOME TAXES (Continued)
allowance was provided for all the state NOLs as the Company currently believes that these NOLs, with lives ranging from five to twenty years, may not be realizable prior to their expiration. During 2010, the Company recorded a valuation allowance adjustment of $3.1 million, which reduced income tax expense. This valuation allowance adjustment reflects a change in circumstances that caused a change in judgment about the realizability of certain deferred tax assets related to state net operating losses. The effect of this tax benefit is included in the income tax reconciliation table under the caption "state income taxes, net of federal tax benefit".
The Company does not have any undistributed earnings of international subsidiaries, at December 31, 2010 and 2009, as these subsidiaries are either considered to be a branch for U.S. tax purposes, or incur cumulative net operating losses.
Income before income taxes consisted of the following components:
| |
Year Ended December 31, | |||||||||
|---|---|---|---|---|---|---|---|---|---|---|
| |
2010
|
2009
|
2008
|
|||||||
| |
(in thousands) |
|||||||||
Domestic |
$ | 146,906 | $ | 104,155 | $ | 79,840 | ||||
Foreign |
2,150 | 7,083 | 6,941 | |||||||
Total income before income taxes |
$ | 149,056 | $ | 111,238 | $ | 86,781 | ||||
Income tax expense / (benefit) for all periods consisted of the following components:
| |
Year Ended December 31, | ||||||||||
|---|---|---|---|---|---|---|---|---|---|---|---|
| |
2010
|
2009
|
2008
|
||||||||
| |
(in thousands) |
||||||||||
Current: |
|||||||||||
Federal |
$ | 47,903 | $ | 10,373 | $ | 3,082 | |||||
State |
10,422 | 6,704 | 3,391 | ||||||||
Foreign |
690 | 3,111 | 1,157 | ||||||||
|
59,015 | 20,188 | 7,630 | ||||||||
Deferred: |
|||||||||||
Federal |
(3,747 | ) | 20,548 | 22,753 | |||||||
State |
(4,385 | ) | 883 | 1,618 | |||||||
Foreign |
— | — | — | ||||||||
|
(8,132 | ) | 21,431 | 24,371 | |||||||
Income tax expense |
$ | 50,883 | $ | 41,619 | $ | 32,001 | |||||
86
NOTE 5. INCOME TAXES (Continued)
The following table summarizes the differences between the Company's effective tax rate for financial reporting purposes and the federal statutory tax rate.
| |
Year Ended December 31, | ||||||||||
|---|---|---|---|---|---|---|---|---|---|---|---|
| |
2010
|
2009
|
2008
|
||||||||
Percent of pretax earnings: |
|||||||||||
Statutory federal tax rate |
35.0 | % | 35.0 | % | 35.0 | % | |||||
Increase (reduction) resulting from: |
|||||||||||
State income tax, net of federal tax benefit |
0.9 | % | 2.6 | % | 2.6 | % | |||||
Other permanent differences |
0.6 | % | 0.9 | % | 1.2 | % | |||||
International operations, net of foreign tax credits |
0.1 | % | (0.6 | %) | — | ||||||
Federal tax credits and income deductions |
(4.1 | %) | (1.4 | %) | (2.5 | %) | |||||
Tax impact of uncertain tax positions and other |
1.6 | % | 0.9 | % | 0.6 | % | |||||
Effective income tax rate |
34.1 | % | 37.4 | % | 36.9 | % | |||||
Due to the Company being able to fully utilize its remaining federal net operating losses in 2009, the Company was able to realize additional federal income tax benefits during 2010 related to certain federal tax credits and incentives. In addition, at December 31, 2010 and 2009, the Company had a liability of $8.7 million and $6.8 million, respectively, for unrecognized tax benefits. The Company recognizes interest and penalties accrued related to unrecognized tax benefits in income tax expense. Accrued interest and penalties were $2.9 million and $2.2 million as of December 31, 2010 and 2009, respectively.
As of December 31, 2010, the Company is not aware of any positions for which it is reasonably possible that the total amounts of unrecognized tax benefits will significantly increase or decrease within the next 12 months.
The Company files a consolidated federal tax return and various consolidated and separate tax returns as prescribed by the tax laws of the state and local jurisdictions in which it and its subsidiaries operate. The Company has been audited by the Internal Revenue Service, ("IRS"), through its March 15, 2007 tax year. The IRS commenced an examination of the Company's 2005, 2006 and short period 2007 federal income tax returns in February 2008. The IRS issued an examination report in the second quarter of 2009, the Company received notification from the IRS that the Joint Committee of Taxation had completed its review and had taken no exceptions to the conclusions reached by the IRS. As such the Company recorded a discrete tax benefit of $0.9 million for the reduction of its liability of unrecognized tax benefits. The Company has various state and local jurisdiction tax years open to examination (earliest open period 2004), and the Company also has certain state and local jurisdictions currently under audit. As of December 31, 2010, the Company believes that it is appropriately reserved for any potential federal and state income tax exposures.
87
NOTE 5. INCOME TAXES (Continued)
A reconciliation of the beginning and ending amount of unrecognized tax benefits is as follows:
| |
December 31, | |||||||||
|---|---|---|---|---|---|---|---|---|---|---|
| |
2010
|
2009
|
2008
|
|||||||
| |
(in thousands) |
|||||||||
Balance of unrecognized tax benefits at beginning of period |
$ | 6,776 | $ | 5,542 | $ | 6,871 | ||||
Additions for tax positions taken during current period |
1,027 | 1,881 | 1,620 | |||||||
Additions for tax positions taken during prior periods |
1,880 | 2,108 | — | |||||||
Reductions for tax positions taken during prior periods |
(39 | ) | (2,264 | ) | (2,059 | ) | ||||
Settlements |
(924 | ) | (491 | ) | (890 | ) | ||||
Balance of unrecognized tax benefits at end of period |
$ | 8,720 | $ | 6,776 | $ | 5,542 | ||||
At December 31, 2010, the amount of unrecognized tax benefits that, if recognized, would affect the effective tax rate is $8.7 million. While it is often difficult to predict the final outcome or the timing of resolution of any particular uncertain tax position, the Company believes that its unrecognized tax benefits reflect the most likely outcome. The Company adjusts these unrecognized tax benefits, as well as the related interest, in light of changing facts and circumstances. Settlement of any particular position could require the use of cash. Favorable resolution would be recognized as a reduction to its effective income tax rate in the period of resolution.
NOTE 6. PREPAIDS AND OTHER CURRENT ASSETS
Other current assets at each respective period consisted of the following at December 31:
| |
2010
|
2009
|
|||||
|---|---|---|---|---|---|---|---|
| |
(in thousands) |
||||||
Current portion of franchise note receivables |
$ | 976 | $ | 718 | |||
Prepaid rent |
14,003 | 13,397 | |||||
Prepaid insurance |
2,974 | 4,452 | |||||
Prepaid income tax |
3,607 | 9,737 | |||||
Prepaid payroll tax |
992 | 923 | |||||
Deferred tax asset (Note 5) |
4,007 | — | |||||
Other current assets |
13,066 | 12,992 | |||||
|
$ | 39,625 | $ | 42,219 | |||
88
NOTE 7. GOODWILL, BRANDS, AND OTHER INTANGIBLE ASSETS, NET
Management utilized various resources in arriving at its final fair value adjustments that were made to the Company's financial statements as of March 16, 2007. In connection with the Merger, final fair values were assigned to various other intangible assets. The Company's brands were assigned a final fair value representing the longevity of the Company name and general recognition of the product lines. The Gold Card program was assigned a final fair value representing the underlying customer listing, for both the Retail and Franchise segments. The retail agreements were assigned a final fair value reflecting the opportunity to expand the Company stores within a major drug store chain and on military facilities. A final fair value was assigned to the agreements with the Company's franchisees, both domestic and international, to operate stores for a contractual period. Final fair values were assigned to the Company's manufacturing and wholesale segments for production and continued sales to certain customers.
For the years ended December 31, 2010 and 2009, the Company acquired 24 and 53 franchise stores, respectively. These acquisitions are accounted for utilizing the purchase method of accounting and the Company records the acquired inventory, fixed assets, franchise rights and goodwill, with an applicable reduction to receivables and cash. For the years ended December 31, 2010 and 2009, the total purchase prices associated with these acquisitions was $2.5 million and $9.3 million, respectively, of which $0.6 million and $2.5 million, respectively, was paid in cash.
The following table summarizes the Company's goodwill activity:
| |
Retail
|
Franchising
|
Manufacturing/ Wholesale |
Total
|
|||||||||
|---|---|---|---|---|---|---|---|---|---|---|---|---|---|
| |
(in thousands) |
||||||||||||
Balance at December 31, 2008 |
$ | 302,765 | $ | 117,303 | $ | 202,841 | $ | 622,909 | |||||
Acquired franchise stores |
1,844 | — | — | 1,844 | |||||||||
Balance at December 31, 2009 |
$ | 304,609 | $ | 117,303 | $ | 202,841 | $ | 624,753 | |||||
Acquired franchise stores |
488 | — | — | 488 | |||||||||
Balance at December 31, 2010 |
$ | 305,097 | $ | 117,303 | $ | 202,841 | $ | 625,241 | |||||
Intangible assets other than goodwill consisted of the following at each respective period:
| |
Gold Card
|
Retail Brand |
Franchise Brand |
Operating Agreements |
Franchise Rights |
Total
|
|||||||||||||
|---|---|---|---|---|---|---|---|---|---|---|---|---|---|---|---|---|---|---|---|
| |
(in thousands) |
||||||||||||||||||
Balance at December 31, 2008 |
$ | 2,456 | $ | 500,000 | $ | 220,000 | $ | 160,019 | $ | 701 | $ | 883,176 | |||||||
Acquired franchise stores |
— | — | — | — | 953 | 953 | |||||||||||||
Amortization expense |
(2,081 | ) | — | — | (6,943 | ) | (735 | ) | (9,759 | ) | |||||||||
Balance at December 31, 2009 |
$ | 375 | $ | 500,000 | $ | 220,000 | $ | 153,076 | $ | 919 | $ | 874,370 | |||||||
Acquired franchise stores |
— | — | — | 641 | 641 | ||||||||||||||
Amortization expense |
(375 | ) | — | — | (6,853 | ) | (559 | ) | (7,787 | ) | |||||||||
Balance at December 31, 2010 |
$ | — | $ | 500,000 | $ | 220,000 | $ | 146,223 | $ | 1,001 | $ | 867,224 | |||||||
89
NOTE 7. GOODWILL, BRANDS, AND OTHER INTANGIBLE ASSETS, NET (Continued)
The following table represents the gross carrying amount and accumulated amortization for each major intangible asset:
| |
|
December 31, 2010 | December 31, 2009 | ||||||||||||||||||
|---|---|---|---|---|---|---|---|---|---|---|---|---|---|---|---|---|---|---|---|---|---|
| |
Estimated Life in years |
||||||||||||||||||||
| |
Cost
|
Accumulated Amortization |
Carrying Amount |
Cost
|
Accumulated Amortization |
Carrying Amount |
|||||||||||||||
| |
|
(in thousands) |
|||||||||||||||||||
Brands — retail |
— | $ | 500,000 | $ | — | $ | 500,000 | $ | 500,000 | $ | — | $ | 500,000 | ||||||||
Brands — franchise |
— | 220,000 | — | 220,000 | 220,000 | — | 220,000 | ||||||||||||||
Gold card — retail |
3 | 3,500 | (3,500 | ) | — | 3,500 | (3,354 | ) | 146 | ||||||||||||
Gold card — franchise |
3 | 5,500 | (5,500 | ) | — | 5,500 | (5,271 | ) | 229 | ||||||||||||
Retail agreements |
25-35 | 31,000 | (4,143 | ) | 26,857 | 31,000 | (3,090 | ) | 27,910 | ||||||||||||
Franchise agreements |
25 | 70,000 | (10,617 | ) | 59,383 | 70,000 | (7,817 | ) | 62,183 | ||||||||||||
Manufacturing agreements |
25 | 70,000 | (10,617 | ) | 59,383 | 70,000 | (7,817 | ) | 62,183 | ||||||||||||
Other intangibles |
5 | 1,150 | (550 | ) | 600 | 1,150 | (350 | ) | 800 | ||||||||||||
Franchise rights |
1-5 | 3,702 | (2,701 | ) | 1,001 | 3,061 | (2,142 | ) | 919 | ||||||||||||
|
$ | 904,852 | $ | (37,628 | ) | $ | 867,224 | $ | 904,211 | $ | (29,841 | ) | $ | 874,370 | |||||||
The following table represents future estimated amortization expense of intangible assets with finite lives:
Years ending December 31,
|
Estimated amortization expense |
|||
|---|---|---|---|---|
| |
(in thousands) |
|||
2011 |
7,386 | |||
2012 |
7,105 | |||
2013 |
6,998 | |||
2014 |
6,710 | |||
2015 |
6,673 | |||
Thereafter |
112,352 | |||
Total |
$ | 147,224 | ||
90
NOTE 8. PROPERTY, PLANT AND EQUIPMENT, NET
Property, plant and equipment at each respective period consisted of the following at December 31:
| |
2010
|
2009
|
|||||
|---|---|---|---|---|---|---|---|
| |
(in thousands) |
||||||
Land, buildings and improvements |
$ | 63,400 | $ | 61,572 | |||
Machinery and equipment |
89,977 | 82,273 | |||||
Leasehold improvements |
82,594 | 72,284 | |||||
Furniture and fixtures |
55,247 | 44,963 | |||||
Software |
20,393 | 18,035 | |||||
Construction in progress |
549 | 4,974 | |||||
Total property, plant and equipment |
$ | 312,160 | $ | 284,101 | |||
Less: accumulated depreciation |
(118,732 | ) | (84,520 | ) | |||
Net property, plant and equipment |
$ | 193,428 | $ | 199,581 | |||
The Company is a 50% limited partner in a partnership that owns and manages the building that houses the Company's corporate headquarters. The Company occupies the majority of the available lease space of the building. The general partner is responsible for the operation and management of the property and reports the results of the partnership to the Company. The Company has consolidated the limited partnership, net of elimination adjustments, in the accompanying consolidated financial statements.
NOTE 9. OTHER LONG-TERM ASSETS
Other assets at each respective period consisted of the following at December 31:
| |
2010
|
2009
|
|||||
|---|---|---|---|---|---|---|---|
| |
(in thousands) |
||||||
Long-term franchise notes receivables |
$ | 3,520 | $ | 2,646 | |||
Long-term deposit |
619 | 517 | |||||
Other |
1,628 | 1,169 | |||||
|
$ | 5,767 | $ | 4,332 | |||
Annual maturities of the Company's long term and current (see current portion in Note 6, "Prepaids and Other Current Assets") franchise notes receivable at December 31, 2010 are as follows:
Years ending December 31,
|
Receivables
|
|||
|---|---|---|---|---|
| |
(in thousands) |
|||
2011 |
976 | |||
2012 |
1,052 | |||
2013 |
1,072 | |||
2014 |
935 | |||
Thereafter |
461 | |||
Total |
$ | 4,496 | ||
91
NOTE 10. ACCRUED PAYROLL AND RELATED LIABILITIES
Accrued payroll and related liabilities at each respective period consisted of the following at December 31:
| |
December 31, | ||||||
|---|---|---|---|---|---|---|---|
| |
2010
|
2009
|
|||||
| |
(in thousands) |
||||||
Accrued payroll |
$ | 20,204 | $ | 17,255 | |||
Accrued taxes and benefits |
5,406 | 5,022 | |||||
Total |
$ | 25,610 | $ | 22,277 | |||
NOTE 11. DEFERRED REVENUE AND OTHER CURRENT LIABILITIES
Other current liabilities at each respective period consisted of the following at December 31:
| |
2010
|
2009
|
|||||
|---|---|---|---|---|---|---|---|
| |
(in thousands) |
||||||
Deferred revenue |
$ | 35,467 | $ | 33,837 | |||
Payable to former shareholders |
— | 2,625 | |||||
Accrued occupancy |
5,530 | 4,882 | |||||
Accrued worker compensation |
6,354 | 5,892 | |||||
Accrued taxes |
6,435 | 5,683 | |||||
Deferred tax liability (see Note 5) |
— | 622 | |||||
Accrued income tax |
— | 404 | |||||
Fair value of interest rate swap agreements |
4,395 | — | |||||
Other current liabilities |
10,160 | 11,185 | |||||
Total |
$ | 68,341 | $ | 65,130 | |||
Deferred revenue consists primarily of Gold Card and gift card deferrals.
NOTE 12. LONG-TERM DEBT / INTEREST
In conjunction with the Merger, the Company repaid certain of its existing debt and issued new debt. The new debt, which was entered into or issued on the closing, consisted of the senior credit facility comprised of a $675.0 million term loan facility and the $60.0 million revolving credit facility (the "Senior Credit Facility"), $300.0 million aggregate principal amount of the Senior Notes, and $110.0 million aggregate principal amount of 10.75% Senior Subordinated Notes due 2015 (the "Senior Subordinated Notes"). The Company utilized proceeds from the new debt to repay its December 2003 Senior Credit Facility, its 85/8% Senior Notes issued in January 2005, and its 81/2%
92
NOTE 12. LONG-TERM DEBT / INTEREST (Continued)
Senior Subordinated Notes issued in December 2003. Long-term debt at each respective period consisted of the following:
| |
December 31, | ||||||
|---|---|---|---|---|---|---|---|
| |
2010
|
2009
|
|||||
| |
(in thousands) |
||||||
Senior Credit Facility |
$ | 644,382 | $ | 644,619 | |||
Senior Notes |
298,372 | 297,959 | |||||
Senior Subordinated Notes |
110,000 | 110,000 | |||||
Mortgage |
5,711 | 7,184 | |||||
Capital leases |
34 | 47 | |||||
Less: current maturities |
(28,070 | ) | (1,724 | ) | |||
Total |
$ | 1,030,429 | $ | 1,058,085 | |||
At December 31, 2010, the Company's total debt principal maturities are as follows:
Years Ending December 31, |
Senior Credit Facility |
Senior Notes(a) |
Senior Subordinated Notes |
Mortgage Loan/ Capital Leases |
Total
|
|||||||||||
|---|---|---|---|---|---|---|---|---|---|---|---|---|---|---|---|---|
| |
(in thousands) |
|||||||||||||||
2011 |
$ | 26,478 | $ | — | $ | — | $ | 1,592 | $ | 28,070 | ||||||
2012 |
— | — | — | 1,709 | 1,709 | |||||||||||
2013 |
617,904 | — | — | 1,812 | 619,716 | |||||||||||
2014 |
— | 300,000 | — | 632 | 300,632 | |||||||||||
2015 |
— | — | 110,000 | — | 110,000 | |||||||||||
|
$ | 644,382 | $ | 300,000 | $ | 110,000 | $ | 5,745 | $ | 1,060,127 | ||||||
- (a)
- The Senior Notes include the balance of the initial original issue discount of $3.0 million.
The Company's net interest expense for each respective period is as follows:
| |
December 31, | ||||||||||
|---|---|---|---|---|---|---|---|---|---|---|---|
| |
2010
|
2009
|
2008
|
||||||||
| |
(in thousands) |
||||||||||
Senior Credit Facility |
|||||||||||
Term Loan |
$ | 29,185 | $ | 32,775 | $ | 43,302 | |||||
Revolver |
445 | 489 | 482 | ||||||||
Senior Notes |
19,440 | 20,003 | 23,671 | ||||||||
Senior Subordinated Notes |
11,825 | 11,825 | 11,825 | ||||||||
Deferred financing fees |
4,282 | 4,104 | 3,907 | ||||||||
Mortgage |
445 | 544 | 643 | ||||||||
OID amortization |
412 | 374 | 339 | ||||||||
Interest income |
(505 | ) | (161 | ) | (1,169 | ) | |||||
Interest expense, net |
$ | 65,529 | $ | 69,953 | $ | 83,000 | |||||
93
NOTE 12. LONG-TERM DEBT / INTEREST (Continued)
Accrued interest at each respective period consisted of the following:
| |
December 31, | ||||||
|---|---|---|---|---|---|---|---|
| |
2010
|
2009
|
|||||
| |
(in thousands) |
||||||
Senior Credit Facility |
$ | 4,173 | $ | 5,350 | |||
Senior Notes |
5,717 | 5,720 | |||||
Senior Subordinated Notes |
3,482 | 3,482 | |||||
Total |
$ | 13,372 | $ | 14,552 | |||
Description of Debt:
Senior Credit Facility. The Senior Credit Facility consists of a $675.0 million Term Loan Facility and a $60.0 million revolving credit facility (the "Revolving Credit Facility"). The Term Loan Facility will mature in September 2013. The Revolving Credit Facility will mature in March 2012. The Senior Credit Facility permits the Company to prepay a portion or all of the outstanding balance without incurring penalties (except LIBOR breakage costs). Subject to certain exceptions, the credit agreement requires that 100% of the net cash proceeds from certain asset sales, casualty insurance, condemnations and debt issuances, and a specified percentage (ranging from 50% to 0% based on a defined leverage ratio) of excess cash flow (as defined in the agreement) for each fiscal year must be used to pay down outstanding borrowings. GNC Corporation, the Company's direct parent company ("GNC Corporation"), and the Company's existing and future direct and indirect domestic subsidiaries have guaranteed the Company's obligations under the Senior Credit Facility. In addition, the Senior Credit Facility is collateralized by first priority pledges (subject to permitted liens) of the Company's equity interests and the equity interests of the Company's domestic subsidiaries.
All borrowings under the Senior Credit Facility bear interest, at the Company's option, at a rate per annum equal to (i) the higher of (x) the prime rate (as publicly announced by JP Morgan Chase Bank, N.A. as its prime rate in effect) and (y) the federal funds effective rate, plus 0.50% per annum plus, at December 31, 2010, applicable margins of 1.25% per annum for the Term Loan Facility and 0.75% per annum for the Revolving Credit Facility or (ii) adjusted LIBOR plus 2.25% per annum for the term loan facility and 1.75% per annum for the Revolving Credit Facility. In addition to paying interest on outstanding principal under the Senior Credit Facility, the Company is required to pay a commitment fee to the lenders under the Revolving Credit Facility in respect of unutilized revolving loan commitments at a rate of 0.50% per annum. The Company pays interest on outstanding borrowings on the Revolving Credit Facility at a Eurodollar rate or Adjusted Base Rate ("ABR") plus the applicable margin in effect. As of December 31, 2010 and 2009, the ABR was 4.00% and 4.25%, respectively.
The Company issues letters of credit as a guarantee of payment to third-payment vendors in accordance with specified terms and conditions. It also issues letters of credit for various insurance contracts. The Revolving Credit Facility allows for $25.0 million of the $60.0 million Revolving Credit Facility to be used as collateral for outstanding letters of credit. As of December 31, 2010 and 2009, $8.8 million and $7.9 million, respectively, of the Revolving Credit Facility was utilized to secure letters of credit.
The Senior Credit Facility contains customary covenants, including incurrence covenants and certain other limitations on the ability of GNC Corporation, the Company, and its subsidiaries to
94
NOTE 12. LONG-TERM DEBT / INTEREST (Continued)
incur additional debt, guarantee other obligations, grant liens on assets, make investments or acquisitions, dispose of assets, make optional payments or modifications of other debt instruments, pay dividends or other payments on capital stock, engage in mergers or consolidations, enter into sale and leaseback transactions, enter into arrangements that restrict the Company's and its subsidiaries' ability to pay dividends or grant liens, engage in transactions with affiliates, and change the passive holding company status of GNC Corporation. At December 31, 2010, the Company's consolidated subsidiaries' restricted net assets were $1,982.4 million and the amount of unrestricted retained earnings was $26.2 million.
The Senior Credit Facility contains events of default, including (subject to customary cure periods and materiality thresholds) defaults based on (1) the failure to make payments under the Senior Credit Facility when due, (2) breach of covenants, (3) inaccuracies of representations and warranties, (4) cross-defaults to other material indebtedness, (5) bankruptcy events, (6) material judgments, (7) certain matters arising under the Employee Retirement Income Security Act of 1974, as amended, (8) the actual or asserted invalidity of documents relating to any guarantee or security document, (9) the actual or asserted invalidity of any subordination terms supporting the Senior Credit Facility and (10) the occurrence of a change in control. If any such event of default occurs, the lenders would be entitled to accelerate the facilities and take various other actions, including all actions permitted to be taken by a collateralized creditor. If certain bankruptcy events occur, the facilities will automatically accelerate.
The Company issues letters of credit as a guarantee of payment to third-payment vendors in accordance with specified terms and conditions. It also issues letters of credit for various insurance contracts. The revolving credit facility allows for $25.0 million of the $60.0 million Revolving Credit Facility to be used as collateral for outstanding letters of credit.
The Company pays interest based on the aggregate available amount of the Revolving Credit Facility at a per annum rate equal to 0.5%. The Company pays interest on outstanding borrowings on the Revolving Credit Facility at a Eurodollar rate or ABR plus the applicable margin in effect. As of December 31, 2010 and 2009, the ABR was 4.00% and 4.25%, respectively. The Company also pays an additional interest rate between 1.75% and 2.25% per annum on all outstanding letters of credit issued. As of December 31, 2010 and 2009, $8.8 million and $7.9 million, respectively, of the Revolving Credit Facility was utilized to secure letters of credit.
Senior Notes. In connection with the Merger, the Company completed a private offering of $300.0 million of Senior Notes at 99% of par value. The Senior Notes are the Company's senior non collateralized obligations and are effectively subordinated to all of the Company's existing and future collateralized debt, including the Senior Credit Facility, to the extent of the assets securing such debt, rank equally with all the Company's existing and future non collateralized senior debt and rank senior to all the Company's existing and future senior subordinated debt, including the Senior Subordinated Notes. The Senior Notes are guaranteed on a senior non collateralized basis by each of the Company's existing and future domestic subsidiaries (as defined in the Senior Notes indenture). If the Company fails to make payments on the Senior Notes, the notes guarantors must make them instead.
The Company may elect in its sole discretion to pay interest on the Senior Notes in cash, entirely by increasing the principal amount of the Senior Notes or issuing new Senior Notes ("PIK interest"), or on 50% of the outstanding principal amount of the Senior Notes in cash and on 50% of the outstanding principal amount of the Senior Notes by increasing the principal amount of the Senior Notes or by issuing new Senior Notes ("partial PIK interest"). Cash interest on the Senior Notes accrues at six-month LIBOR (1.25% minimum) plus 4.5% per annum, and PIK interest, if any,
95
NOTE 12. LONG-TERM DEBT / INTEREST (Continued)
accrues at six-month LIBOR plus 5.25% per annum. If the Company elects to pay PIK interest or partial PIK interest, it will increase the principal amount of the Senior Notes or issue new Senior Notes in an aggregate principal amount equal to the amount of PIK interest for the applicable interest payment period (rounded up to the nearest $1,000) to holders of the Senior Notes on the relevant record date. The Senior Notes are treated as having been issued with original issue discount for U.S. federal income tax purposes. Interest on the Senior Notes is payable semi-annually in arrears on March 15 and September 15 of each year.
The Company may redeem some or all of the Senior Notes at any time at specified redemption prices. If the Company experiences certain kinds of changes in control, it must offer to purchase the notes at 101% of par plus accrued interest to the purchase date.
The Senior Notes indenture contains certain limitations and restrictions on the Company's and the Company's restricted subsidiaries' ability to incur additional debt beyond certain levels, pay dividends, redeem or repurchase the Company's stock or subordinated indebtedness or make other distributions, dispose of assets, grant liens on assets, make investments or acquisitions, engage in mergers or consolidations, enter into arrangements that restrict the Company's ability to pay dividends or grant liens and engage in transactions with affiliates. In addition, the Senior Notes indenture restricts the Company's and certain of the Company's subsidiaries' ability to declare or pay dividends to its stockholders.
In accordance with the terms of the Senior Notes purchase agreement and the offering memorandum, these notes were required to be exchanged for publicly registered exchange notes within 210 days after the sale of these notes. As required, these notes were registered and the exchange offer was completed on September 28, 2007.
Senior Subordinated Notes. In connection with the Merger, the Company completed a private offering of $110.0 million of the Senior Subordinated Notes due 2015. The Senior Subordinated Notes are the Company's senior subordinated non collateralized obligations and are subordinated to all the Company's existing and future senior debt, including the Company's Senior Credit Facility and the Senior Notes, rank equally with all of the Company's existing and future senior subordinated debt, and rank senior to all the Company's existing and future subordinated debt. The Senior Subordinated Notes are guaranteed on a senior subordinated non collateralized basis by each of the Company's existing and future domestic subsidiaries (as defined in the Senior Subordinated Notes indenture). If the Company fails to make payments on the Senior Subordinated Notes, the notes guarantors must make them instead. Interest on the Senior Subordinated Notes accrues at the rate of per year from March 16, 2007 and is payable semi-annually in arrears on March 15 and September 15 of each year.
The Company may redeem some or all of the Senior Subordinated Notes at any time at specified redemption prices. If the Company experiences certain kinds of changes in control, it must offer to purchase the Senior Subordinated Notes at 101% of par plus accrued interest to the purchase date.
The Senior Subordinated Notes indenture contains certain limitations and restrictions on the Company's and its restricted subsidiaries' ability to incur additional debt beyond certain levels, pay dividends, redeem or repurchase the Company's stock or subordinated indebtedness or make other distributions, dispose of assets, grant liens on assets, make investments or acquisitions, engage in mergers or consolidations, enter into arrangements that restrict the Company's ability to pay dividends or grant liens and engage in transactions with affiliates. In addition, the Senior Subordinated Notes indenture restricts the Company's and certain of the Company's subsidiaries' ability to declare or pay dividends to the Company's stockholders.
96
NOTE 12. LONG-TERM DEBT / INTEREST (Continued)
In accordance with the terms of the Senior Subordinated Notes purchase agreement and the offering memorandum, these notes were required to be exchanged for publicly registered exchange notes within 210 days after the sale of these notes. As required, these notes were registered and the exchange offer was completed on September 28, 2007.
The Company expects to fund its operations through internally generated cash and, if necessary, from borrowings under the amount remaining available under the Revolving Credit Facility. The Company expects its primary uses of cash in the near future will be debt service requirements, capital expenditures and working capital requirements. The Company anticipates that cash generated from operations, together with amounts available under the Revolving Credit Facility, will be sufficient to meet its future operating expenses, capital expenditures and debt service obligations as they become due. However, the Company's ability to make scheduled payments of principal on, to pay interest on, or to refinance the Company's indebtedness and to satisfy the Company's other debt obligations will depend on the Company's future operating performance, which will be affected by general economic, financial and other factors beyond the Company's control. The Company believes that it has complied with the Company's covenant reporting and compliance in all material respects for the year ended December 31, 2010.
Proposed Refinancing. On February 7, 2011, the Company announced that it intends to enter into, subject to market and other conditions, a financing transaction with certain lenders. The Company currently expects to use the proceeds from the transaction, if consummated, to, among other things, refinance its existing indebtedness. There can be no assurance that the Company will complete any such refinancing either on terms acceptable to it, or at all.
NOTE 13. OTHER LONG TERM LIABILITIES
Other long term liabilities at each respective period consisted of the following:
| |
December 31, | ||||||
|---|---|---|---|---|---|---|---|
| |
2010
|
2009
|
|||||
| |
(in thousands) |
||||||
Fair value of interest rate swap agreements |
$ | 3,074 | $ | 14,679 | |||
Liability for unrecognized tax benefits |
8,720 | 6,776 | |||||
Rent escalations |
10,566 | 10,569 | |||||
Other |
11,590 | 7,496 | |||||
Total |
$ | 33,950 | $ | 39,520 | |||
NOTE 14. FINANCIAL INSTRUMENTS
At December 31, 2010 and 2009, the Company's financial instruments consisted of cash and cash equivalents, receivables, franchise notes receivable, accounts payable, certain accrued liabilities and long-term debt. The carrying amount of cash and cash equivalents, receivables, accounts payable and accrued liabilities approximates their fair value because of the short maturity of these instruments. Based on the interest rates currently available and their underlying risk, the carrying value of the franchise notes receivable approximates their fair value. These fair values are reflected net of reserves, which are recognized according to Company policy. The Company determined the estimated fair values of its debt by using currently available market information and estimates and assumptions where appropriate. Accordingly, as considerable judgment is required to determine these estimates, changes in the assumptions or methodologies may have an effect on
97
NOTE 14. FINANCIAL INSTRUMENTS (Continued)
these estimates. The actual and estimated fair values of the Company's financial instruments are as follows at December 31:
| |
2010 | 2009 | |||||||||||
|---|---|---|---|---|---|---|---|---|---|---|---|---|---|
| |
Carrying Amount |
Fair Value |
Carrying Amount |
Fair Value |
|||||||||
| |
(in thousands) |
||||||||||||
Cash and cash equivalents |
$ | 150,641 | $ | 150,641 | $ | 75,089 | $ | 75,089 | |||||
Receivables |
104,633 | 104,633 | 94,355 | 94,355 | |||||||||
Franchise notes receivable |
4,496 | 4,496 | 3,364 | 3,364 | |||||||||
Accounts payable |
98,295 | 98,295 | 95,904 | 95,904 | |||||||||
Long term debt |
1,058,499 | 1,007,070 | 1,059,809 | 977,718 | |||||||||
NOTE 15. LONG-TERM LEASE OBLIGATIONS
The Company enters into operating leases covering its retail store locations. The Company is the primary lessor of the majority of all leased retail store locations and sublets the locations to individual franchisees. The leases generally provide for an initial term of between five and ten years, and may include renewal options for varying terms thereafter. The leases require minimum monthly rental payments and a pro rata share of landlord allocated common operating expenses. Most retail leases also require additional rentals based on a percentage of sales in excess of specified levels ("Percent rent"). According to the individual lease specifications, real estate taxes, insurance and other related costs may be included in the rental payment or charged in addition to rent. Other lease expenses relate to and include distribution facilities, transportation equipment, data processing equipment and automobiles.
As the Company is the primary lessee for the majority of the franchise store locations, it is ultimately liable for the lease payments to the landlord. The Company makes the payments to the landlord directly, and then bills the franchisee for reimbursement of this cost. If a franchisee defaults on its sub-lease and its sub-lease is terminated, the Company has in the past converted, and expects in the future to, convert any such franchise store into a corporate store and fulfill the remaining lease obligation.
The composition of the Company's rental expense for all periods presented included the following components:
| |
December 31, | |||||||||
|---|---|---|---|---|---|---|---|---|---|---|
| |
2010
|
2009
|
2008
|
|||||||
| |
(in thousands) |
|||||||||
Retail stores: |
||||||||||
Rent on long-term operating leases, net of sublease income |
$ | 114,861 | $ | 110,365 | $ | 109,199 | ||||
Landlord related taxes |
15,929 | 16,498 | 15,987 | |||||||
Common operating expenses |
30,402 | 29,398 | 31,435 | |||||||
Percent rent |
17,903 | 15,899 | 14,159 | |||||||
|
179,095 | 172,160 | 170,780 | |||||||
Truck fleet |
4,491 | 4,740 | 4,363 | |||||||
Other |
11,557 | 11,189 | 11,331 | |||||||
|
$ | 195,143 | $ | 188,089 | $ | 186,474 | ||||
98
NOTE 15. LONG-TERM LEASE OBLIGATIONS (Continued)
Minimum future obligations for non-cancelable operating leases with initial or remaining terms of at least one year in effect at December 31, 2010 are as follows:
| |
Company Retail Stores |
Franchise Retail Stores |
Other
|
Sublease Income |
Total
|
|||||||||||
|---|---|---|---|---|---|---|---|---|---|---|---|---|---|---|---|---|
| |
(in thousands) |
|||||||||||||||
2011 |
$ | 106,103 | $ | 23,095 | $ | 4,812 | $ | (23,095 | ) | $ | 110,915 | |||||
2012 |
83,492 | 17,310 | 3,758 | $ | (17,310 | ) | 87,250 | |||||||||
2013 |
63,591 | 11,491 | 2,928 | $ | (11,491 | ) | 66,519 | |||||||||
2014 |
49,411 | 6,806 | 2,192 | $ | (6,806 | ) | 51,603 | |||||||||
2015 |
35,677 | 3,454 | 1,237 | $ | (3,454 | ) | 36,914 | |||||||||
Thereafter |
76,383 | 4,708 | 1,245 | $ | (4,708 | ) | 77,628 | |||||||||
|
$ | 414,657 | $ | 66,864 | $ | 16,172 | $ | (66,864 | ) | $ | 430,829 | |||||
NOTE 16. COMMITMENTS AND CONTINGENCIES
Litigation
The Company is engaged in various legal actions, claims and proceedings arising in the normal course of business, including claims related to breach of contracts, products liabilities, intellectual property matters and employment-related matters resulting from the Company's business activities. As with most actions such as these, an estimation of any possible and/or ultimate liability cannot always be determined. The Company continues to assess the requirement to account for additional contingencies in accordance with the standard on contingencies. If the Company is required to make a payment in connection with an adverse outcome in these matters, it could have a material impact on its financial condition and operating results.
As a manufacturer and retailer of nutritional supplements and other consumer products that are ingested by consumers or applied to their bodies, the Company has been and is currently subjected to various product liability claims. Although the effects of these claims to date have not been material to the Company, it is possible that current and future product liability claims could have a material adverse impact on its business or financial condition. The Company currently maintains product liability insurance with a deductible/retention of $3.0 million per claim with an aggregate cap on retained loss of $10.0 million. The Company typically seeks and has obtained contractual indemnification from most parties that supply raw materials for its products or that manufacture or market products it sells. The Company also typically seeks to be added, and has been added, as an additional insured under most of such parties' insurance policies. The Company is also entitled to indemnification by Numico for certain losses arising from claims related to products containing ephedra or Kava Kava sold prior to December 5, 2003. However, any such indemnification or insurance is limited by its terms and any such indemnification, as a practical matter, is limited to the creditworthiness of the indemnifying party and its insurer, and the absence of significant defenses by the insurers. The Company may incur material products liability claims, which could increase its costs and adversely affect its reputation, revenues and operating income.
Hydroxycut Claims. On May 1, 2009, the FDA issued a warning on several Hydroxycut-branded products manufactured by Iovate Health Sciences U.S.A., Inc. ("Iovate"). The FDA warning was based on 23 reports of liver injuries from consumers who claimed to have used the products between 2002 and 2009. As a result, Iovate voluntarily recalled 14 Hydroxycut-branded products.
99
NOTE 16. COMMITMENTS AND CONTINGENCIES (Continued)
Following the recall, GNC was named, among other defendants, in approximately 60 lawsuits (note that prior to May 1, 2009, GNC was a co-defendant in one Hydroxycut case, Ciavarra (see "Ciavarra Claim" entry below)) related to Hydroxycut-branded products in 13 states. Iovate previously accepted GNC's tender request for defense and indemnification under its purchasing agreement with GNC and, as such, Iovate has accepted GNC's request for defense and indemnification in the Hydroxycut matters. GNC's ability to obtain full recovery in respect of any claims against GNC in connection with products manufactured by Iovate under the indemnity is dependent on Iovate's insurance coverage, the creditworthiness of its insurer, and the absence of significant defenses by such insurer. To the extent GNC is not fully compensated by Iovate's insurer, it can seek recovery directly from Iovate. GNC's ability to fully recover such amounts may be limited by the creditworthiness of Iovate.
As of December 31, 2010, there were 50 pending lawsuits related to Hydroxycut in which GNC had been named: 44 individual, largely personal injury claims and six putative class action cases, generally inclusive of claims of consumer fraud, misrepresentation, strict liability and breach of warranty. Any liabilities that may arise from these matters are not probable or reasonably estimable at this time.
By court order dated October 6, 2009, the United States Judicial Panel on Multidistrict Litigation consolidated pretrial proceedings of many of the pending actions in the Southern District of California (In re: Hydroxycut Marketing and Sales Practices Litigation, MDL No. 2087).
Ciavarra Claim. Prior to the Hydroxycut recall, Ryan Ciavarra filed a personal injury lawsuit against, among others, General Nutrition Corporation, in the District Court of Harris County, Texas on November 19, 2008. Plaintiff alleges that his use and consumption of the diet product Hydroxycut caused severe liver damage, jaundice and elevated liver enzymes. Plaintiff asserts claims for strict liability, negligence and breach of warranty and seeks unspecified monetary damages. On December 20, 2010, the court entered an order that all of the plaintiff's claims against General Nutrition Corporation be dismissed without prejudice. Any liabilities that may arise from this matter are not probable or reasonably estimable at this time.
Pro-Hormone/Androstenedione Cases. The Company is currently defending six lawsuits (the "Andro Actions") relating to the sale by GNC of certain nutritional products alleged to contain the ingredients commonly known as Androstenedione, Androstenediol, Norandrostenedione, and Norandrostenediol (collectively, "Andro Products"). In each of the Andro Actions, plaintiffs sought, or are seeking, to certify a class and obtain damages on behalf of the class representatives and all those similarly-situated who purchased from the Company certain nutritional supplements alleged to contain one or more Andro Products. As any liabilities that may arise from these cases are not probable or reasonably estimable at this time, no liability has been accrued in the accompanying financial statements.
Romero Claim. On April 27, 2009, plaintiff J.C. Romero, a professional baseball player, filed a complaint against, among others, GNC, in Superior Court of New Jersey (Law Division/ Camden County). Plaintiff alleges that he purchased from a GNC store and consumed 6-OXO Extreme, which is manufactured by a third party, and in August 2008, was alleged to have tested positive for a banned substance. Plaintiff served a 50 game suspension imposed by Major League Baseball. The seven count complaint asserts, among other things, claims for negligence, strict liability, misrepresentation, breach implied warranty and violations of the New Jersey Consumer Fraud Act, and seeks unspecified monetary damages. GNC tendered the claim to the insurance company of the franchisee whose GNC store sold and allegedly misrepresented the product. On or about
100
NOTE 16. COMMITMENTS AND CONTINGENCIES (Continued)
October 9, 2009, GNC answered plaintiff's first amended complaint and cross-claimed against co-defendants Proviant Technologies and Ergopharm. Discovery in this case is ongoing and the Company is vigorously defending the matter. As any liabilities that may arise from this case are not probable or reasonably estimable at this time, no liability has been accrued in the accompanying financial statements.
California Wage and Break Claim. On November 4, 2008, 98 plaintiffs filed individual claims against the Company in the Superior Court of the State of California for the County of Orange, which was removed to the U.S. District Court, Central District of California on February 17, 2009. Each of the plaintiffs had previously been a member of a purported class in a lawsuit filed against the Company in 2007 and resolved in September 2009. The plaintiffs allege that they were not provided all of the rest and meal periods to which they were entitled under California law, and further allege that the Company failed to pay them split shift and overtime compensation to which they were entitled under California law. Discovery in this case is ongoing and the Company is vigorously defending these matters. The court has developed a mediation procedure for handling the pending claims and has ordered the parties to mediate with small groups of plaintiffs and stayed the case as to the plaintiffs not participating in the mediations. The first of the mediation sessions occurred February 10, 2010 and March 4, 2010 and did not result in any settlements. Any liabilities that may arise from these matters are not probable or reasonably estimable at this time.
FLSA Matters. On June 29, 2010, Dominic Vargas and Anne Hickok, on behalf of themselves and all others similarly situated sued General Nutrition Corporation and GNC (U.S. District Court, Western District of Pennsylvania, Case No. 2:05-mc-02025). The two-count complaint alleges, generally, that plaintiffs were required to perform work on an uncompensated basis and that GNC failed to pay overtime for such work. The second count of the complaint alleges the Company retaliated against plaintiffs when they complained about the overtime policy. The Company filed a motion to dismiss count II of the Complaint and on January 6, 2011 the court granted the motion.
On July 16, 2010, a second, similar wage and hour complaint was filed by Jennifer Mell and Jose Munoz, on behalf of themselves and all others similarly situated against GNC Corporation (U.S. District Court, Western District of Pennsylvania, Case No. 10CV945). The complaint alleges that plaintiffs' job duties were non-exempt in nature and that they were misclassified as exempt employees. The Company filed a motion to dismiss which was granted on November 9, 2010. Plaintiffs filed an appeal on December 9, 2010.
Commitments
The Company maintains certain purchase commitments with various vendors to ensure its operational needs are fulfilled of approximately $19.8 million. As of December 31, 2010, the future purchase commitments consisted of $10.6 million of advertising commitments and $9.2 million under a management services agreement with Parent. Other commitments related to the Company's business operations cover varying periods of time and are not significant. All of these commitments are expected to be fulfilled with no adverse consequences to the Company's operations of financial condition.
Environmental Compliance
In March 2008, DHEC requested that the Company investigate contamination associated with historical activities at our South Carolina facility. These investigations have identified chlorinated solvent impacts in soils and groundwater that extend offsite from our facility. The Company is awaiting DHEC approval of the scope of additional investigations in order to understand the extent
101
NOTE 16. COMMITMENTS AND CONTINGENCIES (Continued)
of these impacts and develop appropriate remedial measures for DHEC approval. At this state of the investigation, however, it is not possible to estimate the timing and extent of any remedial action that may be required, the ultimate cost of remediation, or the amount of the Company's potential liability.
In addition to the foregoing, the Company is subject to numerous federal, state, local, and foreign environmental and health and safety laws and regulations governing its operations, including the handling, transportation, and disposal of the Company's non-hazardous and hazardous substances and wastes, as well as emissions and discharges from its operations into the environment, including discharges to air, surface water, and groundwater. Failure to comply with such laws and regulations could result in costs for remedial actions, penalties, or the imposition of other liabilities. New laws, changes in existing laws or the interpretation thereof, or the development of new facts or changes in their processes could also cause the Company to incur additional capital and operation expenditures to maintain compliance with environmental laws and regulations and environmental permits. The Company also is subject to laws and regulations that impose liability and cleanup responsibility for releases of hazardous substances into the environment without regard to fault or knowledge about the condition or action causing the liability. Under certain of these laws and regulations, such liabilities can be imposed for cleanup of previously owned or operated properties, or for properties to which substances or wastes that were sent in connection with current or former operations at its facilities. The presence of contamination from such substances or wastes could also adversely affect the Company's ability to sell or lease its properties, or to use them as collateral for financing. From time to time, the Company has incurred costs and obligations for correcting environmental and health and safety noncompliance matters and for remediation at or relating to certain of its properties or properties at which its waste has been disposed. The Company believes it has complied with, and is currently complying with, its environmental obligations pursuant to environmental and health and safety laws and regulations and that any liabilities for noncompliance will not have a material adverse effect on its business or financial performance. However, it is difficult to predict future liabilities and obligations, which could be material.
NOTE 17. STOCKHOLDER'S EQUITY
At December 31, 2010 and 2009, there were 100 shares of Common Stock, par value $.01 per share, outstanding. All of the Company's outstanding stock was owned by GNC Corporation at December 31, 2010.
102
NOTE 17. STOCKHOLDER'S EQUITY (Continued)
The accumulated balances of other comprehensive income and their related tax effects included as part of the consolidated financial statements are as follows:
| |
Before tax amount | Tax Benefit (Expense) | Net Other Comprehensive Income (Loss) |
||||||||||||||||
|---|---|---|---|---|---|---|---|---|---|---|---|---|---|---|---|---|---|---|---|
| |
Foreign currency translation |
Unrealized Gain/(Loss) on Derivatives |
Unrealized Gain/(Loss) on Derivatives |
Foreign currency translation |
Unrealized Gain/(Loss) on Derivatives |
Total
|
|||||||||||||
| |
($ in thousands) |
||||||||||||||||||
Balance at December 31, 2008 |
$ | (2,035 | ) | $ | (18,902 | ) | $ | 6,880 | $ | (2,035 | ) | $ | (12,022 | ) | $ | (14,057 | ) | ||
Foreign currency translation adjustment |
4,172 | — | — | 4,172 | — | 4,172 | |||||||||||||
Unrealized gain on derivatives designated as cash flow hedge, net of tax |
— | 4,223 | (1,537 | ) | — | 2,686 | 2,686 | ||||||||||||
Balance at December 31, 2009 |
2,137 | (14,679 | ) | 5,343 | 2,137 | (9,336 | ) | (7,199 | ) | ||||||||||
Foreign currency translation adjustment |
1,334 | — | — | 1,334 | — | 1,334 | |||||||||||||
Unrealized gain on derivatives designated as cash flow hedge, net of tax |
— | 7,210 | (2,625 | ) | — | 4,585 | 4,585 | ||||||||||||
Balance at December 31, 2010 |
$ | 3,471 | $ | (7,469 | ) | $ | 2,718 | $ | 3,471 | $ | (4,751 | ) | $ | (1,280 | ) | ||||
NOTE 18. STOCK-BASED COMPENSATION PLANS
Stock Options
The Company utilizes the Black Scholes model to calculate the fair value of options. The resulting compensation cost is recognized in the Company's financial statements over the option vesting period. At December 31, 2010, the net unrecognized compensation cost was $6.1 million and is expected to be recognized over a weighted average period of approximately 1.4 years.
In 2007, the board of directors of Parent (the "Parent Board") and Parent's stockholders approved and adopted the GNC Acquisition Holdings Inc. 2007 Stock Incentive Plan (the "2007 Stock Plan"). The purpose of the 2007 Stock Plan is to enable the Company to attract and retain highly qualified personnel who will contribute to the success of the Company. The 2007 Stock Plan provides for the granting of stock options, restricted stock and other stock based awards. The 2007 Stock Plan is available to certain eligible employees, directors, consultants or advisors as determined by the administering committee of the Parent Board. The total number of shares of Parent's Class A common stock reserved and available for the 2007 Stock Plan is 10.4 million shares. Stock options under the 2007 Stock Plan generally are granted with exercise prices at or above fair market value, typically vest over a four or five-year period and expire ten years from the date of grant. No stock appreciation rights, restricted stock, deferred stock or performance shares have been granted under the 2007 Stock Plan.
103
NOTE 18. STOCK-BASED COMPENSATION PLANS (Continued)
The following table outlines Parent's total stock options activity:
| |
Total Options
|
Weighted Average Exercise Price |
|||||
|---|---|---|---|---|---|---|---|
Outstanding at December 31, 2009 |
9,263,640 | $ | 7.27 | ||||
Granted |
680,000 | 12.58 | |||||
Exercised |
(13,876 | ) | 7.91 | ||||
Forfeited |
(518,325 | ) | 8.19 | ||||
Expired |
(67,251 | ) | 6.25 | ||||
Outstanding at December 31, 2010 |
9,344,188 | $ | 7.60 | ||||
Exercisable at December 31, 2010 |
5,031,731 | $ | 6.82 | ||||
Stock-based compensation expense for the years ended December 31, 2010, 2009 and 2008 was $3.2 million, $2.9 million, and $2.6 million, respectively.
As of December 31, 2010, the weighted average remaining contractual life of outstanding options was 6.6 years. At December 31, 2010, the weighted average remaining contractual life of exercisable options was 6.1 years. The weighted average fair value of options granted during 2010, 2009 and 2008 was $2.65, $3.19, and $1.17, respectively.
The Black Scholes model utilizes the following assumptions in determining a fair value: price of underlying stock, option exercise price, expected option term, risk-free interest rate, expected dividend yield, and expected stock price volatility over the option's expected term. As the Company has had minimal exercises of stock options through December 31, 2010, 2009 and 2008 option term has been estimated by considering both the vesting period, which is typically for the successor and predecessor plans, five and four years, respectively, and the contractual term of ten and seven years, respectively. As the Company's underlying stock is not publicly traded on an open market, the Company utilized its current peer group average to estimate the expected volatility. The assumptions used in the Company's Black Scholes valuation related to stock option grants made during the years ended December 31, 2010, 2009 and 2008 were as follows:
| |
2010
|
2009
|
2008
|
|||
|---|---|---|---|---|---|---|
Dividend yield |
0.00% | 0.00% | 0.00% | |||
Expected option life |
7.5 years | 7.5 years | 7.5 years | |||
Volatility factor percentage of market price |
31.5% - 33.00% | 34.20% - 44.60% | 26.00% - 28.40% | |||
Discount rate |
2.49% - 3.28% | 0.43% - 3.28% | 3.08% - 3.64% |
As the Black-Scholes option valuation model utilizes certain estimates and assumptions, the existing models do not necessarily represent the definitive fair value of options for future periods. Assumptions used in the Black-Scholes option valuation model include the fair value of the stock, as the stock is not publicly traded, and volatility. The fair value of the stock is estimated based upon the net enterprise value of the Company, discounted to reflect the lack of liquidity and control associated with the stock. Volatility is estimated based upon the volatility in a sample peer group of companies. The average estimated fair value of Holdings Class A common stock for the years ended December 31, 2010, 2009 and 2008 were $9.89, $5.95, and $5.17 per share, respectively.
104
NOTE 19. SEGMENTS
The Company has three reportable segments, each of which represents an identifiable component of the Company for which separate financial information is available. This information is utilized by management to assess performance and allocate assets accordingly. The Company's management evaluates segment operating results based on several indicators. The primary key performance indicators are sales and operating income or loss for each segment. Operating income or loss, as evaluated by management, excludes certain items that are managed at the consolidated level, such as distribution and warehousing, impairments and other corporate costs. The following table represents key financial information for each of the Company's reportable segments, identifiable by the distinct operations and management of each: Retail, Franchising, and Manufacturing/Wholesale. The Retail reportable segment includes the Company's corporate store operations in the United States, Canada and its GNC.com business. The Franchise reportable segment represents the Company's franchise operations, both domestically and internationally. The Manufacturing/Wholesale reportable segment represents the Company's manufacturing operations in South Carolina and the Wholesale sales business. This segment supplies the Retail and Franchise segments, along with various third parties, with finished products for sale. The Warehousing and Distribution and Corporate costs represent the Company's administrative expenses. The accounting policies of the segments are the same as those described in the "Basis of Presentation and Summary of Significant Accounting Policies".
The following table represents key financial information of the Company's segments:
| |
December 31, | |||||||||||
|---|---|---|---|---|---|---|---|---|---|---|---|---|
| |
2010
|
2009
|
2008
|
|||||||||
| |
(in thousands) |
|||||||||||
Revenue: |
||||||||||||
Retail |
$ | 1,344,358 | $ | 1,256,314 | $ | 1,219,305 | ||||||
Franchise |
293,777 | 264,168 | 258,020 | |||||||||
Manufacturing/Wholesale: |
||||||||||||
Intersegment(1) |
209,465 | 201,306 | 180,070 | |||||||||
Third Party |
184,261 | 186,525 | 179,404 | |||||||||
Sub total Manufacturing/Wholesale |
393,726 | 387,831 | 359,474 | |||||||||
Sub total segment revenues |
2,031,861 | 1,908,313 | 1,836,799 | |||||||||
Intersegment elimination(1) |
(209,465 | ) | (201,306 | ) | (180,070 | ) | ||||||
Total revenue |
$ | 1,822,396 | $ | 1,707,007 | $ | 1,656,729 | ||||||
- (1)
- Intersegment revenues are eliminated from consolidated revenue.
105
NOTE 19. SEGMENTS (Continued)
Operating income: |
|||||||||||||
Retail |
$ | 181,873 | $ | 153,142 | $ | 140,916 | |||||||
Franchise |
95,318 | 80,800 | 80,816 | ||||||||||
Manufacturing/Wholesale |
69,421 | 73,450 | 67,378 | ||||||||||
Unallocated corporate and other costs: |
|||||||||||||
Warehousing and distribution costs |
(54,983 | ) | (53,557 | ) | (54,266 | ) | |||||||
Corporate costs |
(77,044 | ) | (72,644 | ) | (65,063 | ) | |||||||
Sub total unallocated corporate and other costs |
(132,027 | ) | (126,201 | ) | (119,329 | ) | |||||||
Total operating income |
214,585 | 181,191 | 169,781 | ||||||||||
Interest expense, net |
65,529 | 69,953 | 83,000 | ||||||||||
Income before income taxes |
149,056 | 111,238 | 86,781 | ||||||||||
Income tax expense |
50,883 | 41,619 | 32,001 | ||||||||||
Net income |
$ | 98,173 | $ | 69,619 | $ | 54,780 | |||||||
106
NOTE 19. SEGMENTS (Continued)
| |
December 31, | |||||||||||
|---|---|---|---|---|---|---|---|---|---|---|---|---|
| |
2010
|
2009
|
2008
|
|||||||||
| |
(in thousands) |
|||||||||||
Depreciation and amortization: |
||||||||||||
Retail |
$ | 26,241 | $ | 24,164 | $ | 21,449 | ||||||
Franchise |
3,044 | 4,081 | 5,001 | |||||||||
Manufacturing / Wholesale |
11,407 | 10,926 | 9,783 | |||||||||
Corporate / Other |
6,301 | 7,494 | 6,220 | |||||||||
Total depreciation and amortization |
$ | 46,993 | $ | 46,665 | $ | 42,453 | ||||||
Capital expenditures: |
||||||||||||
Retail |
$ | 23,263 | $ | 20,640 | $ | 33,074 | ||||||
Franchise |
50 | 2 | 7 | |||||||||
Manufacturing / Wholesale |
4,318 | 4,527 | 11,108 | |||||||||
Corporate / Other |
4,891 | 3,513 | 4,477 | |||||||||
Total capital expenditures |
$ | 32,522 | $ | 28,682 | $ | 48,666 | ||||||
Total assets |
||||||||||||
Retail |
$ | 1,272,541 | $ | 1,259,024 | $ | 1,263,229 | ||||||
Franchise |
477,643 | 470,277 | 471,247 | |||||||||
Manufacturing / Wholesale |
410,832 | 416,523 | 436,018 | |||||||||
Corporate / Other |
221,459 | 157,778 | 121,514 | |||||||||
Total assets |
$ | 2,382,475 | $ | 2,303,602 | $ | 2,292,008 | ||||||
Geographic areas |
||||||||||||
Total revenues: |
||||||||||||
United States |
$ | 1,727,717 | $ | 1,618,452 | $ | 1,567,641 | ||||||
Foreign |
94,679 | 88,555 | 89,088 | |||||||||
Total revenues |
$ | 1,822,396 | $ | 1,707,007 | $ | 1,656,729 | ||||||
Long-lived assets: |
||||||||||||
United States |
$ | 188,988 | $ | 193,762 | $ | 201,787 | ||||||
Foreign |
10,207 | 10,151 | 6,885 | |||||||||
Total long-lived assets |
$ | 199,195 | $ | 203,913 | $ | 208,672 | ||||||
107
NOTE 19. SEGMENTS (Continued)
The following table represents sales by general product category. The category "Other" includes other wellness products sales from the Company's point of sales system and certain required accounting adjustments of $6.5 million, $5.7 million, and $4.7 million for the years ended December 31, 2010, 2009 and 2008, respectively.
| |
December 31, | ||||||||||
|---|---|---|---|---|---|---|---|---|---|---|---|
| |
2010
|
2009
|
2008
|
||||||||
| |
(in thousands) |
||||||||||
U.S Retail Product Categories: |
|||||||||||
VMHS |
$ | 496,093 | $ | 496,427 | $ | 465,245 | |||||
Sports Nutrition Products |
531,269 | 443,408 | 410,133 | ||||||||
Diet and Weight Management Products |
122,259 | 128,039 | 148,158 | ||||||||
Other Wellness Products |
100,058 | 99,886 | 106,681 | ||||||||
Total U.S. Retail revenues |
1,249,679 | 1,167,759 | 1,130,217 | ||||||||
Canada retail revenues(1) |
94,679 | 88,555 | 89,088 | ||||||||
Total Retail Revenue |
$ | 1,344,358 | $ | 1,256,314 | $ | 1,219,305 | |||||
- (1)
- Canada sales are presented in total not by category as product sales for Canada are managed in local currency.
The data above represents the majority of the revenue reported for the domestic portion of the Company's retail segment. In addition to these sales, additional revenue and revenue adjustments are recorded to ensure conformity with U.S. GAAP. This includes wholesale revenue (to the Company's military commissary locations), deferral of the Company's Gold Card revenue to match the twelve month discount period of the card, and a reserve for customer returns. These items are recurring in nature, and the Company expects to record similar adjustments in the future.
In addition to the Retail product categories discussed above, Franchise revenues are primarily generated from (1) product sales to franchisees, (2) royalties from franchise retail sales and (3) franchise fees, and Manufacturing/Wholesale sales are generated from sales of manufactured products to third parties, primarily in the VMHS product category.
NOTE 20. FRANCHISE REVENUE
The Company's Franchise segment generates revenues through product sales to franchisees, royalties, franchise fees and interest income on the financing of the franchise locations. The Company enters into franchise agreements with initial terms of ten years. The Company charges franchisees three types of flat franchise fees associated with stores: initial, transfer and renewal. The initial franchise fee is payable prior to the franchise store opening as consideration for the initial franchise rights and services performed by the Company. Transfer fees are paid as consideration for the same rights and services as the initial fee and occur when a former franchisee transfers ownership of the franchise location to a new franchisee. This is typically a reduced fee compared to the initial franchise fee. The renewal franchise fee is charged to existing franchisees upon renewal of the franchise contract. This fee is similar to, but typically less than, the initial fee.
Once the franchise store is opened, transferred or renewed, the Company has no further obligations under these fees to the franchisee. Therefore, all initial, transfer and renewal franchise fee revenue is recognized in the period in which a franchise store is opened, transferred or date the
108
NOTE 20. FRANCHISE REVENUE (Continued)
contract period is renewed. The Company recognized initial franchise fees of $2.8 million, $2.4 million, and $3.3 million for the years ended December 31, 2010, 2009 and 2008, respectively.
The following is a summary of the Company's franchise revenue by type:
| |
Years Ended | |||||||||
|---|---|---|---|---|---|---|---|---|---|---|
| |
December 31, 2010 |
December 31, 2009 |
December 31, 2008 |
|||||||
| |
(in thousands) |
|||||||||
Product sales |
$ | 242,160 | $ | 217,920 | $ | 209,662 | ||||
Royalties |
38,722 | 35,561 | 35,147 | |||||||
Franchise fees |
5,646 | 4,570 | 5,676 | |||||||
Other |
7,249 | 6,117 | 7,535 | |||||||
Total franchise revenue |
$ | 293,777 | $ | 264,168 | $ | 258,020 | ||||
NOTE 21. SUPPLEMENTAL CASH FLOW INFORMATION
The Company remitted cash payments for federal and state income taxes of $50.8 million, $16.0 million, and $18.1 million for the years ended December 31, 2010, 2009 and 2008, respectively.
The Company remitted cash payments for interest expense related to outstanding debt of $61.9 million, $66.7 million, and $80.1 million for the years ended December 31, 2010, 2009 and 2008 respectively.
NOTE 22. RETIREMENT PLANS
The Company sponsors a 401(k) defined contribution savings plan covering substantially all employees. Full time employees who have completed 30 days of service and part time employees who have completed 1,000 hours of service are eligible to participate in the plan. The plan provides for employee contributions of 1% to 80% of individual compensation into deferred savings, subject to IRS limitations. The plan provides for Company contributions upon the employee meeting the eligibility requirements. The Company match consists of both a fixed and a discretionary match which is based on a specified financial target for all participants in the plan. The fixed match is 50% on the first 3% of the salary that an employee defers and the discretionary match could be up to an additional 100% match on the 3% deferral. A discretionary match can be approved at any time by the Company.
An employee becomes vested in the Company match portion as follows:
Years of Service
|
Percent Vested |
|||
|---|---|---|---|---|
0-1 |
0 | % | ||
1-2 |
33 | % | ||
2-3 |
66 | % | ||
3+ |
100 | % | ||
The Company made cash contributions of $1.3 million, $1.2 million, and $1.2 million for the years ended December 31, 2010, 2009 and 2008, respectively. In addition, the Company made a discretionary match for the 2008 plan year of $0.6 million in March 2009, for the 2009 plan year of
109
NOTE 22. RETIREMENT PLANS (Continued)
$0.6 million in February 2010, and for the 2010 plan year will make a cash payment of $0.9 million in March 2011.
The Company has a Non-qualified Executive Retirement Arrangement Plan that covers key employees. Under the provisions of this plan, certain eligible key employees are granted cash compensation, which in the aggregate was not significant for any year presented.
The Company has a Non-qualified Deferred Compensation Plan that provides benefits payable to certain qualified key employees upon their retirement or their designated beneficiaries upon death. This plan allows participants the opportunity to defer pretax amounts ranging from 2% to 100% of their base compensation plus bonuses. The plan is funded entirely by elective contributions made by the participants. The Company has elected to finance any potential plan benefit obligations using corporate owned life insurance policies. All assets relating to the non-qualified deferred compensation plan are held in a rabbi trust.
NOTE 23. FAIR VALUE MEASUREMENTS
As described in Note 2, "Basis of Presentation and Summary of Significant Accounting Policies", the Company adopted the provisions of the new standard on fair value measurements and disclosures as of January 1, 2008. This standard defines fair value, establishes a consistent framework for measuring fair value, and expands disclosures for each major asset and liability category measured at fair value on either a recurring or nonrecurring basis. The standard clarifies that fair value is an exit price, representing the amount that would be received to sell an asset or paid to transfer a liability in an orderly transaction between market participants. As such, fair value is a market-based measurement that should be determined based on assumptions that market participants would use in pricing an asset or liability. As a basis for considering such assumptions, the standard establishes a three-tier fair value hierarchy which prioritizes the inputs used in measuring fair value as follows:
| Level 1 | — | observable inputs such as quoted prices in active markets for identical assets and liabilities; | |||
Level 2 |
— |
observable inputs such as quoted prices for similar assets or liabilities in active markets, quoted prices for identical or similar assets or liabilities in markets that are not active, other inputs that are observable, or can be corroborated by observable market data; and |
|||
Level 3 |
— |
unobservable inputs for which there are little or no market data, which require the reporting entity to develop its own assumptions. |
The following table presents the Company's financial assets and liabilities that were accounted for at fair value on a recurring basis as of December 31, 2010 by level within the fair value hierarchy:
| |
Fair Value Measurements Using | |||||||||
|---|---|---|---|---|---|---|---|---|---|---|
| |
Level 1
|
Level 2
|
Level 3
|
|||||||
| |
(in thousands) |
|||||||||
Other current liabilities |
$ | — | $ | 4,395 | $ | — | ||||
Other long-term liabilities |
$ | 3,034 | $ | 3,074 | $ | — | ||||
110
NOTE 23. FAIR VALUE MEASUREMENTS (Continued)