Attached files
Table of Contents
UNITED STATES
SECURITIES AND EXCHANGE COMMISSION
Washington, D.C. 20549
FORM 10-K
(Mark One)
| x | ANNUAL REPORT PURSUANT TO SECTION 13 OR 15(d) OF THE SECURITIES EXCHANGE ACT OF 1934 |
For the fiscal year ended December 31, 2010
Or
| ¨ | TRANSITION REPORT PURSUANT TO SECTION 13 OR 15(d) OF THE SECURITIES EXCHANGE ACT OF 1934 |
Commission file number: 000-51349
Advanced Analogic Technologies Incorporated
(Exact Name of Registrant As Specified in Its Charter)
| Delaware | 77-0462930 | |
| (State or other jurisdiction of incorporation or organization) |
(I.R.S. Employer Identification Number) |
3230 Scott Boulevard, Santa Clara, CA 95054 (408) 737-4600
(Address of Principal Executive Offices, Including Zip Code and Telephone Number)
Securities registered pursuant to Section 12(b) of the Act:
Common Stock, $0.001 Par Value
Securities registered pursuant to Section 12(g) of the Act: NONE
Indicate by check mark if the registrant is a well-known seasoned issuer, as defined in Rule 405 of the Securities Act. Yes ¨ No x
Indicate by check mark if the registrant is not required to file reports pursuant to Section 13 or Section 15(d) of the Act. Yes ¨ No x
Indicate by check mark whether the registrant (1) has filed all reports required to be filed by Section 13 or 15(d) of the Securities Exchange Act of 1934 during the preceding 12 months (or for such shorter period that the registrant was required to file such reports), and (2) has been subject to such filing requirements for the past 90 days. Yes x No ¨
Indicate by check mark whether the registrant has submitted electronically and posted on its corporate Web site, if any, every Interactive Data File required to be submitted and posted pursuant to Rule 405 of Regulation S-T (§232.405 of this chapter) during the preceding 12 months (or for such shorter period that the registrant was required to submit and post such files). Yes ¨ No ¨
Indicate by check mark if disclosure of delinquent filers pursuant to Item 405 of Regulation S-K (§229.405 of this chapter) is not contained herein, and will not be contained, to the best of the registrant’s knowledge, in definitive proxy or information statements incorporated by reference in Part III of this Form 10-K or any amendment to this Form 10-K. ¨
Indicate by check mark whether the registrant is a large accelerated filer, an accelerated filer or a non-accelerated filer. See definition of “accelerated filer and large accelerated filer” in Rule 12b-2 of the Exchange Act (Check one):
| Large accelerated filer | ¨ | Accelerated filer | x | |||
| Non-accelerated filer | ¨ | Smaller reporting company | ¨ | |||
Indicate by check mark whether the registrant is a shell company (as defined in Rule 12b-2 of the Exchange Act.) Yes ¨ No x
The aggregate market value of the voting and non-voting common equity held by non-affiliates of the registrant as of the close of business on June 30, 2010 was approximately $107,000,000. There were 42,547,791 shares of the Registrant’s common stock outstanding as of February 22, 2011.
DOCUMENTS INCORPORATED BY REFERENCE
Part III incorporates by reference certain information from the Registrant’s definitive proxy statement (the “2011 Proxy Statement”) for the 2011 Annual Meeting of Stockholders to be filed on or before April 30, 2010.
Table of Contents
FORWARD-LOOKING STATEMENTS
This Annual Report on Form 10-K contains forward-looking statements. When used in this Form 10-K, the words “anticipate,” “objective,” “may,” “might,” “should,” “could,” “can,” “intend,” “expect,” “believe,” “estimate,” “predict,” “potential,” “plan,” “is designed to” or the negative of these and similar expressions identify forward-looking statements. Forward-looking statements include, but are not limited to, statements about:
| • | our expectations regarding our expenses, sales and operations; |
| • | our anticipated cash needs and our estimates regarding our capital requirements and our need for additional financing; |
| • | our ability to anticipate the future needs of our customers; |
| • | our plans for future products and enhancements of existing products; |
| • | our growth strategy elements; |
| • | our increased headcount as we expand our operations; |
| • | our intellectual property; |
| • | our anticipated trends and challenges in the markets in which we operate; and |
| • | our ability to attract customers. |
These statements reflect our current views with respect to future events and are based on assumptions and subject to risk and uncertainties. Given these uncertainties, you should not place undue reliance on these forward-looking statements. While we believe our plans, intentions and expectations reflected in those forward-looking statements are reasonable, we cannot assure you that these plans, intentions or expectations will be achieved. Our actual results, performance or achievements could differ materially from those contemplated, expressed or implied by the forward-looking statements contained in this Annual Report on Form 10-K, including those under the heading “Risk Factors.”
All forward-looking statements attributable to us or persons acting on our behalf are expressly qualified in their entirety by the cautionary statements set forth in this Annual Report on Form 10-K. Other than as required by applicable laws, we are under no obligation to update any forward-looking statement, whether as result of new information, future events or otherwise.
This Annual Report on Form 10-K also contains statistical data that we obtained from industry publications and reports generated by Gartner, Inc. These industry publications and reports generally indicate that the information contained therein was obtained from sources believed to be reliable, but do not guarantee the accuracy and completeness of such information. Although we believe that the publications and reports are reliable, we have not independently verified the data.
2
Table of Contents
ADVANCED ANALOGIC TECHNOLOGIES INCORPORATED
| Page | ||||||
| PART I | ||||||
| Item 1. | 4 | |||||
| Item 1A. | 10 | |||||
| Item 1B. | 22 | |||||
| Item 2. | 22 | |||||
| Item 3. | 22 | |||||
| Item 4. | 23 | |||||
| PART II | ||||||
| Item 5. | 24 | |||||
| Item 6. | 26 | |||||
| Item 7. | Management’s Discussion and Analysis of Financial Condition and Results of Operations |
27 | ||||
| Item 7A. | 39 | |||||
| Item 8. | 41 | |||||
| Item 9. | Changes in and Disagreements with Accountants on Accounting and Financial Disclosure |
75 | ||||
| Item 9A. | 75 | |||||
| Item 9B. | 76 | |||||
| PART III | ||||||
| Item 10. | 78 | |||||
| Item 11. | 78 | |||||
| Item 12. | Security Ownership of Certain Beneficial Owners and Management and Related Stockholder Matters |
78 | ||||
| Item 13. | Certain Relationships and Related Transactions, and Director Independence |
78 | ||||
| Item 14. | 78 | |||||
| PART IV | ||||||
| Item 15. | 79 | |||||
| 82 | ||||||
3
Table of Contents
| ITEM 1. | BUSINESS |
Overview
We develop advanced semiconductor system solutions that play a key role in the continuing evolution of feature-rich, energy efficient electronic devices. We focus on addressing the application-specific power management needs of consumer, communications and computing electronic devices, such as wireless handsets, notebook and tablet computers, smartphones, camera phones, digital cameras, personal media players, Bluetooth headphones and accessories, digital TVs, set top boxes and displays.
We focus our design and marketing efforts on application-specific power management needs in rapidly-evolving devices. Through our “Total Power Management” approach, we offer a broad range of products that support multiple applications, features, and services across a diverse set of electronic devices. We target our design efforts on proprietary products which offer characteristics that differentiate them from those offered by our competitors and which we believe are likely to generate high-volume demand from multiple customers. We also selectively license our devices, process, package, and application-related technologies.
Our growth strategy involves three elements, to maintain revenues in our existing markets and applications such as LED lighting in handheld devices, to penetrate new applications in existing markets such as battery charging in cell phones, and to selectively enter totally new markets such as high definition televisions.
Headquartered in Silicon Valley, we have development centers in Santa Clara, Shanghai, Hong Kong, Taiwan, and have Asia-based operations and logistics. We were incorporated in California in August 1997 and reincorporated in Delaware in April 2005. Our principal executive offices are located at 3230 Scott Boulevard, Santa Clara, California 95054, and our telephone number is (408) 737-4600. Our web site address is www.analogictech.com. Unless the context requires otherwise, references in this Form 10-K to “AnalogicTech,” “AATI,” “we,” “us” and “our” refer to Advanced Analogic Technologies Incorporated and its wholly-owned subsidiaries on a consolidated basis. AnalogicTech and the AnalogicTech logo are trademarks of Advanced Analogic Technologies Incorporated. This annual report on Form 10-K also includes other trademarks of Advanced Analogic Technologies Incorporated and trademarks of other persons.
Our annual reports on Form 10-K, quarterly reports on Form 10-Q, current reports on Form 8-K, amendments to those reports and other SEC filings are available free of charge through our website as soon as reasonably practicable after such reports are electronically filed with, or furnished to, the SEC.
Industry Background
Consumer Electronic Devices
The market for consumer electronic devices, such as wireless handsets, notebook and tablet computers, smartphones and mobile internet devices, digital cameras and personal media players, is large and growing rapidly as functionality increases and prices decrease. As an example, wireless handsets, can incorporate multiple applications such as digital cameras and movie capability, digital audio and video, polyphonic ring tones, text messaging, internet access, electronic gaming, global positioning and decorative lighting, are among the most widely adopted electronic devices today.
New services for mobile consumer electronic devices, such as digital music downloads, video downloads, video messaging, video streaming, mobile TV and web-based gaming, are helping drive consumer demand for these devices worldwide. These new services are becoming more robust, affordable and accessible on wireless handsets, smartphones and other devices with connectivity to high-bandwidth, third- and fourth-generation wireless networks supporting high-speed packet formats HSDPA and HSUPA, LTE, broadband formats such as
4
Table of Contents
WiMax and digital video broadcast services such as DMB. Certain applications and features that facilitate use of these services, such as high-quality color displays and high-capacity memory for photos, music, video including TV content, games and other content, have already become broadly accepted and, we believe, expected by many consumers. In response to these market dynamics, manufacturers of mobile consumer electronic devices and service providers marketing these devices are incorporating an increasing number of applications, features and services.
As the number of applications, features and services available for consumer electronic devices increases, the number and variety of power loads, or individual subsystems requiring voltage regulation and power management, has also grown. All of these additional loads reduce battery life, the duration of which is an important element of consumer satisfaction, as they each draw power for operation. Additional power is consumed and battery operating time is reduced if components that supply and regulate power to all of these various power loads are inefficient. Therefore, high-performance power management semiconductors that extend battery operating time by improving power efficiency and/or improve system management functions have become key enablers of consumer electronic device functionality.
Power Management Semiconductors
Power management semiconductors deliver power and regulate voltage, controlling the flow of electrical energy among the various power loads and energy sources in a product or system. Power management semiconductors play a crucial role in system design because they are critical to battery life and impact the size, performance, and safety of a consumer electronic device. According to Gartner, Inc., revenue from power management integrated circuits (“ICs”) totaled $7.4 billion in 2009 and is expected to grow to $10.9 billion in 2014. Longer term, we believe that demand for power management and voltage regulation in consumer electronic devices will continue to grow. Power management semiconductors remain an indispensable element of electronic devices, driven by the need for longer battery life and greater energy efficiency.
Total Power Management Approach
Our “Total Power Management” strategy is intended to provide our customers with products for most or all of their power management requirements for each consumer electronic device on which we focus. We believe our broad range of power management application-specific standard products and components derived from our general purpose analog ICs offer a flexible solution to our customers’ power management requirements, saving space, reducing component count in the system and offering a single vendor solution for mobile consumer electronic devices. We believe that our PowerSOC solutions, currently being sampled or in development, integrate a wide variety of power management functions, offering improved efficiency, smaller size and real-time user control of their power consumption and power performance.
Our “Total Power Management” circuit portfolio supports functions including: voltage regulation and DC/DC conversion, over-voltage protected battery charging, fuel gauging, power saving SmartSwitch functions, interface and port protection, and display and lighting solutions including low-voltage and high-voltage LED backlighting, high-current LED camera flash, and active-matrix OLED displays. Recent efforts include circuitry for large screen LCD biasing including Vcom trimming and gamma correction. These functions may be offered as single function products, mixed in various combinations, or integrated monolithically into PowerSOCs using our proprietary ModularBCD process technology.
Technology
No single semiconductor fabrication process can support all complex system design needs. The result has been the creation of many different process technologies for designing and fabricating analog ICs.
5
Table of Contents
Unlike other semiconductor companies, AnalogicTech designers have three carefully crafted analog technologies which can be used:
| Analog CMOS | Cost effective high volume, low voltage applications | |
| ModularBCD™* | Highly integrated multi-voltage and/or high-voltage solutions | |
| TrenchDMOS* | High density, high-power discrete designs | |
| * | Proprietary AnalogicTech technologies |
Taking integration one step further, AnalogicTech develops area-efficient multi-chip packages to meet more complex power management needs in a smaller footprint.
This unique combination of technology provides higher efficiency, faster response time, lower power consumption, less resistance for lower heat generation and denser designs with tighter integration in space-saving packages.
AnalogicTech pioneered the concept of “Fabless without Foundries.” Instead of using standard fab process technologies, AnalogicTech has created its own optimized process technologies and installs them in older generation dynamic random-access memory, or DRAM, fabs, thus turning these fabrication plants into highly effective manufacturing partners.
Products
AnalogicTech offers a broad range of analog and mixed-signal circuits that play a critical role in system design. Whether stand alone discrete or fully integrated PMU/PMIC system solutions, our solution expertise includes:
| Display and Lighting | Power Half Bridges | |
| Battery Chargers | Integrated Load Switches | |
| Fuel Gauging | Voltage References | |
| Current Limited Load Switches | Voltage Supervisors and Monitors | |
| Switching Regulators | Power MOSFETs | |
| Inductorless DC/DC Converters | USB OTG | |
| Linear Regulators | PLL | |
| A/D and D/A Converters | Op Amps and Comparators | |
| Audio Class D and Audio Codec | Supercapacitor Chargers |
These semiconductor solutions offer designers highly flexible power management options, lower component counts, less design complexity, and smaller board space requirements. AnalogicTech is a single source of power management solutions for mobile and line powered consumer electronics devices.
For our system solutions, we continue to expand our family of LED driver systems solutions for LED backlit LCD televisions. Our solutions represent one of the highest levels of system integration for LED backlit LCD televisions in the industry. The AAT2400 series solutions consist of products for high resolution direct, high voltage edge and segmented edge LED backlight systems. The high resolution direct and segmented edge products conserve system power and deliver a better end-user experience by providing precise brightness control to individual LED segments based on image content. The result is truer blacks and improved contrast for a significantly better, more natural viewing experience. The high voltage edge solutions provide an environmentally safe and efficient replacement for CCFL backlights that contain mercury. LED backlighting makes it possible to meet the increasingly stringent energy consumption specifications for large panel TV’s such as the state of California is requiring.
6
Table of Contents
In addition, we have recently introduced our first µSwitcher converter family of ultra-compact switching regulators that achieve up to 95% efficiency, but are as simple to design as low-dropout linear regulators. These converters are designed for space constrained applications that require high efficiency. These ultra-compact regulators include an integrated inductor and can reduce the printed circuit board area by 50%.
Customers, Sales and Marketing
We work directly with system designers to create demand for our products by providing them with application-specific product information for their system design, engineering and procurement groups. Our field application engineers actively engage these groups during their design processes to introduce them to our products and the target applications our products address. We endeavor to design products that will meet anticipated, increasingly complex and specific design requirements, but which will also support widespread demand for these products and future products derived from these products.
We sell directly to original equipment manufacturers, or OEMs, including Samsung Electronics Co., Ltd. and LG Electronics, Inc. and other large brands in the Mobile and TV space. We sell through distributors to original design manufacturers, or ODMs, to contract manufacturers, and to other system designers, including USI Corporation, Flextronics and Foxconn Electronics, Inc. We also do extensive partnering with system providers for reference design based sales like those associated with Broadcom chipsets for Apple, Dell and HP and Qualcomm for their WCDMA platforms.
We sell our products through our direct sales and applications support organization to OEMs, ODMs and contract electronics manufacturers, as well as through arrangements with distributors that fulfill third-party orders for our products. Many of our current distributors also serve as sales representatives procuring orders for us to fill directly. We receive a substantial portion of our net revenue from a small number of customers. Samsung was our largest direct customer in 2010 and 2009 and represented 27%, 33% and 20% of our net revenue in 2010, 2009 and 2008, respectively. LG Electronics was our largest direct customer in 2008 and represented 17%, 24% and 25% of our net revenue in 2010, 2009 and 2008, respectively. End users of our products purchasing from us directly accounted for 58%, 74% and 67% of our net revenue in 2010, 2009 and 2008, respectively, while distributors, ODMs and contract electronics manufacturers accounted for 42%, 26% and 33% of our net revenue in 2010, 2009 and 2008, respectively. In 2010, one distributor accounted for 11% of our net revenue. No single distributor accounted for more than 10% of our net revenue in 2009 or 2008.
Our technical global sales and field applications force is organized in regional teams. We have added additional customer service personnel in regions where we ship directly to an OEM, particularly in South Korea. In addition to creating the initial demand for our products, each regional team is responsible for increasing demand from distributors, ODMs, contract manufacturers and end users. We operate sales offices in: Seoul, South Korea; Taipei, Taiwan; Tokyo, Japan; Shanghai, China; Shenzhen, China; Santa Clara, California; and London, England. Santa Clara is both our corporate and North American sales headquarters, Shanghai is our sales headquarters for China, and London is our sales headquarters for Europe, the Middle East and Africa. We use this network of offices and staff, with the support of distributors and representatives, to stay close to system designers and our other customers and remain current on the newest global technology developments through the sharing of customer visit reports.
Manufacturing and Operations
We use third-party foundries and assembly and test subcontractors to manufacture, assemble and test our products. To provide smaller products with higher integration and efficiency, we have implemented an outsourced fabrication model to manufacture our products at half-micron geometries and below. Specifically, we contract with specialty foundries that have former DRAM fabs employing advanced analog CMOS process technology and, under license, our patented ModularBCD technology. We capture the operational and financial benefits of the fabless model, including reduced manufacturing personnel, capital expenditures, fixed assets and fixed costs.
7
Table of Contents
We use third-party contractors, primarily in Taiwan, to perform wafer probe testing. The probed wafers are then shipped to our back-end supplier’s assembly and test manufacturing locations in Taiwan, Shanghai, Chengdu or Malaysia. Back-end logistics and engineering support is performed through our operations team in Chupei, Taiwan. Finished goods inventory is stored and shipped world-wide from Hong Kong by a third-party service provider on our behalf. All scheduling is internally communicated globally via our virtual private network and web-based enterprise resource planning system.
In addition to innovative manufacturing processes, we also work with our packaging contractors to develop innovative packaging solutions that make use of new assembly methods and new high performance packaging materials to improve area efficiency, optimize thermal and electrical performance, reduce package size and offer ease-of-use and cost efficiency. We use area-efficient and multi-chip packages to meet more complex power management needs in a smaller footprint.
A certain portion of our logistics, order entry, purchasing and billing functions is located in Macau, China. Global coordination for production and billing is orchestrated from and on behalf of our Macau office. Other operation locations include Chupei, Taiwan and Hong Kong. Within operations, some back-end engineering functions are located in Shanghai, China; some fab sustaining and quality functions are located in Seoul, Korea.
Research and Development
We utilize global design, test and product engineering resources in our product development. At present, we have two equally sized design teams. Marketing and product definition is located in our Santa Clara headquarters closely supported by application engineers in Shanghai, China and Santa Clara. Our staff’s core competencies include high-frequency conversion, low-noise switching and operation, light-load efficiency, protection and fault detection, precision parameter matching, fast current limiting, robust battery charging and analog functionality with extremely low quiescent currents. We support our research and development efforts for new products and improvements to our existing products with our technology development group, which is focused on creating, developing, characterizing and releasing into production new wafer fabrication processes. We define and create processes, such as ModularBCD, that offer features, performance, devices, characteristics and capabilities not available through conventional foundry processes. We also install these processes according to available resources and market timing. Our technology group oversees any transfers of our processes into a new facility to ensure that the unit process steps are adapted properly to the new facility’s specific equipment set. Our technology group comprises expertise in device physics and characterization, device layout, process engineering and wafer fabrication. We also develop area-efficient single and multi-chip packages to meet more complex power management needs in a smaller footprint. Working with packaging partners, we develop new packages that optimize device performance, save space, and offer ease-of-use and low cost. As package size continues to shrink and system complexity increases, we will continue to review and develop where necessary new packaging solutions.
In 2010, 2009 and 2008, we spent $30.3 million, $27.5 million and $30.6 million, respectively, on research and development efforts. We anticipate that we will continue to invest significant amounts in research and development activities to develop new products and processes.
Intellectual Property
We rely on our patents, trade secret laws, contractual provisions, licenses, copyrights, trademarks and other proprietary rights to protect our intellectual property. As of December 31, 2010, we have been issued 106 patents. We cannot guarantee that our pending patent applications will be approved, that any issued patents will protect our intellectual property or will not be challenged by third parties, or that the patents of others will not have an adverse effect on our ability to do business. We focus our patent efforts in the United States, and, when justified by cost and strategic importance, we file corresponding foreign patent applications in such jurisdictions as
8
Table of Contents
Europe, South Korea, China, Taiwan and Japan. Our patent strategy is designed to provide a balance between the need for coverage in our strategic markets and the need to maintain costs at a reasonable level.
Unauthorized parties may attempt to copy aspects of our products or obtain and use information that we consider proprietary. Competitors may also recruit our employees who have access to our proprietary technologies. We cannot assure that the measures we have implemented to prevent misappropriation or infringement of our intellectual property will be successful.
Employees
As of December 31, 2010, we had 281 employees located in the United States, China, Hong Kong, Europe, Japan, South Korea, Taiwan and Macau. We consider our employee relations to be good.
Officers
The following table sets forth certain information about our officers:
| Name |
Age |
Position | ||
| Richard K. Williams |
52 | President, Chief Executive Officer, Chief Technical Officer and Director | ||
| Brian R. McDonald |
54 | Chief Financial Officer, Vice President of Worldwide Finance and Secretary | ||
| Dr. Jun-Wei Chen |
60 | Vice President of Technology | ||
| Kevin P. D’Angelo |
51 | Vice President of Advanced Products and Fellow | ||
| David Schwartz |
54 | Vice President of Worldwide Sales | ||
| Allen K. Lam |
47 | Former Vice President of Worldwide Operations | ||
| Edward Lam |
50 | Former Vice President of Marketing and Engineering | ||
Richard K. Williams, one of our founders, has served as our President and Chief Executive Officer since April 2000 and also as our Chief Technical Officer and a director since September 1998. Prior to joining us as Vice President of Engineering and Product Strategy in 1998, Mr. Williams served at Siliconix incorporated for 18 years, most recently as Senior Director of Device Concept & Design. Mr. Williams holds more than 200 US patents in device, process, package, circuit, system and application methods and apparatus, and has written over 100 published articles and invited papers. Mr. Williams is a member of the Institute of Electrical and Electronic Engineers. Mr. Williams received an M.S. in Electrical Engineering from Santa Clara University and a B.S., with honors, in Electrical Engineering (specializing in semiconductor device physics and fabrication) from the University of Illinois at Urbana-Champaign.
Brian R. McDonald has served as our Chief Financial Officer and Vice President of Worldwide Finance since June 2004 and as our Secretary since August 2004. Mr. McDonald is responsible for accounting, finance, compliance, information technology and human resource functions. Prior to joining us, Mr. McDonald held senior financial management positions at Monolithic Power Systems, Inc., Elantec Semiconductor, Inc., Mattson Technology, Inc., National Semiconductor Corporation, Read-Rite Corporation and Micro Linear Corporation. Mr. McDonald received a B.S. in Management from Santa Clara University.
Jun-Wei Chen has served as our Vice President of Technology since February 2005. Dr. Chen is responsible for device concept and design, process development and integration, CAE development and global Foundry Direct technical support. Prior to joining us, Dr. Chen held various positions including Vice President of Technology at SmartASIC Technology, Inc. from May 2004 to February 2005 and Chief Technology Officer at CLL Technology, Inc. from May 2000 to May 2004. Dr. Chen holds 20 US patents and has written over 30
9
Table of Contents
technical articles. He is also a member of the Institute for Electrical and Electronic Engineers. Dr. Chen received a Ph.D. and an M.S. in Electrical Engineering from Carnegie Mellon University and a B.S. in Electrical Engineering from National Taiwan University, Taipei.
Kevin P. D’Angelo, one of our founders, has served as our Vice President of Advanced Products and Fellow since February 2009. Prior to this, Mr. D’Angelo served as our Vice President of Engineering since January 2001. Mr. D’Angelo is responsible for IC design in the United States. Mr. D’Angelo previously served as our Senior Director from June 2000 to January 2001 and as our Senior Manager from January 1999 to June 2000. Mr. D’Angelo received the 2002 Marconi award for excellence in science and technology, and he holds eight US patents. Mr. D’Angelo received a B.S. in Electrical Engineering from the University of California, San Diego.
David Schwartz has served as our Vice President of Worldwide Sales since February 2009. Prior to joining AnalogicTech, Mr. Schwartz was the Vice President of Worldwide Sales and Marketing at Oxford Semiconductor from October 2006 until January 2009. Prior to this, Mr. Schwartz served as the Chief Operating Officer of Renesas Technology Americas from April 2003 until September 2006. Prior to this, Mr. Schwartz held several positions at Mitsubishi Electronics America for 12 years, including Vice President and General Manager of the company’s Sales and System-on-a-Chip Divisions. Mr. Schwartz earned a Masters of Business Administration at Farleigh Dickinson University and a B.S. in Electrical Engineering at the Pratt Institute.
Allen K. Lam, one of our founders, served as our Vice President of Worldwide Operations from May 2002 until September 2010. Mr. Lam was responsible for global manufacturing logistics and planning, purchasing, foundry management, packaging and test engineering, process quality and supporting ongoing quality and environmental initiatives. Mr. Lam previously served as our Director of Operations and Quality and Reliability Assurance from June 1999 to April 2002 and as our Manager of Quality and Reliability Assurance from November 1998 to May 1999. Mr. Lam is fluent in English, Mandarin and Cantonese and managed our operations in Taiwan, China, Macau and Hong Kong. Mr. Lam holds seven US patents. Mr. Lam received a Higher Diploma in Applied Science from the Hong Kong Polytechnic University.
Edward Lam served as our Vice President of Marketing and Engineering from July 2008 until September 2010. Mr. Lam was responsible for our global marketing and engineering operations. Prior to joining us, Mr. Lam served as the Senior Vice President of Product Lines at Exar Corporation from August 2007 until June 2008. Prior to this, Mr. Lam served as the Senior Vice President of Marketing and Business Development at Sipex Corporation from September 2005 until August 2007. Prior to this, from 1984 until September 2005, Mr. Lam held several management and engineering positions at National Semiconductor, most recently as Vice President of the company’s Analog Power Management Product Line. Mr. Lam received a B.S. in Engineering from San Francisco State University.
| ITEM 1A. | RISK FACTORS |
If we fail to forecast demand for our products accurately, we may incur product shortages, delays in product shipments or excess or insufficient product inventory.
We generally do not obtain firm, long-term purchase commitments from our customers. Because production lead times often exceed the amount of time required to fulfill orders, we often must build in advance of orders, relying on an imperfect demand forecast to project volumes and product mix. Our demand forecast accuracy can be adversely affected by a number of factors, including inaccurate forecasting by our customers, changes in market conditions, new part introductions by our competitors that lead to our loss of previous design wins, adverse changes in our product order mix and demand for our customers’ products or models. Even after an order is received, our customers may cancel these orders or request a decrease in production quantities. Any such cancellation or decrease subjects us to a number of risks, most notably that our projected sales will not materialize on schedule or at all, leading to unanticipated revenue shortfalls and excess or obsolete inventory which we may be unable to sell to other customers. Alternatively, if we are unable to project customer
10
Table of Contents
requirements accurately, we may not build enough products, which could lead to delays in product shipments and lost sales opportunities in the near term, as well as force our customers to identify alternative sources, which could affect our ongoing relationships with these customers. We have in the past had customers dramatically increase their requested production quantities with little or no advance notice and after they had submitted their original order. We have on occasion been unable to fulfill these revised orders within the time period requested. Either overestimating or underestimating demand would lead to excess, obsolete or insufficient inventory, which could harm our operating results, cash flow and financial condition, as well as our relationships with our customers.
We receive a substantial portion of our net revenue from a small number of OEM customers and distributors, and the loss of, or a significant reduction in, orders from those customers or our other largest customers would adversely affect our operations and financial condition.
We received an aggregate of approximately 88%, 90% and 84% of our net revenue from our ten largest customers for the years ended December 31, 2010, 2009 and 2008, respectively. Any action by one of our largest customers that affects our orders, product pricing or vendor status could significantly reduce our net revenue and harm our financial results.
We receive a substantial portion of our net revenue from a small number of customers. For example, for the years ended December 31, 2010, 2009 and 2008, Samsung and LG Electronics were our largest customers. Sales to Samsung represented 27%, 33% and 20% of our net revenue in 2010, 2009 and 2008, respectively. Additionally, we sell to a number of contract manufacturers of Samsung. Sales to Samsung and its contract manufacturers represented 31%, 41% and 36% of our net revenue in 2010, 2009 and 2008, respectively. Sales to LG Electronics represented 17%, 24% and 25% of our net revenue in 2010, 2009 and 2008, respectively. We anticipate that we will continue to be dependent on these customers for a significant portion of our net revenue in the immediate future; however, we do not have long-term contractual purchase commitments from them, and we cannot assure you that they will continue to be our customers. Because our largest customers account for such a significant part of our business, the loss of, or a decline in sales to, any of our major customers would negatively impact our business.
Our operating results have fluctuated in the past and we expect our operating results to continue to fluctuate.
Our revenues are difficult to predict and have varied significantly in the past from period to period. We expect our revenues and expense levels to continue to vary in the future, making it difficult to predict our future operating results. In particular, we experience seasonality and variability in demand for our products as our customers manage their inventories. Our customers tend to increase inventory of our products in anticipation of the peak fourth quarter buying season for the mobile consumer electronic devices in which our products are used, which often leads to sequentially lower sales of our products in the first calendar quarter and, potentially, late in the fourth calendar quarter.
Additional factors that could cause our results to fluctuate include:
| • | the forecasting, scheduling, rescheduling or cancellation of orders by our customers, particularly in China and other emerging markets; |
| • | costs associated with litigation, especially related to intellectual property; |
| • | liquidity and cash flow of our distributors, suppliers and end-market customers; |
| • | changes in manufacturing costs, including wafer, test and assembly costs, and manufacturing yields, product quality and reliability; |
| • | the timing and availability of adequate manufacturing capacity from our manufacturing suppliers; |
11
Table of Contents
| • | our ability to successfully define, design and release new products in a timely manner that meet our customers’ needs; |
| • | the timing, performance and pricing of new product introductions by us and by our competitors; |
| • | general economic conditions in the countries where we operate or our products are used; |
| • | changes in exchange rates, interest rates, tax rates and tax withholding; |
| • | geopolitical stability, especially affecting China, Taiwan and Asia in general; and |
| • | changes in domestic and international tax laws. |
Unfavorable changes in any of the above factors, most of which are beyond our control, could significantly harm our business and results of operations.
We may be required to record additional significant charges to earnings if our goodwill becomes impaired.
Under accounting principles generally accepted in the United States, we review our goodwill for impairment each year as of September 30th and when events or changes in circumstances indicate the carrying value may not be recoverable. The carrying value of our goodwill may not be recoverable due to factors indicating a decrease in the value of the Company, such as a decline in stock price and market capitalization, reduced estimates of future cash flows and slower growth rates in our industry. Estimates of future cash flows are based on an updated long-term financial outlook of our operations. However, actual performance in the near-term or long-term could be materially different from these forecasts, which could impact future estimates. For example, a significant decline in our stock price and/or market capitalization may result in goodwill impairment. We may be required to record a charge to earnings in our financial statements during a period in which an impairment of our goodwill is determined to exist, which may negatively impact our results of operations.
We may be required to record impairment charges in future quarters as a result of the decline in value of our investments in auction rate securities.
As of December 31, 2010, our investment portfolio included interest bearing auction rate securities (ARS) with a fair value of $1.6 million. Our ARS represent investments in debt obligations collateralized by Federal Family Education Program student loans. At the time of acquisition, these ARS investments were intended to provide liquidity via an auction process that resets the applicable interest rate at predetermined calendar intervals, allowing investors to either roll over their holdings or gain immediate liquidity by selling such interests at par. The monthly auctions historically provided a liquid market for these securities. However, beginning in 2008, uncertainties in the credit markets have affected all of our holdings in ARS and auctions for our investments in these securities have failed to settle on their respective settlement dates. Auctions for our investments in these securities continued to fail through December 31, 2010.
If the current market conditions deteriorate further, the anticipated recovery in market values does not occur, or if we determine that we intend to sell the ARS, it is possible that we will be required to sell the ARS before a recovery of the auction process, or that we will not recover the entire amortized cost basis of the ARS, and we may be required to record impairment charges in future quarters which may negatively impact our results of operations.
We may be unsuccessful in developing and selling new products or in penetrating new markets.
We operate in a dynamic environment characterized by rapidly changing technologies and industry standards and technological obsolescence. Our competitiveness and future success depends on our ability to design, develop, manufacture, assemble, test, market and support new products and enhancements on a timely and cost-effective basis. A fundamental shift in technologies in any of our product markets could harm our competitive position within these markets. Our failure to anticipate these shifts, to develop new technologies or
12
Table of Contents
to react to changes in existing technologies could materially delay our development of new products, which could result in product obsolescence, decreased net revenue and a loss of design wins to our competitors. Our understanding is that our overall product acceptance rate is typical for the semiconductor analog sector due to ongoing competition, long design-in and qualification cycles, late introduction and/or product not meeting exact customer requirements. In some instances, our products were designed into a customer’s product or system but our customer’s product failed to gain market acceptance so no substantial business resulted. In other cases, we may introduce a product before the market is ready to accept or require the features offered in our product, in which revenues may result at a later and somewhat unpredictable date in the future.
As part of our continued efforts to grow and diversify our product offerings, we continue to expand our family of LED driver system solutions for LED backlit LCD televisions and also recently introduced our first µSwitcher converter family of ultra-compact switching regulators. The success of these and all of our new products depends on accurate forecasts of long-term market demand and future technological developments, as well as on a variety of specific implementation factors, including:
| • | effective marketing, sales and service; |
| • | timely and efficient completion of process design and device structure improvements and implementation of manufacturing, assembly and test processes; and |
| • | the quality, performance and reliability of the product. |
If we fail to introduce new products or penetrate new markets, our revenues will likely decrease over time and our financial condition could suffer.
We may not have the expertise we need to successfully define or develop products for new market opportunities, and we may lack the sales connections and applications expertise to secure orders for such products. Identifying and hiring such resources may be difficult and we may not be successful in identifying and hiring necessary personnel. Attempts to balance product development and sales efforts between new and existing applications may delay our entrance into new markets and make it more difficult to penetrate new customers and application opportunities in the future.
Due to defects and failures that may occur, our products may not meet specifications, which may cause customers to return or stop buying our products and may expose us to product liability claims.
Our customers generally establish demanding specifications for quality, performance and reliability that our products must meet. Integrated circuits as complex as ours often encounter development delays and may contain undetected defects or failures when first introduced or after commencement of commercial shipments, which might require product replacement or recall. In addition, our customers may not use our products in a way that is consistent with our published specifications. If defects and failures occur in our products during the design phase or after, or our customers use our products in ways that are not consistent with their intended use, we could experience lost revenues, increased costs, including warranty expense and costs associated with customer support, delays in or cancellations or rescheduling of orders or shipments, or product returns or discounts, any of which would harm our operating results. We cannot assure you that we will have sufficient resources, including any available insurance, to satisfy any asserted claims.
The nature of the design process requires us to incur expenses prior to earning revenues associated with those expenses, and we will have difficulty selling our products if system designers do not design our products into their electronic systems.
We devote significant time and resources to working with our customers’ system designers to understand their future needs and to provide products that we believe will meet those needs. If a customer’s system designer initially chooses a competitor’s product for a particular electronic system, it becomes significantly more difficult
13
Table of Contents
for us to sell our products for use in that electronic system because changing suppliers can involve significant cost, time, effort and risk for our customers.
We often incur significant expenditures in the development of a new product without any assurance that our customers’ system designers will select our product for use in their electronic systems. We often are required to anticipate which product designs will generate demand in advance of our customers expressly indicating a need for that particular design. In some cases, there is minimal or no demand for our products in our anticipated target applications. Even if our products are selected by our customers’ system designers, a substantial period of time will elapse before we generate revenues related to the significant expenses we have incurred. The reasons for this delay generally include the following elements of our product sales and development cycle timeline and related influences:
| • | our customers usually require a comprehensive technical evaluation of our products before they incorporate them into their electronic systems; |
| • | it can take up to 12 months from the time our products are selected to complete the design process; |
| • | it can take an additional 9 to 12 months or longer to complete commercial introduction of the electronic systems that use our products, if they are introduced at all; |
| • | original equipment manufacturers typically limit the initial release of their electronic systems to evaluate performance and consumer demand; and |
| • | the development and commercial introduction of products incorporating new technology are frequently delayed. |
We estimate that the overall sales and development cycle timeline of an average product is approximately 16 months.
Additionally, even if system designers use our products in their electronic systems, we cannot assure you that these systems will be commercially successful. As a result, we are unable to accurately forecast the volume and timing of our orders and revenues associated with any new product introductions.
Any increase in the manufacturing cost of our products could reduce our gross margins and operating profit.
The semiconductor business exhibits ongoing competitive pricing pressure from customers and competitors. Accordingly, any increase in the cost of our products, whether by adverse purchase price variances or adverse manufacturing cost variances, will reduce our gross margins and operating profit. We do not have many long-term supply agreements with our manufacturing suppliers and, consequently, we may not be able to obtain price reductions or anticipate or prevent future price increases from our suppliers.
The average selling price of our products may decline, or a change in the mix of product orders may occur, either of which could reduce our gross margins.
During a power management product’s life, its selling price tends to decrease for a particular application. As a result, to maintain gross margins on our products, we must continue to identify new applications for our products, reduce manufacturing costs for our existing products and introduce new products. If we are unable to identify new, high gross margin applications for our existing products, reduce our production costs or sell new, high gross margin products, our gross margins will suffer. A sustained reduction in our gross margins could harm our future operating results, cash flow and financial condition, which could lead to a significant drop in the price of our common stock.
14
Table of Contents
Because we receive a substantial portion of our net revenue through distributors, their financial viability and ability to access the capital markets could impact our ability to continue to do business with them and could result in lower net revenue, which could adversely affect our operating results and our customer relationships.
We obtain a portion of our net revenue through sales to distributors located in Asia who act as our fulfillment representatives. For example, sales to distributors accounted for 39%, 24% and 31% of our net revenue for the years ended December 31, 2010, 2009 and 2008, respectively. In the normal course of their operation as fulfillment representatives, these distributors typically perform functions such as order scheduling, shipment coordination, inventory stocking, payment and collections and, when applicable, currency exchange between purchasers of our products and these distributors. Our distributors’ compensation for these functions is reflected in the price of the products we sell to these distributors. Many of our current distributors also serve as our sales representatives procuring orders for us to fill directly. If these distributors are unable to pay us in a timely manner or if we anticipate that they will not pay us, we may elect to withhold future shipments, which could adversely affect our operating results. If one of our distributors experiences severe financial difficulties, becomes insolvent or declares bankruptcy, we could lose product inventory held by that distributor and we could be required to write off the value of any receivables owed to us by that distributor. We could also be required to record bad debt expense in excess of our reserves. We may not be successful in recognizing these indications or in finding replacement distributors in a timely manner, or at all, any of which could harm our operating results, cash flow and financial condition.
Our distributor arrangements often require us to accept product returns and to provide price protection and if we fail to properly estimate our product returns and price protection reserves, this may adversely impact our reported financial information.
A substantial portion of our sales are made through third-party distribution arrangements, which include stock rotation rights that generally permit the return of up to 5% of the previous three months’ purchases. We generally accept these returns quarterly. We record estimated returns for stock rotation at the time of shipment. Our arrangements with our distributors typically also include price protection provisions if we reduce our list prices. We record reserves for price protection at the time we decide to reduce our list prices. In the future, we could receive returns or claims that are in excess of our estimates and reserves, which could harm our operating results.
If our relationship with any of our distributors deteriorates or terminates, it could lead to a temporary or permanent loss of revenues until a replacement sales channel can be established to service the affected end-user customers, as well as inventory write-offs or accounts receivable write-offs. In addition, we also may be obligated to repurchase unsold products from a distributor if we decide to terminate our relationship with that distributor.
Our current backlog may not be indicative of future sales.
Due to the nature of our business, in which order lead times may vary, and the fact that customers are generally allowed to reschedule or cancel orders on short notice, we believe that our backlog is not necessarily a good indicator of our future sales. Our quarterly net revenue also depends on orders booked and shipped in that quarter. Because our lead times for the manufacturing of our products generally take six to ten weeks, we often must build in advance of orders. This exposes us to certain risks, most notably the possibility that expected sales will not occur, which may lead to excess inventory, and we may not be able to sell this inventory to other customers. In addition, we supply LG Electronics, one of our largest customers, through its central hub and we do not record backlog with respect to the products we ship to the hub. Therefore, our backlog may not be a reliable indicator of future sales.
15
Table of Contents
We face risks in connection with our internal control over financial reporting and any related remedial measures that we undertake to correct any material weaknesses in our internal control over financial reporting.
In accordance with Section 404 of the Sarbanes-Oxley Act, we are required to report annually on the effectiveness of our internal control over financial reporting as such term is defined in Rule 13a-15(f) and Rule 15d-15(f) under the Securities Exchange Act of 1934. This report must include disclosure of any material weakness in our internal control over financial reporting. In preparation for issuing this management report, we document, evaluate, and test our internal control over financial reporting.
No material weakness will be considered remediated until our remedial efforts have operated for an appropriate period, have been tested, and management has concluded that they are operating effectively. We cannot be certain that any measures we take to remediate a material weakness will ensure that we implement and maintain adequate internal control over financial reporting and that we will successfully remediate the material weakness. In addition, we cannot assure you that we will not in the future identify further material weaknesses in our internal control over financial reporting that we have not discovered to date, which may impact the reliability of our financial reporting and financial statements.
If consumer demand for mobile consumer electronic devices declines, our net revenue will decrease.
Our products are used primarily in the mobile consumer electronic devices market. For the foreseeable future, we expect to see the significant majority of our net revenue continues to come from this market, especially in wireless handsets. If consumer demand for these products declines and fewer mobile customer electronic devices are sold, our net revenue will decrease significantly. For example, in the second half of 2008, we experienced a significant decrease in worldwide billings to our customers, suggesting that our customers were reacting to decreased consumer demand for their end products. In an adverse economic climate such as the current economic downturn, consumers are less likely to prioritize purchasing new mobile consumer electronic devices or upgrading existing devices. In addition, if we are unsuccessful in identifying alternative markets for our products in a timely manner, our operating results will suffer dramatically.
Substantially all of our manufacturing suppliers, customers and operations are located in Asia, which subjects us to additional risks, including regional economic influences, logistical complexity, political instability and natural disasters including earthquakes.
We conduct, and expect to continue to conduct, almost all of our business with companies that are located outside the United States. Based on ship-to locations, substantially all of our net revenue for the years ended December 31, 2010, 2009 and 2008 came from customers in Asia, particularly South Korea, Taiwan, China and Japan. A vast majority of our contract manufacturing operations are located in South Korea, Taiwan, Malaysia and China. In addition, we have a design center in Shanghai, China. As a result of our international focus, we face several challenges, including:
| • | increased complexity and costs of managing international operations; |
| • | longer and more difficult collection of receivables; |
| • | political and economic instability; |
| • | limited protection of our intellectual property; |
| • | unanticipated changes in local regulations, including tax regulations; |
| • | timing and availability of import and export licenses; and |
| • | foreign currency exchange fluctuations relating to our international operating activities. |
16
Table of Contents
Our corporate headquarters in Santa Clara, California, our operations office in Chupei, Taiwan, and the production facilities of one of our wafer fabrication suppliers and several of our assembly and test suppliers in Hsinchu and across Taiwan are located near seismically active regions and are subject to periodic earthquakes. We do not maintain earthquake insurance and our business could be damaged in the event of a major earthquake or other natural disaster.
In addition to risks in our operations from natural disasters, our customers are also subject to these risks. Any disaster impacting our customers could result in loss of orders, delay of business and temporary regional economic recessions.
We are also more susceptible to the regional economic impact of health crises. Because we anticipate that we will continue to rely heavily on foreign companies or United States companies operating in Asia for our future growth, the above risks and issues that we do not currently anticipate could adversely affect our ability to conduct business and our results of operations.
We outsource our wafer fabrication, testing, packaging, warehousing and shipping operations to third parties, and rely on these parties to produce and deliver our products according to requested demands in specification, quantity, cost and time.
We rely on third parties for substantially all of our manufacturing operations, including wafer fabrication, wafer probe testing, wafer thinning, assembly, final test, warehousing and shipping. Furthermore, for certain packages, at times we rely on a single manufacturer. We depend on these parties to supply us with material of a requested quantity in a timely manner that meets our standards for yield, cost and manufacturing quality. Any problems with our manufacturing supply chain could adversely impact our ability to ship our products to our customers on time and in the quantity required, which in turn could cause an unanticipated decline in our sales and possibly damage our customer relationships. The current economic downturn could adversely affect the financial strength of our vendors and adversely impact their ability to manufacture product, resulting in a shortage or delay in product shipments to our customers.
Our products are manufactured at a limited number of locations. If we experience manufacturing problems at a particular location or with a particular supplier, we would be required to transfer manufacturing to a backup supplier. Converting or transferring manufacturing from a primary supplier to a backup fabrication facility could be expensive and could take as long as 6 to 12 months. During such a transition, we would be required to meet customer demand from our then-existing inventory, as well as any partially finished goods that can be modified to the required product specifications. We do not seek to maintain sufficient inventory to address a lengthy transition period because we believe it is uneconomical to keep more than minimal inventory on hand. As a result, we may not be able to meet customer needs during such a transition, which could delay shipments, cause a production delay or stoppage for our customers, result in a decline in our sales and damage our customer relationships. Should we be required to manufacture safety stock and finished goods to insure against any supply interruptions to our customers, there is no guarantee that our customers would necessarily purchase the extra material and excess inventory may result. There is no guarantee we would be able to sell that excess inventory to other customers and we may have to write-off this material as an expense adversely affecting our financial performance.
In addition, a significant portion of our sales are to customers that practice just-in-time order management from their suppliers, which gives us a very limited amount of time in which to process and complete these orders. As a result, delays in our production or shipping by the parties to whom we outsource these functions could reduce our sales, damage our customer relationships and damage our reputation in the marketplace, any of which could harm our business, results of operations and financial condition.
17
Table of Contents
The loss of any of our key personnel could seriously harm our business, and our failure to attract or retain specialized technical and management talent could impair our ability to grow our business.
The loss of services of one or more of our key personnel could seriously harm our business. In particular, our ability to define and design new products, gain new customers and grow our business depends on the continued contributions of Richard K. Williams, our President, Chief Executive Officer and Chief Technical Officer, as well as our senior level sales, finance, operations, technology and engineering personnel. Our future growth will also depend significantly on our ability to recruit and retain qualified and talented managers and engineers, along with key manufacturing, quality, sales and marketing staff members. There remains intense competition for these individuals in our industry, especially those with power and analog semiconductor design and applications expertise. We cannot assure you we will be successful in finding, hiring and retaining these individuals. If we are unable to recruit and retain such talent, our product and technology development, manufacturing, marketing and sales efforts could be impaired.
In economic downturns where consumer demand for our customer’s products is reduced or delayed, we expect lower net revenue and reduced profitability. In response to these downturns, we may implement certain cost reduction actions including spending controls, forced holidays and company shutdowns, employee layoffs, shortened work-weeks and involuntary salary reductions. For example, in 2010 we reduced our US workforce by approximately 15%. It is uncertain what affect such measures may have on our ability to retain key talent and staff members, or our ability to rehire employees should business improve.
Changes in effective tax rates or adverse outcomes resulting from examination of our income tax returns could adversely affect our results.
Our future effective tax rates could be adversely affected by lower than anticipated earnings in countries where we have lower statutory rates and higher than anticipated earnings in countries where we have higher statutory rates, by changes in the valuation of our deferred tax assets and liabilities, or by changes in tax laws, regulations, accounting principles or interpretations thereof. Further, as a result of certain ongoing employment and capital investment commitments made by us, our income in certain countries is subject to reduced tax rates, and in some cases is wholly exempt from tax. Our failure to meet such commitments could adversely impact our effective tax rate. In addition, we are subject to the continuous examination of our income tax returns by the Internal Revenue Service and other tax authorities. We regularly assess the likelihood of adverse outcomes resulting from these examinations to determine the adequacy of our provision for income taxes. There can be no assurance that the outcomes from these continuous examinations will not have an adverse effect on our operating results and financial condition.
We compete against companies with substantially greater financial and other resources, and our market share or gross margins may be reduced if we are unable to respond to competitive challenges effectively.
The analog, mixed-signal, or analog with digital, and power management semiconductor industry in which we operate is highly competitive and dynamic, and we expect it to remain so. Our ability to compete effectively depends on defining, designing and regularly introducing new products that meet or anticipate the power management needs of our customers’ next-generation products and applications. We compete with numerous domestic and international semiconductor companies, many of which have greater financial and other resources with which to pursue marketing, technology development, product design, manufacturing, quality, sales and distribution of their products.
We consider our primary competitors to be Maxim Integrated Products, Inc., Linear Technology Corporation, Intersil Corporation, Texas Instruments Incorporated, Semtech Corporation, National Semiconductor Corporation, Richtek Technology Corporation, austriamicrosystems and Rohm Co., LTD. We expect continued competition from existing competitors as well as from new entrants into the power management semiconductor market. Our ability to compete depends on a number of factors, including:
| • | our success in identifying new and emerging markets, applications and technologies, and developing power management solutions for these markets; |
18
Table of Contents
| • | our products’ performance and cost effectiveness relative to that of our competitors’ products; |
| • | our ability to deliver products in large volume on a timely basis at a competitive price; |
| • | our success in utilizing new and proprietary technologies to offer products and features previously not available in the marketplace; |
| • | our ability to recruit application engineers and designers; and |
| • | our ability to protect our intellectual property. |
We cannot assure you that our products will compete favorably or that we will be successful in the face of increasing competition from new products and enhancements introduced by our existing competitors or new companies entering this market.
Intellectual property litigation could result in significant costs, reduce sales of our products and cause our operating results to suffer.
The semiconductor industry is characterized by vigorous protection and pursuit of intellectual property rights and positions, which has resulted in protracted and expensive litigation for many companies. We have in the past received, and expect that in the future we may receive, communications from various industry participants alleging our infringement of their patents, trade secrets or other intellectual property rights. Any lawsuits resulting from such allegations could subject us to significant liability for damages and invalidate our proprietary rights. Any potential intellectual property litigation also could force us to do one or more of the following:
| • | stop selling products or using technology that contain the allegedly infringing intellectual property; |
| • | incur significant legal expenses; |
| • | pay damages to the party claiming infringement; |
| • | redesign those products that contain the allegedly infringing intellectual property; and |
| • | attempt to obtain a license to the relevant intellectual property from third parties, which may not be available on reasonable terms or at all. |
Furthermore, we have in the past agreed, and may in the future agree, to indemnify certain of our customers, distributors, suppliers, subcontractors and their affiliates for attorneys’ fees and damages and costs awarded against these parties in certain circumstances in which our products are alleged to infringe third-party intellectual property rights. These obligations could lead us to incur additional costs in related intellectual property litigation involving these parties, which could cause our operating results to suffer.
We initiated a lawsuit against Linear Technology Corporation in February 2006 for unfair business practices, interference with existing and prospective customers and trade libel, as well as a declaration of patent invalidity and non-infringement. In a related case, the International Trade Commission has initiated an investigation and subsequent enforcement action against AATI at the request of Linear Technology.
Uncertainty over the outcome of our litigation with Linear Technology may cause our customers or potential customers to elect not to include our products that are the subject of this litigation into the design of their systems. Once a customer’s system designer initially chooses a competitor’s product for a particular electronic system, it becomes significantly more difficult for us to sell our products for use in that electronic system, because changing suppliers can involve significant cost, time, effort and risk for our customers. As a result, our litigation with Linear Technology or any similar future litigation may result in on-going expenses on a quarterly basis. If we are unsuccessful in any such litigation, our business and our ability to compete in foreign markets
19
Table of Contents
could be harmed, and we could be enjoined from selling the accused products, either directly or indirectly, which could have a material adverse impact on our net revenue, financial condition, results of operations and cash flows. See Part II, Item 1 – Legal Proceedings.
Our failure to protect our intellectual property rights adequately could impair our ability to compete effectively or to defend ourselves from litigation, which could harm our business, financial condition and results of operations.
We rely primarily on patent, copyright, trademark and trade secret laws, as well as confidentiality and non-disclosure agreements to protect our proprietary technologies and know-how. While we have been issued 106 patents as of December 31, 2010, the rights granted to us may not be meaningful or provide us with any commercial advantage. For example, these patents could be challenged or circumvented by our competitors or be declared invalid or unenforceable in judicial or administrative proceedings. The failure of our patents to adequately protect our technology might make it easier for our competitors to offer similar products or technologies. Our foreign patent protection is generally not as comprehensive as our United States patent protection and may not protect our intellectual property in some countries where our products are sold or may be sold in the future. Even if foreign patents are granted, effective enforcement in foreign countries may not be available. Many United States-based companies have encountered substantial intellectual property infringement in foreign countries, including countries where we sell products.
Monitoring unauthorized use of our intellectual property is difficult and costly. It is possible that unauthorized use of our intellectual property may occur without our knowledge. We cannot assure you that the steps we have taken will prevent unauthorized use of our intellectual property. Our failure to effectively protect our intellectual property could reduce the value of our technology in licensing arrangements or in cross-licensing negotiations, and could harm our business, results of operations and financial condition. We may in the future need to initiate infringement claims or litigation. Litigation, whether we are a plaintiff or a defendant, can be expensive, time-consuming and may divert the efforts of our technical staff and managerial personnel, which could harm our business, whether or not such litigation results in a determination favorable to us.
Any acquisitions we make could disrupt our business, result in integration difficulties or fail to realize anticipated benefits, which could adversely affect our financial condition and operating results.
We may choose to acquire companies, technologies, assets and personnel that are complementary to our business, including for the purpose of expanding our new product design capacity, introducing new design, market or application skills or enhancing and expanding our existing product lines. In October 2006, we acquired Analog Power Semiconductor Corporation and related assets and personnel, primarily located in Shanghai, China. In June 2008, we acquired Elite Micro Devices, located in Shanghai, China. Acquisitions involve numerous risks, including the following:
| • | difficulties in integrating the operations, systems, technologies, products and personnel of the acquired companies; |
| • | diversion of management’s attention from normal daily operations of the business and the challenges of managing larger and more widespread operations resulting from acquisitions; |
| • | difficulties in entering markets in which we may have no or limited direct prior experience and where competitors may have stronger market positions; |
| • | the potential loss of key employees, customers, distributors, suppliers and other business partners of the companies we acquire following and continuing after announcement of acquisition plans; |
| • | improving and expanding our management information systems to accommodate expanded operations; |
| • | insufficient revenue to offset increased expenses associated with acquisitions; and |
| • | addressing unforeseen liabilities of acquired businesses. |
20
Table of Contents
Acquisitions may also cause us to:
| • | issue capital stock that would dilute our current stockholders’ percentage ownership; |
| • | use a substantial portion of our cash resources or incur debt; |
| • | assume liabilities; |
| • | record goodwill or incur amortization expenses related to certain intangible assets; and |
| • | incur large and immediate write-offs and other related expenses. |
Any of these factors could prevent us from realizing the anticipated benefits of an acquisition, and our failure to realize these benefits could adversely affect our business. In addition, we may not be successful in identifying future acquisition opportunities or in consummating any acquisitions that we may pursue on favorable terms, if at all. Any transactions that we complete may impair stockholder value or otherwise adversely affect our business and the market price of our stock. Failure to manage and successfully integrate acquisitions could materially harm our financial condition and operating results.
Our operating results, financial condition and cash flows may be adversely impacted by worldwide political and economic uncertainties and specific conditions in the markets we address, including the cyclical nature of and volatility in the semiconductor industry.
The semiconductor industry has historically exhibited cyclical behavior which at various times has included significant downturns in customer demand. These conditions have caused significant variations in product orders and production capacity utilization, as well as price erosion. Because a significant portion of our expenses is fixed in the near term or is incurred in advance of anticipated sales, we may not be able to decrease our expenses rapidly enough to offset any unanticipated shortfall in net revenue. If this situation were to occur, it could adversely affect our operating results, cash flow and financial condition.
Additionally, general worldwide economic conditions have recently experienced a downturn due to slower economic activity, concerns about inflation and deflation, fears of recession, increased energy costs, decreased consumer confidence, reduced corporate profits and capital spending, adverse business conditions and liquidity concerns in the wired and wireless communications markets, recent international conflicts and terrorist and military activity and the impact of natural disasters and public health emergencies. Our operations and performance depend significantly on worldwide economic conditions and their impact on consumer spending, which has recently deteriorated significantly in many countries and regions, including the United States and Asia, and may remain depressed for the foreseeable future. For example, some of the factors that could influence consumer spending include conditions in the residential real estate and mortgage markets, labor and healthcare costs, access to credit, consumer confidence and other factors affecting consumer spending behavior. These and other economic factors could have a material adverse effect on demand for our products and on our financial condition and operating results. In addition, these conditions make it extremely difficult for our customers, our vendors and us to accurately forecast and plan future business activities, and they could cause United States and foreign businesses to slow spending on our products and services, which would delay and lengthen sales cycles. We cannot predict the timing, strength or duration of any economic slowdown or subsequent economic recovery, worldwide, or in the semiconductor industry. If the economy or markets in which we operate do not continue at their present levels, our business, financial condition and results of operations will likely be materially and adversely affected.
We could be adversely affected by violations of the United States’ Foreign Corrupt Practices Act and similar worldwide anti-bribery laws.
The United States’ Foreign Corrupt Practices Act (“FCPA”) and similar anti-bribery laws in other jurisdictions generally prohibit companies and their intermediaries from making improper payments to government officials for the purpose of obtaining or retaining business. Our policies mandate compliance with
21
Table of Contents
these anti-bribery laws. There can be no assurance that our internal controls and procedures always will protect us from reckless or criminal acts committed by our employees or agents. If we are found to be liable for FCPA violations, we could suffer from criminal or civil penalties or other sanctions, which could have a material adverse effect on our business.
| ITEM 1B. | UNRESOLVED STAFF COMMENTS |
None
| ITEM 2. | PROPERTIES |
Our headquarters is located in a leased facility in Santa Clara, California. This facility, consisting of approximately 42,174 square feet of office space, accommodates our principal engineering, technology, administrative and finance activities. We lease 19,036 square feet of office space in Shanghai, China to accommodate our secondary engineering activities. We lease offices in Hong Kong, China, Chupei, Taiwan and Macau, China to accommodate our operations, planning, logistics and package engineering activities. We lease sales offices in London, England; Taipei, Taiwan; Tokyo, Japan; Seoul, South Korea; Shanghai and Shenzhen, China.
We do not own any real property. We believe that our leased facilities are adequate to meet our current needs and that additional facilities are available for lease to meet future needs.
| ITEM 3. | LEGAL PROCEEDINGS |
In May 2003, we received a letter from Linear Technology Corporation (“Linear Technology”) alleging that certain of our charge pump products infringed United States Patent No. 6,411,531 (‘531 Patent) owned by Linear Technology. In August 2004, we received a letter from Linear Technology alleging that certain of our switching regulator products infringed United States Patent Nos. 5,481,178, 6,304,066 and 6,580,258 (‘258 Patent). In response to these letters, we contacted Linear Technology to convey our good faith belief that we do not infringe the patents in question. Subsequently, we became aware of a marketing campaign conducted by Linear Technology in which it sought to disrupt our business relationships and sales by suggesting to our customers that our products infringe the same United States patents mentioned in its two letters to us. As a result, in February 2006, we initiated a lawsuit against Linear Technology for unfair business practices, interference with existing and prospective customers and trade libel, as well as a declaration of patent invalidity and non-infringement. This case is currently stayed pending the outcome of the United States International Trade Commission (“USITC”) action described in the following paragraphs.
In March 2006, the USITC responded to a complaint filed by Linear Technology by initiating an investigation under Section 337 of the Tariff Act to determine if certain of our products infringe certain patents owned by Linear Technology. The accused products include charge pumps and switching regulators and are similar to the products involved in our lawsuit with Linear Technology. A final determination was issued September 24, 2007, which was followed by separate appeals for the charge pump and switching regulator products. The last of these appeals, including the parties’ respective requests for rehearing, ended in 2009. The overall result of these processes clears the path for importation of our charge pump products. A limited exclusion order was also issued preventing us from importing certain of our switching regulator designs and the scope of this order was expanded by the appeals process. This exclusion order does not, however, prevent our customers from importing downstream products (i.e., products that incorporate AATI switching regulators) into the United States. To date, our sales of the excluded products in the United States have been minimal.
On October 1, 2008, the USITC initiated a formal enforcement proceeding at the request of Linear Technology. In that enforcement proceeding, Linear Technology alleges that we imported certain switching regulator products in violation of the limited exclusion order originally issued on September 24, 2007. The list of
22
Table of Contents
products alleged to be in violation was modified by a mutual agreement between the parties under which we voluntarily agreed to cease importation of our switching regulator products that do not use our low-noise design. A trial for the remaining products (i.e., those that use our most recent low-noise design) was completed on January 13, 2010. The final determination of that trial was issued on July 19, 2010, and held that our low-noise switching regulators are subject to the limited exclusion order and cannot be imported by us. As mentioned above, the limited exclusion order applies only to AATI and its agents and does not prevent importation of downstream products. US sales of the products involved in the enforcement have never been significant. Both parties are currently appealing unfavorable portions of the final determination to the United States Court of Appeals for the Federal Circuit.
In March 2009, we initiated a lawsuit against a small, privately held semiconductor manufacturing company alleging patent infringement of certain of its products. This case, filed in the United States District Court for the Northern District of California, is currently stayed pending a reexamination of the patent that we believe has been infringed. We do not believe that this lawsuit will have a material impact on our business or financial condition.
We will continue to incur patent litigation expenses in future years. We record legal expenses as incurred.
| ITEM 4. | (REMOVED AND RESERVED) |
23
Table of Contents
| ITEM 5. | MARKET FOR REGISTRANT’S COMMON EQUITY, RELATED STOCKHOLDER MATTERS AND ISSUER PURCHASES OF EQUITY SECURITIES |
The information required by this item regarding equity compensation plans is set forth under the caption “Equity Compensation Plan Information” in our 2011 Proxy Statement and is incorporated herein by reference. For additional information on our stock incentive plans and activity, see Note 5—Stock-Based Compensation to our consolidated financial statements included in Item 8 of this Report.
Market Price of Our Common Stock
Our common stock is traded on the Nasdaq Global Select Market under the symbol “AATI.” The following table sets forth on a per share basis the high and low intra-day sales prices for our common stock as reported by the Nasdaq Global Select Market for the periods indicated:
| High | Low | |||||||
| Year Ended December 31, 2010 |
||||||||
| First Quarter |
$ | 4.05 | $ | 3.12 | ||||
| Second Quarter |
$ | 4.20 | $ | 3.15 | ||||
| Third Quarter |
$ | 3.66 | $ | 2.84 | ||||
| Fourth Quarter |
$ | 4.05 | $ | 3.33 | ||||
| High | Low | |||||||
| Year Ended December 31, 2009 |
||||||||
| First Quarter |
$ | 4.18 | $ | 2.49 | ||||
| Second Quarter |
$ | 5.26 | $ | 3.53 | ||||
| Third Quarter |
$ | 5.59 | $ | 3.91 | ||||
| Fourth Quarter |
$ | 3.98 | $ | 2.98 | ||||
As of February 22, 2011, there were approximately 77 record holders of our common stock.
Issuer Purchases of Equity Securities
We repurchase shares of our common stock under our stock repurchase program announced on October 29, 2008. Under the stock repurchase program, we were authorized to use up to $30 million to repurchase shares of our outstanding common stock. We may repurchase shares in the open market or through privately negotiated transactions. The timing and actual number of shares repurchased depends upon market conditions and other factors, in accordance with SEC requirements.
During 2010, we entered into agreements pursuant to SEC Rule 10b5-1 pursuant to which we authorized a third-party broker to purchase shares on our behalf during our normal blackout periods in accordance with predetermined trading instructions. In addition, we may repurchase shares of our common stock under the guidelines of SEC Rule 10b-18.
During the fourth quarter of 2010, we did not repurchase any shares of our common stock.
24
Table of Contents
Stock Performance Graph
The graph below shows a comparison of the cumulative total stockholder return on our common stock with the cumulative total return on the S&P 500 Index and the Philadelphia Semiconductor Index over the period from December 31, 2005 until December 31, 2010. The graph assumes $100 invested at the indicated starting date in our common stock and in each of the market indices, with the reinvestment of all dividends. Prices and stockholder returns over the indicated periods should not be considered indicative of future stock prices or stockholder returns.
Comparison of Cumulative Total Return
From December 31, 2005 to December 31, 2010
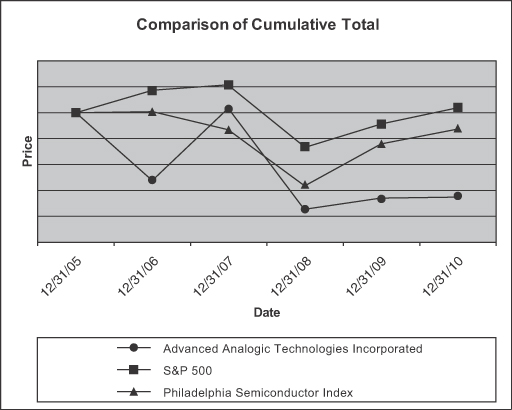
Dividend Policy
We have never declared or paid any cash dividends on our capital stock and we do not currently intend to pay any cash dividends on our common stock. We expect to retain future earnings, if any, to fund the development and growth of our business. Any future determination to pay dividends on our common stock will be, subject to applicable law, at the discretion of our board of directors and will depend upon, among other factors, our results of operations, financial condition, capital requirements and contractual restrictions.
Recent Sales of Unregistered Securities
None.
25
Table of Contents
| ITEM 6. | SELECTED FINANCIAL DATA |
The following table sets forth our selected consolidated financial data for the years ended December 31, 2010, 2009, 2008, 2007 and 2006. You should read the following table in conjunction with the consolidated financial statements and related notes contained elsewhere in this report on Form 10-K. Operating results for any year are not necessarily indicative of results to be expected for any future periods.
| Years Ended December 31, | ||||||||||||||||||||
| (in thousands, except per share amounts) |
2010 | 2009 | 2008 | 2007 | 2006 | |||||||||||||||
| Consolidated Statements of Operations Data |
||||||||||||||||||||
| NET REVENUE |
$ | 94,061 | $ | 86,512 | $ | 90,339 | $ | 109,610 | $ | 81,161 | ||||||||||
| Cost of revenue (including stock-based compensation of $325, $309, $428, $317 and $274 in 2010, 2009, 2008, 2007 and 2006, respectively) |
51,760 | 44,686 | 46,805 | 50,969 | 34,562 | |||||||||||||||
| GROSS PROFIT |
42,301 | 41,826 | 43,534 | 58,641 | 46,599 | |||||||||||||||
| OPERATING EXPENSES: |
||||||||||||||||||||
| Research and development (including stock-based compensation of $2,438, $3,163, $3,533, $2,878 and $2,459 in 2010, 2009, 2008, 2007 and 2006, respectively) |
30,326 | 27,468 | 30,579 | 31,103 | 23,828 | |||||||||||||||
| Sales, general and administrative (including stock-based compensation of $2,813, $3,456, $3,860, $4,145 and $3,558 in 2010, 2009, 2008, 2007 and 2006, respectively) |
25,053 | 24,132 | 25,446 | 26,057 | 22,358 | |||||||||||||||
| Patent litigation |
1,495 | 3,045 | 1,751 | 3,793 | 8,536 | |||||||||||||||
| Total operating expenses |
56,874 | 54,645 | 57,776 | 60,953 | 54,722 | |||||||||||||||
| LOSS FROM OPERATIONS |
(14,573 | ) | (12,819 | ) | (14,242 | ) | (2,312 | ) | (8,123 | ) | ||||||||||
| INTEREST AND OTHER INCOME: |
||||||||||||||||||||
| Interest and investment income |
271 | 902 | 3,124 | 5,599 | 5,823 | |||||||||||||||
| Other income (expense), net |
(201 | ) | 13 | (449 | ) | (529 | ) | (72 | ) | |||||||||||
| Total interest and other income, net |
70 | 915 | 2,675 | 5,070 | 5,751 | |||||||||||||||
| INCOME (LOSS) BEFORE INCOME TAXES |
(14,503 | ) | (11,904 | ) | (11,567 | ) | 2,758 | (2,372 | ) | |||||||||||
| PROVISION FOR (BENEFIT FROM) INCOME TAXES |
(1,751 | ) | 769 | 8,507 | 1,272 | (196 | ) | |||||||||||||
| NET INCOME (LOSS) |
$ | (12,752 | ) | $ | (12,673 | ) | $ | (20,074 | ) | $ | 1,486 | $ | (2,176 | ) | ||||||
| NET INCOME (LOSS) PER SHARE: |
||||||||||||||||||||
| Basic |
$ | (0.30 | ) | $ | (0.29 | ) | $ | (0.44 | ) | $ | 0.03 | $ | (0.05 | ) | ||||||
| Diluted |
$ | (0.30 | ) | $ | (0.29 | ) | $ | (0.44 | ) | $ | 0.03 | $ | (0.05 | ) | ||||||
| WEIGHTED AVERAGE SHARES USED IN NET INCOME (LOSS) PER SHARE CALCULATION: |
||||||||||||||||||||
| Basic |
42,561 | 42,973 | 45,535 | 44,728 | 43,477 | |||||||||||||||
| Diluted |
42,561 | 42,973 | 45,535 | 47,007 | 43,477 | |||||||||||||||
26
Table of Contents
| December 31, | ||||||||||||||||||||
| (in thousands) |
2010 | 2009 | 2008 | 2007 | 2006 | |||||||||||||||
| Consolidated Balance Sheet Data |
||||||||||||||||||||
| Cash and cash equivalents |
$ | 37,158 | $ | 36,120 | $ | 52,094 | $ | 53,779 | $ | 58,121 | ||||||||||
| Working capital |
100,283 | 112,423 | 118,840 | 127,768 | 115,914 | |||||||||||||||
| Total assets |
138,822 | 147,144 | 153,255 | 176,612 | 161,252 | |||||||||||||||
| Total stockholders’ equity |
122,362 | 132,050 | 141,234 | 157,398 | 145,991 | |||||||||||||||
| ITEM 7. | MANAGEMENT’S DISCUSSION AND ANALYSIS OF FINANCIAL CONDITION AND RESULTS OF OPERATIONS |
The following discussion should be read in conjunction with the consolidated financial statements and related notes which appear elsewhere in this report on Form 10-K. This discussion contains forward-looking statements that involve risks and uncertainties. Please see “Forward-Looking Statements” for a discussion of uncertainties, risks and assumptions associated with these statements. Our actual results could differ materially from those anticipated in these forward-looking statements as a result of various factors, including those discussed below and elsewhere in this report on Form 10-K, particularly under the heading “Risk Factors.”
Overview
We are a supplier of power management semiconductors for consumer, communications and computing electronic devices such as wireless handsets, notebook and tablet computers, smartphones, camera phones, digital cameras, personal media players, Bluetooth headphones and accessories, digital TVs, set top boxes and displays.
Through our “Total Power Management” approach, we offer a broad range of products that support multiple applications, features, and services across a diverse set of electronic devices. We target our design efforts on proprietary products, which at the time we introduce them offer characteristics that differentiate them from those offered by our competitors and which we believe are likely to generate high-volume demand from multiple customers.
We currently offer a portfolio of approximately 800 power management products comprising power management application-specific standard products, or ASSPs, and selected general-purpose analog integrated circuits (“ICs”), in single-chip, multi-chip and chip-scale packages. We sell directly to original equipment manufacturers, or OEMs, including Samsung Electronics Co., Ltd. and LG Electronics, Inc. and other large brands in the Mobile and TV space. We sell through distributors to original design manufacturers, or ODMs, to contract manufacturers, and to other system designers, including USI Corporation, Flextronics and Foxconn Electronics, Inc. We also do extensive partnering with system providers for reference design based sales like those associated with Broadcom chipsets for Apple, Dell and HP and Qualcomm for their WCDMA platforms.
We were incorporated in 1997 and commenced operations in 1998. From 1998 to 2000, we were primarily involved in developing our technology, recruiting personnel and raising capital. Since 2001, we have focused on delivering products for what we believe to be large and high-growth market opportunities. However, we operate in the semiconductor industry, which is cyclical and has experienced significant fluctuations, and our net revenue is impacted by these broad industry trends. We operate as a fabless semiconductor company, working with third parties to manufacture and assemble our ICs, rather than manufacturing them ourselves. This business model has enabled us to reduce our capital expenditures and fixed costs, while focusing our engineering and design resources on our core strengths. We believe this model also reduces the impact on our business of seasonality, cyclicality and fluctuations in demand.
We currently derive a significant portion of our net revenue from sales of our Charge Pump product family, which is primarily used for driving white LED backlighting of small color displays in portable applications. We are currently diversifying our business and R&D efforts into new applications within our existing markets. Our
27
Table of Contents
growth strategy involves three elements, to maintain net revenue in our existing markets and applications, to penetrate new applications in existing markets such as battery charging in cell phones, and to selectively enter totally new markets such as high definition televisions. We also believe energy conservation and “green” products will become increasingly important growth opportunities for power management semiconductors in the future.
Our patented ModularBCD wafer fabrication process technology expands our capability to develop high performance power solutions addressing these new markets and applications with products including higher-voltage and higher-current DC-DC switching voltage regulators, over-voltage protected lithium-ion battery chargers and multi-voltage power system-on-a-chip or PowerSOC solutions. Since the introduction of our ModularBCD technology in 2006, the net revenue derived from sales of ModularBCD technology based products has increased and represented 30% of overall 2010 net revenue. We believe that our net revenue and market diversification may occur gradually and over time, requiring several years to fully realize.
In addition to our patented process technologies, we continue to aggressively pursue inventing and patenting new innovations in circuit design and design methodologies such as novel switching regulators and battery chargers, in package design to expand our system integration capability, and in power system architecture to improve overall performance, power efficiency, heat dissipation and reliability in the applications we serve.
Critical Accounting Policies and Estimates
Our discussion and analysis of our financial condition and results of operations are based upon our consolidated financial statements, which have been prepared in accordance with United States generally accepted accounting principles. The preparation of these financial statements requires us to make estimates and judgments that affect the reported amounts of assets, liabilities, net revenue and expenses, as well as the disclosure of contingent assets and liabilities. On an on-going basis, we evaluate our estimates, including those related to revenue recognition, inventory valuation, stock-based compensation, income taxes and goodwill. We base our estimates on historical experience and on various other assumptions that are believed to be reasonable under the circumstances, the results of which form the basis for making judgments about the carrying values of assets and liabilities that are not readily apparent from other sources. Actual results may differ significantly from these estimates under different assumptions or conditions which may adversely affect our results of operations and/or our financial position. We discuss the development and selection of the critical accounting estimates with the audit committee of our board of directors on a quarterly basis, and the audit committee has reviewed our disclosure relating to them in this annual report on Form 10-K.
We believe the following critical accounting policies affect our more significant judgments and estimates used in the preparation of our consolidated financial statements.
Revenue Recognition
In accordance with generally accepted accounting principles, we recognize revenues once all of the following four basic revenue recognition criteria have been met: (1) persuasive evidence of an arrangement exists; (2) delivery has occurred or services have been rendered; (3) the fee is fixed or determinable; and (4) collectibility is reasonably assured. Criteria (1) and (2) are met upon receipt of purchase orders or signing of contracts and upon transfer of title which generally occurs at the time of shipment. Determination of criteria (3) and (4) is based on management’s judgment regarding the determinability of the fees charged for products delivered and the collectibility of those fees. If changes in conditions cause management to determine these criteria are not met for certain future transactions, revenues recognized for any reporting period could decline.
A large portion of our sales is made through distribution arrangements with third parties. These arrangements include stock rotation rights that generally permit the return of up to 5% of the previous three months’ purchases. We generally accept these returns quarterly. We record estimated returns at the time of
28
Table of Contents
shipment. Our normal payment term with our distributors is 30 days from the invoice date. Certain of our distributor arrangements include the possibility of sales price rebates on specified products. At the time of shipment we recognize revenue, estimate the total sales price rebate and reserve for those pricing rebates. We also defer revenue related to sales to certain distributors for which we are unable to reasonably estimate returns and recognize revenues from these distributors upon their subsequent resale to their customers.
We make estimates of potential future returns and sales allowances related to current period product revenue. We analyze historical return rates and changes in customer demand when evaluating the adequacy of returns and sales allowances. Although we believe we have a reasonable basis for our estimates, such estimates may differ from actual returns and sales allowances. These differences may materially impact reported net revenue and amounts ultimately collected on accounts receivable.
Inventory Valuation
We value our inventory at the lower of the actual cost of our inventory or its current estimated market value. We write down inventory for obsolescence or unmarketable inventories based upon assumptions about future demand and market conditions. Because of the cyclicality of the market in which we operate, inventory levels, obsolescence of technology and product life cycles, we generally write down finished goods inventory for product that is over twelve months old. Additionally, we generally write down inventory in excess of nine months’ forecasted product demand to its net realizable value, which we determined to be appropriate given our historical experience and industry practice. Actual demand and market conditions may be lower than those that we project and this difference could have a material adverse effect on our gross margins should inventory write-downs beyond those initially recorded become necessary. Alternatively, should actual demand and market conditions be more favorable than those we estimated at the time of such a write-down, our gross margins could be favorably impacted in future periods.
Stock-Based Compensation
Stock-based compensation expense for all share-based payment awards including stock options and restricted stock units is based on the grant date fair value of the award. The fair value of the award that is ultimately expected to vest is recognized as expense on a straight-line basis over the requisite service period, which is generally the vesting period. The expense is reduced by a forfeiture rate to derive the portion of the award expected to vest. The forfeiture rate is determined at the time of grant and revised, if necessary, in subsequent periods if actual forfeitures differ from those estimates.
The grant date fair value of our stock options was calculated using the Black-Scholes option pricing model. The Black-Scholes option pricing model requires the use of highly subjective assumptions which determine the fair value of stock options, including the price volatility of the underlying stock and the stock option’s expected term. The expected term of our stock options represents the estimated weighted-average period that the stock options are expected to remain outstanding. Beginning in 2010, to determine the expected term, we estimate future employee exercise behavior by considering our historical option exercise and post-vest cancellation experience as well as the contractual term of our stock option grants. We base our expected volatility assumption on our daily historical volatility data over a period commensurate with the expected term. Due to the low volume of the traded options on our common stock and because the term of traded options was much shorter than the expected term of our stock options, implied volatility was not included in the valuation of options granted during 2010. Prior to 2010, due to the limited history of trading since our initial public offering in 2005, our expected term and volatility assumptions were based in part on the volatility and expected term data of a group of peer companies. The risk-free interest rate used to value our stock options approximates the interest rate of a zero-coupon Treasury bond with a maturity date that approximates the expected term of the stock option grant. The dividend yield is based on our history and expectation of dividend payouts. We have never declared or paid any cash dividends on common stock, and we do not anticipate paying cash dividends in the foreseeable future.
29
Table of Contents
If any of the assumptions used in the Black-Scholes model change significantly, stock-based compensation expense may differ materially in the future from amounts recorded in the current period. Further, to the extent that we revise our estimated forfeiture rate in the future, our stock-based compensation expense could be materially impacted in the quarter of revision, as well as in the following quarters.
See Note 5—Stock Based Compensation to the consolidated financial statements for additional information.
Accounting for Income Taxes
In accordance with generally accepted accounting principles, we determine our deferred tax assets and liabilities based upon the difference between the financial statement and tax bases of our assets and liabilities using tax rates in effect for the year in which we expect the differences to affect taxable income. The tax consequences of most events recognized in the current year’s financial statements are included in determining income taxes currently payable. However, because tax laws and financial accounting standards differ in their recognition and measurement of assets, liabilities, equity, net revenue, expenses, gains and losses, differences arise between the amount of taxable income and pre-tax financial income for a year and between the tax bases of assets or liabilities and their reported amounts in our financial statements. Because we assume that the reported amounts of assets and liabilities will be recovered and settled, respectively, a difference between the tax basis of an asset or a liability and its reported amount in the balance sheet will result in a taxable or a deductible amount in some future years when the related liabilities are settled or the reported amounts of the assets are recovered, which gives rise to a deferred tax asset or liability.
In preparing our consolidated financial statements, we assess the likelihood that our deferred tax assets will be realized from future taxable income. We establish a valuation allowance if we determine that it is more likely than not that some portion of the deferred tax assets will not be realized. Our ability to realize our deferred tax assets depends on our ability to generate sufficient taxable income within the carryback or carryforward periods provided for in the tax law for each applicable tax jurisdiction. We consider the following possible sources of taxable income when assessing the realization of our deferred tax assets:
| • | Future reversals of existing taxable temporary differences; |
| • | Future taxable income exclusive of reversing temporary differences and carryforwards; |
| • | Taxable income in prior carryback years; and |
| • | Tax-planning strategies. |
We conclude that a valuation allowance is required when there is significant negative evidence which is objective and verifiable, such as cumulative losses in recent years. We utilize a rolling three years of actual results as our primary measure of cumulative losses in recent years. As of December 31, 2010 and 2009, we concluded that a full valuation allowance against our United States deferred tax assets was required. The deferred tax asset valuation allowance was $21.3 million and $10.1 million as of December 31, 2010 and 2009, respectively.
Changes in the valuation allowance, when recorded, are included in our consolidated statements of operations as a provision for (benefit from) income taxes. We exercise significant judgment in determining our provisions for income taxes, our deferred tax assets and liabilities and our future taxable income for purposes of assessing our ability to utilize any future tax benefit from our deferred tax assets.
During May 2005, we implemented an international structure. We transitioned a certain portion of our logistics, order entry, purchasing and billing functions to our office in Macau, which is in closer geographic proximity to our suppliers and customers. Our corporate headquarters remains in the United States. In connection with this transition, we have implemented cost-sharing and license arrangements with our wholly-owned British Virgin Islands subsidiary, with which our wholly-owned Macau subsidiary has implemented a similar licensing
30
Table of Contents
arrangement to develop and license intellectual property. Pursuant to these arrangements, our British Virgin Islands and Macau subsidiaries have the non-exclusive rights to manufacture, market and distribute our products in certain geographic markets. Furthermore, our Macau subsidiary is authorized to contract with third parties for the manufacture, test and assembly of our products. As a result of these changes, we expect the percentage of our consolidated pre-tax income represented by our foreign operations to continue to increase and exceed the domestic percentage.
We recognize the tax benefit from uncertain tax positions on the income tax return based on a two-step process. The first step is to determine if it is more likely than not that a tax position will be sustained on examination by the taxing authorities, based on the technical merits of the position. The second step is to estimate and measure the tax benefit to be recognized in the financial statements based on the largest benefit that has a greater than 50% likelihood of being realized upon ultimate settlement.
The estimates used in the accounting for income tax expense involve significant judgment by management. Tax positions that fail to qualify for initial recognition are recognized in the first subsequent interim period that they meet the more likely than not standard or when they are resolved through negotiation or litigation with factual interpretation, judgment and certainty. Tax laws and regulations themselves are complex and are subject to change as a result of changes in fiscal policy, changes in legislation, evolution of regulations and court filings. Therefore, the actual liability for US or foreign taxes may be materially different from our estimates, which could result in the need to record additional tax liabilities or potentially to reverse previously recorded tax liabilities.
Goodwill
Goodwill represents the excess of the purchase price over the fair value of the net tangible and identifiable intangible assets acquired in a business combination. Goodwill is not subject to amortization. We evaluate goodwill for impairment, at a minimum, on an annual basis as of September 30th and whenever events and changes in circumstances suggest that the carrying amount may not be recoverable.
The carrying value of our goodwill was $16.1 million as of December 31, 2010 and 2009. The carrying value of our goodwill may not be recoverable due to factors indicating a decrease in the value of the Company, such as a decline in stock price and market capitalization, reduced estimates of future cash flows and slower growth rates in our industry. Estimates of future cash flows are based in-part on an updated long-term financial outlook of our operations. However, actual performance in the near-term or long-term could be materially different from these forecasts, which could impact future estimates. For example, a significant decline in our stock price and/or market capitalization may result in goodwill impairment. In addition, the other assumptions made by us may change in future periods as they are based on overall market conditions and/or comparable company data. A change in the assumptions used to determine if goodwill is impaired may result in a charge to earnings in our financial statements during a period in which an impairment of our goodwill is determined to exist, which may negatively impact our results of operations.
The goodwill impairment evaluation is a two-step process and is performed at the reporting unit level. Because we have one reporting unit, we assess goodwill for impairment at the entity level. The first step (“Step 1”) is performed by comparing the reporting unit’s carrying amount, including goodwill, to the fair value of the reporting unit. The fair value of the reporting unit is estimated using a combination of: (1) the Transaction Approach, (2) the Income Approach, and (3) the Market Approach. Using the Transaction Approach, we estimate the fair value of the reporting unit by adding to our market capitalization a control premium. The estimated control premium is based on observable transactions involving control premiums paid in recent acquisitions of comparable companies. Using the Income Approach, we use the long-term financial outlook of our operations and make certain assumptions, including a discount rate and a long-term growth rate, to determine the fair value of the reporting unit based on future cash flows that we expect to generate. Under the Market Approach, we identify comparable companies’ data and make certain assumptions including revenue multiples, to determine the fair value based on how the market values comparable companies. We place the highest weighting on the fair
31
Table of Contents
value derived by the Transaction Approach, as we consider quoted prices in active markets as the best evidence of fair value. If the carrying amount of the reporting unit exceeds its fair value, goodwill is considered impaired and a second step (“Step 2”) is performed to measure the amount of impairment loss, if any. Step 2 is performed by calculating the implied fair value of goodwill and comparing the implied fair value to the carrying amount of goodwill. If the implied fair value of goodwill is lower than its carrying amount, an impairment loss is recognized equal to the difference.
We performed our annual goodwill impairment analysis as of September 30, 2010. As part of Step 1, we performed a sensitivity analysis by preparing our Income Approach using a range of discount rates and long-term growth rates. We analyzed the results of the Income Approach and noted that changing the significant assumptions used would not have changed our Step 1 conclusion in that the fair value of the reporting unit exceeded the carrying amount in all cases. Under the Market Approach, we performed a sensitivity analysis using a range of revenue multiples, from which we selected an amount from the lower end of the range. Had we used a less conservative revenue multiple in our Market Approach, a higher fair value would have resulted. As such, a change in the Market Approach assumptions would not have changed management’s Step 1 conclusion. For the Transaction Approach, we used a control premium from the low end of the range of recent control premiums identified. As such, if we had used a higher control premium, a higher fair value would have resulted and would not have changed management’s Step 1 conclusion. As a result of our annual goodwill impairment analysis performed as of September 30, 2010, we determined that goodwill was not impaired.
Results of Operations
The following table sets forth our historical operating results, as a percentage of net revenue for the periods indicated:
| Year Ended December 31, | ||||||||||||
| 2010 | 2009 | 2008 | ||||||||||
| NET REVENUE |
100.0 | % | 100.0 | % | 100.0 | % | ||||||
| Cost of revenue |
55.0 | 51.7 | 51.8 | |||||||||
| GROSS PROFIT |
45.0 | 48.3 | 48.2 | |||||||||
| OPERATING EXPENSES: |
||||||||||||
| Research and development |
32.2 | 31.8 | 33.8 | |||||||||
| Sales, general and administrative |
26.6 | 27.9 | 28.2 | |||||||||
| Patent litigation |
1.6 | 3.5 | 1.9 | |||||||||
| Total operating expenses |
60.4 | 63.2 | 63.9 | |||||||||
| LOSS FROM OPERATIONS |
(15.5 | ) | (14.9 | ) | (15.7 | ) | ||||||
| INTEREST AND OTHER INCOME: |
||||||||||||
| Interest and investment income |
0.3 | 1.1 | 3.5 | |||||||||
| Other income (expense), net |
(0.2 | ) | 0.0 | (0.5 | ) | |||||||
| Total interest and other income, net |
0.1 | 1.1 | 3.0 | |||||||||
| LOSS BEFORE INCOME TAXES |
(15.4 | ) | (13.8 | ) | (12.8 | ) | ||||||
| PROVISION FOR (BENEFIT FROM) INCOME TAXES |
(1.9 | ) | 0.9 | 9.4 | ||||||||
| NET LOSS |
(13.6 | )% | (14.7 | )% | (22.2 | )% | ||||||
32
Table of Contents
Comparison of the Years Ended December 31, 2010, 2009 and 2008
Net Revenue
The following table illustrates our net revenue by our principal product families:
| Year Ended December 31, | ||||||||||||||||||||||||
| 2010 | 2009 | 2008 | ||||||||||||||||||||||
| Amount | Percent of Net Revenue |
Amount | Percent of Net Revenue |
Amount | Percent of Net Revenue |
|||||||||||||||||||
| (dollar amounts in thousands) | ||||||||||||||||||||||||
| Display and Lighting Solutions |
$ | 54,526 | 58 | % | $ | 56,874 | 66 | % | $ | 54,190 | 60 | % | ||||||||||||
| Voltage Regulation and DC/DC Conversion |
19,824 | 21 | 12,720 | 15 | 16,862 | 19 | ||||||||||||||||||
| Interface and Power Management |
13,366 | 14 | 12,147 | 14 | 16,516 | 18 | ||||||||||||||||||
| Battery Management |
6,345 | 7 | 4,771 | 5 | 2,771 | 3 | ||||||||||||||||||
| Total |
$ | 94,061 | 100 | % | $ | 86,512 | 100 | % | $ | 90,339 | 100 | % | ||||||||||||
Our net revenue consists of sales of our power management semiconductor products, net of sales discounts, sales returns and distributor stock rotation allowances and incentives. All of our sales are denominated in US dollars.
Our net revenue for 2010 increased by $7.5 million or 9% compared to 2009 primarily due to new customer penetration in the computing market. Sales of our Voltage Regulation and DC/DC Conversion product family increased during 2010 primarily due to our continued efforts to grow and diversify our product offerings. Total unit shipments in 2010 increased by 21% compared to 2009, while average selling prices decreased by approximately 10%.
Geographically, our sales in Taiwan increased by $14.4 million, or 175%, in 2010 compared to 2009 due to higher demand and expansion in our handset business. Our sales in China increased by $3.2 million, or 19%, due to new customer penetration in the computing market. Our sales in Japan increased by $1.3 million, or 156%, in 2010 compared to 2009 due to higher demand and new distributor sales. These increases were partially offset by a $10.9 million, or 19% decrease in sales in Korea due to lower demand.
Our net revenue for 2009 decreased $3.8 million or 4% compared to 2008 due to lower demand for our Voltage Regulation and DC/DC Conversion and Interface and Power Management products, partially offset by higher sales of our Display and Lighting and Battery Management products. Total unit shipments in 2009 increased by 8% compared to 2008, while average selling prices decreased by 11%.
Geographically, our sales in Taiwan decreased by $5.8 million in 2009 compared to 2008 due to lower demand from two customers and our termination of one distributor during 2009. These decreases were partially offset by a $3.1 million increase in sales in China in 2009 compared to 2008 due to higher demand.
Gross Profit
Gross profit is the difference between net revenue and cost of revenue, and gross margin percentage represents gross profit as a percentage of net revenue. Cost of revenue consists primarily of cost of processed silicon wafers, costs associated with assembly, test and shipping of our production ICs, cost of personnel associated with manufacturing support and quality assurance and occupancy costs associated with our manufacturing support activities.
33
Table of Contents
| Year Ended December 31, |
Increase (Decrease) |
|||||||||||||||
| 2010 | 2009 | |||||||||||||||
| (dollar amounts in thousands) | ||||||||||||||||
| Net revenue |
$ | 94,061 | $ | 86,512 | $ | 7,549 | 9 | % | ||||||||
| Cost of revenue |
51,760 | 44,686 | 7,074 | 16 | % | |||||||||||
| Gross profit |
$ | 42,301 | $ | 41,826 | $ | 475 | 1 | % | ||||||||
| Gross margin percentage |
45.0 | % | 48.3 | % | (3.3 | )% | ||||||||||
Our gross margin percentage decreased 3.3% for 2010 compared to 2009 primarily due to decreased average selling prices and unfavorable product mix.
During 2010, our gross inventory write-down was approximately $3.2 million, partially offset by the sale of $1.9 million of previously written down inventory.
| Year Ended December 31, |
Increase (Decrease) |
|||||||||||||||
| 2009 | 2008 | |||||||||||||||
| (dollar amounts in thousands) | ||||||||||||||||
| Net revenue |
$ | 86,512 | $ | 90,339 | $ | (3,827 | ) | (4 | )% | |||||||
| Cost of revenue |
44,686 | 46,805 | (2,119 | ) | (5 | )% | ||||||||||
| Gross profit |
$ | 41,826 | $ | 43,534 | $ | (1,708 | ) | (4 | )% | |||||||
| Gross margin percentage |
48.3 | % | 48.2 | % | 0.1 | % | ||||||||||
Our gross margin percentage was relatively unchanged during 2009 compared to 2008. During 2009, decreases in excess and obsolete inventory charges and intangible asset amortization were offset by unfavorable product mix and lower average selling prices.
During 2009, our gross inventory write-down was approximately $3.6 million, partially offset by the sale of $2.4 million of previously written down inventory. During 2008, our gross inventory write-down was approximately $4.3 million, partially offset by the sale of $1.7 million of previously written down inventory.
Research and Development
Research and development expenses consist primarily of employee and contractor compensation, bonuses paid to employees for development of patentable designs under our patent award program and other performance bonuses, expenses for new product development and testing, expenses for process development, occupancy costs of research and development personnel, depreciation on research and development related equipment, and prototype costs for new products not yet released to production. We include expenses associated with new package development, engineering wafer lots and new test program developments in research and development expenses. We also include expenses associated with new product concept and definition and the preparation and filing of patents and other intellectual property in research and development expenses. We anticipate that we will continue to invest significant amounts in research and development activities to pursue and develop new products, processes, devices, packages and intellectual property.
| Year Ended December 31, |
Increase (Decrease) |
|||||||||||||||
| 2010 | 2009 | |||||||||||||||
| (dollar amounts in thousands) | ||||||||||||||||
| Research and development |
$ | 30,326 | $ | 27,468 | $ | 2,858 | 10.4 | % | ||||||||
| % of net revenue |
32.2 | % | 31.8 | % | 0.4 | % | ||||||||||
34
Table of Contents
Research and development expenses for 2010 increased by $2.9 million as compared to 2009 primarily due to a $1.9 million increase in payroll and payroll related expenses, a $0.7 million increase due to higher outside service expenses, a $0.6 million increase in engineering wafer and mask expenses and $0.3 million of restructuring expenses recorded in connection with our reduction in headcount during the third quarter of 2010. These increases were partially offset by a $0.7 million decrease in stock-based compensation expense.
| Year Ended December 31, |
Increase (Decrease) |
|||||||||||||||
| 2009 | 2008 | |||||||||||||||
| (dollar amounts in thousands) | ||||||||||||||||
| Research and development |
$ | 27,468 | $ | 30,579 | $ | (3,111 | ) | (10.2 | )% | |||||||
| % of net revenue |
31.8 | % | 33.8 | % | (2.0 | )% | ||||||||||
Research and development expenses for fiscal 2009 decreased as compared to 2008 primarily due to a $1.7 million decrease in payroll and payroll related expenses, a $0.7 million decrease in facilities, IT and operation support expenses, a $0.4 million decrease in stock-based compensation expense and a $0.3 million decrease due to the one-time write-off of in-process research and development costs recorded in 2008 related to our acquisition of Elite Micro Devices. The decrease in payroll and payroll related expenses in 2009 compared to 2008 resulted from lower headcount due to our December 2008 reduction in workforce and other cost reduction measures.
Sales, General and Administrative
Sales expenses consist primarily of employee and contractor compensation, sales performance and other bonuses, occupancy costs of sales personnel, sales commissions to independent sales representatives and promotional and marketing expenses. We include field application engineering support of sales activities in sales expense. General and administrative expenses consist primarily of employee and contractor compensation, bonuses, occupancy costs of general and administrative personnel, insurance and fees paid for professional services. Costs associated with audit and taxation, corporate governance and compliance, financial reporting and litigation matters are also general and administrative expenses.
| Year Ended December 31, |
Increase (Decrease) |
|||||||||||||||
| 2010 | 2009 | |||||||||||||||
| (dollar amounts in thousands) | ||||||||||||||||
| Sales, general and administrative |
$ | 25,053 | $ | 24,132 | $ | 921 | 3.8 | % | ||||||||
| % of net revenue |
26.6 | % | 27.9 | % | (1.3 | )% | ||||||||||
Sales, general and administrative expenses for 2010 increased by $0.9 million as compared to 2009 primarily due to a $1.1 million increase in travel expenses and a $0.3 million increase in payroll and related expenses, partially offset by a $0.6 million decrease in stock-based compensation expense.
| Year Ended December 31, |
Increase (Decrease) |
|||||||||||||||
| 2009 | 2008 | |||||||||||||||
| (dollar amounts in thousands) | ||||||||||||||||
| Sales, general and administrative |
$ | 24,132 | $ | 25,446 | $ | (1,314 | ) | (5.2 | )% | |||||||
| % of net revenue |
27.9 | % | 28.2 | % | (0.3 | )% | ||||||||||
Sales, general and administrative expenses for 2009 decreased as compared to 2008 primarily due to a $0.8 million decrease in audit and tax related expenses, a $0.4 million decrease in stock-based compensation expense, a $0.3 million decrease in travel expenses and a $0.2 million decrease in facility-related and equipment repair and maintenance expenses. These decreases were partially offset by a $0.5 million increase in legal and consulting expenses.
35
Table of Contents
Patent Litigation
| Year Ended December 31, |
Increase (Decrease) |
|||||||||||||||
| 2010 | 2009 | |||||||||||||||
| (dollar amounts in thousands) | ||||||||||||||||
| Patent litigation |
$ | 1,495 | $ | 3,045 | $ | (1,550 | ) | (50.9 | )% | |||||||
| % of net revenue |
1.6 | % | 3.5 | % | (1.9 | )% | ||||||||||
| Year Ended December 31, |
Increase (Decrease) |
|||||||||||||||
| 2009 | 2008 | |||||||||||||||
| (dollar amounts in thousands) | ||||||||||||||||
| Patent litigation |
$ | 3,045 | $ | 1,751 | $ | 1,294 | 73.9 | % | ||||||||
| % of net revenue |
3.5 | % | 1.9 | % | 1.6 | % | ||||||||||
Patent litigation expenses for the above periods fluctuated based on the level of activity in our patent infringement cases. We believe that we will continue to incur patent litigation expenses in future years. For a description of our litigation, please see Item 3—Legal Proceedings in Part I of this report for further details.
Total Interest and Other Income, net
Total interest and other income, net was $0.1 million, $0.9 million and $2.7 million for 2010, 2009 and 2008, respectively. Total interest and other income, net decreased by $0.8 million in 2010 compared to 2009 primarily as a result of a $0.6 million decrease in interest income due to lower average interest rates. Total interest and other income, net decreased by $1.8 million in 2009 compared to 2008 primarily as a result of a $2.2 million decrease in interest income due to lower average interest rates.
Provision For (Benefit from) Income Taxes
Provision for (benefit from) income taxes was $(1.8) million, $0.8 million and $8.5 million for fiscal 2010, 2009 and 2008, respectively. Our tax provision for 2010 was substantially lower compared to 2009 primarily due to a $2.8 million release of tax reserves associated with the settlement of the 2005 and 2006 IRS audit. Our tax provision for 2008 was substantially higher compared to 2009 primarily due to the recording of a valuation allowance against our US net deferred tax assets of $9.1 million offset by a decrease to the Company’s consolidated pre-tax income and the related tax effects in various jurisdictions.
Recently Issued Accounting Pronouncements
In December 2009, the Financial Accounting Standards Board (“FASB”) issued Accounting Standards Update 2009-17, Consolidations (Accounting Standards Codification Topic 810)—Improvements to Financial Reporting by Enterprises Involved with Variable Interest Entities (“ASU 2009-17”). ASU 2009-17 changes how a reporting entity determines when an entity that is insufficiently capitalized or is not controlled through voting (or similar rights) should be consolidated. The determination of whether a reporting entity is required to consolidate another entity is based on, among other things, the other entity’s purpose and design and the reporting entity’s ability to direct the activities of the other entity that most significantly impact the other entity’s economic performance. ASU 2009-17 also requires a reporting entity to provide additional disclosures about its involvement with variable interest entities and any significant changes in risk exposure due to that involvement. A reporting entity is required to disclose how its involvement with a variable interest entity affects the reporting entity’s financial statements. ASU 2009-17 became effective for our 2010 fiscal year and early application was not permitted. Our adoption of this new guidance did not have any impact on our consolidated results of operations or financial position.
36
Table of Contents
In January 2010, the FASB issued Accounting Standards Update No. 2010-06, Improving Disclosures about Fair Value Measurements (“ASU 2010-06”), which amends FASB Accounting Standards Codification Topic 820, Fair Value Measurements and Disclosures (“ASC 820”) to require various additional disclosures regarding fair value measurements and also clarify certain existing disclosure requirements. Under ASU 2010-06, we are required to: (1) disclose separately the amounts of significant transfers between Level 1 and Level 2 of the fair value hierarchy, (2) disclose activity in Level 3 fair value measurements including transfers into and out of Level 3 and the reasons for such transfers, and (3) present separately in its reconciliation of recurring Level 3 measurements information about purchases, sales, issuances and settlements on a gross basis. ASU 2010-06 does not change any accounting requirements, but is expected to have a significant effect on the disclosures of entities that measure assets and liabilities at fair value. The amendments prescribed by ASU 2010-06 became effective for our fiscal quarter ending March 31, 2010, except for the requirements described in item (3) above, which will be effective for our fiscal year beginning January 1, 2011. Our adoption of ASU 2010-06 items (1) and (2) did not impact our consolidated results of operations or financial position. We do not expect the adoption of ASU 2010-06 item (3) on January 1, 2011 to materially impact our consolidated results of operations or financial position.
Liquidity and Capital Resources
| Year Ended December 31, |
||||||||||||
| 2010 | 2009 | 2008 | ||||||||||
| (in thousands) | ||||||||||||
| Net cash (used in) provided by operating activities |
$ | (9,009 | ) | $ | (2,956 | ) | $ | 3,465 | ||||
| Net cash provided by (used in) investing activities |
12,717 | (9,715 | ) | (1,446 | ) | |||||||
| Net cash used in financing activities |
(2,706 | ) | (3,329 | ) | (3,627 | ) | ||||||
| Effect of exchange rate changes on cash and cash equivalents |
36 | 26 | (77 | ) | ||||||||
| Net increase (decrease) in cash and cash equivalents |
$ | 1,038 | $ | (15,974 | ) | $ | (1,685 | ) | ||||
Net Cash (Used in) Provided by Operating Activities
Cash used in operating activities in 2010 of $9.0 million was primarily attributable to the net loss of $12.8 million, adjusted for non-cash items included in net loss which included $5.6 million of stock-based compensation expense and $3.6 million of depreciation and amortization expense. Cash used in operating activities also included $4.3 million used to increase accounts receivable due to higher sales during the fourth quarter of 2010 compared to the fourth quarter of 2009, $4.2 million used to increase inventories due to higher sales and $2.1 million used to decrease income taxes payable. These cash outflows were partially offset by a $3.0 million increase in accounts payable primarily due to higher inventory purchases in 2010 compared to 2009 and a $1.2 million decrease in prepaid and other current assets primarily from the decrease in interest receivable.
Cash used in operating activities in 2009 of $3.0 million was primarily attributable to the net loss of $12.7 million, adjusted for non-cash items included in net loss which included $6.9 million of stock-based compensation expense and $2.0 million of depreciation and intangible asset amortization. Cash used in operating activities also included a $2.7 million cash outflow due to the increase in accounts receivable. The increase in accounts receivable in 2009 compared to 2008 was due to higher sales during the fourth quarter of 2009 compared to the fourth quarter of 2008. These cash outflows were partially offset by a $1.8 million decrease in inventories and a $1.6 million increase in accounts payable. The decrease in inventory balance was due to our management’s efforts to reduce inventory levels. The increase in accounts payable was due to higher production activity in the fourth quarter of 2009 compared to the fourth quarter of 2008.
37
Table of Contents
Net Cash Provided by (Used in) Investing Activities
Net cash provided by our investing activities was $12.7 million in 2010, primarily consisting of a net cash inflow of $13.9 million from sales and maturities of short-term investments and $1.4 million of proceeds from our sale of auction rate securities, partially offset by $2.6 million used to purchase property and equipment.
Net cash used in our investing activities was $9.7 million in 2009, primarily consisting of a net cash outflow of $8.6 million to purchase short-term investments and $1.0 million of property and equipment purchases.
Net Cash Used in Financing Activities
Net cash used in financing activities in 2010 was $2.7 million, primarily consisting of $3.6 million used for common stock repurchases, partially offset by $0.9 million of proceeds from exercises of common stock options.
Net cash used in financing activities in 2009 was $3.3 million, primarily consisting of $3.4 million used for common stock repurchases, partially offset by $0.1 million of proceeds from exercises of common stock options.
Liquidity
Our cash, cash equivalents and short-term investments balance was $87.4 million as of December 31, 2010. Based on our current business plan and revenue prospects, we believe our existing cash, cash equivalents and short-term investments balances will be sufficient to meet our anticipated cash needs, including working capital needs, planned capital expenditures and our discretionary share repurchase activity, for at least the next 12 months. Our liquidity is not impacted by our $1.6 million investments in auction rate securities, or ARS, which were not liquid as of December 31, 2010. See Item 7A, Quantitative and Qualitative Disclosures About Market Risk for more information regarding our ARS.
Our long-term future capital requirements will depend on many factors, including our level of revenues, the timing and extent of spending to support our product development efforts, the expansion of sales and marketing activities, the timing of our introductions of new products, the costs to ensure access to adequate manufacturing capacity, our level of acquisition activity or other strategic transactions, the continuing market acceptance of our products and the amount and intensity of our litigation activity. We could be required, or could elect, to seek additional funding through public or private equity or debt financing and additional funds may not be available on terms acceptable to us or at all.
Off Balance Sheet Arrangements
We have not entered into any transactions with unconsolidated entities whereby we have financial guarantees, subordinated retained interests, derivative instruments or other contingent arrangements that expose us to material continuing risks, contingent liabilities, or any other obligation under a variable interest in an unconsolidated entity that provides financing, liquidity, market risk or credit risk support to the Company.
Contractual Obligations
The following table describes our principal contractual cash obligations as of December 31, 2010:
| Total | 2011 | 2012 | 2013 | 2014 | 2015 | 2016 and beyond |
||||||||||||||||||||||
| (in thousands) | ||||||||||||||||||||||||||||
| Operating leases |
$ | 8,578 | $ | 2,543 | $ | 2,300 | $ | 1,512 | $ | 1,038 | $ | 1,063 | $ | 122 | ||||||||||||||
| Purchase commitments(1) |
8,950 | 8,950 | — | — | — | — | — | |||||||||||||||||||||
| Total contractual obligations |
$ | 17,528 | $ | 11,493 | $ | 2,300 | $ | 1,512 | $ | 1,038 | $ | 1,063 | $ | 122 | ||||||||||||||
| (1) | Purchase commitments consist primarily of our commitment to purchase wafers and assembly services. |
38
Table of Contents
In 2010, we renewed our office lease in Shanghai, China to accommodate our design team and sales personnel. The lease is effective from January 2011 through December 2015.
In 2009, we renewed our Hong Kong office lease to accommodate our development team. The lease is effective from November 2009 through October 2012.
In 2007, we entered into a sublease for our current principal executive offices, effective from September 2007 through March 2016, occupying 42,174 square feet in Santa Clara, California. This facility accommodates our principal engineering, technology, administrative and finance activities.
The table above excludes $2.2 million of liabilities associated with uncertain tax positions, as we are unable to reasonably estimate the ultimate amount or timing of settlement.
Common Stock Repurchases
On October 29, 2008, our board of directors authorized a program to repurchase shares of our outstanding common stock. Under the stock repurchase program, we are authorized to use up to $30 million to repurchase shares of our outstanding common stock. We may repurchase shares in the open market or through privately negotiated transactions. During 2010, we repurchased 1.0 million shares of our common stock for a total cost of $3.6 million. During 2009, we repurchased 1.1 million shares of our common stock for a total cost of $3.4 million. During 2008, we repurchased 2.1 million shares of our common stock for a total cost of $5.3 million. As of December 31, 2010, we had $17.7 million of remaining funds authorized to repurchase shares of our common stock under the stock repurchase program. Shares repurchased are accounted for as treasury stock and the total cost of shares repurchased is recorded as a reduction to stockholders’ equity.
| ITEM 7A. | QUANTITATIVE AND QUALITATIVE DISCLOSURES ABOUT MARKET RISK |
Interest Rate Risk
Our investment portfolio consists mainly of cash equivalents and short-term investments that are classified as available-for-sale investments. These investments are subject to market risk, primarily interest rate and credit risk. Our investments are managed by outside professional managers within investment guidelines set by us. Such guidelines include security type, credit quality and maturity and are intended to limit market risk by restricting the investments to high quality debt instruments with relatively short-term maturities.
The following table, which excludes cash, is a summary of cash equivalents, short-term and long-term investments classified as available-for-sale investments as of December 31, 2010:
| December 31, 2010 | ||||||||||||||||
| Amortized Cost |
Unrealized Gains |
Unrealized (Losses) |
Estimated Fair Value |
|||||||||||||
| (in thousands) | ||||||||||||||||
| Money market funds |
$ | 29,219 | $ | — | $ | — | $ | 29,219 | ||||||||
| US Treasury bills |
48,949 | 2 | (4 | ) | 48,947 | |||||||||||
| Municipal bonds |
1,298 | — | — | 1,298 | ||||||||||||
| Auction rate securities |
1,750 | — | (101 | ) | 1,649 | |||||||||||
| Total |
$ | 81,216 | $ | 2 | $ | (105 | ) | $ | 81,113 | |||||||
| Amounts included in: |
||||||||||||||||
| Cash and cash equivalents |
$ | 29,219 | $ | — | $ | — | $ | 29,219 | ||||||||
| Short-term investments |
50,247 | 2 | (4 | ) | 50,245 | |||||||||||
| Other assets |
1,750 | — | (101 | ) | 1,649 | |||||||||||
| Total |
$ | 81,216 | $ | 2 | $ | (105 | ) | $ | 81,113 | |||||||
39
Table of Contents
Most of our available-for-sale investments were in fixed rate, interest-earning instruments, which carry a degree of interest rate risk. Fixed rate securities may have their market value adversely impacted due to rising interest rates. However, in a declining interest rate environment such as the one we are currently experiencing, as short term investments mature, reinvestment occurs at less favorable market rates.
The following table presents the estimated change in the value of our investment portfolio, if interest rates were to change by the amounts indicated (in thousands):
| 100 Basis Point Rate Increase |
200 Basis Point Rate Increase |
100 Basis Point Rate Decrease |
200 Basis Point Rate Decrease |
|||||||||||||
| Total impact on our investment portfolio |
$ | (151 | ) | $ | (303 | ) | $ | 108 | $ | 144 | ||||||
We do not use derivative financial instruments in our investment portfolio.
As of December 31, 2010 and 2009, the fair value of our investments in auction rate securities, or ARS, was $1.6 million and $2.4 million, respectively.
During the year ended December 31, 2008, we entered into a settlement agreement with UBS under which we were granted ARS exchange rights, or the ARS Put Option, that provided us with the right, but not the obligation, to sell one of our ARS to UBS for the full $1.2 million par value during the period of June 30, 2010 to July 2, 2012. We elected fair value accounting for the ARS Put Option. Unrealized gains and losses related to the ARS Put Option were recognized in earnings. We exercised our ARS Put Option to sell this ARS to UBS on June 30, 2010. Following the exercise of the ARS Put Option, the sale of these ARS was settled and the $1.2 million of cash was received on July 1, 2010. During the year ended December 31, 2010, we also sold $0.2 million of our other ARS at par value through issuer redemptions. As we sold the ARS at par value, there was no resulting impact on the consolidated statements of operations for the year ended December 31, 2010.
Our ARS are interest-bearing investments in debt obligations collateralized by Federal Family Education Program student loans. We consider the ARS market to be inactive because auctions have failed to settle on their respective settlement dates since 2008. Further, the secondary market for ARS is inactive and there have been few issuer repurchases. We believe that available pricing information is not determinative of the ARS fair value. As such, we estimated the fair value of our ARS as of December 31, 2010 and December 31, 2009 using a discounted cash flow model.
To determine the fair value of our ARS, we estimated the contractual interest that will be earned during the expected time to liquidity, and discounted these cash flows to reflect liquidity and credit risk. The discount factor represents the current market conditions for instruments with similar credit quality, adjusted by 300 basis points to reflect the risk in the marketplace for the ARS. The following average assumptions were used to determine the ARS fair value as of December 31, 2010 and December 31, 2009:
| December 30, 2010 |
December 31, 2009 | |||
| Expected time to liquidity |
2 years | 2-4 years | ||
| Expected annual rate of return |
1.3% to 1.8% | 1.1% to 1.7% | ||
| Discount rate |
4.5% | 4.9% to 19.3% |
As of December 31, 2009, we used a discounted cash flow model to determine the fair value of the ARS Put Option. Using a discounted cash flow model, total cash flows expected to result from exercising the ARS Put Option were discounted based on our estimates of the likelihood of default by UBS and the expected time remaining until exercise. As of December 31, 2009, the Company used an expected term of six months and a 1.2% discount rate. The expected term assumption was based on when the Company planned to exercise the ARS Put Option.
40
Table of Contents
Foreign Currency Exchange Risk
Our sales outside the United States are transacted in US dollars. Accordingly, our sales are not generally impacted by foreign currency rate changes. With exception to our operations in Hong Kong and Macau, the primary functional currency of our offshore operations was the local currency, primarily the New Taiwan Dollar and the Chinese Yuan. To date, fluctuations in foreign currency exchange rates have not had a material impact on our results of operations.
| ITEM 8. | FINANCIAL STATEMENTS AND SUPPLEMENTARY DATA |
ADVANCED ANALOGIC TECHNOLOGIES INCORPORATED
CONSOLIDATED FINANCIAL STATEMENTS
Contents
| Page | ||||
| 42 | ||||
| 43 | ||||
| 44 | ||||
| Consolidated Statements of Stockholders’ Equity and Comprehensive Loss |
45 | |||
| 46 | ||||
| 47 | ||||
41
Table of Contents
REPORT OF INDEPENDENT REGISTERED PUBLIC ACCOUNTING FIRM
To the Board of Directors and Stockholders of
Advanced Analogic Technologies Incorporated
Santa Clara, California
We have audited the accompanying consolidated balance sheets of Advanced Analogic Technologies Incorporated and subsidiaries (the “Company”) as of December 31, 2010 and 2009, and the related consolidated statements of operations, stockholders’ equity and comprehensive loss, and cash flows for each of the three years in the period ended December 31, 2010. These financial statements are the responsibility of the Company’s management. Our responsibility is to express an opinion on these financial statements based on our audits.
We conducted our audits in accordance with the standards of the Public Company Accounting Oversight Board (United States). Those standards require that we plan and perform the audit to obtain reasonable assurance about whether the financial statements are free of material misstatement. An audit includes examining, on a test basis, evidence supporting the amounts and disclosures in the financial statements. An audit also includes assessing the accounting principles used and significant estimates made by management, as well as evaluating the overall financial statement presentation. We believe that our audits provide a reasonable basis for our opinion.
In our opinion, such consolidated financial statements present fairly, in all material respects, the financial position of the Company as of December 31, 2010 and 2009, and the results of its operations and its cash flows for each of the three years in the period ended December 31, 2010, in conformity with accounting principles generally accepted in the United States of America.
We have also audited, in accordance with the standards of the Public Company Accounting Oversight Board (United States), the Company’s internal control over financial reporting as of December 31, 2010, based on the criteria established in Internal Control—Integrated Framework issued by the Committee of Sponsoring Organizations of the Treadway Commission and our report dated February 24, 2011 expressed an unqualified opinion on the Company’s internal control over financial reporting.
| /S/ DELOITTE & TOUCHE LLP |
| San Jose, California |
| February 24, 2011 |
42
Table of Contents
ADVANCED ANALOGIC TECHNOLOGIES INCORPORATED
CONSOLIDATED BALANCE SHEETS
(in thousands, except share data)
| December 31, 2010 |
December 31, 2009 |
|||||||
| ASSETS |
||||||||
| CURRENT ASSETS |
||||||||
| Cash and cash equivalents |
$ | 37,158 | $ | 36,120 | ||||
| Short-term investments |
50,245 | 65,883 | ||||||
| Total cash, cash equivalents and short-term investments |
87,403 | 102,003 | ||||||
| Accounts receivable, net of allowances |
13,629 | 9,348 | ||||||
| Inventories |
11,390 | 7,234 | ||||||
| Prepaid expenses and other current assets |
1,803 | 4,291 | ||||||
| Total current assets |
114,225 | 122,876 | ||||||
| PROPERTY AND EQUIPMENT—NET |
5,061 | 4,607 | ||||||
| OTHER ASSETS |
3,182 | 3,110 | ||||||
| DEFERRED INCOME TAXES |
188 | 318 | ||||||
| INTANGIBLES—NET |
50 | 117 | ||||||
| GOODWILL |
16,116 | 16,116 | ||||||
| TOTAL ASSETS |
$ | 138,822 | $ | 147,144 | ||||
| LIABILITIES AND STOCKHOLDERS’ EQUITY |
||||||||
| CURRENT LIABILITIES |
||||||||
| Accounts payable |
$ | 9,315 | $ | 6,614 | ||||
| Accrued liabilities |
4,481 | 3,726 | ||||||
| Income tax payable |
146 | 114 | ||||||
| Total current liabilities |
13,942 | 10,454 | ||||||
| Long-term income tax payable |
2,221 | 4,365 | ||||||
| Other long term liabilities |
297 | 275 | ||||||
| Total liabilities |
16,460 | 15,094 | ||||||
| COMMITMENTS AND CONTINGENCIES (NOTES 7 and 12) |
||||||||
| STOCKHOLDERS’ EQUITY: |
||||||||
| Common stock, $0.001 par value—100,000,000 shares authorized; 46,551,317 shares issued and 42,357,876 shares outstanding in 2010; 46,127,931 shares issued and 42,934,490 shares outstanding in 2009 |
47 | 46 | ||||||
| Treasury stock, at cost; 4,193,441 and 3,193,441 shares as of December 31, 2010 and December 31, 2009, respectively |
(12,251 | ) | (8,649 | ) | ||||
| Additional paid-in capital |
188,921 | 182,457 | ||||||
| Accumulated other comprehensive loss |
(11 | ) | (212 | ) | ||||
| Accumulated deficit |
(54,344 | ) | (41,592 | ) | ||||
| Total stockholders’ equity |
122,362 | 132,050 | ||||||
| TOTAL LIABILITIES AND STOCKHOLDERS’ EQUITY |
$ | 138,822 | $ | 147,144 | ||||
See accompanying notes to consolidated financial statements.
43
Table of Contents
ADVANCED ANALOGIC TECHNOLOGIES INCORPORATED
CONSOLIDATED STATEMENTS OF OPERATIONS
(in thousands, except per share amount)
| Year Ended December 31, | ||||||||||||
| 2010 | 2009 | 2008 | ||||||||||
| NET REVENUE |
$ | 94,061 | $ | 86,512 | $ | 90,339 | ||||||
| Cost of revenue |
51,760 | 44,686 | 46,805 | |||||||||
| GROSS PROFIT |
42,301 | 41,826 | 43,534 | |||||||||
| OPERATING EXPENSES: |
||||||||||||
| Research and development |
30,326 | 27,468 | 30,579 | |||||||||
| Sales, general and administrative |
25,053 | 24,132 | 25,446 | |||||||||
| Patent litigation |
1,495 | 3,045 | 1,751 | |||||||||
| Total operating expenses |
56,874 | 54,645 | 57,776 | |||||||||
| LOSS FROM OPERATIONS |
(14,573 | ) | (12,819 | ) | (14,242 | ) | ||||||
| INTEREST AND OTHER INCOME: |
||||||||||||
| Interest and investment income |
271 | 902 | 3,124 | |||||||||
| Other income (expense), net |
(201 | ) | 13 | (449 | ) | |||||||
| Total interest and other income, net |
70 | 915 | 2,675 | |||||||||
| LOSS BEFORE INCOME TAXES |
(14,503 | ) | (11,904 | ) | (11,567 | ) | ||||||
| PROVISION FOR (BENEFIT FROM) INCOME TAXES |
(1,751 | ) | 769 | 8,507 | ||||||||
| NET LOSS |
$ | (12,752 | ) | $ | (12,673 | ) | $ | (20,074 | ) | |||
| NET LOSS PER SHARE: |
||||||||||||
| Basic |
$ | (0.30 | ) | $ | (0.29 | ) | $ | (0.44 | ) | |||
| Diluted |
$ | (0.30 | ) | $ | (0.29 | ) | $ | (0.44 | ) | |||
| WEIGHTED AVERAGE SHARES USED IN NET LOSS PER SHARE CALCULATION: |
||||||||||||
| Basic |
42,561 | 42,973 | 45,535 | |||||||||
| Diluted |
42,561 | 42,973 | 45,535 | |||||||||
See accompanying notes to consolidated financial statements.
44
Table of Contents
ADVANCED ANALOGIC TECHNOLOGIES INCORPORATED
CONSOLIDATED STATEMENTS OF STOCKHOLDERS’ EQUITY
AND COMPREHENSIVE LOSS
(in thousands)
|
Common Stock |
Treasury Stock |
Additional Paid-in Capital |
Deferred Stock-based Compen- sation |
Accumulated Other Compre- hensive loss |
Accumulated Deficit |
Total | ||||||||||||||||||||||||||||||
| Shares | Amount | Shares | Amount | |||||||||||||||||||||||||||||||||
| BALANCE—December 31, 2007 |
45,356 | $ | 45 | — | $ | — | $ | 167,364 | $ | (1,058 | ) | $ | (108 | ) | $ | (8,845 | ) | $ | 157,398 | |||||||||||||||||
| Net loss |
(20,074 | ) | (20,074 | ) | ||||||||||||||||||||||||||||||||
| Foreign currency translation adjustments |
78 | 78 | ||||||||||||||||||||||||||||||||||
| Net unrealized loss on available-for-sale investments, net of taxes |
(26 | ) | (26 | ) | ||||||||||||||||||||||||||||||||
| Comprehensive loss |
(20,022 | ) | ||||||||||||||||||||||||||||||||||
| Exercise of common stock options |
570 | 1 | 1,282 | 1,283 | ||||||||||||||||||||||||||||||||
| Tax benefit from stock option exercises |
9 | 9 | ||||||||||||||||||||||||||||||||||
| Stock-based compensation expense to employees |
6,774 | 6,774 | ||||||||||||||||||||||||||||||||||
| Vesting of restricted common stock |
12 | 12 | ||||||||||||||||||||||||||||||||||
| Reversal of deferred stock-based compensation due to employee terminations |
(27 | ) | 27 | — | ||||||||||||||||||||||||||||||||
| Amortization of deferred stock-based compensation |
1,031 | 1,031 | ||||||||||||||||||||||||||||||||||
| Stock-based compensation to non-employees |
11 | 11 | ||||||||||||||||||||||||||||||||||
| Common stock repurchases |
(2,075 | ) | (5,262 | ) | — | (5,262 | ) | |||||||||||||||||||||||||||||
| BALANCE—December 31, 2008 |
45,926 | $ | 46 | (2,075 | ) | $ | (5,262 | ) | $ | 175,425 | $ | — | $ | (56 | ) | $ | (28,919 | ) | $ | 141,234 | ||||||||||||||||
| Net loss |
(12,673 | ) | (12,673 | ) | ||||||||||||||||||||||||||||||||
| Foreign currency translation adjustments |
52 | 52 | ||||||||||||||||||||||||||||||||||
| Net unrealized loss on available-for-sale investments, net of taxes |
(208 | ) | (208 | ) | ||||||||||||||||||||||||||||||||
| Comprehensive loss |
(12,829 | ) | ||||||||||||||||||||||||||||||||||
| Exercise of common stock options |
202 | 99 | 99 | |||||||||||||||||||||||||||||||||
| Stock-based compensation expense to employees |
6,933 | 6,933 | ||||||||||||||||||||||||||||||||||
| Common stock repurchases |
(1,119 | ) | (3,387 | ) | — | (3,387 | ) | |||||||||||||||||||||||||||||
| BALANCE—December 31, 2009 |
46,128 | $ | 46 | (3,194 | ) | $ | (8,649 | ) | $ | 182,457 | $ | — | $ | (212 | ) | $ | (41,592 | ) | $ | 132,050 | ||||||||||||||||
| Net loss |
(12,752 | ) | (12,752 | ) | ||||||||||||||||||||||||||||||||
| Foreign currency translation adjustments |
173 | 173 | ||||||||||||||||||||||||||||||||||
| Net unrealized gain on available-for-sale investments, net of taxes |
28 | 28 | ||||||||||||||||||||||||||||||||||
| Comprehensive loss |
(12,551 | ) | ||||||||||||||||||||||||||||||||||
| Exercise of common stock options |
393 | 1 | 895 | 896 | ||||||||||||||||||||||||||||||||
| Vesting of restricted stock units |
31 | — | — | |||||||||||||||||||||||||||||||||
| Stock-based compensation expense to employees |
5,569 | 5,569 | ||||||||||||||||||||||||||||||||||
| Common stock repurchases |
(1,000 | ) | (3,602 | ) | — | (3,602 | ) | |||||||||||||||||||||||||||||
| BALANCE—December 31, 2010 |
46,552 | $ | 47 | (4,194 | ) | $ | (12,251 | ) | $ | 188,921 | $ | — | $ | (11 | ) | $ | (54,344 | ) | $ | 122,362 | ||||||||||||||||
See accompanying notes to consolidated financial statements.
45
Table of Contents
ADVANCED ANALOGIC TECHNOLOGIES INCORPORATED
CONSOLIDATED STATEMENTS OF CASH FLOWS
(in thousands)
| Year Ended December 31, | ||||||||||||
| 2010 | 2009 | 2008 | ||||||||||
| CASH FLOWS FROM OPERATING ACTIVITIES: |
||||||||||||
| Net loss |
$ | (12,752 | ) | $ | (12,673 | ) | $ | (20,074 | ) | |||
| Adjustments to reconcile net loss to net cash (used in) provided by operating activities: |
||||||||||||
| Depreciation and amortization |
3,637 | 2,002 | 3,004 | |||||||||
| Stock-based compensation |
5,576 | 6,928 | 7,821 | |||||||||
| Intangible asset impairment charge |
— | — | 755 | |||||||||
| Net unrealized (gain) loss on fair value securities |
(3 | ) | (65 | ) | 68 | |||||||
| Impairment loss on an investment in a privately-held company |
— | — | 508 | |||||||||
| Provision for (benefit from) doubtful accounts |
(28 | ) | 34 | 5 | ||||||||
| Tax benefit from stock option exercises |
— | — | 9 | |||||||||
| Excess tax benefit from employee equity incentive plans |
— | — | (504 | ) | ||||||||
| Loss (gain) on disposal of property and equipment |
31 | 88 | (6 | ) | ||||||||
| In-process research and development |
— | — | 255 | |||||||||
| Changes in operating assets and liabilities, net of effects from acquisitions: |
||||||||||||
| Accounts receivable |
(4,253 | ) | (2,728 | ) | 7,769 | |||||||
| Inventories |
(4,162 | ) | 1,786 | 3,193 | ||||||||
| Prepaid expenses and other current assets |
1,153 | (990 | ) | 207 | ||||||||
| Other assets |
(17 | ) | (30 | ) | 87 | |||||||
| Deferred income taxes |
130 | (55 | ) | 7,181 | ||||||||
| Accounts payable |
3,030 | 1,648 | (3,252 | ) | ||||||||
| Accrued expenses and other long-term liabilities |
761 | 73 | (4,554 | ) | ||||||||
| Income tax payable |
(2,112 | ) | 1,026 | 993 | ||||||||
| Net cash (used in) provided by operating activities |
(9,009 | ) | (2,956 | ) | 3,465 | |||||||
| CASH FLOWS FROM INVESTING ACTIVITIES: |
||||||||||||
| Purchases of property and equipment |
(2,561 | ) | (983 | ) | (2,351 | ) | ||||||
| Proceeds from sales of property and equipment |
— | — | 14 | |||||||||
| Purchases of short-term investments |
(117,929 | ) | (87,507 | ) | (66,850 | ) | ||||||
| Proceeds from sales and maturities of short-term investments |
131,837 | 78,900 | 66,838 | |||||||||
| Collection of short-term notes receivable (Note 2) |
— | — | 2,000 | |||||||||
| Purchases of long-term investments |
— | (175 | ) | (250 | ) | |||||||
| Proceeds from sales of auction rate securities |
1,400 | 50 | — | |||||||||
| Purchase of technology license |
(30 | ) | — | (200 | ) | |||||||
| Acquisitions, net of cash acquired |
— | — | (647 | ) | ||||||||
| Net cash provided by (used in) investing activities |
12,717 | (9,715 | ) | (1,446 | ) | |||||||
| CASH FLOWS FROM FINANCING ACTIVITIES: |
||||||||||||
| Proceeds from exercise of common stock options |
896 | 99 | 1,283 | |||||||||
| Excess tax benefit from employee equity incentive plans |
— | — | 504 | |||||||||
| Common stock repurchases |
(3,602 | ) | (3,387 | ) | (5,262 | ) | ||||||
| Principal payments on capital lease obligations |
— | (41 | ) | (152 | ) | |||||||
| Net cash used in financing activities |
(2,706 | ) | (3,329 | ) | (3,627 | ) | ||||||
| EFFECT OF EXCHANGE RATE CHANGES ON CASH AND CASH EQUIVALENTS |
36 | 26 | (77 | ) | ||||||||
| NET INCREASE (DECREASE) IN CASH AND CASH EQUIVALENTS |
1,038 | (15,974 | ) | (1,685 | ) | |||||||
| CASH AND CASH EQUIVALENTS—Beginning of period |
36,120 | 52,094 | 53,779 | |||||||||
| CASH AND CASH EQUIVALENTS—End of period |
$ | 37,158 | $ | 36,120 | $ | 52,094 | ||||||
| NONCASH INVESTING AND FINANCING ACTIVITIES: |
||||||||||||
| Vesting of restricted common stock |
$ | — | $ | — | $ | 12 | ||||||
| Increases (decreases) in accounts payable and accrued liabilities related to property and equipment purchases |
$ | (338 | ) | $ | 353 | $ | (234 | ) | ||||
| SUPPLEMENTAL DISCLOSURE OF CASH FLOW INFORMATION: |
||||||||||||
| Cash paid for interest |
$ | — | $ | 1 | $ | 13 | ||||||
| Cash paid for income taxes, net of refunds |
$ | 28 | $ | 159 | $ | 311 | ||||||
See accompanying notes to consolidated financial statements.
46
Table of Contents
ADVANCED ANALOGIC TECHNOLOGIES INCORPORATED AND SUBSIDIARIES
NOTES TO CONSOLIDATED FINANCIAL STATEMENTS
Years Ended December 31, 2010, 2009 and 2008
1. BUSINESS AND SIGNIFICANT ACCOUNTING POLICIES
Organization—Advanced Analogic Technologies Incorporated and its wholly-owned subsidiaries (the “Company”) was incorporated on August 21, 1997 in California and reincorporated on April 11, 2005 in Delaware. The Company focuses on addressing the application-specific power management needs of consumer, communications and computing electronic devices, such as wireless handsets, notebook and tablet computers, smartphones, camera phones, digital cameras, personal media players, Bluetooth headphones and accessories, digital TVs, set top boxes and displays. The Company focuses its design and marketing efforts on the application-specific power management needs of consumer communications and computing applications in these rapidly-evolving devices. Through the Company’s “Total Power Management” approach, the Company offers a broad range of products that support multiple applications, features and services across a diverse set of consumer electronic devices. The Company sells its products through its direct sales and applications support organization to original equipment manufacturers, original design manufacturers and contract electronics manufacturers primarily located in Asia, as well as through arrangements with distributors that fulfill third-party orders for our products. The Company is headquartered in Santa Clara, California, has development centers in Santa Clara, Shanghai, Hong Kong and Taiwan, and has Asia-based operations and logistics.
Principles of Consolidation—The consolidated financial statements include the accounts of the Company and its wholly-owned subsidiaries. All intercompany transactions and balances have been eliminated upon consolidation.
Estimates—The preparation of consolidated financial statements in conformity with accounting principles generally accepted in the United States (“GAAP”) requires management to make estimates and assumptions that affect reported amounts of assets, and liabilities, the disclosure of contingent assets and liabilities at the date of the financial statements, and the reported amounts of net revenue and expenses during the reporting period. Actual results could differ from those estimates.
Concentration of Credit Risk—Financial instruments which potentially subject the Company to concentrations of credit risk consist primarily of cash equivalents, short-term and long-term investments and receivables. As specified in the Company’s investment policy, the Company invests only in high-quality credit instruments with original or remaining maturities of one year or less and limits the amount invested with any one issuer. The Company performs ongoing credit evaluations of its customers’ financial condition and limits the amount of credit extended when deemed necessary. The Company’s top three customers accounted for a total of 64% and 78% of net accounts receivable at December 31, 2010 and December 31, 2009, respectively.
Cash Equivalents, Short-Term Investments and Long-Term Investments—Cash equivalents are highly liquid investments purchased with original or remaining maturities of 90 days or less at the time of purchase. Investments with original or remaining maturities of over 90 days at the time of purchase are generally classified as short-term investments and consist primarily of high grade debt securities. As of December 31, 2010 and 2009, the Company had investments in auction rate securities (“ARS”) that were classified as long-term investments within other assets on the consolidated balance sheet due to inactivity in the ARS market and the Company’s expectation that a successful auction will not occur for greater than one year.
Available-for-sale investments are carried at fair value with the related unrealized gains and losses included in accumulated other comprehensive loss, a separate component of stockholders’ equity. The Company records other-than temporary impairment charges for its available-for-sale investments when it intends to sell the securities, it is more likely than not that it will be required to sell the securities before a recovery to par value, or when it does not expect to recover the entire amortized cost basis of the securities. As of December 31, 2010, all
47
Table of Contents
ADVANCED ANALOGIC TECHNOLOGIES INCORPORATED AND SUBSIDIARIES
NOTES TO CONSOLIDATED FINANCIAL STATEMENTS—(Continued)
Years Ended December 31, 2010, 2009 and 2008
of the Company’s investments were classified as available-for-sale. As of December 31, 2009, all of the Company’s investments were classified as available-for-sale, with the exception of an investment in ARS that was accounted for as a trading security and an investment in ARS Exchange Rights (“ARS Put Option”) that was accounted for at fair value. Trading securities are carried at fair value with unrealized gains and losses recognized in earnings. The ARS classified as a trading security was classified within prepaid and other current assets on the Company’s consolidated balance sheet as of December 31, 2009 and was sold during the year ended December 31, 2010. See Note 2 – Investments for additional details about our investments.
The cost of securities sold is based on the specific identification method. Interest earned on securities is included in “interest and investment income” in the consolidated statements of operations.
Inventory—Inventory is stated at the lower of the actual cost (first-in, first-out method) of the inventory or its current market value. Inventory consists of work in process (principally processed wafers and products at third party assembly and test subcontractors) and finished goods. The Company generally writes down finished goods inventory that is over 12 months old, due to the cyclicality of the market in which the Company operates, inventory levels, obsolescence of technology and product life cycles. The Company writes down inventory in excess of nine months forecasted product demand to its net realizable value. During 2010, 2009 and 2008, the Company recorded inventory write-downs of $3.2 million, $3.6 million and $4.3 million, respectively, due to excess and obsolete inventory.
Property and Equipment—Property and equipment are recorded at cost less accumulated depreciation and amortization. Depreciation and amortization are computed using the straight-line method over estimated useful lives for office and test equipment of three to five years, computers and software of two to three years, and leasehold improvements over the shorter of the lease term or the estimated useful life of the improvement. Depreciation and amortization expense was $1.8 million, $1.7 million and $1.8 million for the years ended December 31, 2010, 2009 and 2008, respectively.
Goodwill—Goodwill represents the excess of the purchase price over the fair value of the net tangible and identifiable intangible assets acquired in a business combination. As of December 31, 2010 and 2009, the Company’s goodwill balance was $16.1 million, of which $15.7 million relates to the Company’s October 2006 acquisition of Analog Power Semiconductor Corporation and $0.4 million relates to the Company’s June 2008 acquisition of Elite Micro Devices, Inc. Goodwill is not subject to amortization and through December 31, 2010, no impairments have been recorded. The Company evaluates goodwill for impairment, at a minimum, on an annual basis as of September 30th and whenever events and changes in circumstances suggest that the carrying amount may not be recoverable.
The goodwill impairment evaluation is a two-step process and is performed at the reporting unit level. Because the Company has one reporting unit, it assesses goodwill for impairment at the entity level. The first step (“Step 1”) is performed by comparing the reporting unit’s carrying amount, including goodwill, to the fair value of the reporting unit. The fair value of the reporting unit is estimated using a combination of: (1) the Transaction Approach, (2) the Income Approach, and (3) the Market Approach. Using the Transaction Approach, the Company estimates the fair value of the reporting unit by adding to its market capitalization a control premium. The estimated control premium is based on observable transactions involving control premiums paid in recent acquisitions of comparable companies. Using the Income Approach, the Company uses the long-term financial outlook of its operations and makes certain assumptions, including a discount rate and a long-term growth rate, to determine the fair value of the reporting unit based on future cash flows that it expects to generate. Under the Market Approach, the Company identifies comparable companies’ data and
48
Table of Contents
ADVANCED ANALOGIC TECHNOLOGIES INCORPORATED AND SUBSIDIARIES
NOTES TO CONSOLIDATED FINANCIAL STATEMENTS—(Continued)
Years Ended December 31, 2010, 2009 and 2008
makes certain assumptions including revenue multiples, to determine the fair value based on how the market values comparable companies. The Company places the highest weighting on the fair value derived by the Transaction Approach, as it considers quoted prices in active markets as the best evidence of fair value. If the carrying amount of the reporting unit exceeds its fair value, goodwill is considered impaired and a second step (“Step 2”) is performed to measure the amount of impairment loss, if any. Step 2 is performed by calculating the implied fair value of goodwill and comparing the implied fair value to the carrying amount of goodwill. If the implied fair value of goodwill is lower than its carrying amount, an impairment loss is recognized equal to the difference.
The Company performed its annual goodwill impairment analysis as of September 30, 2010 and determined that goodwill was not impaired.
Long-Lived Assets (Excluding Goodwill)—The Company evaluates long-lived assets, including property and equipment and intangible assets, for impairment whenever events or changes in circumstances indicate that the carrying amount of an asset may not be recoverable. If impairment indicators are present, the Company determines whether the sum of the estimated undiscounted cash flows expected to result from the use of the asset and its eventual disposition are less than the asset’s carrying value. If the sum is less, the Company recognizes an impairment loss based on the excess of the carrying amount of the asset over its respective fair value. The fair value is estimated using discounted cash flows, appraisals, or other methods. The fair value of the asset then becomes the asset’s new carrying value, which the Company depreciates over the remaining estimated useful life of the asset.
The following table summarizes the Company’s intangible assets as of December 31, 2010 and 2009, respectively:
| Intangible Assets, Gross | Accumulated Amortization | Intangible Assets, Net | ||||||||||||||||||||||
| December 31, 2010 |
December 31, 2009 |
December 31, 2010 |
December 31, 2009 |
December 31, 2010 |
December 31, 2009 |
|||||||||||||||||||
| (in thousands) | ||||||||||||||||||||||||
| Core technology |
$ | 2,900 | $ | 2,900 | $ | (2,900 | ) | $ | (2,900 | ) | $ | — | $ | — | ||||||||||
| Customer relationships |
580 | 580 | (580 | ) | (580 | ) | — | — | ||||||||||||||||
| Technology license |
230 | 200 | (180 | ) | (83 | ) | 50 | 117 | ||||||||||||||||
| Total |
$ | 3,710 | $ | 3,680 | $ | (3,660 | ) | $ | (3,563 | ) | $ | 50 | $ | 117 | ||||||||||
The Company amortizes intangible assets on a straight-line basis over their estimated useful lives. Intangible asset amortization expense was $0.1 million, $0.3 million and $1.2 million for the years ended December 31, 2010, 2009 and 2008, respectively. Future amortization for these intangible assets is expected to be $0.1 million in 2011.
As of December 31, 2008, the Company determined that certain of its intangible assets were impaired due to a decrease in forecasted revenues associated with these intangible assets. The Company estimated the fair value of these intangible assets using a discounted cash flow model and determined their carrying amount exceeded the fair value by $0.8 million. Accordingly, the Company recorded a $0.8 million impairment charge during the quarter ended December 31, 2008. The impairment charge was recognized in the consolidated statements of operations for the year ended December 31, 2008 as a $0.6 million increase to cost of revenue and a $0.2 million increase to sales, general and administrative expense.
49
Table of Contents
ADVANCED ANALOGIC TECHNOLOGIES INCORPORATED AND SUBSIDIARIES
NOTES TO CONSOLIDATED FINANCIAL STATEMENTS—(Continued)
Years Ended December 31, 2010, 2009 and 2008
Revenue Recognition—In accordance with GAAP, the Company recognizes revenues once all of the following four basic revenue recognition criteria have been met: (1) persuasive evidence of an arrangement exists; (2) delivery has occurred or services have been rendered; (3) the fee is fixed or determinable; and (4) collectibility is reasonably assured. Criteria (1) and (2) are met upon receipt of purchase orders or signing of contracts and upon transfer of title which generally occurs at the time of shipment. Determination of criteria (3) and (4) is based on management’s judgment regarding the determinability of the fees charged for products delivered and the collectibility of those fees. If changes in conditions cause management to determine these criteria are not met for certain future transactions, revenues recognized for any reporting period could decline.
A large portion of the Company’s sales is made through distribution arrangements with third parties. These arrangements include stock rotation rights that generally permit the return of up to 5% of the previous three months’ net purchases. The Company generally accepts these returns quarterly. The Company records estimated returns at the time of shipment. The Company’s normal payment terms with its distributors are 30 days from invoice date. Certain of the Company’s distributor arrangements include the possibility of sales price rebates on specified products. At the time of shipment, the Company recognizes revenue, estimates the total sales price rebate and reserves for those pricing rebates. The Company has also deferred revenue of less than $0.1 million and $0.1 million as of December 31, 2010 and 2009, respectively, related to certain distributors for which the Company is unable to reasonably estimate returns, and recognizes revenues from these distributors upon their subsequent resale to their customers. The Company makes estimates of potential future returns and sales allowances related to current period product revenue.
Bad Debt Allowances—The Company records accounts receivable at the invoiced amount. The Company monitors the collectibility of accounts receivable primarily through review of the accounts receivable aging. When facts and circumstances indicate the collection of specific amounts or from specific customers is at risk, the Company assesses the impact on amounts recorded for bad debts and, if necessary, will record a charge in the period such determination is made. In addition, the Company reserves a percentage of its accounts receivable to various customers that are significantly aged based on its historical collection experience. During the year ended December 31, 2010, the Company wrote-off less than $0.1 million of accounts receivable. The Company did not write-off any accounts receivable during the years ended December 31, 2009 and 2008.
Warranty Costs—The Company provides a warranty against defects in materials and workmanship and will either repair the goods, provide replacement products at no charge to the customer or refund amounts to the customer for defective products. The Company records estimated warranty costs, based on historical experience by product, at the time it recognizes product revenues. A summary of the Company’s warranty liability, which is included in accrued liabilities on its consolidated balance sheets, is as follows:
| Year ended December 31, | ||||||||||||
| 2010 | 2009 | 2008 | ||||||||||
| (in thousands) | ||||||||||||
| Balance, at beginning of period |
$ | 105 | $ | 81 | $ | 101 | ||||||
| Accruals for sales in the period |
139 | 202 | 123 | |||||||||
| Costs incurred |
(155 | ) | (178 | ) | (143 | ) | ||||||
| Balance, at end of period |
$ | 89 | $ | 105 | $ | 81 | ||||||
Restructuring Costs—As of December 31, 2010 and 2009, the Company’s restructuring reserve balance was less than $0.1 million and $0, respectively. During the year ended December 31, 2010, the Company approved and communicated a restructuring plan for the purpose of reducing future operating expenses by terminating
50
Table of Contents
ADVANCED ANALOGIC TECHNOLOGIES INCORPORATED AND SUBSIDIARIES
NOTES TO CONSOLIDATED FINANCIAL STATEMENTS—(Continued)
Years Ended December 31, 2010, 2009 and 2008
approximately 15% of its US workforce. The Company recorded a restructuring charge of $0.5 million during the year ended December 31, 2010 for severance and insurance benefit payments to be made in connection with the reduction in force. Of the total restructuring expense for the year ended December 31, 2010, $0.4 million was recorded as research and development expense, $0.1 million was recorded as selling, general and administrative expense and less than $0.1 million was recorded as cost of revenue on the consolidated statement of operations. The Company paid $0.5 million related to this restructuring during the year ended December 31, 2010 and expects to pay the remaining balance of less than $0.1 million during the year ended December 31, 2011.
During the year ended December 31, 2008, a restructuring plan was approved for the purpose of reducing future operating expenses by eliminating approximately 12% of the Company’s global workforce. In addition to the reduction in force, the Company closed its offices in Stockholm, Sweden and Paris, France. The Company recorded a restructuring charge of $0.5 million during the year ended December 31, 2008 which consisted of $0.5 million of severance costs related to the reduction in force and less than $0.1 million for office closure and related costs. Of the total restructuring expense for the year ended December 31, 2008, $0.3 million was recorded as research and development expense, $0.2 million was recorded as selling, general and administrative expense and less than $0.1 million was recorded as cost of revenue on the consolidated statement of operations.
Advertising Costs—Advertising costs such as trade shows, promotions, public relations, and publications are expensed as incurred and are included in sales, general and administrative expenses. Advertising costs were $0.5 million, $0.6 million and $0.7 million for the years ended December 31, 2010, 2009 and 2008, respectively.
Research and Development—Research and development costs are expensed as incurred and included in operating expenses.
Income Taxes—In accordance with GAAP, the Company determines its deferred tax assets and liabilities based upon the difference between the financial statement and tax bases of its assets and liabilities using tax rates in effect for the year in which it expects the differences to affect taxable income. The tax consequences of most events recognized in the current year’s financial statements are included in determining income taxes currently payable. However, because tax laws and financial accounting standards differ in their recognition and measurement of assets, liabilities, equity, net revenue, expenses, gains and losses, differences arise between the amount of taxable income and pre-tax financial income for a year and between the tax bases of assets or liabilities and their reported amounts in the financial statements. Because the Company assumes that the reported amounts of assets and liabilities will be recovered and settled, respectively, a difference between the tax basis of an asset or a liability and its reported amount in the consolidated balance sheet will result in a taxable or a deductible amount in some future years when the related liabilities are settled or the reported amounts of the assets are recovered, which gives rise to a deferred tax asset or liability.
In preparing the Company’s consolidated financial statements, the Company assesses the likelihood that its deferred tax assets will be realized from future taxable income. The Company establishes a valuation allowance if it determines that it is more likely than not that some portion of the deferred tax assets will not be realized. The Company’s ability to realize its deferred tax assets depends on its ability to generate sufficient taxable income within the carryback or carryforward periods provided for in the tax law for each applicable tax jurisdiction. The Company considers the following possible sources of taxable income when assessing the realization of its deferred tax assets:
| • | Future reversals of existing taxable temporary differences; |
| • | Future taxable income exclusive of reversing temporary differences and carryforwards; |
51
Table of Contents
ADVANCED ANALOGIC TECHNOLOGIES INCORPORATED AND SUBSIDIARIES
NOTES TO CONSOLIDATED FINANCIAL STATEMENTS—(Continued)
Years Ended December 31, 2010, 2009 and 2008
| • | Taxable income in prior carryback years; and |
| • | Tax-planning strategies. |
The Company concludes that a valuation allowance is required when there is significant negative evidence which is objective and verifiable, such as cumulative losses in recent years. The Company utilizes a rolling three years of actual results as its primary measure of its cumulative losses in recent years. As of December 31, 2010 and 2009, the Company concluded that a full valuation allowance against its United States deferred tax assets was required. See Note 6—Income Taxes.
The Company estimates the provision for income taxes based on income before income taxes for each tax jurisdiction in which the Company has established operations. The Company does not provide incremental US income taxes on un-remitted foreign earnings taxed at rates less than the US tax rates as such earnings are considered permanently invested.
The Company recognizes the tax benefit from uncertain tax positions on the income tax return based on a two-step process. The first step is to determine if it is more likely than not that a tax position will be sustained on examination by the taxing authorities, based on the technical merits of the position. The second step is to estimate and measure the tax benefit to be recognized in the financial statements based on the largest benefit that has a greater than 50% likelihood of being realized upon ultimate settlement.
Stock-Based Compensation—Stock-based compensation expense for all share-based payment awards including stock options and restricted stock units is based on the grant date fair value of the award. The fair value of the award that is ultimately expected to vest is recognized as expense on a straight-line basis over the requisite service period, which is generally the vesting period. The expense is reduced by a forfeiture rate to derive the portion of the award expected to vest. The forfeiture rate is determined at the time of grant and revised, if necessary, in subsequent periods if actual forfeitures differ from those estimates.
The grant date fair value of the Company’s stock options was calculated using the Black-Scholes option pricing model. The Black-Scholes option pricing model requires the use of highly subjective assumptions which determine the fair value of stock options, including the price volatility of the underlying stock and the stock option’s expected term. The expected term of the Company’s stock options represents the estimated weighted-average period that the stock options are expected to remain outstanding. Beginning in 2010, to determine the expected term, the Company estimates future employee exercise behavior by considering its historical option exercise and post-vest cancellation experience as well as the contractual term of its stock option grants. The Company bases its expected volatility assumption on its daily historical volatility data over a period commensurate with the expected term. Due to the low volume of the traded options on the Company’s common stock and because the term of traded options was much shorter than the expected term of its stock options, implied volatility was not included in the valuation of options granted during 2010. Prior to 2010, due to the limited history of trading since the Company’s initial public offering in 2005, the Company’s expected term and volatility assumptions were based in part on the volatility and expected term data of a group of peer companies. The risk-free interest rate used to value the Company’s stock options approximates the interest rate of a zero-coupon Treasury bond with a maturity date that approximates the expected term of the stock option grant. The dividend yield is based on the Company’s history and expectation of dividend payouts. The Company has never declared or paid any cash dividends on common stock, and it does not anticipate paying cash dividends in the foreseeable future.
52
Table of Contents
ADVANCED ANALOGIC TECHNOLOGIES INCORPORATED AND SUBSIDIARIES
NOTES TO CONSOLIDATED FINANCIAL STATEMENTS—(Continued)
Years Ended December 31, 2010, 2009 and 2008
Stock-based compensation expense for the year ended December 31, 2008 included expense related to options granted prior to April 4, 2005 (the date of the Company’s initial filing of a registration statement for its eventual initial public offering). These options granted prior to April 4, 2005 were valued using the intrinsic value method and as of December 31, 2008, the Company had fully amortized the deferred stock based compensation related to these options. For further information regarding the Company’s valuation of share-based payment awards and stock-based compensation expense, see Note 5—Stock-based Compensation.
Foreign Currency—The functional currency of the Company’s Macau, Cayman and Hong Kong entities is the US dollar. Monetary assets and liabilities of these subsidiaries are remeasured into US dollars from the local currency at rates in effect at period end and nonmonetary assets and liabilities are remeasured at historical rates. Revenues and expenses for entities with US dollar functional currency are remeasured at average exchange rates in effect during each period. Foreign currency gains and losses from remeasurement are included within other income (expense), net on the Company’s consolidated statements of operations and were immaterial for the years ended December 31, 2010, 2009 and 2008. The Company recorded foreign currency gains (losses) of $(0.1) million, $(0.1) million and $0.1 million for the years ended December 31, 2010, 2009 and 2008, respectively. For the Company’s foreign subsidiaries which use the local currency as their functional currency, gains and losses from translation of the financial statements are reported as a component of accumulated other comprehensive loss on the consolidated balance sheets.
Comprehensive Loss—The Company reports, by major components and as a single total, the change in its stockholders’ equity during the period from non-owner sources. The unrealized gains and losses on available-for-sale investments and foreign currency translation adjustments are comprehensive loss items applicable to the Company. Statements of comprehensive loss have been included within the consolidated statements of stockholders’ equity.
Components of accumulated other comprehensive loss consisted of the following:
| December 31, | ||||||||
| (in thousands) |
2010 | 2009 | ||||||
| Foreign currency translation adjustments |
$ | 92 | $ | (79 | ) | |||
| Accumulated unrealized losses on available-for-sale investments, net of taxes |
(103 | ) | (133 | ) | ||||
| Total |
$ | (11 | ) | $ | (212 | ) | ||
Net Loss Per Share—The Company calculates basic net loss per share by dividing net loss by the weighted-average number of common shares outstanding during the period, excluding shares subject to repurchase. To determine diluted net loss per common share, the effect of potentially dilutive securities, which consist of common stock options, restricted stock units and common stock subject to repurchase, is calculated using the treasury stock method. The effect of potentially dilutive securities is excluded from the computation of diluted net loss per share when their effect is anti-dilutive. A reconciliation of shares used in the calculation of basic and diluted net loss per share is as follows:
53
Table of Contents
ADVANCED ANALOGIC TECHNOLOGIES INCORPORATED AND SUBSIDIARIES
NOTES TO CONSOLIDATED FINANCIAL STATEMENTS—(Continued)
Years Ended December 31, 2010, 2009 and 2008
| Year Ended December 31, | ||||||||||||
| 2010 | 2009 | 2008 | ||||||||||
| (in thousands) | ||||||||||||
| Weighted average common shares outstanding |
42,561 | 42,973 | 45,553 | |||||||||
| Weighted average shares subject to repurchase |
— | — | (18 | ) | ||||||||
| Shares used to calculate basic net loss per share |
42,561 | 42,973 | 45,535 | |||||||||
| Effect of dilutive securities: |
||||||||||||
| Common stock options |
— | — | — | |||||||||
| Restricted stock units |
— | — | — | |||||||||
| Dilutive potential common stock |
— | — | — | |||||||||
| Weighted average common shares outstanding, assuming dilution |
42,561 | 42,973 | 45,535 | |||||||||
In applying the treasury stock method, the Company excluded 8.8 million, 8.3 million and 8.1 million potentially dilutive securities for the years ended December 31, 2010, 2009 and 2008, respectively, because their effect was anti-dilutive.
Recently Issued Accounting Standards—In December 2009, the Financial Accounting Standards Board (“FASB”) issued Accounting Standards Update 2009-17, Consolidations (Accounting Standards Codification Topic 810)—Improvements to Financial Reporting by Enterprises Involved with Variable Interest Entities (“ASU 2009-17”). ASU 2009-17 changes how a reporting entity determines when an entity that is insufficiently capitalized or is not controlled through voting (or similar rights) should be consolidated. The determination of whether a reporting entity is required to consolidate another entity is based on, among other things, the other entity’s purpose and design and the reporting entity’s ability to direct the activities of the other entity that most significantly impact the other entity’s economic performance. ASU 2009-17 also requires a reporting entity to provide additional disclosures about its involvement with variable interest entities and any significant changes in risk exposure due to that involvement. A reporting entity is required to disclose how its involvement with a variable interest entity affects the reporting entity’s financial statements. ASU 2009-17 became effective for the Company’s 2010 fiscal year and early application was not permitted. The Company’s adoption of this new guidance did not have any impact on its consolidated results of operations or financial position.
In January 2010, the FASB issued Accounting Standards Update No. 2010-06, Improving Disclosures about Fair Value Measurements (“ASU 2010-06”), which amends FASB Accounting Standards Codification Topic 820, Fair Value Measurements and Disclosures (“ASC 820”) to require various additional disclosures regarding fair value measurements and also clarify certain existing disclosure requirements. Under ASU 2010-06, the Company is required to: (1) disclose separately the amounts of significant transfers between Level 1 and Level 2 of the fair value hierarchy, (2) disclose activity in Level 3 fair value measurements including transfers into and out of Level 3 and the reasons for such transfers, and (3) present separately in its reconciliation of recurring Level 3 measurements information about purchases, sales, issuances and settlements on a gross basis. ASU 2010-06 does not change any accounting requirements, but is expected to have a significant effect on the disclosures of entities that measure assets and liabilities at fair value. The amendments prescribed by ASU 2010-06 became effective for the Company’s fiscal quarter ending March 31, 2010, except for the requirements described in item (3) above, which will be effective for the Company’s fiscal year beginning January 1, 2011. The Company’s adoption of ASU 2010-06 items (1) and (2) did not impact its consolidated results of operations or financial position. The Company does not expect the adoption of ASU 2010-06 item (3) on January 1, 2011 to materially impact its consolidated results of operations or financial position.
54
Table of Contents
ADVANCED ANALOGIC TECHNOLOGIES INCORPORATED AND SUBSIDIARIES
NOTES TO CONSOLIDATED FINANCIAL STATEMENTS—(Continued)
Years Ended December 31, 2010, 2009 and 2008
2. INVESTMENTS
The following tables, which exclude cash, are a summary of cash equivalents, short-term and long-term investments classified as available-for-sale investments as of December 31, 2010 and 2009:
| December 31, 2010 | ||||||||||||||||
| Amortized Cost |
Unrealized Gains |
Unrealized (Losses) |
Estimated Fair Value |
|||||||||||||
| (in thousands) | ||||||||||||||||
| Money market funds |
$ | 29,219 | $ | — | $ | — | $ | 29,219 | ||||||||
| US Treasury bills |
48,949 | 2 | (4 | ) | 48,947 | |||||||||||
| Municipal bonds |
1,298 | — | — | 1,298 | ||||||||||||
| Auction rate securities |
1,750 | — | (101 | ) | 1,649 | |||||||||||
| Total |
$ | 81,216 | $ | 2 | $ | (105 | ) | $ | 81,113 | |||||||
| Amounts included in: |
||||||||||||||||
| Cash and cash equivalents |
$ | 29,219 | $ | — | $ | — | $ | 29,219 | ||||||||
| Short-term investments |
50,247 | 2 | (4 | ) | 50,245 | |||||||||||
| Other assets |
1,750 | — | (101 | ) | 1,649 | |||||||||||
| Total |
$ | 81,216 | $ | 2 | $ | (105 | ) | $ | 81,113 | |||||||
| December 31, 2009 | ||||||||||||||||
| Amortized Cost |
Unrealized Gains |
Unrealized (Losses) |
Estimated Fair Value |
|||||||||||||
| (in thousands) | ||||||||||||||||
| Money market funds |
$ | 15,964 | $ | — | $ | — | $ | 15,964 | ||||||||
| Municipal bonds |
65,129 | 13 | (23 | ) | 65,119 | |||||||||||
| US government agency bonds |
11,999 | 12 | — | 12,011 | ||||||||||||
| Auction rate securities |
1,950 | — | (125 | ) | 1,825 | |||||||||||
| Total |
$ | 95,042 | $ | 25 | $ | (148 | ) | $ | 94,919 | |||||||
| Amounts included in: |
||||||||||||||||
| Cash and cash equivalents |
$ | 27,213 | $ | — | $ | (2 | ) | $ | 27,211 | |||||||
| Short-term investments |
65,879 | 25 | (21 | ) | 65,883 | |||||||||||
| Other assets |
1,950 | — | (125 | ) | 1,825 | |||||||||||
| Total |
$ | 95,042 | $ | 25 | $ | (148 | ) | $ | 94,919 | |||||||
The maturities of the Company’s cash equivalents, short-term and long-term investments classified as available-for-sale are as follows:
| December 31, 2010 |
December 31, 2009 |
|||||||
| (in thousands) | ||||||||
| Due in one year or less |
$ | 79,464 | $ | 93,094 | ||||
| Due after one year through five years |
— | — | ||||||
| Due after 10 years |
1,649 | 1,825 | ||||||
| Total |
$ | 81,113 | $ | 94,919 | ||||
55
Table of Contents
ADVANCED ANALOGIC TECHNOLOGIES INCORPORATED AND SUBSIDIARIES
NOTES TO CONSOLIDATED FINANCIAL STATEMENTS—(Continued)
Years Ended December 31, 2010, 2009 and 2008
Fair Value Measurements
The Company’s financial assets are measured at fair value. Fair value is the price that would be received to sell an asset or paid to transfer a liability in an orderly transaction between market participants at the measurement date. Under generally accepted accounting principles, based on the observability of the inputs used in the valuation techniques, the Company is required to provide information according to a fair value hierarchy. The fair value hierarchy ranks the quality and reliability of the information used to determine fair values. Financial assets and liabilities carried at fair value will be classified and disclosed in one of the following three categories:
Level 1: Quoted prices (unadjusted) in active markets for identical assets or liabilities.
Level 2: Valuations based on observable inputs other than Level 1 prices such as quoted prices for similar assets or liabilities, quoted prices in markets that are not active, or model-derived valuations techniques for which all significant inputs are observable in the market or can be corroborated by, observable market data for substantially the full term of the assets or liabilities.
Level 3: Unobservable inputs that are not corroborated by market data. The inputs require significant management judgment or estimation.
The following tables, which exclude cash, present the fair value hierarchy of the Company’s financial assets measured at fair value as of December 31, 2010 and 2009:
| Fair Value Measurements as of December 31, 2010 Using: | ||||||||||||||||||||
| Carrying Amount |
Total Fair Value |
Quoted Prices in Active Markets for Identical Assets (Level 1) |
Significant Other Observable Inputs (Level 2) |
Significant Unobservable Inputs (Level 3) |
||||||||||||||||
| (in thousands) | ||||||||||||||||||||
| Available-for-sale investments: |
||||||||||||||||||||
| Money market funds |
$ | 29,219 | $ | 29,219 | $ | 29,219 | $ | — | $ | — | ||||||||||
| US Treasury bonds |
48,947 | 48,947 | 48,947 | — | — | |||||||||||||||
| Municipal bonds |
1,298 | 1,298 | — | 1,298 | — | |||||||||||||||
| Auction rate securities |
1,649 | 1,649 | — | — | 1,649 | |||||||||||||||
| Total |
$ | 81,113 | $ | 81,113 | $ | 78,166 | $ | 1,298 | $ | 1,649 | ||||||||||
| Amounts included in: |
||||||||||||||||||||
| Cash and cash equivalents |
$ | 29,219 | ||||||||||||||||||
| Short-term investments |
50,245 | |||||||||||||||||||
| Other assets |
1,649 | |||||||||||||||||||
| Total |
$ | 81,113 | ||||||||||||||||||
56
Table of Contents
ADVANCED ANALOGIC TECHNOLOGIES INCORPORATED AND SUBSIDIARIES
NOTES TO CONSOLIDATED FINANCIAL STATEMENTS—(Continued)
Years Ended December 31, 2010, 2009 and 2008
| Fair Value Measurements as of December 31, 2009 Using: | ||||||||||||||||||||
| Carrying Amount |
Total Fair Value |
Quoted Prices in Active Markets for Identical Assets (Level 1) |
Significant Other Observable Inputs (Level 2) |
Significant Unobservable Inputs (Level 3) |
||||||||||||||||
| (in thousands) | ||||||||||||||||||||
| Available-for-sale investments: |
||||||||||||||||||||
| Money market funds |
$ | 15,964 | $ | 15,964 | $ | 15,964 | $ | — | $ | — | ||||||||||
| Municipal bonds |
65,119 | 65,119 | — | 65,119 | — | |||||||||||||||
| US government agency bonds |
12,011 | 12,011 | — | 12,011 | — | |||||||||||||||
| Auction rate securities |
1,825 | 1,825 | — | — | 1,825 | |||||||||||||||
| Total |
$ | 94,919 | $ | 94,919 | $ | 15,964 | $ | 77,130 | $ | 1,825 | ||||||||||
| Other investments: |
||||||||||||||||||||
| Auction rate securities classified as trading securities |
$ | 593 | $ | 593 | $ | — | $ | — | $ | 593 | ||||||||||
| ARS put option |
604 | 604 | — | — | 604 | |||||||||||||||
| Total |
$ | 1,197 | $ | 1,197 | $ | — | $ | — | $ | 1,197 | ||||||||||
| Amounts included in: |
||||||||||||||||||||
| Cash and cash equivalents |
$ | 27,211 | ||||||||||||||||||
| Short-term investments |
65,883 | |||||||||||||||||||
| Prepaid expenses and other current assets |
1,197 | |||||||||||||||||||
| Other assets |
1,825 | |||||||||||||||||||
| Total |
$ | 96,116 | ||||||||||||||||||
57
Table of Contents
ADVANCED ANALOGIC TECHNOLOGIES INCORPORATED AND SUBSIDIARIES
NOTES TO CONSOLIDATED FINANCIAL STATEMENTS—(Continued)
Years Ended December 31, 2010, 2009 and 2008
The following tables provide a reconciliation of the beginning and ending balances for the financial assets as of December 31, 2010 and 2009 that were measured at fair value using unobservable inputs (Level 3):
| Fair Value Measurement Using Significant Unobservable Inputs (Level 3) |
||||||||
| Auction Rate Securities |
ARS Put Option |
|||||||
| Beginning balances as of December 31, 2009 |
$ | 2,418 | $ | 604 | ||||
| Unrealized gains included in accumulated other comprehensive loss |
24 | — | ||||||
| Unrealized gains (losses) recognized in earnings |
419 | (416 | ) | |||||
| Purchases, sales, issuances and settlements, net |
(1,212 | ) | (188 | ) | ||||
| Ending balances as of December 31, 2010 |
$ | 1,649 | $ | — | ||||
| The amount of total unrealized gains for the period included in accumulated other comprehensive loss attributable to assets still held at the reporting date |
$ | 24 | $ | — | ||||
| The amount of total unrealized gains (losses) for the period recognized in earnings attributable to assets still held at the reporting date |
$ | — | $ | — | ||||
| Fair Value Measurement Using Significant Unobservable Inputs (Level 3) |
||||||||
| Auction Rate Securities |
ARS Put Option |
|||||||
| Beginning balances as of December 31, 2008 |
$ | 2,553 | $ | 412 | ||||
| Unrealized gains included in accumulated other comprehensive loss |
42 | — | ||||||
| Unrealized gains (losses) recognized in earnings |
(127 | ) | 192 | |||||
| Purchases, sales, issuances and settlements, net |
(50 | ) | — | |||||
| Ending balances as of December 31, 2009 |
$ | 2,418 | $ | 604 | ||||
| The amount of total unrealized gains for the period included in accumulated other comprehensive loss attributable to assets still held at the reporting date |
$ | 42 | $ | — | ||||
| The amount of total unrealized gains (losses) for the period recognized in earnings attributable to assets still held at the reporting date |
$ | (127 | ) | $ | 192 | |||
58
Table of Contents
ADVANCED ANALOGIC TECHNOLOGIES INCORPORATED AND SUBSIDIARIES
NOTES TO CONSOLIDATED FINANCIAL STATEMENTS—(Continued)
Years Ended December 31, 2010, 2009 and 2008
Level 3 Financial Assets
As of December 31, 2010 and 2009, the fair value of the Company’s investments in auction rate securities (“ARS”) was $1.6 million and $2.4 million, respectively. The Company’s ARS are interest-bearing investments in debt obligations collateralized by Federal Family Education Program student loans. At the time of acquisition, these ARS were intended to provide liquidity via an auction process that resets the applicable interest rate at predetermined calendar intervals, allowing investors to either roll over their holdings or gain immediate liquidity by selling such interests at par. The monthly auctions historically provided a liquid market for these securities. However, due to uncertainties in the credit markets, auctions for the Company’s ARS have failed to settle on their respective settlement dates since 2008. Further, the secondary market for ARS is inactive and there have been few issuer repurchases. The Company does not currently consider the ARS to be liquid and will not be able to access these funds until a future auction of these investments is successful or a buyer is found outside the auction process.
During 2008, the Company made an election to transfer one of its ARS (with a face value of $1.2 million) from available-for-sale to trading securities. The election was made upon the Company entering into a settlement agreement with UBS under which it was granted ARS exchange rights (“ARS Put Option”) that provided it with the right, but not the obligation, to sell one of its ARS to UBS for the full $1.2 million par value during the period of June 30, 2010 to July 2, 2012. The Company exercised its ARS Put Option to sell these ARS to UBS on June 30, 2010. Following the exercise of the ARS Put Option, the sale of these ARS was settled and the $1.2 million of cash was received on July 1, 2010. During the year ended December 31, 2010, the Company also sold $0.2 million of its other ARS at par value through issuer redemptions.
For the year ended December 31, 2010, the fair value of the Company’s Level 3 assets decreased by $1.4 million primarily due to the sale of the ARS to UBS per the settlement agreement. As the Company sold the ARS at full par value, there was no resulting impact on the consolidated statement of operations for the year ended December 31, 2010.
Due to the ARS market being inactive, the Company believes that available pricing information is not determinative of the ARS fair value. As such, the Company estimated the fair value of its ARS as of December 31, 2010 and 2009 using a discounted cash flow model.
To determine the fair value of its ARS, the Company estimated the contractual interest that will be earned during the expected time to liquidity, and discounted these cash flows to reflect liquidity and credit risk. The discount factor represents the current market conditions for instruments with similar credit quality, adjusted by 300 basis points to reflect the risk in the marketplace for the ARS. The following average assumptions were used to determine the ARS fair value as of December 31, 2010 and 2009:
| December 30, 2010 |
December 31, 2009 | |||
| Expected time to liquidity |
2 years | 2 to 4 years | ||
| Expected annual rate of return |
1.3% to 1.8% | 1.1% to 1.7% | ||
| Discount rate |
4.5% | 4.9% to 19.3% |
As of December 31, 2009, the Company used a discounted cash flow model to determine the fair value of the ARS Put Option. Using a discounted cash flow model, total cash flows expected to result from exercising the ARS Put Option were discounted based on the Company’s estimates of the likelihood of default by UBS and the
59
Table of Contents
ADVANCED ANALOGIC TECHNOLOGIES INCORPORATED AND SUBSIDIARIES
NOTES TO CONSOLIDATED FINANCIAL STATEMENTS—(Continued)
Years Ended December 31, 2010, 2009 and 2008
expected time remaining until exercise. As of December 31, 2009, the Company used an expected term of six months and a 1.2% discount rate. The expected term assumption was based on when the Company planned to exercise the ARS Put Option.
Investment in a privately-held company
The Company’s investment portfolio included an investment in a privately-held company which develops programmable analog semiconductor devices. The balance of the Company’s investment in a privately-held company was $0.8 million as of December 31, 2010, and was included in other assets on the consolidated balance sheets. The investment consists of preferred stock and represents less than a 20% ownership interest. The investment previously included interest-bearing bridge loans which were converted to additional shares of preferred stock during the three months ended March 31, 2009. The Company accounts for this investment using the cost method.
To determine if impairment exists, the Company monitors the privately-held company’s revenue and earnings trends, relative to pre-defined milestones and overall business prospects; their general market conditions in the industry or geographic area, including adverse regulatory or economic changes; factors related to their ability to remain in business, such as their liquidity and the rate at which they are using cash; and their receipt of additional funding. The Company reviews this investment for impairment indicators on a quarterly basis.
During the year ended December 31, 2008, the Company identified impairment indicators related to this investment and recorded a $0.5 million other-than-temporary impairment loss. The impairment loss was included in interest and other expense on the consolidated statements of operations for the year ended December 31, 2008.
Promissory note
In 2007, the Company invested in a short-term promissory note from one of its vendors. The face value of this note was $2.0 million with zero stated interest rate. However, the Company received a total service discount of approximately $50,000 from this vendor in lieu of cash interest payments. The Company recorded interest income and service cost over the note term of six months to reflect the service discount received. The Company received the $2.0 million payment during the year ended December 31, 2008.
60
Table of Contents
ADVANCED ANALOGIC TECHNOLOGIES INCORPORATED AND SUBSIDIARIES
NOTES TO CONSOLIDATED FINANCIAL STATEMENTS—(Continued)
Years Ended December 31, 2010, 2009 and 2008
3. DETAILS OF CERTAIN BALANCE SHEET COMPONENTS
| December 31, | ||||||||
| 2010 | 2009 | |||||||
| (in thousands) | ||||||||
| Inventories |
||||||||
| Work in process |
$ | 5,204 | $ | 3,209 | ||||
| Finished goods |
6,186 | 4,025 | ||||||
| Total inventories |
$ | 11,390 | $ | 7,234 | ||||
| Property and equipment, net |
||||||||
| Computers and software |
$ | 5,588 | $ | 5,458 | ||||
| Office and test equipment |
8,918 | 7,439 | ||||||
| Leasehold improvements |
1,584 | 1,441 | ||||||
| 16,090 | 14,338 | |||||||
| Accumulated depreciation and amortization |
(11,029 | ) | (9,731 | ) | ||||
| Total property and equipment, net |
$ | 5,061 | $ | 4,607 | ||||
| Accrued liabilities |
||||||||
| Accrued payroll and benefits |
$ | 2,494 | $ | 1,645 | ||||
| Deferred revenue |
35 | 110 | ||||||
| Accrued legal and accounting services |
234 | 458 | ||||||
| Warranty reserve |
89 | 105 | ||||||
| Restructuring reserve |
37 | — | ||||||
| Accrued payables and other |
1,592 | 1,408 | ||||||
| Total accrued liabilities |
$ | 4,481 | $ | 3,726 | ||||
4. STOCK REPURCHASE PROGRAM
On October 29, 2008, the Company’s board of directors authorized a program to repurchase shares of the Company’s outstanding common stock. Under the stock repurchase program, the Company was authorized to use up to $30 million to repurchase shares of its outstanding common stock. The Company may repurchase shares in the open market or through privately negotiated transactions. The timing and actual number of shares repurchased will depend upon market conditions and other factors, in accordance with Securities and Exchange Commission requirements.
For the year ended December 31, 2010, the Company repurchased 1.0 million shares of its common stock for a total cost of $3.6 million. For the year ended December 31, 2009, the Company repurchased 1.1 million shares of its common stock for a total cost of $3.4 million. For the year ended December 31, 2008, the Company repurchased 2.1 million shares of its common stock for a total cost of $5.3 million. As of December 31, 2010, the Company had $17.7 million of remaining funds authorized to repurchase shares of its common stock under the stock repurchase program. Shares repurchased are accounted for as treasury stock and the total cost of shares repurchased is recorded as a reduction to stockholders’ equity.
61
Table of Contents
ADVANCED ANALOGIC TECHNOLOGIES INCORPORATED AND SUBSIDIARIES
NOTES TO CONSOLIDATED FINANCIAL STATEMENTS—(Continued)
Years Ended December 31, 2010, 2009 and 2008
5. STOCK-BASED COMPENSATION
2005 Equity Incentive Plan—The Company’s board of directors and stockholders approved the Company’s 2005 Equity Incentive Plan (the “2005 Plan”) in May 2005. The 2005 Plan replaced the Company’s 1998 Stock Plan (the “1998 Plan”) and became effective upon the completion of the Company’s initial public offering in August 2005. The 2005 Plan provides for the grant of incentive stock options, within the meaning of Section 422 of the Internal Revenue Code, to its employees and its parent and subsidiary corporations’ employees, and for the grant of nonstatutory stock options, restricted stock, restricted stock units (“RSU”), stock appreciation rights, performance units and performance shares to its employees, directors and consultants and its parent and subsidiary corporations’ employees and consultants. To date, awards granted under the 2005 Plan consist of stock options and RSU’s. Stock options and RSU’s generally vest over four years and expire in 10 years. As of December 31, 2010, 2.6 million shares were available for future grant under the 2005 Plan.
As of December 31, 2010, there were 9.0 million stock options outstanding, of which 1.4 million options were granted under the 1998 Plan. As a result of the approval of the 2005 Plan, no further grants can be made under the 1998 Plan and any 1998 Plan options that are forfeited or canceled are returned to the pool of shares available for future grant under the 2005 Plan. Upon exercise, the Company issues new shares of common stock.
A summary of stock option activity for the year ended December 31, 2010, and information regarding stock options outstanding, exercisable, and vested or expected to vest is as follows:
| Number of Shares |
Weighted Average Exercise Price Per Share |
Weighted Average Remaining Contractual Term in Years |
Aggregate Intrinsic Value |
|||||||||||||
| (in thousands, except per share amounts and terms) | ||||||||||||||||
| Outstanding as of December 31, 2009 |
9,456 | $ | 4.87 | |||||||||||||
| Granted |
1,110 | $ | 3.41 | |||||||||||||
| Exercised |
(393 | ) | $ | 2.29 | ||||||||||||
| Forfeited or expired |
(1,176 | ) | $ | 4.66 | ||||||||||||
| Outstanding as of December 31, 2010 |
8,997 | $ | 4.83 | 6.23 | $ | 7,135 | ||||||||||
| Vested and expected to vest as of December 31, 2010 |
8,644 | $ | 4.87 | 6.13 | $ | 6,932 | ||||||||||
| Exercisable as of December 31, 2010 |
6,171 | $ | 5.10 | 5.27 | $ | 5,561 | ||||||||||
The aggregate intrinsic value represents the difference between the Company’s closing stock price on December 31, 2010 and the option exercise price of the shares for stock options that were in the money, multiplied by the number of shares underlying such options.
The total intrinsic value of options exercised (i.e. the difference between the market price at exercise and the price paid by the employee to exercise the options) during 2010, 2009 and 2008 was $0.5 million, $0.6 million and $2.3 million, respectively. The total fair value of options vested during 2010, 2009 and 2008 was $5.1 million, $6.7 million and $5.5 million, respectively.
62
Table of Contents
ADVANCED ANALOGIC TECHNOLOGIES INCORPORATED AND SUBSIDIARIES
NOTES TO CONSOLIDATED FINANCIAL STATEMENTS—(Continued)
Years Ended December 31, 2010, 2009 and 2008
A summary of RSU activity for the year ended December 31, 2010 and information regarding RSU’s outstanding, vested and expected to vest is as follows:
| Number of Shares |
Weighted Average Grant Date Fair Value Per Share |
Weighted Average Remaining Contractual Term in Years |
Aggregate Intrinsic Value |
|||||||||||||
| (in thousands, except per share amounts and terms) | ||||||||||||||||
| Outstanding as of December 31, 2009 |
— | $ | — | |||||||||||||
| Granted |
975 | $ | 3.67 | |||||||||||||
| Vested |
(31 | ) | $ | 3.40 | ||||||||||||
| Forfeited or expired |
(9 | ) | $ | 3.86 | ||||||||||||
| Outstanding as of December 31, 2010 |
935 | $ | 3.67 | 1.88 | $ | 3,746 | ||||||||||
| Vested and expected to vest as of |
788 | $ | 3.67 | 1.77 | $ | 3,156 | ||||||||||
The total fair value of RSU’s vested in 2010 was $0.1 million compared to zero in 2009 and 2008.
Stock option valuation and stock-based compensation expense—The Company uses the Black-Scholes option pricing model to calculate the grant date fair value of an award. The Company used the following weighted average assumptions to calculate the fair values of options granted during the years presented:
| Year Ended December 31, | ||||||||||||
| 2010 | 2009 | 2008 | ||||||||||
| Volatility |
63 | % | 58 | % | 50 | % | ||||||
| Expected option term (in years) |
4.78 | 3.90 | 4.02 | |||||||||
| Risk free interest rate |
2.14 | % | 1.66 | % | 2.37 | % | ||||||
| Expected annual dividend yield |
0 | % | 0 | % | 0 | % | ||||||
The weighted average grant date fair value of options granted during the years 2010, 2009 and 2008 as determined using the Black Scholes pricing model was $1.82, $1.72 and $2.83, respectively.
On October 9, 2008, the Company accepted for exchange from eligible employees (excluding directors, consultants and all executives) options to purchase an aggregate of 1.8 million shares of the Company’s common stock, pursuant to a stock option exchange program (the “2008 Exchange Offer”), giving them the right to tender outstanding stock options that were granted between February 1, 2007 and July 1, 2008. The eligible options were cancelled as of October 9, 2008. The Company granted new options to purchase an equal number of shares of its common stock with an exercise price equal to the fair market value of the Company’s common stock on October 9, 2008, which was $3.08 per share, in exchange for the options cancelled in connection with the offer. These new options vest over four years at a rate of 25% after one year, starting on October 9, 2008, and 6.25% every three months thereafter. The Company calculated $1.5 million of incremental compensation cost related to the 2008 Exchange Offer. The incremental compensation cost combined with the unamortized cost related to the cancelled options is being amortized over the four year vesting period of the new options.
63
Table of Contents
ADVANCED ANALOGIC TECHNOLOGIES INCORPORATED AND SUBSIDIARIES
NOTES TO CONSOLIDATED FINANCIAL STATEMENTS—(Continued)
Years Ended December 31, 2010, 2009 and 2008
The following table summarizes stock-based compensation expense included in the Company’s consolidated statements of operations:
| Year Ended December 31, | ||||||||||||
| 2010 | 2009 | 2008 | ||||||||||
| (in thousands) | ||||||||||||
| Statement of operations classifications |
||||||||||||
| Cost of revenue |
$ | 325 | $ | 309 | $ | 428 | ||||||
| Research and development |
2,438 | 3,163 | 3,533 | |||||||||
| Sales, general and administrative |
2,813 | 3,456 | 3,860 | |||||||||
| Total stock-based compensation expense |
$ | 5,576 | $ | 6,928 | $ | 7,821 | ||||||
The related tax effect for stock-based compensation expense was zero for 2010, 2009 and 2008, as the Company had a full valuation allowance against its US deferred tax assets during these years.
During the year ended December 31, 2010, in connection with the departure of two of the Company’s officers, the Company recognized $0.4 million of stock-based compensation expense related to the modification of stock option agreements allowing for an extended post-termination exercise period and accelerated vesting of stock options as part of the separation and release agreements with these officers. During the year ended December 31, 2010, the Company also recognized $0.2 million of stock-based compensation expense for restricted stock units granted to the officers in connection with their departure.
During 2008, the Company issued nonstatutory stock options to non-employees. These options were issued for services provided by the non-employees and were immediately vested at the grant date. Accordingly, in 2008, the Company recorded $11,000 of expense associated with stock options granted to non-employees.
As of December 31, 2010, there was $8.6 million of total unrecognized compensation cost related to unvested stock options and RSU’s. This unrecognized stock-based compensation expense is expected to be recognized over a weighted average period of 2.8 years.
Deferred Stock Compensation—The Company accounted for its stock-based awards granted to employees prior to April 4, 2005, the date of the Company’s initial filing of a registration statement for its eventual initial public offering, using the intrinsic value method. For these options, the Company recorded deferred stock-based compensation equal to the intrinsic value, which represented the difference between the exercise price and deemed fair value of the Company’s common stock on the date of grant. The compensation was amortized to expense over the vesting period of the options, generally four years, using the straight-line method and was fully amortized as of December 31, 2008. Amortization of such deferred stock-based compensation, net of forfeitures, was $1.0 million for 2008.
64
Table of Contents
ADVANCED ANALOGIC TECHNOLOGIES INCORPORATED AND SUBSIDIARIES
NOTES TO CONSOLIDATED FINANCIAL STATEMENTS—(Continued)
Years Ended December 31, 2010, 2009 and 2008
6. INCOME TAXES
The components of the provision for (benefit from) income taxes are as follows:
| Year Ended December 31, | ||||||||||||
| 2010 | 2009 | 2008 | ||||||||||
| (in thousands) | ||||||||||||
| Current: |
||||||||||||
| Federal |
$ | (2,685 | ) | $ | 406 | $ | 1,263 | |||||
| State |
1 | 20 | 43 | |||||||||
| Foreign |
803 | 335 | 331 | |||||||||
| Total current tax |
(1,881 | ) | 761 | 1,637 | ||||||||
| Deferred: |
||||||||||||
| Federal |
— | — | 4,560 | |||||||||
| State |
— | — | 2,305 | |||||||||
| Foreign |
130 | 8 | 5 | |||||||||
| Total deferred |
130 | 8 | 6,870 | |||||||||
| Provision for income taxes |
$ | (1,751 | ) | $ | 769 | $ | 8,507 | |||||
The foreign and domestic components of loss before income taxes are as follows:
| Year Ended December 31, | ||||||||||||
| 2010 | 2009 | 2008 | ||||||||||
| (in thousands) | ||||||||||||
| United States |
$ | (18,487 | ) | $ | (11,080 | ) | $ | (3,117 | ) | |||
| Foreign |
3,984 | (824 | ) | (8,450 | ) | |||||||
| Loss before income taxes |
$ | (14,503 | ) | $ | (11,904 | ) | $ | (11,567 | ) | |||
The Company had no cumulative foreign earnings as of December 31, 2010. Any foreign earnings generated would be considered to be permanently reinvested in the Company’s foreign operations. If any earnings were remitted to the US, they would be subject to domestic and/or foreign taxes.
The effective tax rate differs from the applicable US statutory federal income tax rate for the years ended December 31, 2010, 2009 and 2008 as follows:
| Year Ended December 31, | ||||||||||||
| 2010 | 2009 | 2008 | ||||||||||
| U.S. statutory federal tax rate |
(34.0 | )% | (34.0 | )% | (34.0 | )% | ||||||
| State taxes, net of federal benefit |
(1.3 | ) | (1.6 | ) | (1.6 | ) | ||||||
| Foreign income taxed at higher (lower) rates |
(3.8 | ) | 27.7 | 35.2 | ||||||||
| Research and development credits |
— | (3.3 | ) | (11.5 | ) | |||||||
| Deferred stock-based compensation |
6.5 | 11.0 | 8.9 | |||||||||
| Change in Valuation Allowance |
36.9 | 6.1 | 78.3 | |||||||||
| Audit Settlement |
(19.2 | ) | — | — | ||||||||
| Other |
2.8 | 0.6 | (1.7 | ) | ||||||||
| Effective tax rate |
(12.1 | )% | 6.5 | % | 73.6 | % | ||||||
65
Table of Contents
ADVANCED ANALOGIC TECHNOLOGIES INCORPORATED AND SUBSIDIARIES
NOTES TO CONSOLIDATED FINANCIAL STATEMENTS—(Continued)
Years Ended December 31, 2010, 2009 and 2008
The components of deferred income taxes are as follows:
| December 31, | ||||||||
| 2010 | 2009 | |||||||
| (in thousands) | ||||||||
| Deferred tax assets, net of deferred tax liabilities: |
||||||||
| Net operating loss carryforwards |
$ | 7,631 | $ | 409 | ||||
| Research and business tax credits |
8,037 | 5,233 | ||||||
| Stock-based compensation |
4,509 | 3,812 | ||||||
| Accruals and reserves not currently deductible |
1,012 | 814 | ||||||
| Other |
255 | 150 | ||||||
| 21,444 | 10,418 | |||||||
| Valuation allowance |
(21,258 | ) | (10,109 | ) | ||||
| Total |
$ | 186 | $ | 309 | ||||
The Company assesses whether valuation allowances should be established against its deferred tax assets based on the consideration of all available evidence, both positive and negative, using a “more likely than not” standard. In making such judgments, significant weight is given to evidence that can be objectively verified.
As of December 31, 2010 and 2009, the Company’s operating results reflected a cumulative three-year loss. In assessing the realizability of its US deferred tax assets, the Company’s cumulative three-year loss is considered significant negative evidence which is objective and verifiable. Additional negative evidence included the uncertainty regarding the magnitude and length of the current economic recession and the highly competitive nature of the business. Positive evidence considered by the Company in its assessment included lengthy operating loss carryforward periods, a lack of unused expired operating loss carryforwards, and estimates of future taxable income.
As of December 31, 2010, after considering both the positive and negative evidence, the Company cannot conclude that it is more likely than not that its US deferred tax assets will be realized. Therefore, the Company will continue to report a full valuation allowance against its US deferred tax assets. For the year ended December 31, 2010, the Company increased its total valuation allowance by $11.1 million, primarily due to the reduced ability to utilize federal and California net operating losses and the reduced ability to utilize federal and California research and development tax credits.
As of December 31, 2010, the Company had net operating loss carry forwards for federal and state income tax purposes of approximately $35.3 million and $7.9 million, respectively. The federal and California loss carryforwards expire on various dates both beginning in 2012 through 2030. As of December 31, 2010, the Company also had a net operating loss carryforward for Hong Kong income tax purposes of approximately $1.1 million, which currently has no expiration date. The Company’s available research and business tax credit carry forwards for federal and state income tax purposes are approximately $5.6 million and $6.4 million, respectively. The federal research credits expire on various dates beginning in 2018. California research tax credits can be carried forward indefinitely.
On December 17, 2010, President Obama signed the Tax Relief, Unemployment Insurance Reauthorization, and Job Creation Act of 2010 (the “2010 Tax Relief Act”) and the 2010 Tax Relief Act renews and retroactively reinstates the federal Research and Development (R&D) tax credit under Internal Revenue Code Section 41,
66
Table of Contents
ADVANCED ANALOGIC TECHNOLOGIES INCORPORATED AND SUBSIDIARIES
NOTES TO CONSOLIDATED FINANCIAL STATEMENTS—(Continued)
Years Ended December 31, 2010, 2009 and 2008
which expired December 31, 2009. The 2010 Tax Relief Act provides that the reinstated R&D tax credit will continue through December 31, 2011. Since the Company has a full valuation allowance against its US deferred tax assets, no benefit is recognized for the R&D tax credit for the year ended December 31, 2010. If utilized, the Company would recognize $0.6 million and $0.6 million of R&D credit for Federal and California, respectively.
As of December 31, 2010, the Company had not recorded the full cumulative tax benefit related to tax deductions in excess of previously expensed stock-based compensation because of unutilized net operating losses and tax credits. If such tax benefits related to tax deductions in excess of previously expensed stock-based compensation were recognized, approximately $2.9 million would be recorded as an addition to paid-in-capital.
The Company recognizes the tax benefit from uncertain tax positions on the income tax return based on a two-step process. The first step is to determine if it is more likely than not that a tax position will be sustained on examination by the taxing authorities, based on the technical merits of the position. The second step is to estimate and measure the tax benefit to be recognized in the financial statements based on the largest benefit that has a greater than 50% likelihood of being realized upon ultimate settlement.
A reconciliation of the beginning and ending balances of the total gross amounts of unrecognized tax benefits for the year ended December 31, 2010, 2009 and 2008 is as follows:
| Year ended December 31, | ||||||||||||
| 2010 | 2009 | 2008 | ||||||||||
| (in thousands) | ||||||||||||
| Balance, January 1 |
$ | 11,668 | $ | 6,720 | $ | 5,049 | ||||||
| Gross increases in tax position in current year |
1,062 | 3,610 | 1,259 | |||||||||
| Gross increases in tax position for prior years |
1,292 | 1,717 | 412 | |||||||||
| Settlements/closure of audits |
(7,888 | ) | (379 | ) | — | |||||||
| Balance, December 31 |
$ | 6,134 | $ | 11,668 | $ | 6,720 | ||||||
As of December 31, 2010, 2009 and 2008, the total amount of unrecognized tax benefits that, if recognized, would affect the Company’s effective tax rate, was $5.5 million, $11.1 million and $6.1 million, respectively.
The Company recognizes interest and penalties accrued related to unrecognized tax benefits in its provision for income taxes. During the years ended December 31, 2010, 2009 and 2008 the Company recognized approximately $0.6 million, $0.1 million and $0.1 million, respectively, for interest and penalties, net of taxes. As of December 31, 2010 and 2009, total accrued interest and penalties for unrecognized tax benefits were approximately $0.9 million and $0.3 million, respectively.
The Company is subject to taxation in the United States and various foreign jurisdictions. With the exception of California, the Company’s tax years for 1997 through 2009 are subject to examination by the US tax authorities. In August 2007, the Company closed an audit with the state of California for all tax years from inception through 2004, but the State left open the option to review the Company’s research and development tax credits in the future. The Company is no longer subject to foreign examinations by tax authorities for years before 2004.
During the year ended December 31, 2010, the Company completed a settlement with the Internal Revenue Service (“IRS”) Appeals Division for the tax years 2005 and 2006. As a result, the Company recorded a one-time tax benefit of $2.8 million. The Company also decreased the accrual for uncertain tax positions by $7.9 million,
67
Table of Contents
ADVANCED ANALOGIC TECHNOLOGIES INCORPORATED AND SUBSIDIARIES
NOTES TO CONSOLIDATED FINANCIAL STATEMENTS—(Continued)
Years Ended December 31, 2010, 2009 and 2008
of which $5.1 million offset deferred tax assets which currently has a full valuation allowance against it. The decrease to uncertain tax positions were partially offset by a $1.3 million increase from the filing of the 2009 tax return and an accrual for uncertain tax positions for the current year of $1.3 million. The current year increase includes an accrual of interest and penalties of $0.6 million.
In April 2010, the Company received an IRS examination report showing proposed changes to its income tax for the 2007 tax year. The Company filed a timely protest to the April 2010 IRS examination report in May 2010 and is currently waiting for discussions with the IRS Appeals Division. The Company believes the adjustments proposed in the IRS examination report are not supported by the facts and are inconsistent with applicable tax laws and existing Treasury regulations. No payments, if any, will be made related to the disputed proposed adjustments until the issues are resolved with either the IRS Appeals Division or the tax court. The Company believes that it has adequately provided in its financial statements for any additional taxes that it may be required to pay as a result of the examination.
The Company believes that it has adequately provided in its financial statements for any additional taxes that it may be required to pay as a result of these examinations. Although the timing of the resolution and/or closure on audits is highly uncertain, it is reasonably possible that the balance of gross unrecognized tax benefits could significantly change in the next 12 months. However, given the number of years remaining subject to examination and the number of matters being examined, the Company is unable to estimate the range of possible adjustments to the balance of gross unrecognized tax benefits.
7. COMMITMENTS
Capital Lease Obligations—As of December 31, 2010 and 2009, the costs of software and equipment under the capital leases included in property and equipment were approximately $0.4 million. The software and equipment acquired under capital leases were fully amortized as of December 31, 2009.
Operating Lease Obligations—The Company leases its primary facility and other offices, under operating leases which expire at various dates through 2016. Rental expense related to the Company’s operating leases totaled $1.8 million, $1.8 million and $2.0 million for 2010, 2009 and 2008, respectively.
As of December 31, 2010, future minimum lease payments under all noncancelable operating leases are as follows:
| Operating Leases |
||||
| (in thousands) | ||||
| 2011 |
$ | 2,543 | ||
| 2012 |
2,300 | |||
| 2013 |
1,512 | |||
| 2014 |
1,038 | |||
| 2015 |
1,063 | |||
| 2016 and beyond |
122 | |||
| Total minimum lease payments |
$ | 8,578 | ||
In 2010, the Company renewed its office lease in Shanghai, China to accommodate its design team and sales personnel. The lease is effective from January 2011 through December 2015.
68
Table of Contents
ADVANCED ANALOGIC TECHNOLOGIES INCORPORATED AND SUBSIDIARIES
NOTES TO CONSOLIDATED FINANCIAL STATEMENTS—(Continued)
Years Ended December 31, 2010, 2009 and 2008
In 2009, the Company renewed its Hong Kong office lease to accommodate its development team. The lease is effective from November 2009 through October 2012.
In 2007, the Company entered into a sublease for its current principal executive offices, effective from September 2007 through March 2016, occupying 42,174 square feet in Santa Clara, California. This facility accommodates the Company’s principal engineering, technology, administrative and finance activities.
8. EMPLOYEE BENEFIT PLAN
The Company sponsors a 401(k) tax-deferred savings plan (“401(k) Plan”) for all employees who meet certain eligibility requirements. Participants may make pre-tax contributions to the 401(k) Plan, up to a maximum contribution amount pursuant to Section 401(k) of the Internal Revenue Code. The Company matches employee contributions annually at 100% of the first 3% of employee contributions and 50% of the second 2% of employee contributions. All matching contributions vest 25% annually over four years. Contributions made by the Company were $0.5 million, $0.4 million and $0.5 million for 2010, 2009 and 2008, respectively.
9. MAJOR CUSTOMERS
The following table summarizes net revenue and accounts receivable for customers that accounted for 10% or more of net accounts receivable or net revenue:
| Accounts Receivable |
Net Revenue | |||||||||||||||||||
| December 31, | Year Ended December 31, |
|||||||||||||||||||
| Customer |
2010 | 2009 | 2010 | 2009 | 2008 | |||||||||||||||
| A |
31 | % | 42 | % | 27 | % | 33 | % | 20 | % | ||||||||||
| B |
24 | 29 | 17 | 24 | 25 | |||||||||||||||
| C |
* | * | 11 | * | * | |||||||||||||||
| D |
* | * | * | * | 10 | |||||||||||||||
| E |
16 | * | * | * | * | |||||||||||||||
| F |
* | * | * | * | 10 | |||||||||||||||
| * | -Amount represents less than 10%. |
69
Table of Contents
ADVANCED ANALOGIC TECHNOLOGIES INCORPORATED AND SUBSIDIARIES
NOTES TO CONSOLIDATED FINANCIAL STATEMENTS—(Continued)
Years Ended December 31, 2010, 2009 and 2008
10. SEGMENT INFORMATION
The Company operates in one reportable segment: the design, development, marketing and sale of power management semiconductor products and solutions for the communications, computing and consumer portable and personal electronics marketplace. The Company’s chief operating decision maker is its chief executive officer. The following is a summary of net revenue by geographic region based on the location to which the product is shipped:
| Year Ended December 31, | ||||||||||||
| 2010 | 2009 | 2008 | ||||||||||
| (in thousands) | ||||||||||||
| South Korea |
$ | 46,923 | $ | 57,854 | $ | 56,670 | ||||||
| China |
20,307 | 17,100 | 14,047 | |||||||||
| Taiwan |
22,634 | 8,219 | 13,981 | |||||||||
| United States |
1,057 | 1,140 | 1,514 | |||||||||
| Europe |
984 | 1,358 | 2,155 | |||||||||
| Japan |
2,156 | 841 | 1,972 | |||||||||
| Total |
$ | 94,061 | $ | 86,512 | $ | 90,339 | ||||||
The following is a summary of long-lived assets by geographic region:
| December 31, | ||||||||
| Country |
2010 | 2009 | ||||||
| (in thousands) | ||||||||
| United States |
$ | 3,209 | $ | 3,727 | ||||
| China |
1,576 | 924 | ||||||
| Taiwan |
1,019 | 799 | ||||||
| Japan |
151 | 134 | ||||||
| South Korea |
68 | 52 | ||||||
| Hong Kong |
309 | 168 | ||||||
| Macau |
259 | 81 | ||||||
| Europe |
3 | 7 | ||||||
| Total |
$ | 6,594 | $ | 5,892 | ||||
70
Table of Contents
ADVANCED ANALOGIC TECHNOLOGIES INCORPORATED AND SUBSIDIARIES
NOTES TO CONSOLIDATED FINANCIAL STATEMENTS—(Continued)
Years Ended December 31, 2010, 2009 and 2008
11. VALUATION AND QUALIFYING ACCOUNTS
The Company had the following activity in its valuation allowances (in thousands):
| Bad Debt |
Distributor Stock Rotation |
Distributor Price Protection |
||||||||||
| Balance—December 31, 2007 |
— | 261 | 2,094 | |||||||||
| Charged to costs and expenses |
5 | 1,063 | 6,801 | |||||||||
| Deductions |
— | (1,211 | ) | (7,666 | ) | |||||||
| Balance—December 31, 2008 |
5 | 113 | 1,229 | |||||||||
| Charged to costs and expenses |
34 | 797 | 4,960 | |||||||||
| Deductions |
— | (778 | ) | (4,994 | ) | |||||||
| Balance—December 31, 2009 |
39 | 132 | 1,195 | |||||||||
| Charged to costs and expenses |
— | 849 | 2,043 | |||||||||
| Deductions |
(28 | ) | (733 | ) | (2,090 | ) | ||||||
| Balance—December 31, 2010 |
$ | 11 | 248 | 1,148 | ||||||||
12. LITIGATION
In May 2003, the Company received a letter from Linear Technology Corporation (“Linear Technology”) alleging that certain of its charge pump products infringed United States Patent No. 6,411,531 (‘531 Patent) owned by Linear Technology. In August 2004, the Company received a letter from Linear Technology alleging that certain of its switching regulator products infringed United States Patent Nos. 5,481,178, 6,304,066 and 6,580,258 (‘258 Patent). In response to these letters, the Company contacted Linear Technology to convey its good faith belief that it does not infringe the patents in question. Subsequently, the Company became aware of a marketing campaign conducted by Linear Technology in which it sought to disrupt the Company’s business relationships and sales by suggesting to the Company’s customers that its products infringe the same United States patents mentioned in its two letters to the Company. As a result, in February 2006, the Company initiated a lawsuit against Linear Technology for unfair business practices, interference with existing and prospective customers and trade libel, as well as a declaration of patent invalidity and non-infringement. This case is currently stayed pending the outcome of the United States International Trade Commission (“USITC”) action described in the following paragraphs.
In March 2006, the USITC responded to a complaint filed by Linear Technology by initiating an investigation under Section 337 of the Tariff Act to determine if certain of the Company’s products infringe certain patents owned by Linear Technology. The accused products include charge pumps and switching regulators and are similar to the products involved in the Company’s lawsuit with Linear Technology. A final determination was issued September 24, 2007 which was followed by separate appeals for the charge pump and switching regulator products. The last of these appeals, including the parties’ respective requests for rehearing, ended in 2009. The overall result of these processes clears the path for importation of the Company’s charge pump products. A limited exclusion order was also issued preventing the Company from importing certain of its switching regulator designs and the scope of this order was expanded by the appeals process. This exclusion order does not, however, prevent the Company’s customers from importing downstream products (i.e., products that incorporate AATI switching regulators) into the United States. To date, the Company’s sales of the excluded products in the United States have been minimal.
71
Table of Contents
ADVANCED ANALOGIC TECHNOLOGIES INCORPORATED AND SUBSIDIARIES
NOTES TO CONSOLIDATED FINANCIAL STATEMENTS—(Continued)
Years Ended December 31, 2010, 2009 and 2008
On October 1, 2008, the USITC initiated a formal enforcement proceeding at the request of Linear Technology. In that enforcement proceeding, Linear Technology alleges that the Company imported certain switching regulator products in violation of the limited exclusion order originally issued on September 24, 2007. The list of products alleged to be in violation was modified by a mutual agreement between the parties under which the Company voluntarily agreed to cease importation of its switching regulator products that do not use its most recent low-noise design. A trial for the remaining products (i.e., those that use the Company’s low-noise design) was completed on January 13, 2010. The final determination of that trial was issued on July 19, 2010 and held that the Company’s low-noise switching regulators are subject to the limited exclusion order and cannot be imported by the Company. As mentioned above, the limited exclusion order applies only to the Company and its agents and does not prevent importation of downstream products. US sales of the products involved in the enforcement have never been significant. Both parties are currently appealing unfavorable portions of the final determination to the United States Court of Appeals for the Federal Circuit.
In March 2009, the Company initiated a lawsuit against a small, privately held semiconductor manufacturing company alleging patent infringement of certain of its products. This case, filed in the United States District Court for the Northern District of California, is currently stayed pending a reexamination of the patent that the Company believes has been infringed. The Company does not believe that this lawsuit will have a material impact on its business or financial condition.
The Company records legal expenses as incurred within sales, general and administrative expenses in the consolidated statements of operations.
72
Table of Contents
ADVANCED ANALOGIC TECHNOLOGIES INCORPORATED AND SUBSIDIARIES
NOTES TO CONSOLIDATED FINANCIAL STATEMENTS—(Continued)
Years Ended December 31, 2010, 2009 and 2008
13. QUARTERLY FINANCIAL DATA (UNAUDITED)
| Three Months Ended | ||||||||||||||||
| (in thousands, except per share data) |
Mar. 31, 2010 |
Jun. 30, 2010 |
Sept. 30, 2010 |
Dec. 31, 2010 |
||||||||||||
| Net revenue |
$ | 21,918 | $ | 23,146 | $ | 24,982 | $ | 24,015 | ||||||||
| Cost of revenue* |
11,315 | 12,609 | 14,111 | 13,725 | ||||||||||||
| Gross profit |
10,603 | 10,537 | 10,871 | 10,290 | ||||||||||||
| Operating expenses: |
||||||||||||||||
| Research and development* |
7,102 | 7,836 | 8,679 | 6,709 | ||||||||||||
| Sales, general and administrative* |
6,161 | 6,109 | 6,546 | 6,237 | ||||||||||||
| Patent litigation |
1,084 | 245 | 41 | 125 | ||||||||||||
| Total operating expenses |
14,347 | 14,190 | 15,266 | 13,071 | ||||||||||||
| Loss from operations |
(3,744 | ) | (3,653 | ) | (4,395 | ) | (2,781 | ) | ||||||||
| Interest and other income: |
||||||||||||||||
| Interest and investment income |
100 | 77 | 51 | 43 | ||||||||||||
| Other income (expense), net |
(31 | ) | (62 | ) | (63 | ) | (45 | ) | ||||||||
| Total interest and other income, net |
69 | 15 | (12 | ) | (2 | ) | ||||||||||
| Loss before income taxes |
(3,675 | ) | (3,638 | ) | (4,407 | ) | (2,783 | ) | ||||||||
| Provision for (benefit from) income taxes |
529 | 273 | (3,114 | ) | 561 | |||||||||||
| Net loss |
$ | (4,204 | ) | $ | (3,911 | ) | $ | (1,293 | ) | $ | (3,344 | ) | ||||
| Basic net loss per common share |
$ | (0.10 | ) | $ | (0.09 | ) | $ | (0.03 | ) | $ | (0.08 | ) | ||||
| Diluted net loss per common share |
$ | (0.10 | ) | $ | (0.09 | ) | $ | (0.03 | ) | $ | (0.08 | ) | ||||
| Shares used in basic net loss per common share |
42,960 | 42,887 | 42,156 | 42,252 | ||||||||||||
| Shares used in diluted net loss per common share |
42,960 | 42,887 | 42,156 | 42,252 | ||||||||||||
|
* Pre-tax stock-based compensation included in: |
||||||||||||||||
| Cost of revenue |
$ | 72 | $ | 65 | $ | 120 | $ | 68 | ||||||||
| Research and development |
578 | 559 | 832 | 469 | ||||||||||||
| Sales, general and administrative |
665 | 635 | 825 | 688 | ||||||||||||
73
Table of Contents
ADVANCED ANALOGIC TECHNOLOGIES INCORPORATED AND SUBSIDIARIES
NOTES TO CONSOLIDATED FINANCIAL STATEMENTS—(Continued)
Years Ended December 31, 2010, 2009 and 2008
| Three Months Ended | ||||||||||||||||
| (in thousands, except per share data) |
Mar. 31, 2009 |
Jun. 30, 2009 |
Sept. 30, 2009 |
Dec. 31, 2009 |
||||||||||||
| Net revenue |
$ | 16,549 | $ | 22,978 | $ | 26,140 | $ | 20,845 | ||||||||
| Cost of revenue* |
9,118 | 11,882 | 12,763 | 10,923 | ||||||||||||
| Gross profit |
7,431 | 11,096 | 13,377 | 9,922 | ||||||||||||
| Operating expenses: |
||||||||||||||||
| Research and development* |
6,583 | 6,808 | 6,928 | 7,149 | ||||||||||||
| Sales, general and administrative* |
5,429 | 6,281 | 6,337 | 6,085 | ||||||||||||
| Patent litigation |
301 | 385 | 1,013 | 1,346 | ||||||||||||
| Total operating expenses |
12,313 | 13,474 | 14,278 | 14,580 | ||||||||||||
| Loss from operations |
(4,882 | ) | (2,378 | ) | (901 | ) | (4,658 | ) | ||||||||
| Interest and other income: |
||||||||||||||||
| Interest and investment income |
371 | 245 | 177 | 109 | ||||||||||||
| Other income (expense), net |
(18 | ) | 70 | (36 | ) | (3 | ) | |||||||||
| Total interest and other income, net |
353 | 315 | 141 | 106 | ||||||||||||
| Loss before income taxes |
(4,529 | ) | (2,063 | ) | (760 | ) | (4,552 | ) | ||||||||
| Provision for (benefit from) income taxes |
679 | 426 | 256 | (592 | ) | |||||||||||
| Net loss |
$ | (5,208 | ) | $ | (2,489 | ) | $ | (1,016 | ) | $ | (3,960 | ) | ||||
| Basic net loss per common share |
$ | (0.12 | ) | $ | (0.06 | ) | $ | (0.02 | ) | $ | (0.09 | ) | ||||
| Diluted net loss per common share |
$ | (0.12 | ) | $ | (0.06 | ) | $ | (0.02 | ) | $ | (0.09 | ) | ||||
| Shares used in basic net loss per common share |
43,052 | 42,938 | 42,956 | 42,947 | ||||||||||||
| Shares used in diluted net loss per common share |
43,052 | 42,938 | 42,956 | 42,947 | ||||||||||||
|
* Pre-tax stock-based compensation included in: |
| |||||||||||||||
| Cost of revenue |
$ | 63 | $ | 84 | $ | 79 | $ | 83 | ||||||||
| Research and development |
700 | 733 | 767 | 963 | ||||||||||||
| Sales, general and administrative |
812 | 829 | 873 | 942 | ||||||||||||
Correction of Quarterly Statement of Cash Flows
The Company has identified certain immaterial misstatements within its previously issued condensed consolidated statements of cash flows for the three months ended March 31, 2010, the six months ended June 30, 2010 and the nine months ended September 30, 2010. When the affected line items are corrected in the interim condensed consolidated financial statements in our 2011 quarterly reports on Form 10-Q, the Company will present these amounts both as previously reported and as restated. For the three months ended March 31, 2010, the six months ended June 30, 2010 and the nine months ended September 30, 2010, the Company previously reported Net Cash Used in Operating Activities of $(2.9) million, $(3.7) million, and $(7.6) million, respectively, and Net Cash Provided by (Used in) Investing Activities of $(20.8) million, $(18.8) million, and $4.6 million, respectively. After correction, Net Cash Used in Operating Activities for these interim periods will be restated as $(2.2) million, $(2.5) million and $(6.1) million, respectively, and Net Cash Provided by (Used in) Investing Activities will be restated as $(21.5) million, $(20.0) million, and $3.1 million, respectively. These corrections impact only certain line items within the condensed consolidated statements of cash flows and do not result in any change in the beginning and ending balances of cash and cash equivalents from the amounts previously reported. The corrected items do not have any impact on the balance sheets or statements of operations for any period. The Company does not consider any of these corrections to be material.
74
Table of Contents
| ITEM 9. | CHANGES IN AND DISAGREEMENTS WITH ACCOUNTANTS ON ACCOUNTING AND FINANCIAL DISCLOSURE |
None.
| ITEM 9A. | CONTROLS AND PROCEDURES |
(a) Evaluation of Disclosure Controls and Procedures
Our management, with the participation of our Chief Executive Officer and Chief Financial Officer, evaluated the effectiveness of our disclosure controls and procedures as of December 31, 2010. The term “disclosure controls and procedures,” as defined in Rules 13a-15(e) and 15d-15(e) under the Securities Exchange Act of 1934, means controls and other procedures of a company that are designed to ensure that information required to be disclosed by a company in the reports that it files or submits under the Exchange Act is recorded, processed, summarized and reported, within the time periods specified in the SEC’s rules and forms. Disclosure controls and procedures include, without limitation, controls and procedures designed to ensure that information required to be disclosed by a company in the reports that it files or submits under the Exchange Act is accumulated and communicated to the company’s management, including its principal executive and principal financial officers, as appropriate to allow timely decisions regarding required disclosure. Management recognizes that any controls and procedures, no matter how well designed and operated, can provide only reasonable assurance of achieving their objectives and management necessarily applies its judgment in evaluating the cost-benefit relationship of possible controls and procedures. Based on the evaluation of our disclosure controls and procedures as of December 31, 2010, our Chief Executive Officer and Chief Financial Officer concluded that, as of such date, our disclosure controls and procedures were effective at the reasonable assurance level.
(b) Management’s Report on Internal Control Over Financial Reporting
Our management is responsible for establishing and maintaining adequate internal control over financial reporting to provide reasonable assurance regarding the reliability of our financial reporting and the preparation of financial statements for external purposes in accordance with US generally accepted accounting principles. Internal control over financial reporting includes those policies and procedures that (i) pertain to the maintenance of records that in reasonable detail accurately and fairly reflect the transactions and dispositions of the assets of the company; (ii) provide reasonable assurance that transactions are recorded as necessary to permit preparation of financial statements in accordance with US generally accepted accounting principles, and that receipts and expenditures of the company are being made only in accordance with authorizations of management and directors of the company; and (iii) provide reasonable assurance regarding prevention or timely detection of unauthorized acquisition, use, or disposition of the Company’s assets that could have a material effect on the financial statements.
A deficiency in internal control over financial reporting exists when the design or operation of a control does not allow management or employees, in the normal course of performing their assigned functions, to prevent or detect misstatements on a timely basis. A deficiency in design exists when (a) a control necessary to meet the control objective is missing or (b) an existing control is not properly designed so that, even if the control operates as designed, the control objective would not be met. A deficiency in operation exists when a properly designed control does not operate as designed, or when the person performing the control does not possess the necessary authority or competence to perform the control effectively. A significant deficiency is a deficiency, or a combination of deficiencies, in internal control over financial reporting that is less severe than a material weakness, yet important enough to merit attention by those responsible for oversight of the company’s financial reporting. A material weakness is a deficiency, or a combination of deficiencies, in internal control over financial reporting, such that there is a reasonable possibility that a material misstatement of the company’s annual or interim financial statements will not be prevented or detected on a timely basis.
Management based its assessment on criteria established in Internal Control—Integrated Framework issued by the Committee of Sponsoring Organizations of the Treadway Commission. Management’s assessment
75
Table of Contents
included the evaluation of elements such as the design and operating effectiveness of key financial reporting controls, process documentation, accounting policies, and our overall control environment. Based on our assessment, management has concluded that our internal control over financial reporting was effective as of December 31, 2010. We reviewed the results of management’s assessment with the Audit Committee of our Board of Directors. Our independent registered public accounting firm, which audited the consolidated financial statements included in this annual report on Form 10-K, has issued an attestation report, included elsewhere herein, which expresses an opinion on the effectiveness of our internal control over financial reporting.
(c) Changes in Internal Controls Over Financial Reporting
There have been no changes in our internal controls over financial reporting that occurred in the fourth quarter of the period covered by this Annual Report on Form 10-K that have materially affected, or are reasonably likely to materially affect, our internal controls over financial reporting.
| ITEM 9B. | OTHER INFORMATION |
None.
76
Table of Contents
Report of Independent Registered Public Accounting Firm
To the Board of Directors and Stockholders of
Advanced Analogic Technologies Incorporated
Santa Clara, California
We have audited the internal control over financial reporting of Advanced Analogic Technologies Incorporated and subsidiaries (the “Company”) as of December 31, 2010, based on criteria established in Internal Control—Integrated Framework issued by the Committee of Sponsoring Organizations of the Treadway Commission. The Company’s management is responsible for maintaining effective internal control over financial reporting and for its assessment of the effectiveness of internal control over financial reporting, included in the accompanying Management’s Report on Internal Control Over Financial Reporting. Our responsibility is to express an opinion on the Company’s internal control over financial reporting based on our audit.
We conducted our audit in accordance with the standards of the Public Company Accounting Oversight Board (United States). Those standards require that we plan and perform the audit to obtain reasonable assurance about whether effective internal control over financial reporting was maintained in all material respects. Our audit included obtaining an understanding of internal control over financial reporting, assessing the risk that a material weakness exists, testing and evaluating the design and operating effectiveness of internal control based on the assessed risk, and performing such other procedures as we considered necessary in the circumstances. We believe that our audit provides a reasonable basis for our opinion.
A company’s internal control over financial reporting is a process designed by, or under the supervision of, the company’s principal executive and principal financial officers, or persons performing similar functions, and effected by the company’s board of directors, management, and other personnel to provide reasonable assurance regarding the reliability of financial reporting and the preparation of financial statements for external purposes in accordance with generally accepted accounting principles. A company’s internal control over financial reporting includes those policies and procedures that (1) pertain to the maintenance of records that, in reasonable detail, accurately and fairly reflect the transactions and dispositions of the assets of the company; (2) provide reasonable assurance that transactions are recorded as necessary to permit preparation of financial statements in accordance with generally accepted accounting principles, and that receipts and expenditures of the company are being made only in accordance with authorizations of management and directors of the company; and (3) provide reasonable assurance regarding prevention or timely detection of unauthorized acquisition, use, or disposition of the company’s assets that could have a material effect on the financial statements.
Because of the inherent limitations of internal control over financial reporting, including the possibility of collusion or improper management override of controls, material misstatements due to error or fraud may not be prevented or detected on a timely basis. Also, projections of any evaluation of the effectiveness of the internal control over financial reporting to future periods are subject to the risk that the controls may become inadequate because of changes in conditions, or that the degree of compliance with the policies or procedures may deteriorate.
In our opinion, the Company maintained, in all material respects, effective internal control over financial reporting as of December 31, 2010, based on the criteria established in Internal Control—Integrated Framework issued by the Committee of Sponsoring Organizations of the Treadway Commission.
We have also audited, in accordance with the standards of the Public Company Accounting Oversight Board (United States), the consolidated financial statements as of and for the year ended December 31, 2010 of the Company and our report dated February 24, 2011 expressed an unqualified opinion on those financial statements.
/S/ DELOITTE & TOUCHE LLP
San Jose, California
February 24, 2011
77
Table of Contents
| ITEM 10. | DIRECTORS, EXECUTIVE OFFICERS AND CORPORATE GOVERNANCE |
Executive Officers
The information required by this item with respect to our executive officers is set forth under the caption “Executive Officers” in Item 1 of this Report and is incorporated herein by reference.
Directors
The information required by this item with respect to our board of directors and committees thereof is set forth in our 2011 Proxy Statement under the caption “Election of Directors” and is incorporated herein by reference.
Section 16(a) Beneficial Ownership Reporting Compliance
The information required by this item with respect to Section 16(a) beneficial ownership reporting compliance is set forth in our 2011 Proxy Statement under the caption “Section 16(a) Beneficial Ownership Reporting Compliance” and is incorporated herein by reference.
Code of Business Conduct and Ethics
The information required by this item with respect to our Code of Business Conduct and Ethics is set forth in our 2011 Proxy Statement under the caption “Code of Business Conduct and Ethics” and is incorporated herein by reference.
| ITEM 11. | EXECUTIVE COMPENSATION |
The information required by this item is set forth under the caption “Executive Compensation and Other Matters” in our 2011 Proxy Statement and is incorporated herein by reference.
| ITEM 12. | SECURITY OWNERSHIP OF CERTAIN BENEFICIAL OWNERS AND MANAGEMENT AND RELATED STOCKHOLDER MATTERS |
The information required by this item with respect to equity compensation plans is set forth under the caption “Equity Compensation Plan Information” in our 2011 Proxy Statement and with respect to security ownership of certain beneficial owners, directors and executive officers is set forth under the caption “Security Ownership of Certain Beneficial Owners and Management” in our 2011 Proxy Statement and is incorporated herein by reference.
| ITEM 13. | CERTAIN RELATIONSHIPS AND RELATED TRANSACTIONS, AND DIRECTOR INDEPENDENCE |
The information required by this item is set forth under the captions “Compensation Committee Interlocks and Insider Participation” and “Certain Relationships, Related Party Transactions and Director Independence” in our 2011 Proxy Statement and is incorporated herein by reference.
| ITEM 14. | PRINCIPAL ACCOUNTING FEES AND SERVICES |
The information required by this item is set forth under the caption “Principal Accounting Fees and Services” in our 2011 Proxy Statement and is incorporated herein by reference.
78
Table of Contents
| ITEM 15. | EXHIBITS AND FINANCIAL STATEMENT SCHEDULES |
(a) Documents filed as part of this report
(1) Financial Statements
The following financial statements and related report are included in Item 8 of this Report:
| • | Report of Independent Registered Public Accounting Firm |
| • | Consolidated Balance Sheets |
| • | Consolidated Statements of Operations |
| • | Consolidated Statements of Stockholders’ Equity and Comprehensive Income (Loss) |
| • | Consolidated Statements of Cash Flows |
| • | Notes to Consolidated Financial Statements |
(2) Schedules
See Note 11 to Consolidated Financial Statements included in Item 8 of this Report.
(3) Exhibits
The exhibits listed on the accompanying index to exhibits in Item 15(b) below are filed as part of, or hereby incorporated by reference into, this Report.
(b) Exhibits
| Exhibit |
Description | |
| 3.1(1) | Amended and Restated Certificate of Incorporation of the Registrant | |
| 3.2(2) | Amended and Restated Bylaws of the Registrant | |
| 4.1(3) | Form of the Registrant’s Common Stock Certificate | |
| 10.1(3) | Form of Director and Executive Officer Indemnification Agreement | |
| 10.2(3) | 1998 Stock Plan and forms of agreement thereunder | |
| 10.3(3) | 2005 Equity Incentive Plan and form of agreement thereunder | |
| 10.4(3) | 2005 Employee Stock Purchase Plan and form of agreement thereunder | |
| 10.5(3) | Employment Offer Letter between the Registrant and Richard K. Williams dated September 24, 1998 | |
| 10.6(3) | Employment Offer Letter between the Registrant and Brian R. McDonald dated June 21, 2004 | |
| 10.7(3) | Office Lease between the Registrant and Wolfe Road Investments No. 3, a partnership, dated August 4, 2004 | |
| 10.8(3) | Amended and Restated Loan and Security Agreement between the Registrant and Silicon Valley Bank, dated July 15, 2005 | |
| 10.9(3)† | Joint Development Agreement between the Registrant and GEM Services, Inc. dated June 1, 1999 | |
79
Table of Contents
| Exhibit |
Description | |
| 10.10(3) | Form of Warrant to Purchase Shares of Series E Preferred Stock | |
| 10.11(3) | Form of Warrant to Purchase Shares of Common Stock | |
| 10.12(3)† | Wafer Foundry Agreement, as amended, between the Registrant and HYNIX Semiconductor America dated June 4, 2002 | |
| 10.12.1(3) | Amendment dated effective May 1, 2005 to Wafer Foundry Agreement between the Registrant and HYNIX Semiconductor America dated June 4, 2002 | |
| 10.13(3) | Amended and Restated Investors’ Rights Agreement dated October 27, 2003 | |
| 10.13.1(3) | Amendment to Amended and Restated Investors’ Rights Agreement dated as of May 18, 2005 | |
| 10.14(3) | Amended and Restated Voting Agreement dated October 27, 2003 | |
| 10.15(3) | Form of Change of Control Agreement (Chief Executive Officer and Chief Financial Officer) | |
| 10.16(3) | Form of Change of Control Agreement (Vice Presidents) | |
| 10.17(4) | Sublease between Sandisk Corp. and Advanced Analogic Tech. Inc. | |
| 10.18(5) | Settlement Agreement and Release by and between Parviz Ghaffaripour and Advanced Analogic Technologies, Inc., dated July 30, 2008 | |
| 10.19(6) | Separation Agreement and Release by and between Advanced Analogic Technologies Incorporated and Edward Lam dated September 30, 2010 | |
| 10.20(6) | Separation Agreement and Release by and between Advanced Analogic Technologies Incorporated and Allen K. Lam dated September 30, 2010 | |
| 21.1 | Subsidiaries of the Registrant | |
| 23.1 | Consent of Deloitte & Touche LLP, independent registered public accounting firm | |
| 24.1 | Power of Attorney (see signature page) | |
| 31.1 | Certification of Chief Executive Officer pursuant to Securities Exchange Act Rules 13a-14(a) and 15d-14(a), as adopted pursuant to Section 302 of the Sarbanes-Oxley Act of 2002. | |
| 31.2 | Certification of Chief Financial Officer pursuant to Securities Exchange Act Rules 13a-14(a) and 15d-14(a), as adopted pursuant to Section 302 of the Sarbanes-Oxley Act of 2002. | |
| ***32.1 | Certification of Chief Executive Officer and Chief Financial Officer pursuant to 18 U.S.C. Section 1350, as adopted pursuant to Section 906 of the Sarbanes-Oxley Act of 2002. | |
| 1 | Incorporated by reference to Exhibit 3.2 of the Registrant’s Form S-1 Registration Statement (Registration No. 333-123798), declared effective by the Securities and Exchange Commission on August 3, 2005. |
| 2 | Incorporated by reference to Exhibit 3.4 of the Registrant’s Form S-1 Registration Statement (Registration No. 333-123798), declared effective by the Securities and Exchange Commission on August 3, 2005. |
| 3 | Incorporated by reference to the same number exhibit filed with the Registrant’s Registration Statement on Form S-1 (Registration No. 333-123798), declared effective by the Securities and Exchange Commission on August 3, 2005. |
| 4 | Incorporated by reference to Exhibit 10.17 of the Registrant’s Current Report on Form 8-K filed on June 25, 2007. |
| 5 | Incorporated by reference to Exhibit 10.18 of the Registrant’s Current Report on Form 8-K filed on August 1, 2008. |
80
Table of Contents
| 6 | Incorporated by reference to the same number exhibit filed with the Registrant’s Current Report on Form 8-K filed on October 6, 2010. |
| *** | This exhibit shall not be deemed “filed” for purposes of Section 18 of the Securities Exchange Act of 1934 or otherwise subject to the liabilities of that Section, nor shall it be deemed incorporated by reference in any filings under the Securities Act of 1933 or the Securities Exchange Act of 1934, whether made before or after the date hereof and irrespective of any general incorporation language in any filings. |
| † | Confidential treatment has been granted for portions of this exhibit. |
81
Table of Contents
Pursuant to the requirements of the Section 13 or 15(d) of the Securities Exchange Act of 1934, Advanced Analogic Technologies Incorporated has duly caused this report to be signed on its behalf by the undersigned, thereunto duly authorized, in Santa Clara, California on the 25th day of February, 2011.
| ADVANCED ANALOGIC TECHNOLOGIES INCORPORATED | ||
| By: | /S/ BRIAN R. MCDONALD | |
| Brian R. McDonald Chief Financial Officer, Vice President of Worldwide Finance and Secretary | ||
POWER OF ATTORNEY
KNOW ALL PERSONS BY THESE PRESENTS, that each person whose signature appears below constitutes and appoints Richard K. Williams and Brian R. McDonald, his or her true and lawful attorneys-in-fact, each with full power of substitution, for him or her in any and all capacities, to sign any amendments to this report on Form 10-K and to file the same, with exhibits thereto and other documents in connection therewith, with the Securities and Exchange Commission, hereby ratifying and confirming that each of said attorneys-in-fact or their substitute or substitutes may do or cause to be done by virtue hereof.
Pursuant to the requirements of the Securities Exchange Act of 1934, this report has been signed below by the following persons on behalf of Advanced Analogic Technologies Incorporated and in the capacities and on the dates indicated.
| Signature |
Title |
Date | ||
| /S/ RICHARD K. WILLIAMS | President, Chief Executive Officer, Chief Technical Officer and Director (Principal Executive Officer) | February 25, 2011 | ||
| Richard K. Williams | ||||
| /S/ BRIAN R. MCDONALD | Chief Financial Officer, Vice President of Worldwide Finance and Secretary (Principal Financial Officer) | February 25, 2011 | ||
| Brian R. McDonald | ||||
| /S/ ASHOK CHANDRAN | Vice President and Chief Accounting Officer (Principal Accounting Officer) |
February 25, 2011 | ||
| Ashok Chandran | ||||
| /S/ SAMUEL J. ANDERSON | Director | February 25, 2011 | ||
| Samuel J. Anderson | ||||
| /S/ JASON L. CARLSON | Director | February 25, 2011 | ||
| Jason L. Carlson | ||||
| /S/ JAFF LIN | Director | February 25, 2011 | ||
| Jaff Lin | ||||
| /S/ THOMAS P. REDFERN | Director | February 25, 2011 | ||
| Thomas P. Redfern | ||||
| /S/ CHANDRAMOHAN SUBRAMANIAM | Director | February 25, 2011 | ||
| Chandramohan Subramaniam | ||||
82
Table of Contents
EXHIBIT INDEX
| Exhibit |
Description | |
| 3.1(1) | Amended and Restated Certificate of Incorporation of the Registrant | |
| 3.2(2) | Amended and Restated Bylaws of the Registrant | |
| 4.1(3) | Form of the Registrant’s Common Stock Certificate | |
| 10.1(3) | Form of Director and Executive Officer Indemnification Agreement | |
| 10.2(3) | 1998 Stock Plan and forms of agreement thereunder | |
| 10.3(3) | 2005 Equity Incentive Plan and form of agreement thereunder | |
| 10.4(3) | 2005 Employee Stock Purchase Plan and form of agreement thereunder | |
| 10.5(3) | Employment Offer Letter between the Registrant and Richard K. Williams dated September 24, 1998 | |
| 10.6(3) | Employment Offer Letter between the Registrant and Brian R. McDonald dated June 21, 2004 | |
| 10.7(3) | Office Lease between the Registrant and Wolfe Road Investments No. 3, a partnership, dated August 4, 2004 | |
| 10.8(3) | Amended and Restated Loan and Security Agreement between the Registrant and Silicon Valley Bank, dated July 15, 2005 | |
| 10.9(3)† | Joint Development Agreement between the Registrant and GEM Services, Inc. dated June 1, 1999 | |
| 10.10(3) | Form of Warrant to Purchase Shares of Series E Preferred Stock | |
| 10.11(3) | Form of Warrant to Purchase Shares of Common Stock | |
| 10.12(3)† | Wafer Foundry Agreement, as amended, between the Registrant and HYNIX Semiconductor America dated June 4, 2002 | |
| 10.12.1(3) | Amendment dated effective May 1, 2005 to Wafer Foundry Agreement between the Registrant and HYNIX Semiconductor America dated June 4, 2002 | |
| 10.13(3) | Amended and Restated Investors’ Rights Agreement dated October 27, 2003 | |
| 10.13.1(3) | Amendment to Amended and Restated Investors’ Rights Agreement dated as of May 18, 2005 | |
| 10.14(3) | Amended and Restated Voting Agreement dated October 27, 2003 | |
| 10.15(3) | Form of Change of Control Agreement (Chief Executive Officer and Chief Financial Officer) | |
| 10.16(3) | Form of Change of Control Agreement (Vice Presidents) | |
| 10.17(4) | Sublease between Sandisk Corp. and Advanced Analogic Tech. Inc. | |
| 10.18(5) | Settlement Agreement and Release by and between Parviz Ghaffaripour and Advanced Analogic Technologies, Inc., dated July 30, 2008 | |
| 10.19(6) | Separation Agreement and Release by and between Advanced Analogic Technologies Incorporated and Edward Lam dated September 30, 2010 | |
| 10.20(6) | Separation Agreement and Release by and between Advanced Analogic Technologies Incorporated and Allen K. Lam dated September 30, 2010 | |
| 21.1 | Subsidiaries of the Registrant | |
83
Table of Contents
| Exhibit |
Description | |
| 23.1 | Consent of Deloitte & Touche LLP, independent registered public accounting firm | |
| 24.1 | Power of Attorney (see signature page) | |
| 31.1 | Certification of Chief Executive Officer pursuant to Securities Exchange Act Rules 13a-14(a) and 15d-14(a), as adopted pursuant to Section 302 of the Sarbanes-Oxley Act of 2002. | |
| 31.2 | Certification of Chief Financial Officer pursuant to Securities Exchange Act Rules 13a-14(a) and 15d-14(a), as adopted pursuant to Section 302 of the Sarbanes-Oxley Act of 2002. | |
| ***32.1 | Certification of Chief Executive Officer and Chief Financial Officer pursuant to 18 U.S.C. Section 1350, as adopted pursuant to Section 906 of the Sarbanes-Oxley Act of 2002. | |
| 1 | Incorporated by reference to Exhibit 3.2 of the Registrant’s Form S-1 Registration Statement (Registration No. 333-123798), declared effective by the Securities and Exchange Commission on August 3, 2005. |
| 2 | Incorporated by reference to Exhibit 3.4 of the Registrant’s Form S-1 Registration Statement (Registration No. 333-123798), declared effective by the Securities and Exchange Commission on August 3, 2005. |
| 3 | Incorporated by reference to the same number exhibit filed with the Registrant’s Registration Statement on Form S-1 (Registration No. 333-123798), declared effective by the Securities and Exchange Commission on August 3, 2005. |
| 4 | Incorporated by reference to Exhibit 10.17 of the Registrant’s Current Report on Form 8-K filed on June 25, 2007. |
| 5 | Incorporated by reference to Exhibit 10.18 of the Registrant’s Current Report on Form 8-K filed on August 1, 2008. |
| 6 | Incorporated by reference to the same number exhibit filed with the Registrant’s Current Report on Form 8-K filed on October 6, 2010. |
| *** | This exhibit shall not be deemed “filed” for purposes of Section 18 of the Securities Exchange Act of 1934 or otherwise subject to the liabilities of that Section, nor shall it be deemed incorporated by reference in any filings under the Securities Act of 1933 or the Securities Exchange Act of 1934, whether made before or after the date hereof and irrespective of any general incorporation language in any filings. |
| † | Confidential treatment has been granted for portions of this exhibit. |
84