Attached files
| file | filename |
|---|---|
| 8-K - 8-K - ACCURIDE CORP | a11-6634_18k.htm |
| EX-99.1 - EX-99.1 - ACCURIDE CORP | a11-6634_1ex99d1.htm |
Exhibit 99.2
|
|
1 Fourth Quarter 2010 Earnings Call February 25, 2011 |
|
|
Opening Comments Rick Dauch Industry Update President & CEO Corporate Initiatives Financial Information Jim Woodward Fourth Quarter Results Senior VP, CFO Financial Structure 2011 Outlook Questions & Answers Rick Dauch Jim Woodward Closing Comments Rick Dauch Fourth Quarter 2010 Earnings |
|
|
Statements contained in this news release that are not purely historical are forward-looking statements within the meaning of Section 27A of the Securities Act of 1933, as amended, and Section 21E of the Securities Exchange Act of 1934, as amended, including statements regarding Accuride’s expectations, hopes, beliefs and intentions with respect to future results. Such statements are subject to the impact on Accuride’s business and prospects generally of, among other factors, market demand in the commercial vehicle industry, general economic, business and financing conditions, labor relations, governmental action, competitor pricing activity, expense volatility and other risks detailed from time to time in Accuride’s Securities and Exchange Commission filings, including those described in Item 1A of Accuride’s Annual Report on Form 10-K for the fiscal year ended December 31, 2009. Any forward-looking statement reflects only Accuride’s belief at the time the statement is made. Although Accuride believes that the expectations reflected in these forward-looking statements are reasonable, it cannot guarantee its future results, levels of activity, performance or achievements. Except as required by law, Accuride undertakes no obligation to update any forward-looking statements to reflect events or developments after the date of this news release. Forward Looking Statements |
|
|
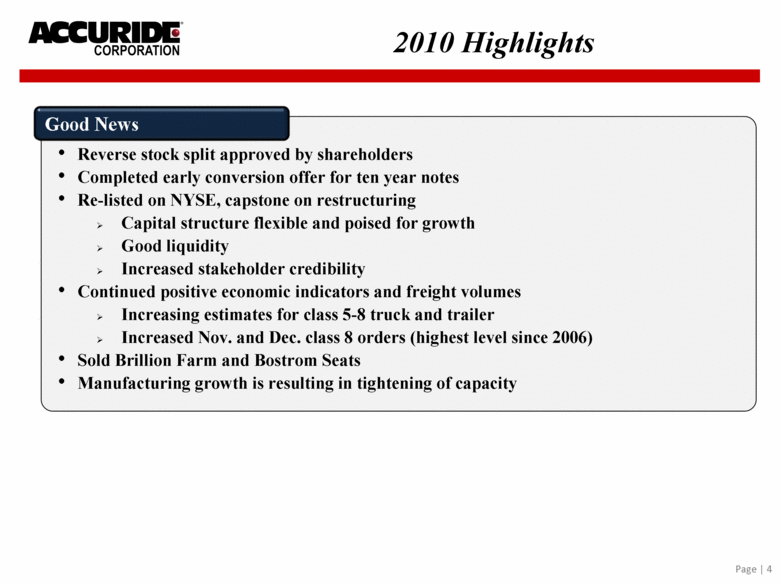
Reverse stock split approved by shareholders Completed early conversion offer for ten year notes Re-listed on NYSE, capstone on restructuring Capital structure flexible and poised for growth Good liquidity Increased stakeholder credibility Continued positive economic indicators and freight volumes Increasing estimates for class 5-8 truck and trailer Increased Nov. and Dec. class 8 orders (highest level since 2006) Sold Brillion Farm and Bostrom Seats Manufacturing growth is resulting in tightening of capacity 2010 Highlights |
|
|
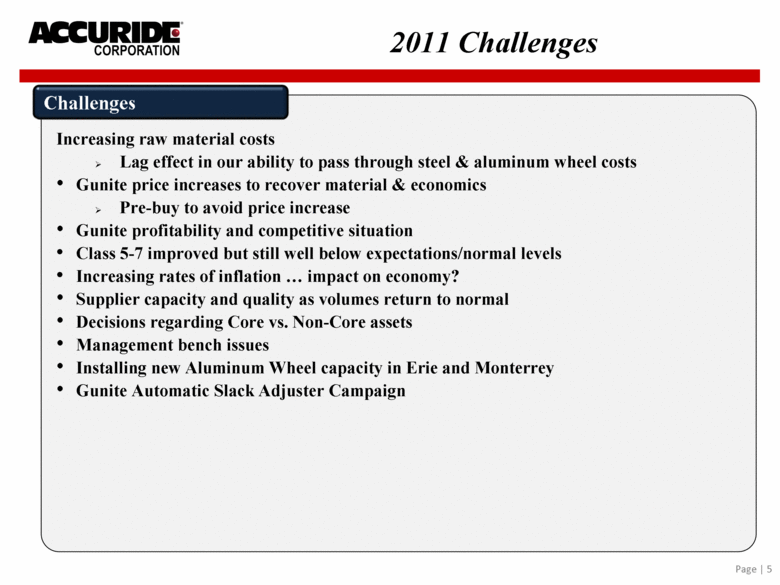
Increasing raw material costs Lag effect in our ability to pass through steel & aluminum wheel costs Gunite price increases to recover material & economics Pre-buy to avoid price increase Gunite profitability and competitive situation Class 5-7 improved but still well below expectations/normal levels Increasing rates of inflation impact on economy? Supplier capacity and quality as volumes return to normal Decisions regarding Core vs. Non-Core assets Management bench issues Installing new Aluminum Wheel capacity in Erie and Monterrey Gunite Automatic Slack Adjuster Campaign 2011 Challenges |
|
|
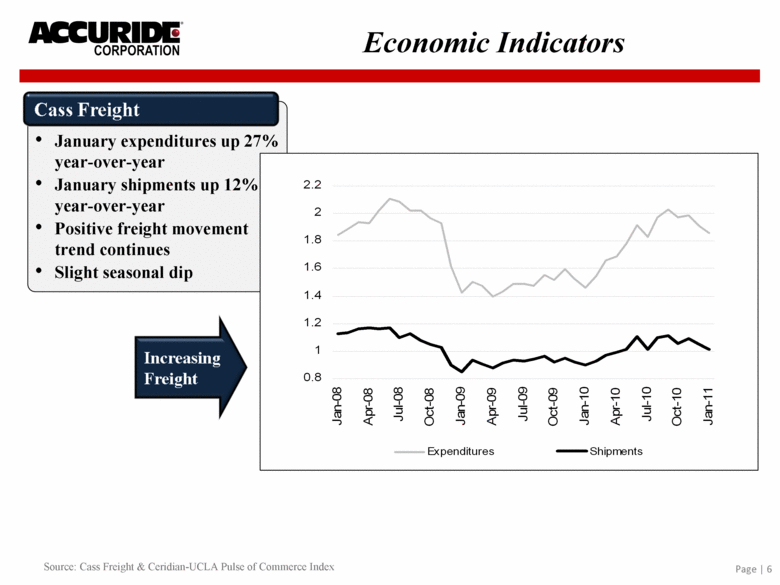
Source: Cass Freight & Ceridian-UCLA Pulse of Commerce Index January expenditures up 27% year-over-year January shipments up 12% year-over-year Positive freight movement trend continues Slight seasonal dip Economic Indicators 0.8 1 1.2 1.4 1.6 1.8 2 2.2 Jan-08 Apr-08 Jul-08 Oct-08 Jan-09 Apr-09 Jul-09 Oct-09 Jan-10 Apr-10 Jul-10 Oct-10 Jan-11 Expenditures Shipments |
|
|
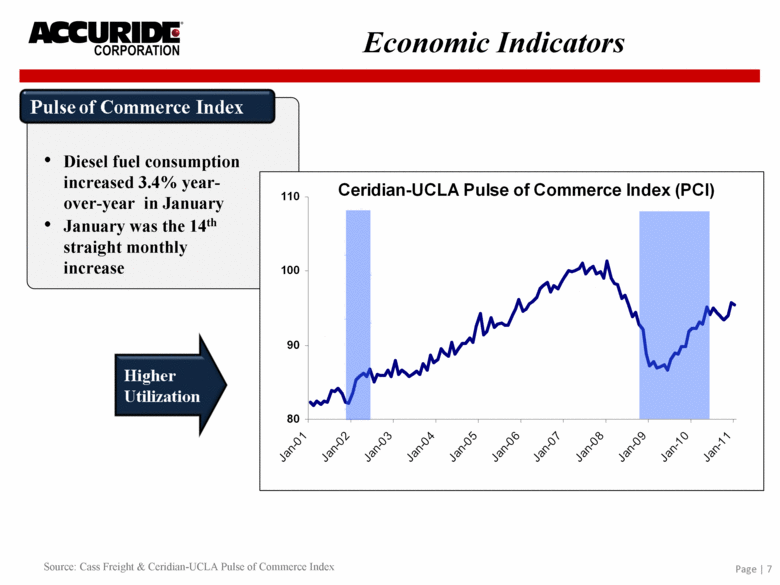
Diesel fuel consumption increased 3.4% year-over-year in January January was the 14th straight monthly increase Source: Cass Freight & Ceridian-UCLA Pulse of Commerce Index Economic Indicators 80 90 100 110 Jan-01 Jan-02 Jan-03 Jan-04 Jan-05 Jan-06 Jan-07 Jan-08 Jan-09 Jan-10 Jan-11 Ceridian-UCLA Pulse of Commerce Index (PCI) |
|
|
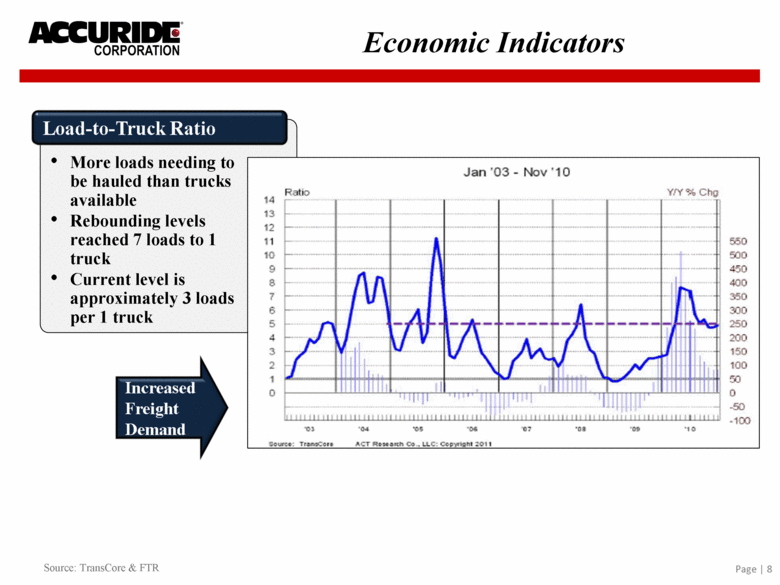
More loads needing to be hauled than trucks available Rebounding levels reached 7 loads to 1 truck Current level is approximately 3 loads per 1 truck Source: TransCore & FTR Economic Indicators |
|
|
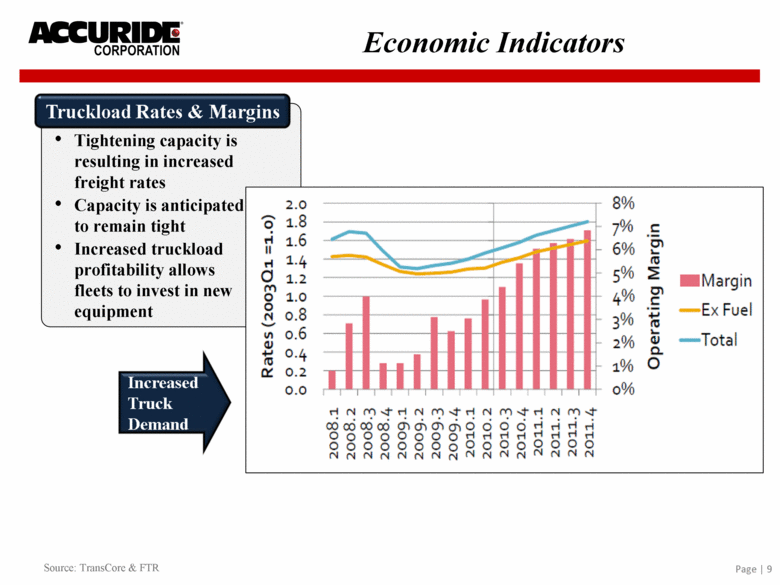
Tightening capacity is resulting in increased freight rates Capacity is anticipated to remain tight Increased truckload profitability allows fleets to invest in new equipment Source: TransCore & FTR Economic Indicators |
|
|
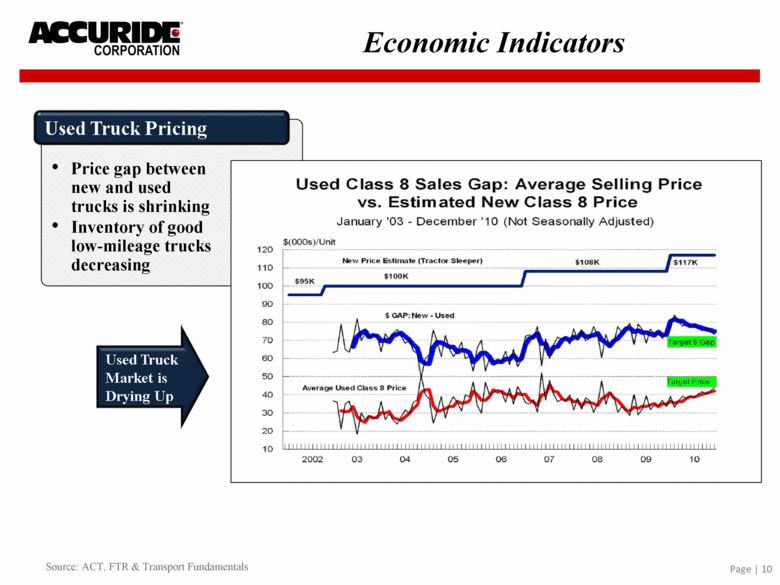
Price gap between new and used trucks is shrinking Inventory of good low-mileage trucks decreasing Source: ACT, FTR & Transport Fundamentals Economic Indicators |
|
|
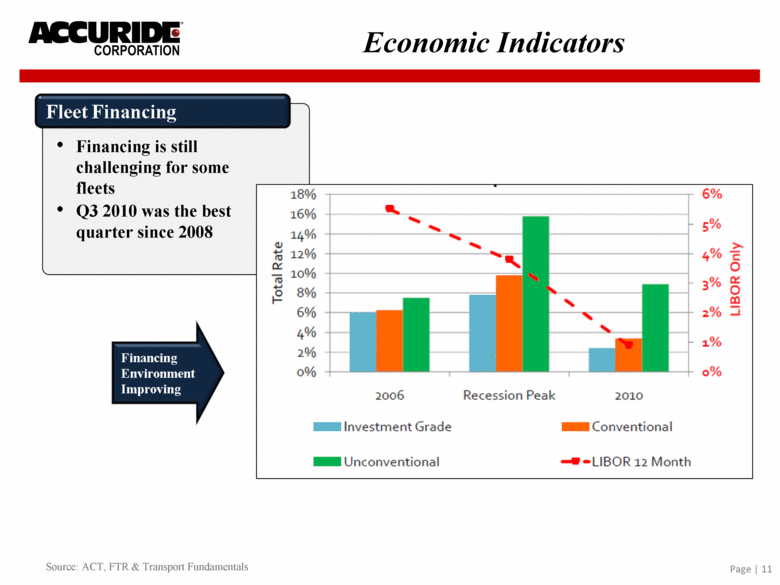
Financing is still challenging for some fleets Q3 2010 was the best quarter since 2008 Source: ACT, FTR & Transport Fundamentals Economic Indicators |
|
|
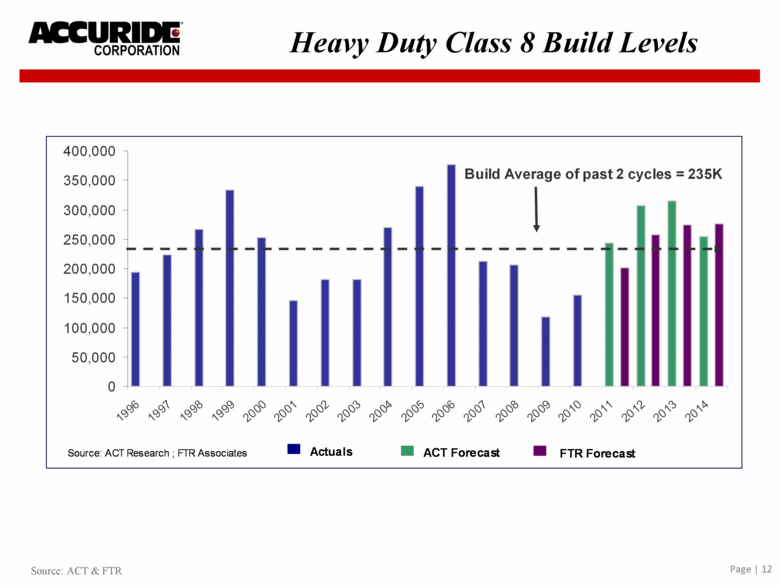
Source: ACT & FTR Heavy Duty Class 8 Build Levels 0 50,000 100,000 150,000 200,000 250,000 300,000 350,000 400,000 1996 1997 1998 1999 2000 2001 2002 2003 2004 2005 2006 2007 2008 2009 2010 2011 2012 2013 2014 Build Average of past 2 cycles = 235K North America Class 8 Builds Source: ACT Research ; FTR Associates Actuals ACT Forecast FTR Forecast |
|
|
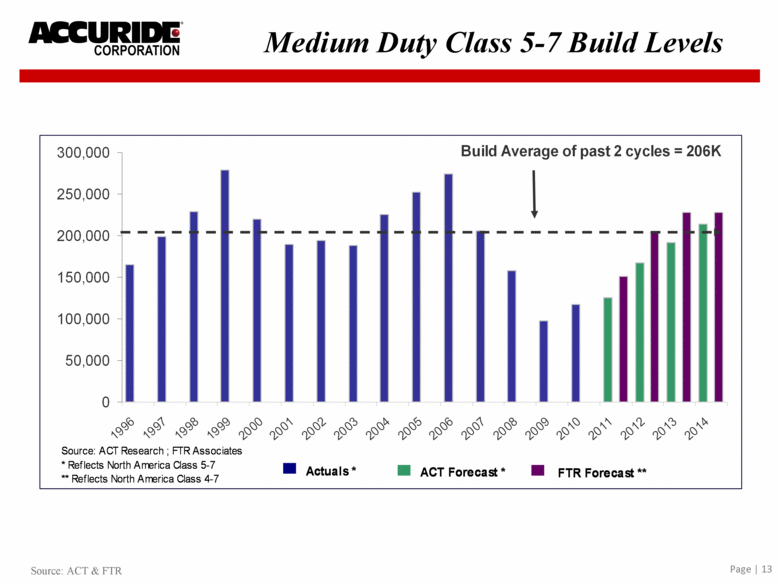
Source: ACT & FTR Medium Duty Class 5-7 Build Levels 0 50,000 100,000 150,000 200,000 250,000 300,000 1996 1997 1998 1999 2000 2001 2002 2003 2004 2005 2006 2007 2008 2009 2010 2011 2012 2013 2014 Build Average of past 2 cycles = 206K North America Medium Duty Source: ACT Research ; FTR Associates Actuals * ACT Forecast * FTR Forecast ** * Reflects North America Class 5-7 ** Reflects North America Class 4-7 |
|
|
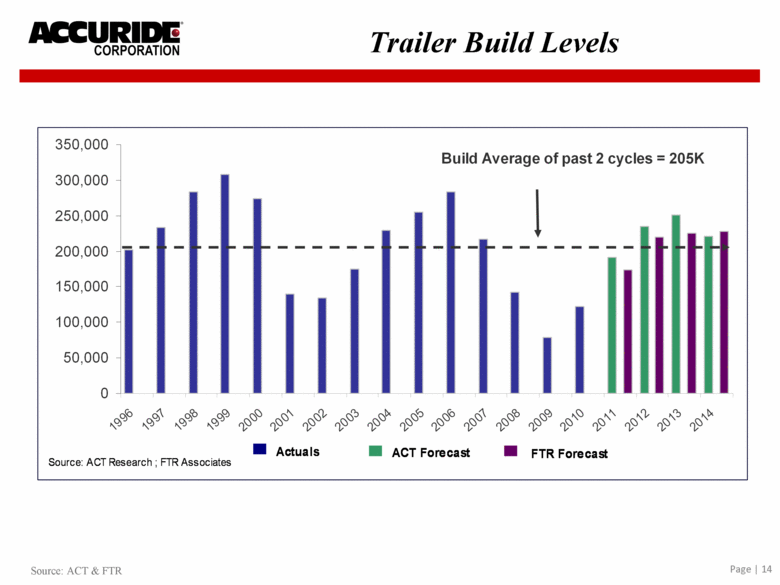
Source: ACT & FTR Trailer Build Levels 0 50,000 100,000 150,000 200,000 250,000 300,000 350,000 1996 1997 1998 1999 2000 2001 2002 2003 2004 2005 2006 2007 2008 2009 2010 2011 2012 2013 2014 Build Average of past 2 cycles = 205K U.S. Trailer Source: ACT Research ; FTR Associates Actuals ACT Forecast FTR Forecast |
|
|
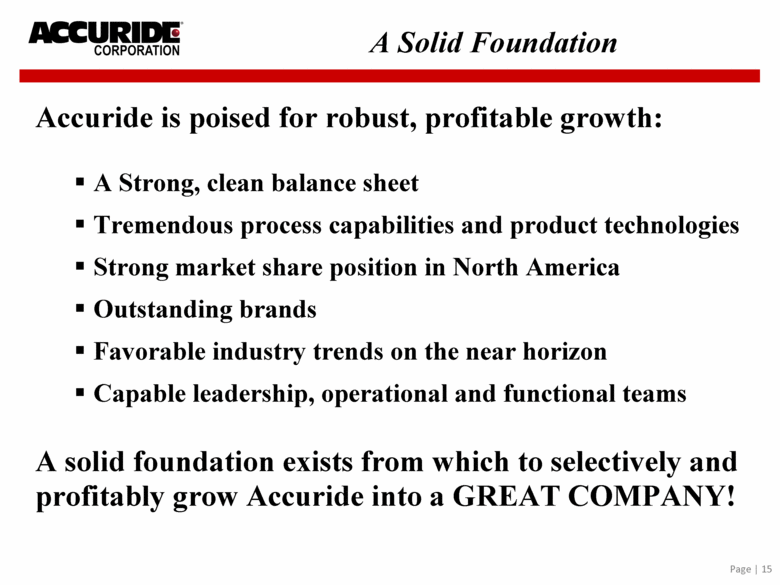
Accuride is poised for robust, profitable growth: A Strong, clean balance sheet Tremendous process capabilities and product technologies Strong market share position in North America Outstanding brands Favorable industry trends on the near horizon Capable leadership, operational and functional teams A solid foundation exists from which to selectively and profitably grow Accuride into a GREAT COMPANY! A Solid Foundation |
|
|
Financials Financials |
|
|
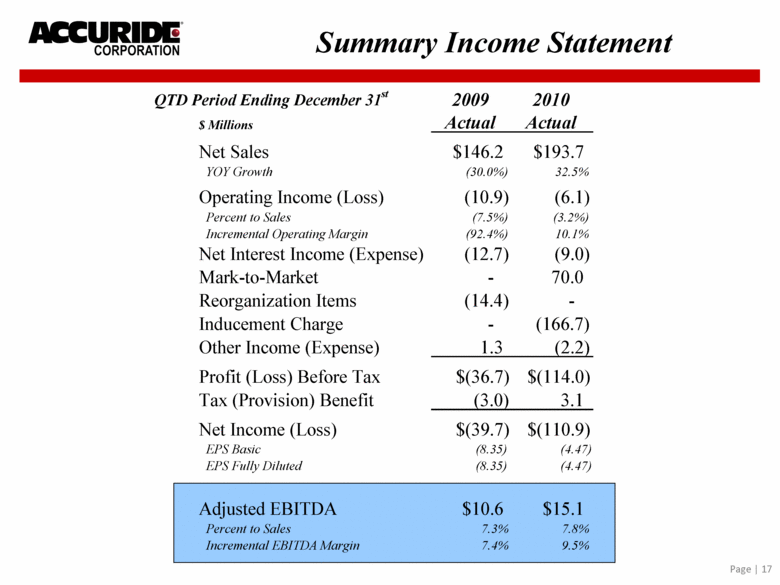
Summary Income Statement QTD Period Ending December 31 st 2009 2010 $ Millions Actual Actual Net Sales $146.2 $193.7 YOY Growth (30.0%) 32.5% Operating Income (Loss) (10.9) (6.1) Percent to Sales (7.5%) (3.2%) Incremental Operating Margin (92.4%) 10.1% Net Interest Income (Expense) (12.7) (9.0) Mark-to-Market - 70.0 Reorganization Items (14.4) - Inducement Charge - (166.7) Other Income (Expense) 1.3 (2.2) Profit (Loss) Before Tax $(36.7) $(114.0) Tax (Provision) Benefit (3.0) 3.1 Net Income (Loss) $(39.7) $(110.9) EPS Basic (8.35) (4.47) EPS Fully Diluted (8.35) (4.47) Adjusted EBITDA $10.6 $15.1 Percent to Sales 7.3% 7.8% Incremental EBITDA Margin 7.4% 9.5% |
|
|
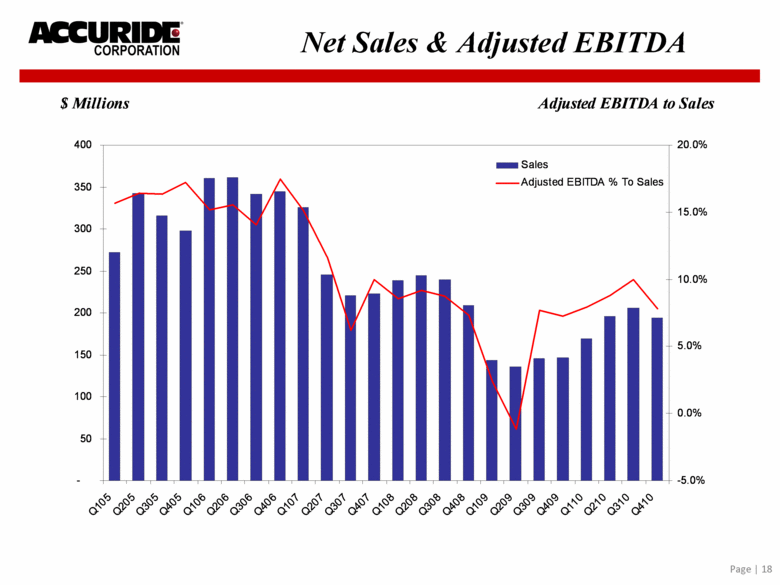
Net Sales & Adjusted EBITDA |
|
|
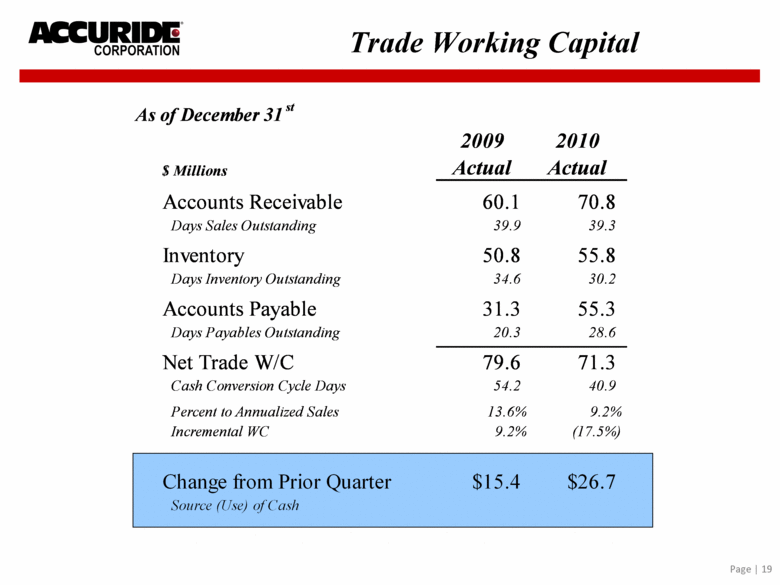
Trade Working Capital |
|
|
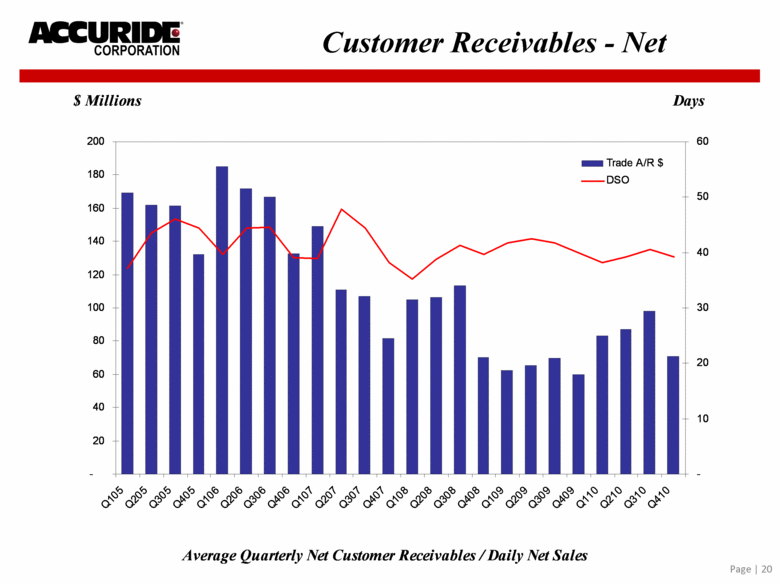
Customer Receivables - Net |
|
|
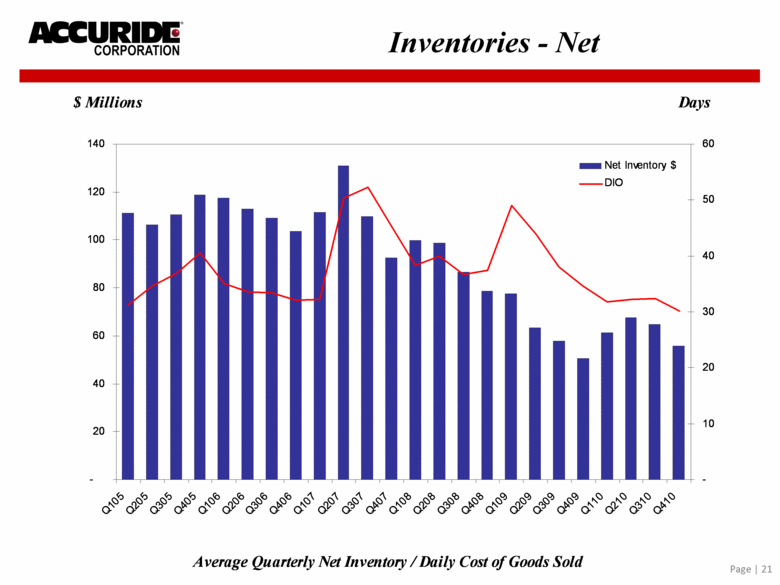
Inventories - Net |
|
|
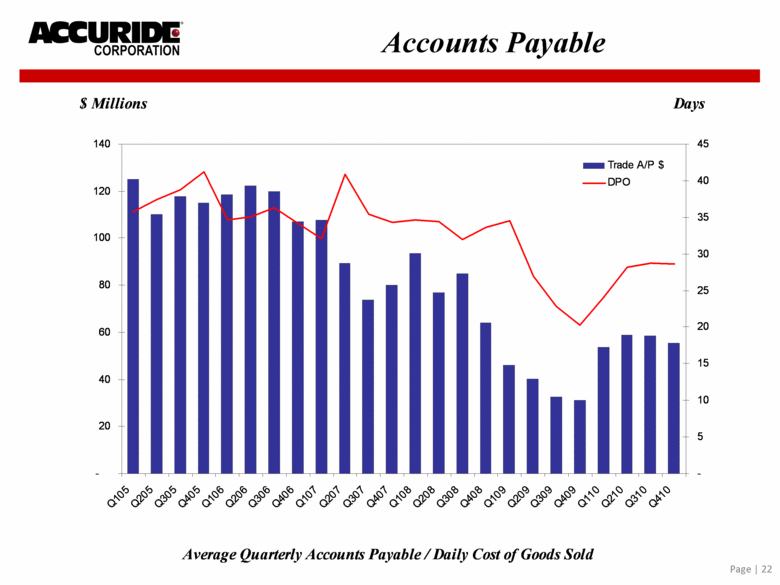
Accounts Payable |
|
|
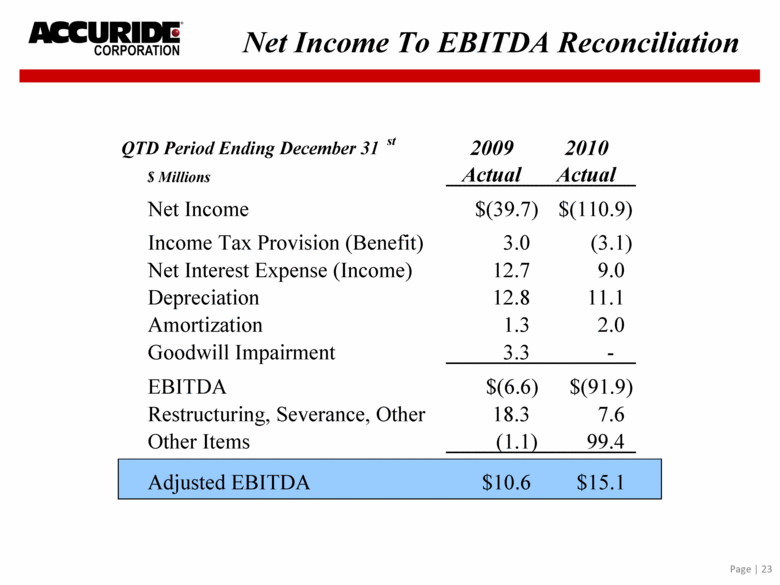
Net Income To EBITDA Reconciliation QTD Period Ending December 31 st 2009 2010 $ Millions Actual Actual Net Income $(39.7) $(110.9) Income Tax Provision (Benefit) 3.0 (3.1) Net Interest Expense (Income) 12.7 9.0 Depreciation 12.8 11.1 Amortization 1.3 2.0 Goodwill Impairment 3.3 - EBITDA $(6.6) $(91.9) Restructuring, Severance, Other 18.3 7.6 Other Items (1.1) 99.4 Adjusted EBITDA $10.6 $15.1 |
|
|
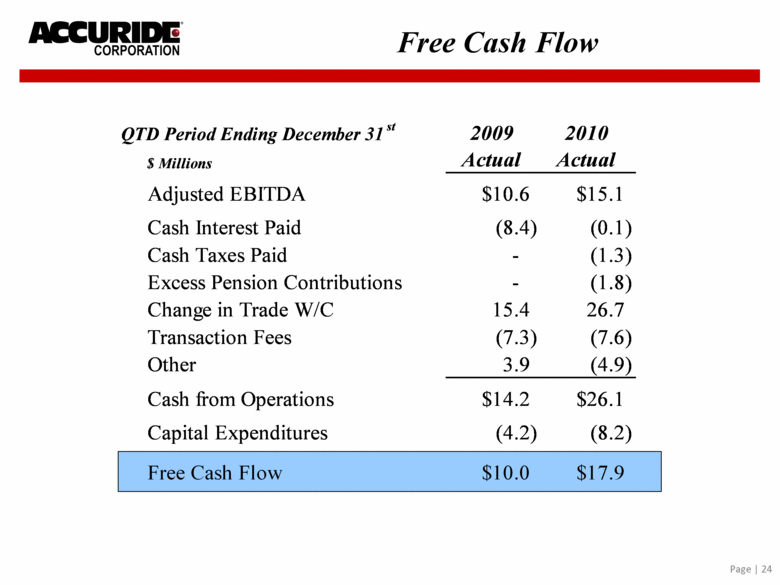
Free Cash Flow |
|
|
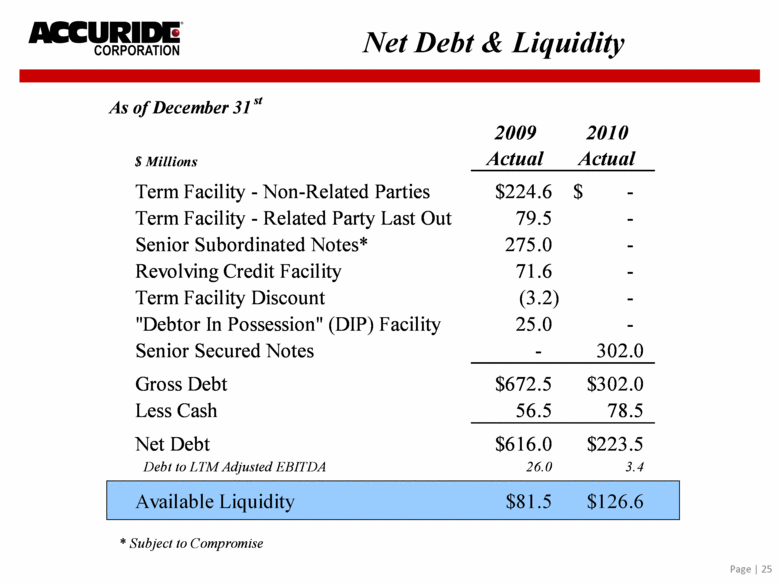
Net Debt & Liquidity |
|
|
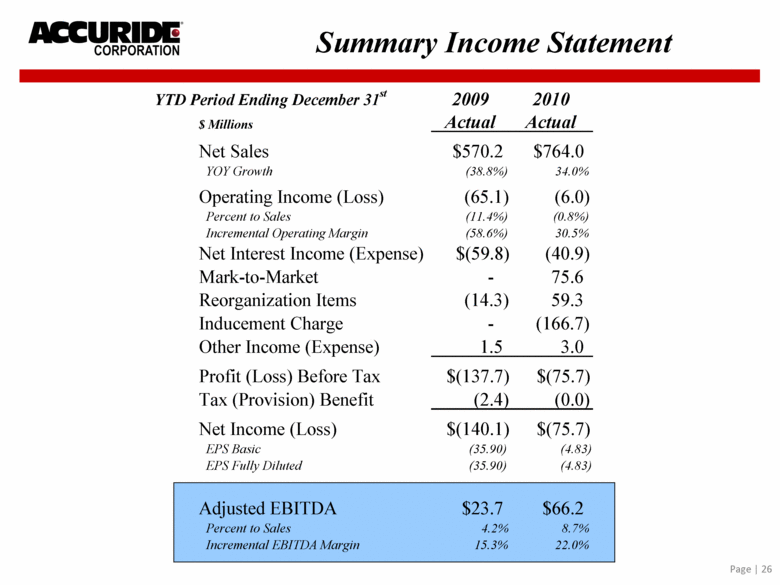
Summary Income Statement YTD Period Ending December 31 st 2009 2010 $ Millions Actual Actual Net Sales $570.2 $764.0 YOY Growth (38.8%) 34.0% Operating Income (Loss) (65.1) (6.0) Percent to Sales (11.4%) (0.8%) Incremental Operating Margin (58.6%) 30.5% Net Interest Income (Expense) $(59.8) (40.9) Mark-to-Market - 75.6 Reorganization Items (14.3) 59.3 Inducement Charge - (166.7) Other Income (Expense) 1.5 3.0 Profit (Loss) Before Tax $(137.7) $(75.7) Tax (Provision) Benefit (2.4) (0.0) Net Income (Loss) $(140.1) $(75.7) EPS Basic (35.90) (4.83) EPS Fully Diluted (35.90) (4.83) Adjusted EBITDA $23.7 $66.2 Percent to Sales 4.2% 8.7% Incremental EBITDA Margin 15.3% 22.0% |
|
|
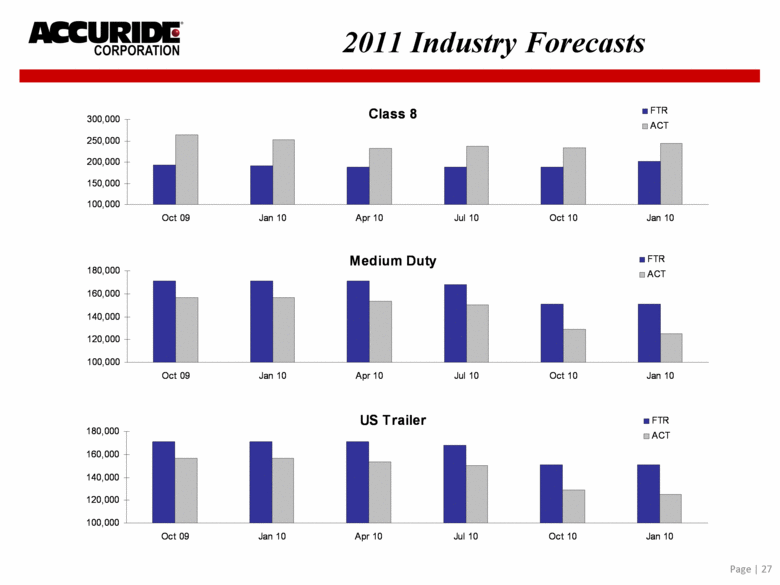
2011 Industry Forecasts |
|
|
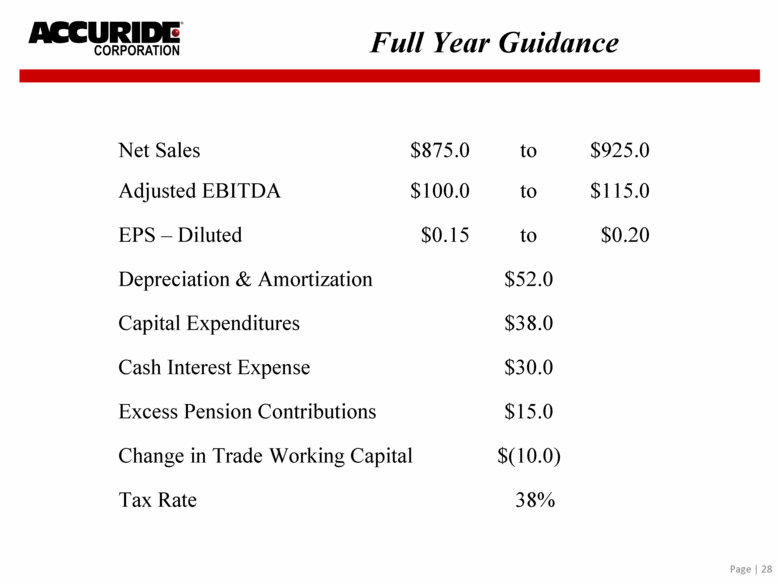
Full Year Guidance Net Sales $875.0 to $925.0 Adjusted EBITDA $100.0 to $115.0 EPS – Diluted $0.15 to $0.20 Depreciation & Amortization $52.0 Capital Expenditures $38.0 Cash Interest Expense $30.0 Excess Pension Contributions $15.0 Change in Trade Working Capital $(10.0) Tax Rate 38% |
|
|
Financials Questions |
|
|
Financials Appendix |
|
|
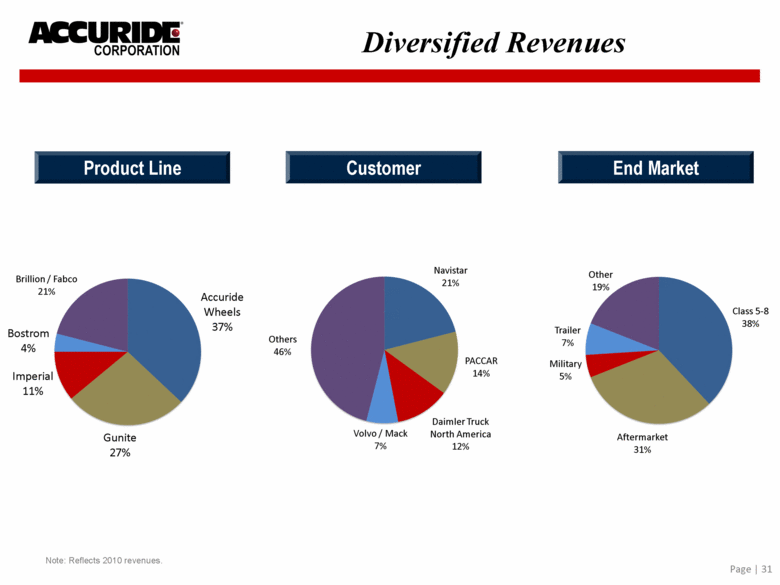
Note: Reflects 2010 revenues. Product Line Customer End Market Diversified Revenues |
|
|
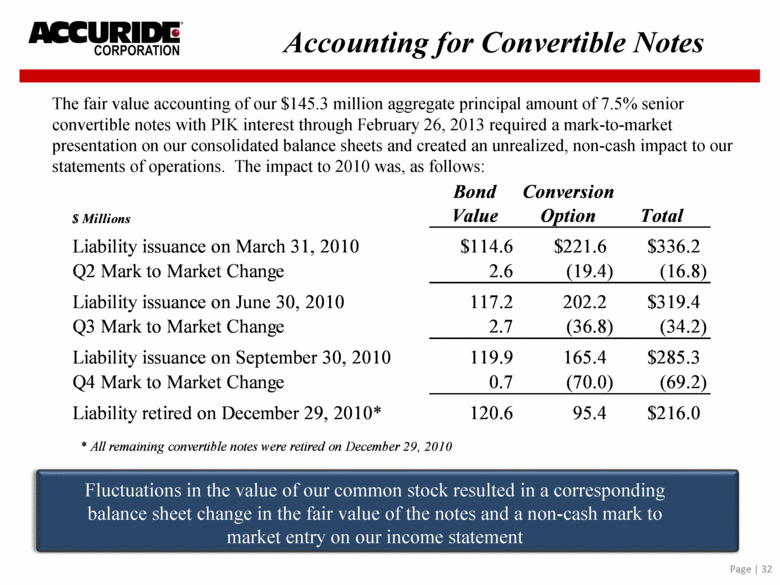
The fair value accounting of our $145.3 million aggregate principal amount of 7.5% senior convertible notes with PIK interest through February 26, 2013 required a mark-to-market presentation on our consolidated balance sheets and created an unrealized, non-cash impact to our statements of operations. The impact to 2010 was, as follows: Fluctuations in the value of our common stock resulted in a corresponding balance sheet change in the fair value of the notes and a non-cash mark to market entry on our income statement Accounting for Convertible Notes |

