Attached files
| file | filename |
|---|---|
| EX-99.1 - EXHIBIT 99.1 - DEX ONE Corp | a6622853ex99-1.htm |
| 8-K - DEX ONE CORPORATION 8-K - DEX ONE Corp | a6622853.htm |
Exhibit 99.2

2010 Results Information Package February 24, 2011
Safe Harbor Statement Certain statements contained in this press release regarding Dex One Corporation’s future operating results, performance, business plans, prospects, guidance and any other statements not constituting historical fact are “forward-looking statements” subject to the safe harbor created by the Private Securities Litigation Reform Act of 1995. Where possible, the words “believe,” “expect,” “anticipate,” “intend,” “should,” “will,” “would,” “planned,” “estimated,” “potential,” “goal,” “outlook,” “may,” “predicts,” “could,” or the negative of such terms, or other comparable expressions, as they relate to Dex One Corporation or its management, have been used to identify such forward-looking statements. All forward-looking statements reflect only Dex One Corporation’s current beliefs and assumptions with respect to future business plans, prospects, decisions and results, and are based on information currently available to Dex One Corporation. Accordingly, the statements are subject to significant risks, uncertainties and contingencies, which could cause Dex One Corporation’s actual operating results, performance or business plans or prospects to differ materially from those expressed in, or implied by, these statements.Factors that could cause actual results to differ materially from current expectations include risks and other factors described in Dex One Corporation’s publicly available reports filed with the SEC, which contain a discussion of various factors that may affect Dex One Corporation’s business or financial results. Such risks and other factors, which in some instances are beyond Dex One Corporation’s control, include: the continuing decline in the use of print directories; increased competition, particularly from existing and emerging online technologies; ongoing weak economic conditions and continued decline in advertising sales; our ability to collect trade receivables from local advertisers to whom we extend credit; our ability to generate sufficient cash to service our debt; our ability to comply with the financial covenants contained in our debt agreements and the potential impact to operations and liquidity as a result of restrictive covenants in such debt agreements; our ability to refinance or restructure our debt on reasonable terms and conditions as might be necessary from time to time; increasing interest rates; changes in the company’s and the company’s subsidiaries credit ratings; changes in accounting standards; regulatory changes and judicial rulings impacting our business; adverse results from litigation, governmental investigations or tax related proceedings or audits; the effect of labor strikes, lock-outs and negotiations; successful realization of the expected benefits of acquisitions, divestitures and joint ventures; our ability to maintain agreements with Qwest, CenturyLink and AT&T and other major Internet search and local media companies; our reliance on third-party vendors for various services; and other events beyond our control that may result in unexpected adverse operating results. Dex One Corporation is not responsible for updating the information contained in this press release beyond the published date, or for changes made to this document by wire services or Internet service providers. This press release is being furnished to the SEC through a Form 8-K. The company’s 2010 Annual Report on Form 10-K for the period ended December 31, 2010 to be filed with the SEC may contain updates to the information included in this release.We reference non-GAAP financial measures in this presentation. Please see the appendix for a reconciliation of non-GAAP measures to the most comparable GAAP measures.
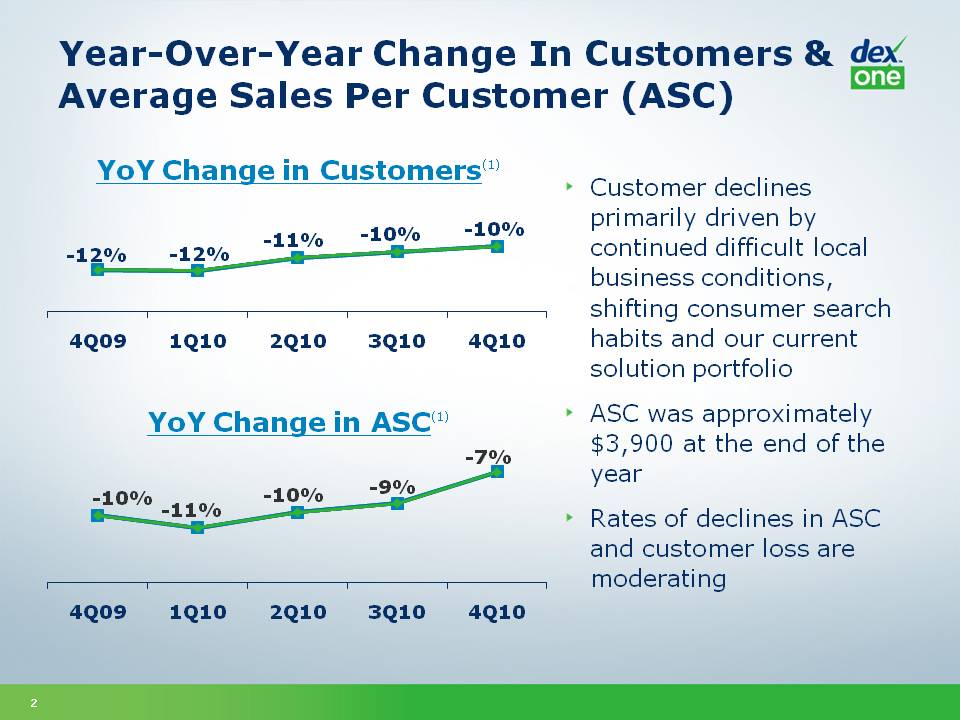
Year-Over-Year Change In Customers & Average Sales Per Customer (ASC) YoY Change in Customers(1) Customer declines primarily driven by continued difficult local business conditions, shifting consumer search habits and our current solution portfolio ASC was approximately $3,900 at the end of the year Rates of declines in ASC and customer loss are moderating YoY Change in ASC(1) -12% -11% -10% 4Q09 1Q10 2Q10 3Q10 4Q10 -9% -7%
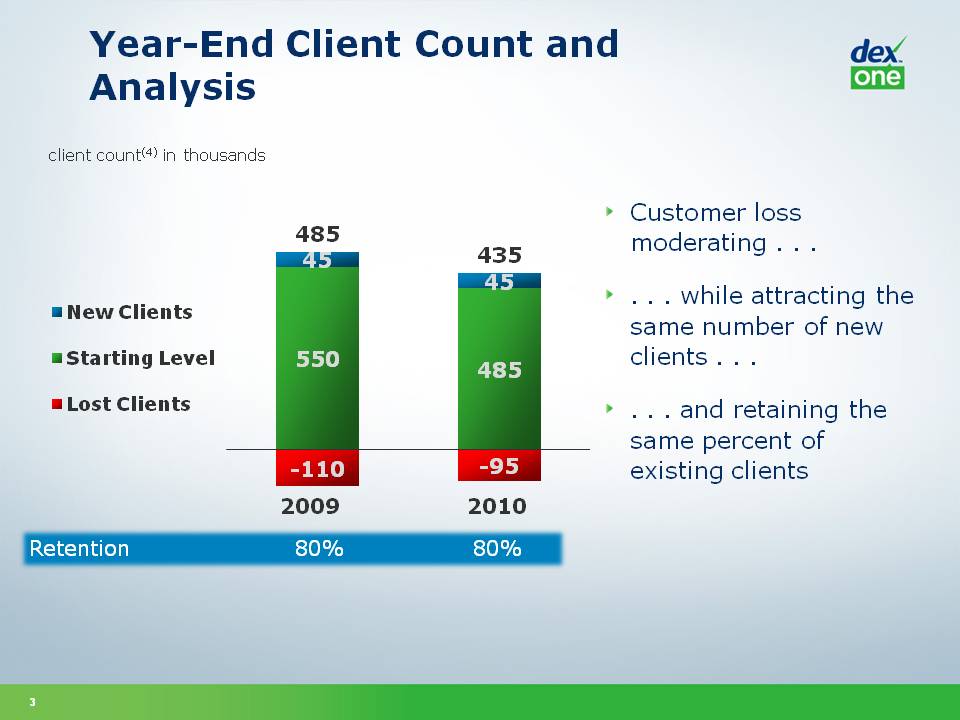
Year-End Client Count and Analysis Customer loss moderating while attracting the same number of new clients and retaining the same percent of existing clients 2009 2010 client count(4) in thousands Retention 80% New Clients Starting Level Lost Clients 485 45 550 -110 435 -95
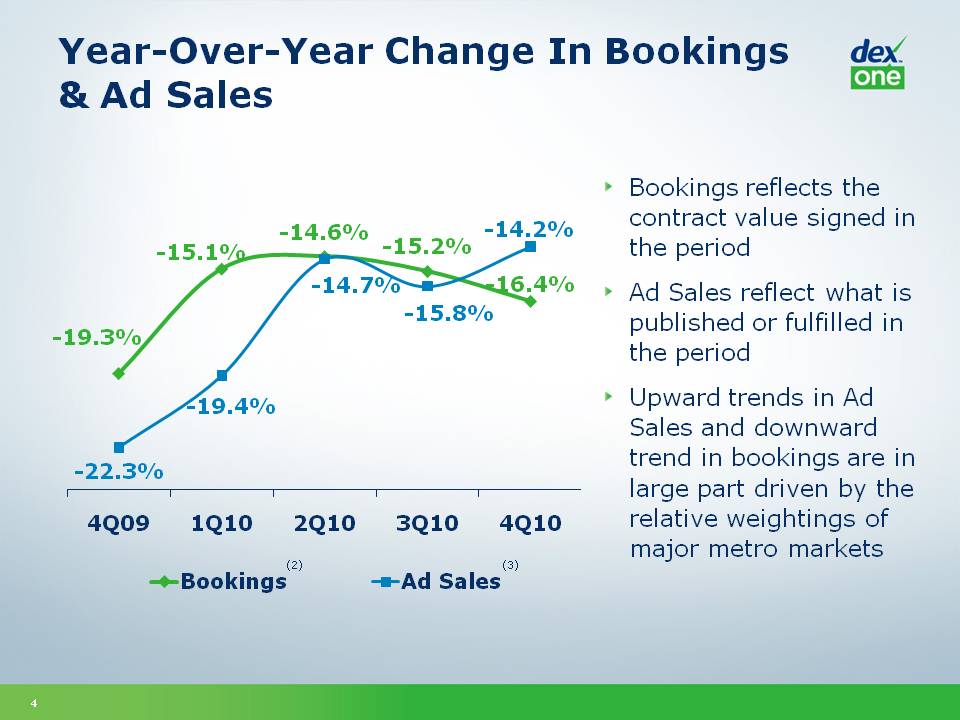
Year-Over-Year Change In Bookings & Ad Sales Bookings reflects the contract value signed in the period Ad Sales reflect what is published or fulfilled in the period Upward trends in Ad Sales and downward trend in bookings are in large part driven by the relative weightings of major metro markets (2) (3) 4Q09 1Q10 2Q10 3Q10 4Q10 -19.3% -15.1% -14.6% -15.2% -14.2% -22.3% 19.4% 14.7% 15.8% -16.4%
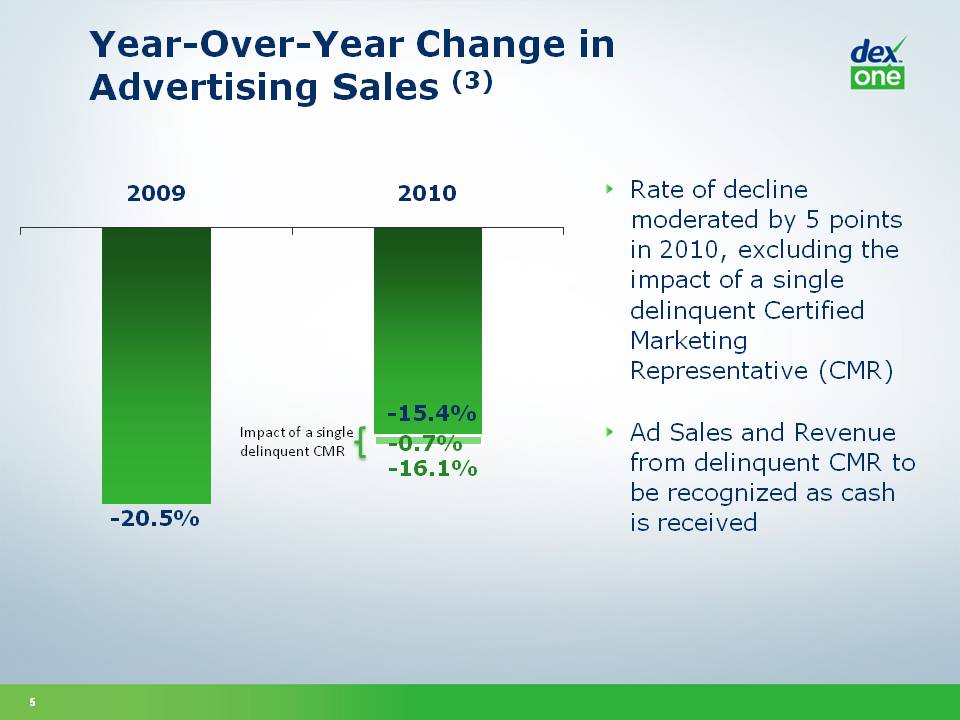
Year-Over-Year Change in Advertising Sales (3) Rate of decline moderated by 5 points in 2010, excluding the impact of a single delinquent Certified Marketing Representative (CMR) Ad Sales and Revenue from delinquent CMR to be recognized as cash is received 2009 -20.5% 2010 -15.4% -0.7% -16.1%
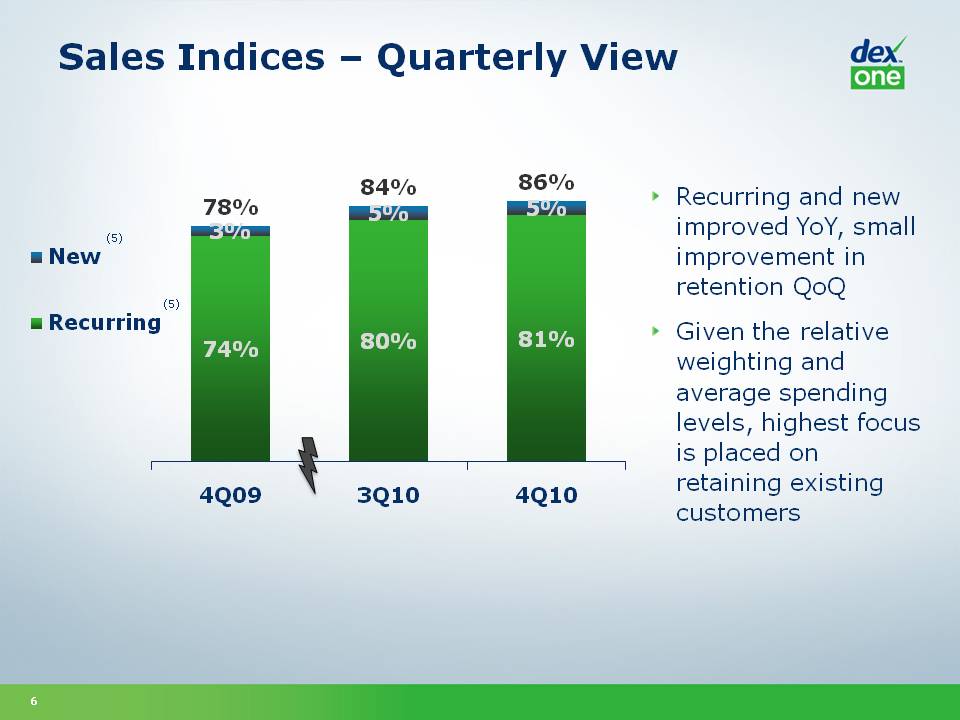
Sales Indices Quarterly View Recurring and new improved YoY, small improvement in retention QoQ Given the relative weighting and average spending levels, highest focus is placed on retaining existing customers New Recurring (5) 78% 3% 74% 4Q09 84% 5% 80% 3Q10 86% 81% 4Q10
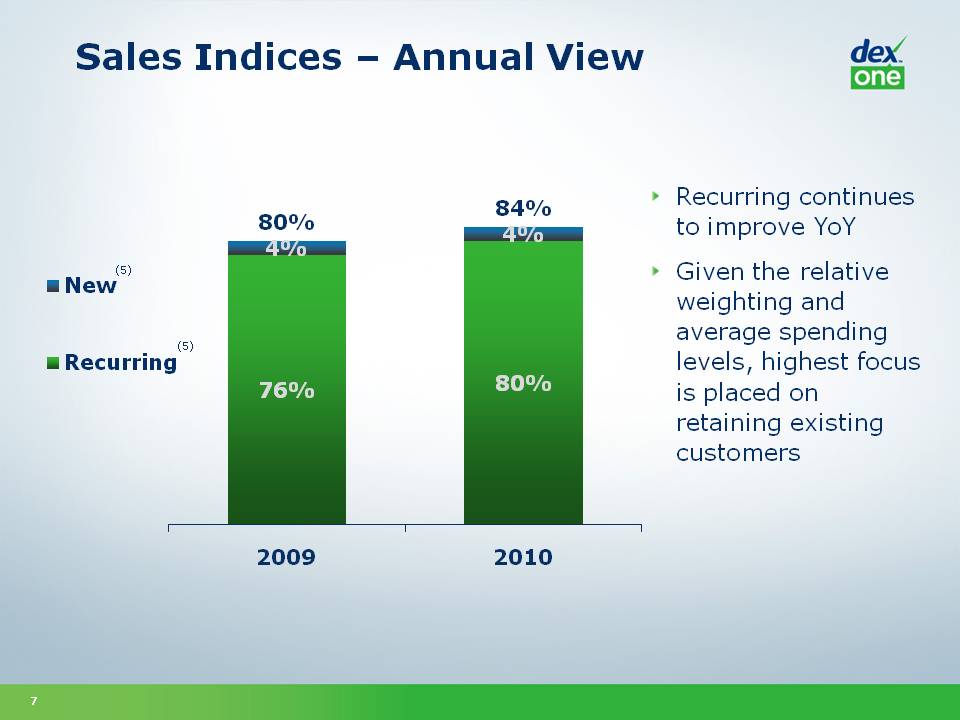
Recurring continues to improve YoY Given the relative weighting and average spending levels, highest focus is placed on retaining existing customers Sales Indices Annual View New Recurring (5) 80% 4% 76% 2009 84% 2010
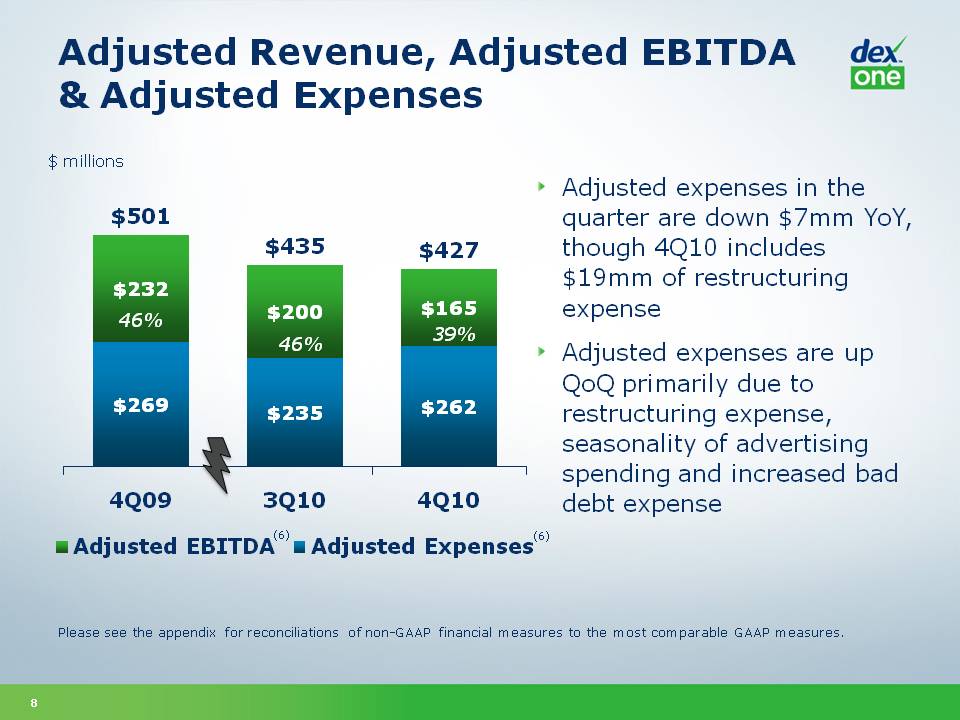
Adjusted Revenue, Adjusted EBITDA & Adjusted Expenses Adjusted expenses in the quarter are down $7mm YoY, though 4Q10 includes $19mm of restructuring expense Adjusted expenses are up QoQ primarily due to restructuring expense, seasonality of advertising spending and increased bad debt expense Please see the appendix for reconciliations of non-GAAP financial measures to the most comparable GAAP measures. $ millions $501 $232 46% $269 4Q09 $435 $200 $235 3Q10 $427 $165 39% $262 4Q10 Adjusted EBITDA (6) Adjusted Expenses
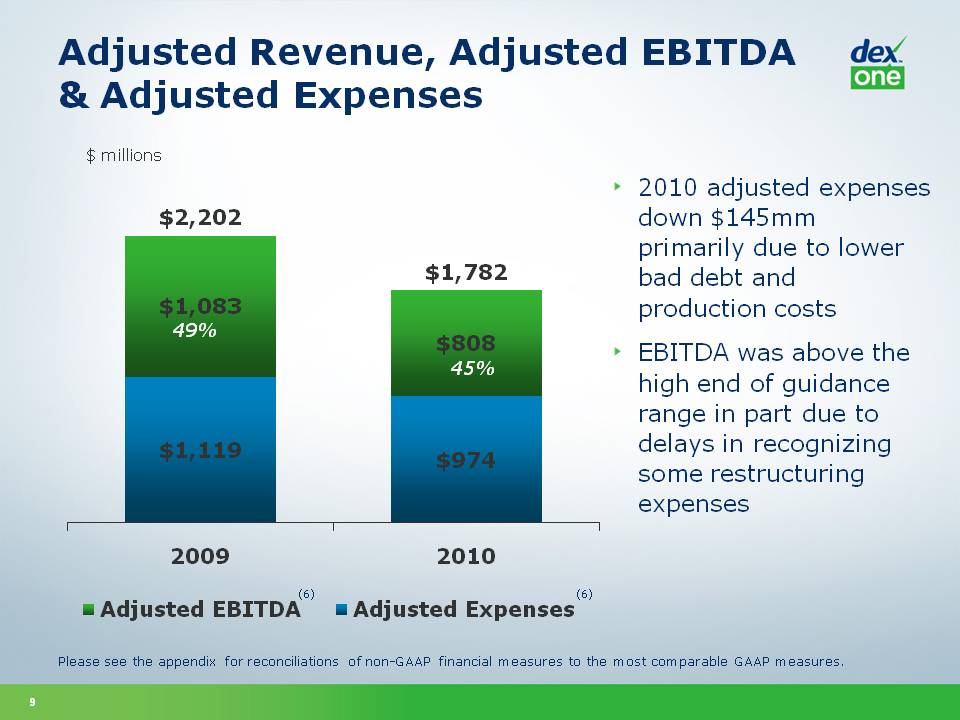
Adjusted Revenue, Adjusted EBITDA & Adjusted Expenses 2010 adjusted expenses down $145mm primarily due to lower bad debt and production costs EBITDA was above the high end of guidance range in part due to delays in recognizing some restructuring expenses $ millions $2,202 $1,083 $1,119 2009 $1,782 $808 $974 2010 Adjusted EBITDA Adjusted Expenses (6) 49% 45% Please see the appendix for reconciliations of non-GAAP financial measures to the most comparable GAAP measures.
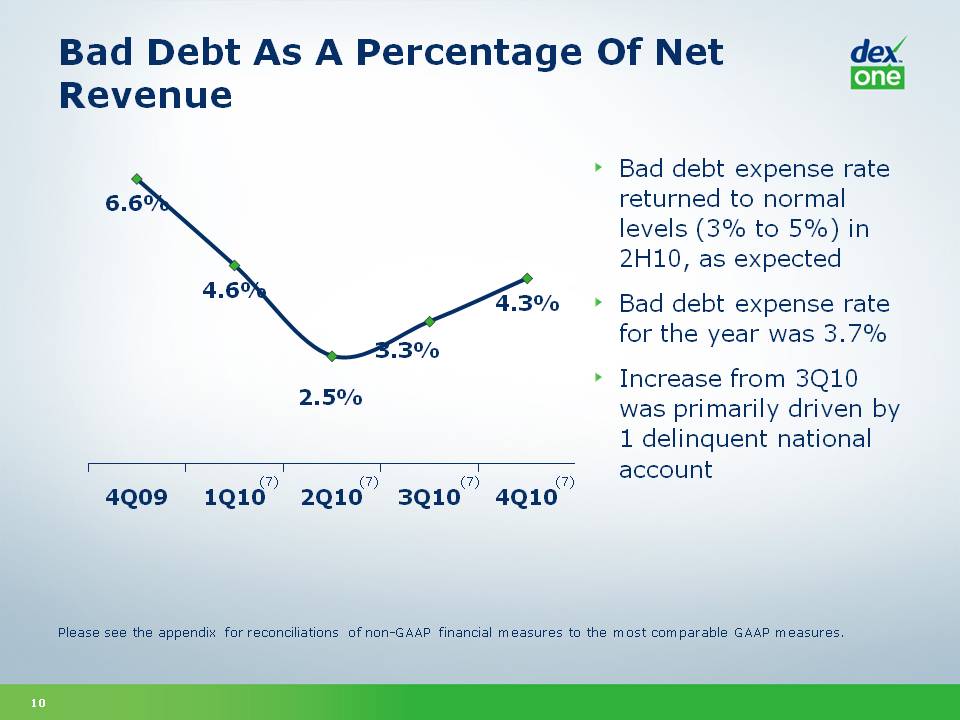
Bad Debt As A Percentage Of Net Revenue Bad debt expense rate returned to normal levels (3% to 5%) in 2H10, as expected Bad debt expense rate for the year was 3.7% Increase from 3Q10 was primarily driven by 1 delinquent national account Please see the appendix for reconciliations of non-GAAP financial measures to the most comparable GAAP measures. 6.6% 4.6% 2.5% 3.3% 4.3% 4Q09 1Q10 2Q10 3Q10 4Q10 (7)
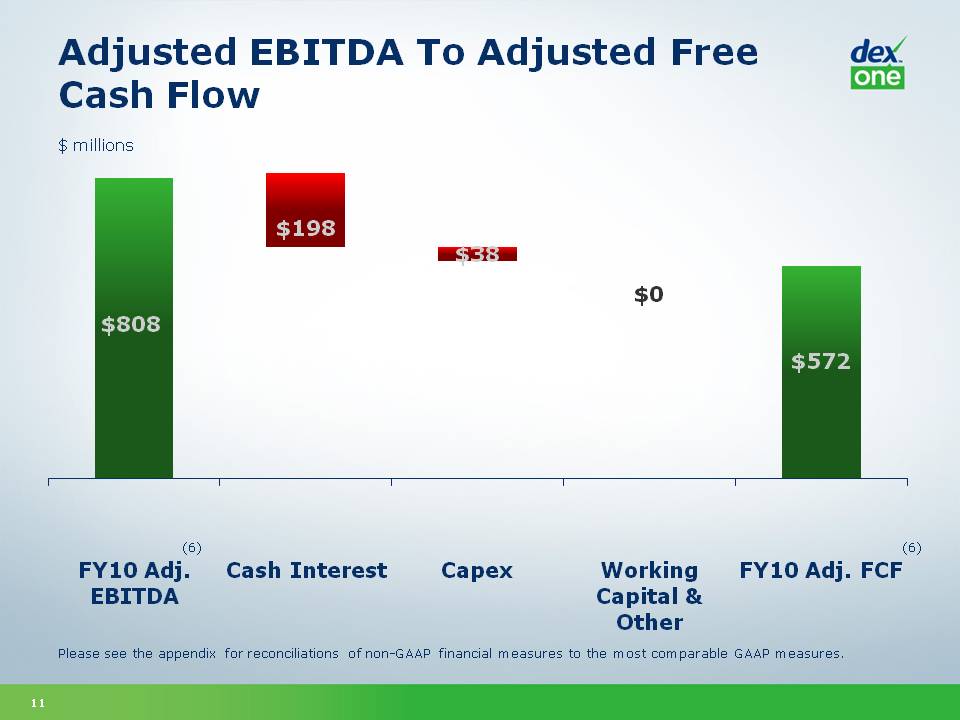
Adjusted EBITDA To Adjusted Free Cash Flow Please see the appendix for reconciliations of non-GAAP financial measures to the most comparable GAAP measures. $ millions $808 $198 $38 $0 $572 FY10 Adj. EBITDA (6) Cash Interest Capex Working Capital & Other FY10 Adj. FCF
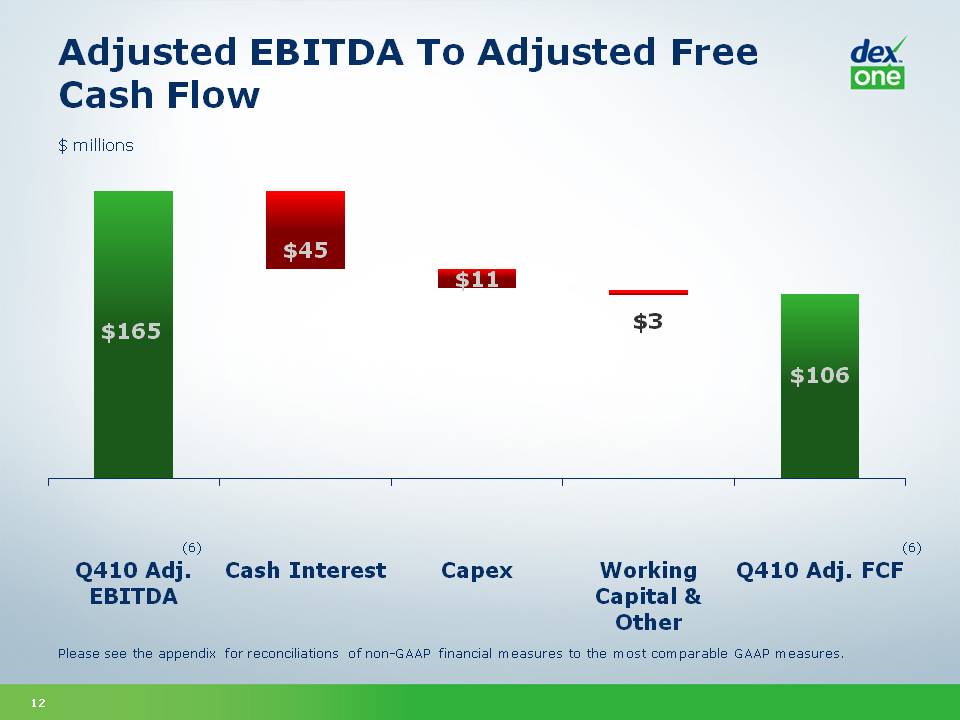
Adjusted EBITDA To Adjusted Free Cash Flow $ millions $165 $45 $11 $3 $106 Q410 Adj. EBITDA (6) Cash Interest Capex Working Capital & Other Q410 Adj. FCF Please see the appendix for reconciliations of non-GAAP financial measures to the most comparable GAAP measures.
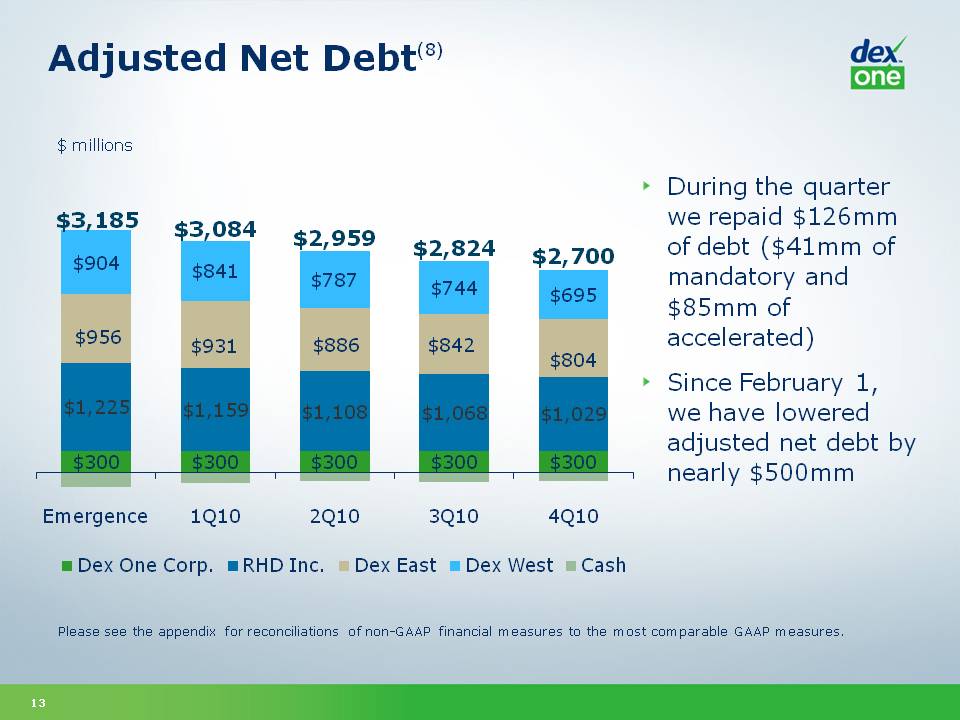
Adjusted Net Debt(8) $ millions During the quarter we repaid $126mm of debt ($41mm of mandatory and $85mm of accelerated) Since February 1, we have lowered adjusted net debt by nearly $500mm Please see the appendix for reconciliations of non-GAAP financial measures to the most comparable GAAP measures. $3,185 $904 $956 $1,225 $300 Emergence $3,084 $841 $931 $1,159 $300 1Q10 $2,959 $787 $886 $1,108 $300 2Q10 $2,824 $744 $842 $1,068 $300 3Q10 $2,700 $695 $804 $1,029 $300 4Q10 Dex One Corp. RHD Inc. Dex East Dex West Cash
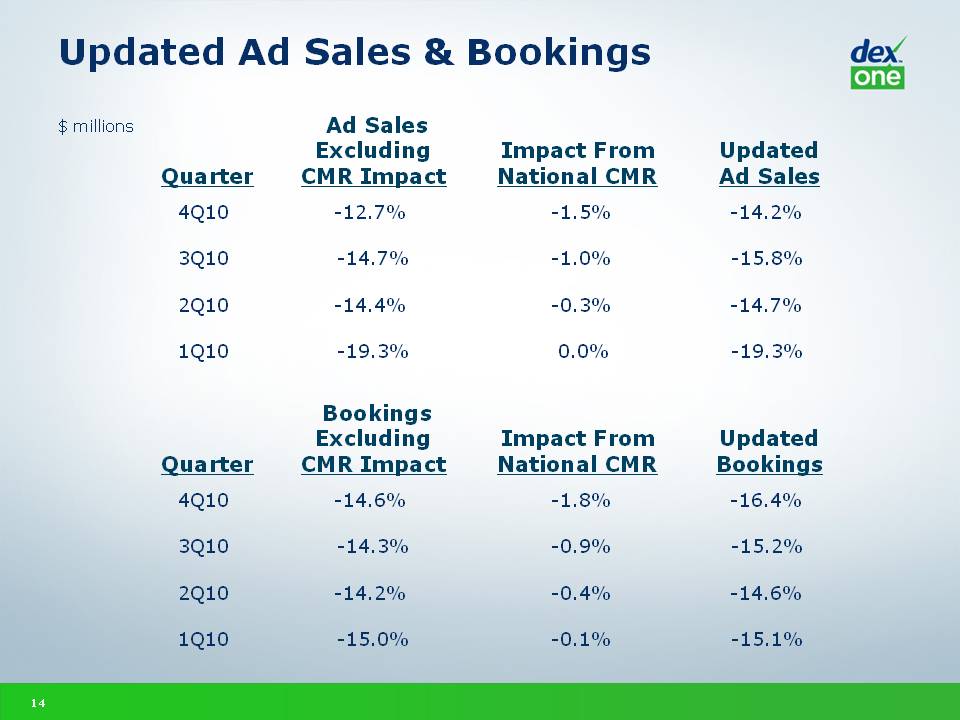
Updated Ad Sales & Bookings Ad Sales Excluding Impact From Updated Quarter CMR Impact National CMR Ad Sales 4Q10 -12.7% -1.5% -14.2% 3Q10 -14.7% -1.0% -15.8% 2Q10 -14.4% -0.3% -14.7% 1Q10 -19.3% 0.0% -19.3% $ millions Bookings Excluding Impact From Updated Quarter CMR Impact National CMR Bookings 4Q10 -14.6% -1.8% -16.4% 3Q10 -14.3% -0.9% -15.2% 2Q10 -14.2% -0.4% -14.6% 1Q10 -15.0% -0.1% -15.1%
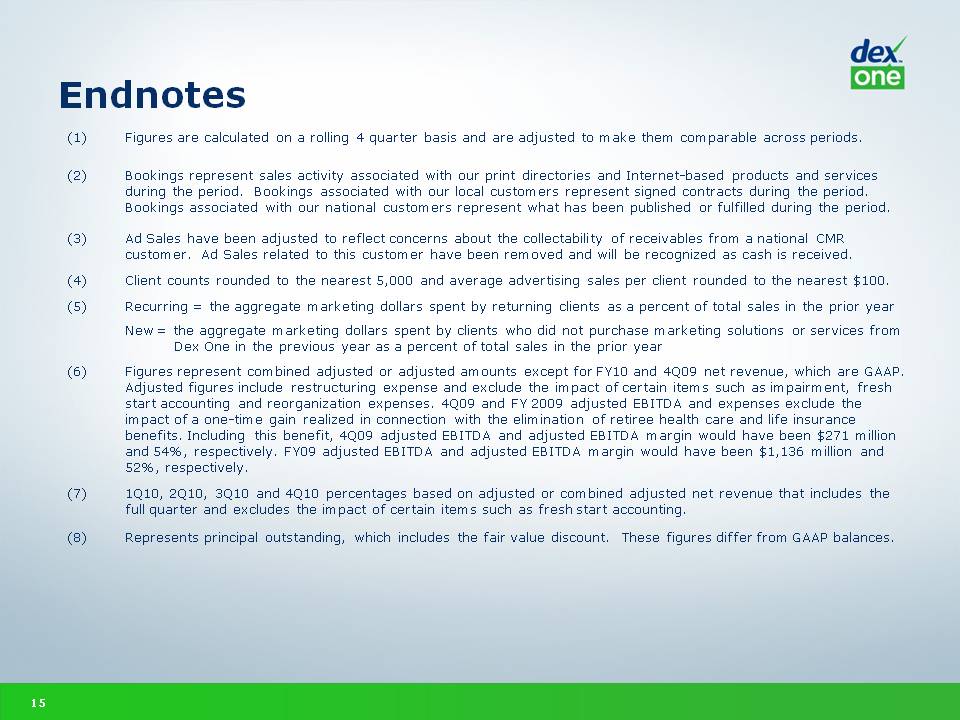
Endnotes (1) Figures are calculated on a rolling 4 quarter basis and are adjusted to make them comparable across periods. (2) Bookings represent sales activity associated with our print directories and Internet-based products and services during the period. Bookings associated with our local customers represent signed contracts during the period. Bookings associated with out national customers represent what has been published or fulfilled during the period. (3) Ad Sales have been adjusted to reflect concerns about the collectability of receivables from a national CMR customer. Ad Sales related to this customer have been removed and will be recognized as cash is received. (4) Client counts rounded to the nearest 5,000 and average advertising sales per client rounded to the nearest $100. (5) Recurring = the aggregate marketing dollars spent by returning clients as a percent of total sales in the prior year New = the aggregate marketing dollars spent by clients who did not purchase marketing solutions or services from Dex One in the previous year as a percent of total sales in the prior year (6) Figures represent comnbined adjusted or adjusted amounts except for FY10 and 4Q09 net revenue, which are GAAP. Adjusted figures include restructuring expense and exclude the impact of certain items such as impairment, fresh start accounting expenses. 4Q09 and FY 2009 adjusted EBITDA and expenses exclude the impact of a one-time gain realized in connection with the elimination of retiree health care and life insurance benefits. Including this benefit, 4Q09 adjusted EBITDA and adjusted EBITDA margin would have been $271 million and 54%, respectively. FY09 adjusted EBITDA and adjusted EBITDA margin would have been $1,136 million and 52%, respectively. (7) 1Q10, 2Q10, 3Q10 and 4Q10 percentages based on adjusted or combined adjusted net revenue that includes the full quarter and excludes the impact of certain items such as fresh start accounting. (8) Represents principal outstanding, which includes the fair value discount. These figures differ from GAAP balances.

Appendix
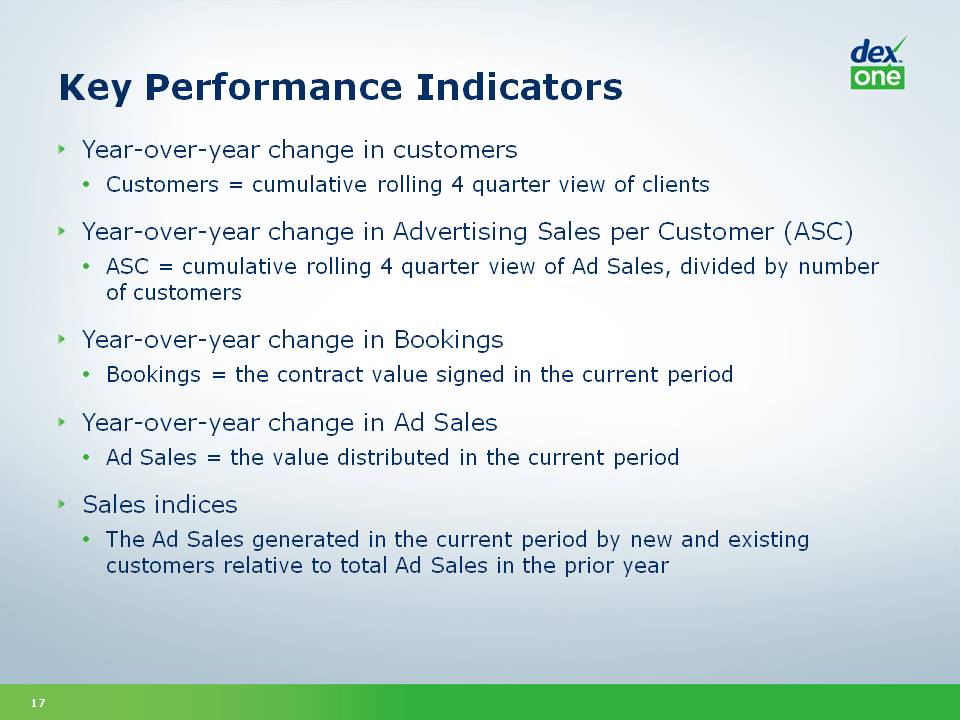
Key Performance Indicators Other Placeholder: Year-over-year change in customers Customers = cumulative rolling 4 quarter view of clients Year-over-year change in Advertising Sales per Customer (ASC) ASC = cumulative rolling 4 quarter view of Ad Sales, divided by number of customers Year-over-year change in Bookings Bookings = the contract value signed in the current period Year-over-year change in Ad Sales Ad Sales = the value distributed in the current period Sales indices The Ad Sales generated in the current period by new and existing customers relative to total Ad Sales in the prior year
GAAP Reconciliations Fresh Start And Other Adjustments The Company adopted fresh start accounting and reporting effective February 1, 2010, the Fresh Start Reporting Date. The financial statements as of the Fresh Start Reporting Date will report the results of Dex One with no beginning retained earnings or accumulated deficit. Any presentation of Dex One represents the financial position and results of operations of a new reporting entity and is not comparable to prior periods presented by the Predecessor Company. The financial statements for periods ended prior to the Fresh Start Reporting Date do not include the effect of any changes in our capital structure or changes in the fair value of assets and liabilities as a result of fresh start accounting. As a result of the deferral and amortization method of revenue recognition, recognized advertising revenues reflect the amortization of advertising sales consummated in prior periods as well as in the current period. The adoption of fresh start accounting has a significant impact on the financial position and results of operations of the Company subsequent to the Fresh Start Reporting Date. Fresh start accounting precludes us from recognizing deferred revenue of $69.0 million, $175.8 million and $790.9 million and certain deferred expenses of $15.5 million, $37.9 million and $172.6 million during the three months ended December 30, 2010, the three months ended September 30, 2010 and eleven months ended December 31, 2010, respectively, associated with directories that published prior to the Fresh Start Reporting Date. Thus, our reported results for the three and eleven months ended December 31, 2010 and three months ended September 30, 2010 are not indicative of our underlying operating and financial performance and are not comparable to any prior period presentation. Accordingly, management has provided a non-GAAP presentation of “Adjusted” and “Combined Adjusted” results for the three months and year ended December 31, 2010 and three months ended September 30, 2010. Management believes that these non-GAAP financial measures are important indicators of our operations because they exclude items that may not be indicative of, or related to, our core operating results, and provide a better baseline for analyzing our underlying business. Adjusted results adjust GAAP results of the Company for the three months ended December 31, 2010 and three months ended September 30, 2010 to (i) eliminate the fresh start accounting impact on revenue and certain related expenses noted above and (ii) exclude cost-uplift recorded under fresh start accounting of $3.6 million for both quarters. Combined Adjusted results (1) combines GAAP results of the Company for the eleven months ended December 31, 2010 and GAAP results of the Predecessor Company for the one month ended January 31, 2010 and (2) adjusts these combined amounts to (i) eliminate the fresh start accounting impact on revenue and certain related expenses noted above and (ii) exclude cost-uplift recorded under fresh start accounting of $12.3 million for the eleven months ended December 31, 2010.
GAAP Reconciliations – Fresh Start And Other Adjustments (cont’d) Other Placeholder: Deferred directory costs, such as print, paper, distribution and commissions, relate to directories that have not yet been published and have been recorded at fair value, determined as (a) the estimated billable value of the published directory less (b) the expected costs to complete the directory, plus (c) a normal profit margin. This incremental fresh start accounting adjustment to step up the recorded value of the deferred directory costs to fair value is hereby referred to as “cost-uplift”. Cost-uplift will be amortized over the terms of the applicable directories, not to exceed twelve months. Unamortized cost-uplift at December 31, 2010 is $2.1 million, which will be recognized during the first quarter of 2011.Management believes that the non-GAAP presentation of Adjusted and Combined Adjusted results will help financial statement users better understand the material impact fresh start accounting has on the Company’s results of operations for the three and eleven months ended December 31, 2010 and three months ended September 30, 2010 and also offers a non-GAAP normalized comparison to GAAP results of the Predecessor Company for the three months and year ended December 31, 2009. The non-GAAP Adjusted and Combined Adjusted results are reconciled to the most comparable GAAP measures. While the non-GAAP Adjusted and Combined Adjusted results exclude the effects of fresh start accounting and certain other items, such as goodwill and intangible asset impairment charges during the three months ended September 30, 2010 and eleven months ended December 31, 2010, it must be noted that the non-GAAP Adjusted and Combined Adjusted results of the Successor Company are not strictly comparable to the Predecessor Company’s GAAP results for the three months and year ended December 31, 2009 or Adjusted Results for the three months and year ended December 31, 2009, which exclude the effects of the intangible asset impairment charge during 2009, and should not be treated as such. We strongly encourage investors and stockholders to review our financial statements and publicly filed reports in their entirety and not rely on any single financial measure.
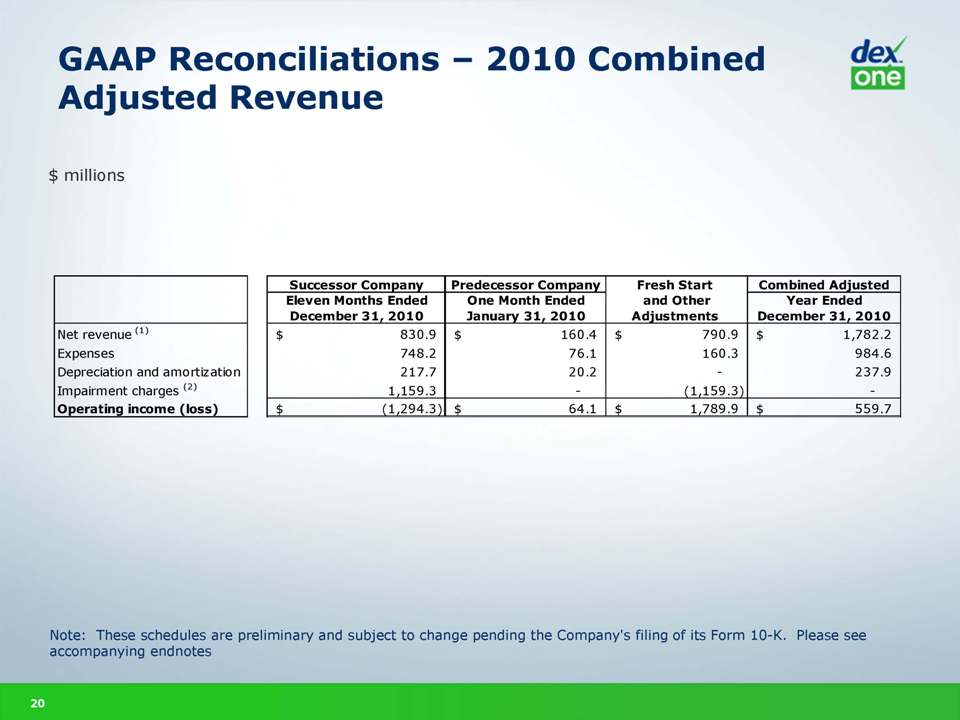
GAAP Reconciliations 2010 Combined Adjusted Revenue $ millions Successor Company Eleven Months Ended December 31,2010 Predecessor Company One Month Ended January 31, 2010 Fresh Start and Other Adjustments Combined Adjusted Year Ended December 31,2010 Net Revenue (1) $830.9 $160.4 $790.9 $1,782.2 Expenses 748.2 76.1 160.3 984.6 Depreciation and amortization 217.7 20.2 237.9 Impairment charges (2) 1,159.3 (1,159.3) Operating income (loss) (1,294.3) $64.1 $1,789.9 $559.7 Note: These schedules are preliminary and subject to change pending the Company's filing of its Form 10-K. Please see accompanying endnotes
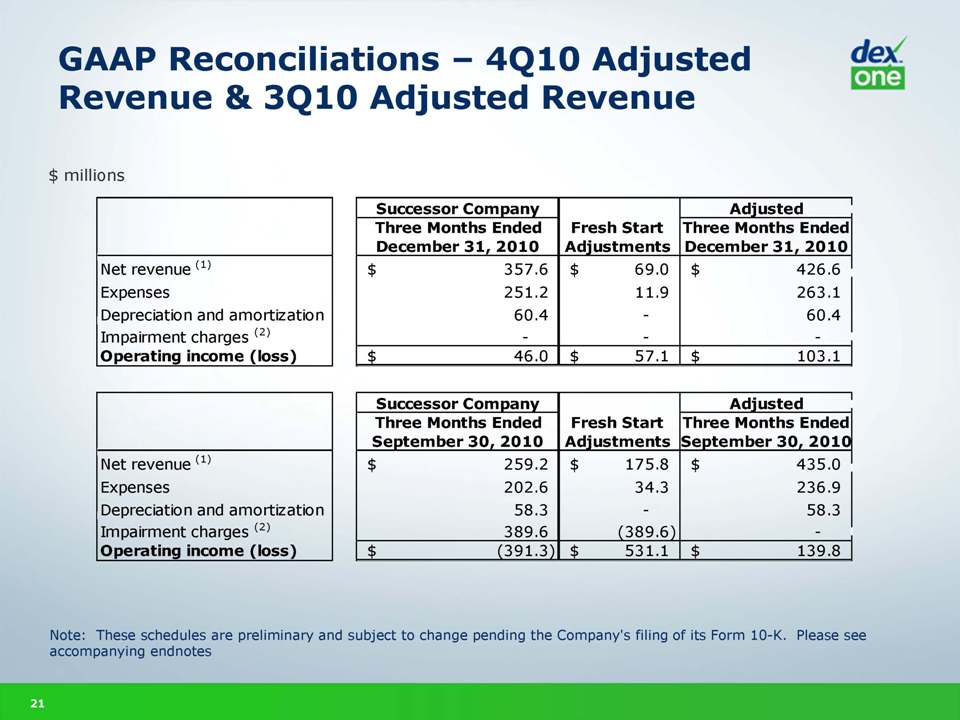
GAAP Reconciliations 4Q10 Adjusted Revenue & 3Q10 Adjusted Revenue $ millions Successor Company Three Months Ended December 31, 2010 Fresh Start Adjustments Adjusted Net Revenue (1) $357.6 $69.0 $426.6 Expenses 251.2 11.9 263.1 Depreciation and amortization 60.4 Impariment charges (2) Operating income (loss) $46.0 $57.1 $103.1 September 30, 2010 $259.2 $175.8 $435.0 202.6 34.3 236.9 58.3 389.6 (389.6) (391.3) $531.1 $139.8 Note: These schedules are preliminary and subject to change pending the Company's filing of its Form 10-K. Please see accompanying endnotes
GAAP Reconciliations 2010 Combined Adjusted EBITDA and 2009, 4Q10, 4Q09 & 3Q10 Adjusted EBITDA EBITDA, Adjusted EBITDA and Combined Adjusted EBITDA are not measurements of operating performance computed in accordance with GAAP and should not be considered as a substitute for net income (loss) prepared in conformity with GAAP. In addition, EBITDA may not be comparable to similarly titled measures of other companies. Management believes that these non-GAAP financial measures are important indicators of our operations because they exclude items that may not be indicative of, or related to, our core operating results, and provide a better baseline for analyzing our underlying business. Adjusted EBITDA of the Successor Company for the three months ended December 31, 2010 and September 30, 2010 is determined by adjusting EBITDA (i) to eliminate the fresh start accounting impact on revenue and certain expenses, (ii) to exclude the impact of cost-uplift recorded under fresh start accounting and (iii) for stock-based compensation expense and long-term incentive program. Adjusted EBITDA of the Successor Company for the three months ended and September 30, 2010 excludes the goodwill and intangible asset impairment charge. Adjusted EBITDA of the Successor Company for the eleven months ended December 31, 2010 is determined by adjusting EBITDA (i) to eliminate the fresh start accounting impact on revenue and certain expenses, (ii) to exclude the impact of cost-uplift recorded under fresh start accounting, (iii) to exclude the goodwill and intangible asset impairment charges and (iv) for stock-based compensation expense and long-term incentive program.Adjusted EBITDA of the Predecessor Company for the one month ended January 31, 2010 is determined by adjusting EBITDA for (i) reorganization items, net and (ii) stock-based compensation expense and long-term incentive program. Adjusted EBITDA of the Predecessor Company for the three months ended December 31, 2009 is determined by adjusting EBITDA (i) for stock-based compensation expense and long-term incentive program, (ii) for reorganization items, net and (iii) to exclude the intangible asset impairment charge during the three months ended December 31, 2009. Adjusted EBITDA of the Predecessor Company for the year ended December 31, 2009 is determined by adjusting EBITDA (i) for stock-based compensation expense and long-term incentive program, (ii) for restricted stock unit expense related to the Business.com Acquisition, (iii) for reorganization items, net and (iv) to exclude the intangible asset impairment charge during the year ended December 31, 2009. Combined adjusted EBITDA for the year ended December 31, 2010 combines the adjusted EBITDA of the Successor Company for the eleven months ended December 31, 2010 and the Predecessor Company for the one month ended January 31, 2010.
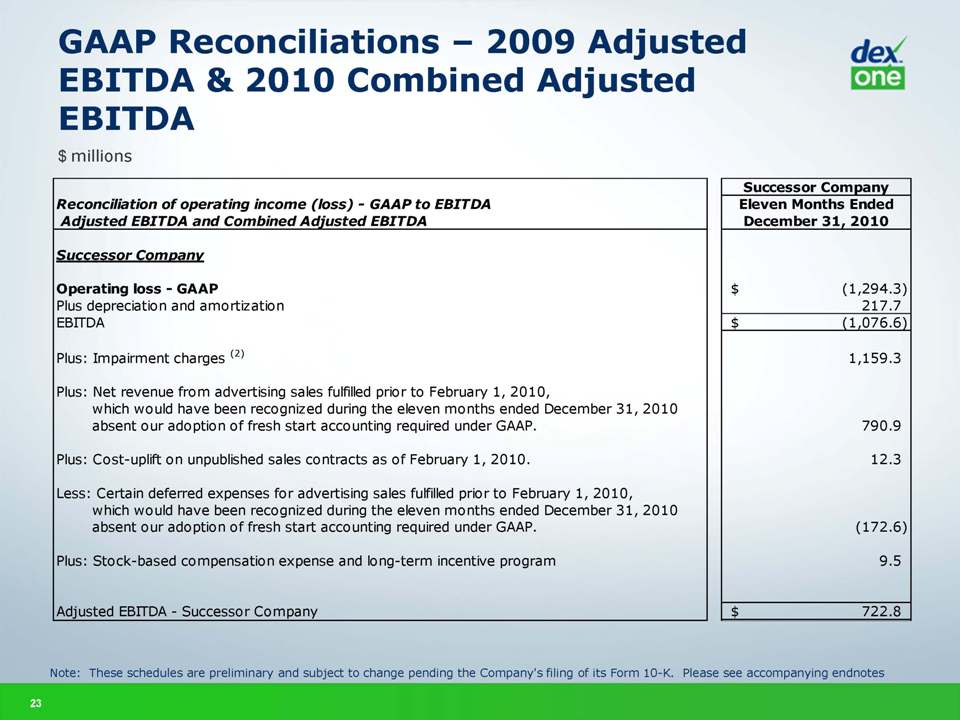
GAAP Reconciliations – 2009 Adjusted EBITDA & 2010 Combined Adjusted EBITDA $ millions Reconciliation of operating income (loss) GAAP to EBITDA Adjusted EBITDA and Combined Adjusted EBITDA Successor Company Eleven Months Ended December 31, 2010 Operating loss GAAP $(1,294.3) Plus depreciation and amortization 217.7 EBITDA $(1,076.6) Plus: Impairment charges (2) Plus: Net revenue from advertising sales fulfilled prior to February 1, 2010, which would have been recognized during the eleven months ended December 31. 2010 absent our adoption of fresh start accounting required under GAAP. Plus: Cost-uplift on unpublished sales contracts as of February 1, 2010. Less: Certain deferred expenses for advertising sales fulfilled prior to February 1, 2010, which which would have been recognized during the eleven months ended December 31. 2010 absent our adoption of fresh start accounting required under GAAP. Plus: Stock-based compensation expense and long-term incentive program 1,159.3 790.9 12.3 (172.6) 9.5 $722.8 Note: These schedules are preliminary and subject to change pending the Company's filing of its Form 10-K. Please see accompanying endnotes
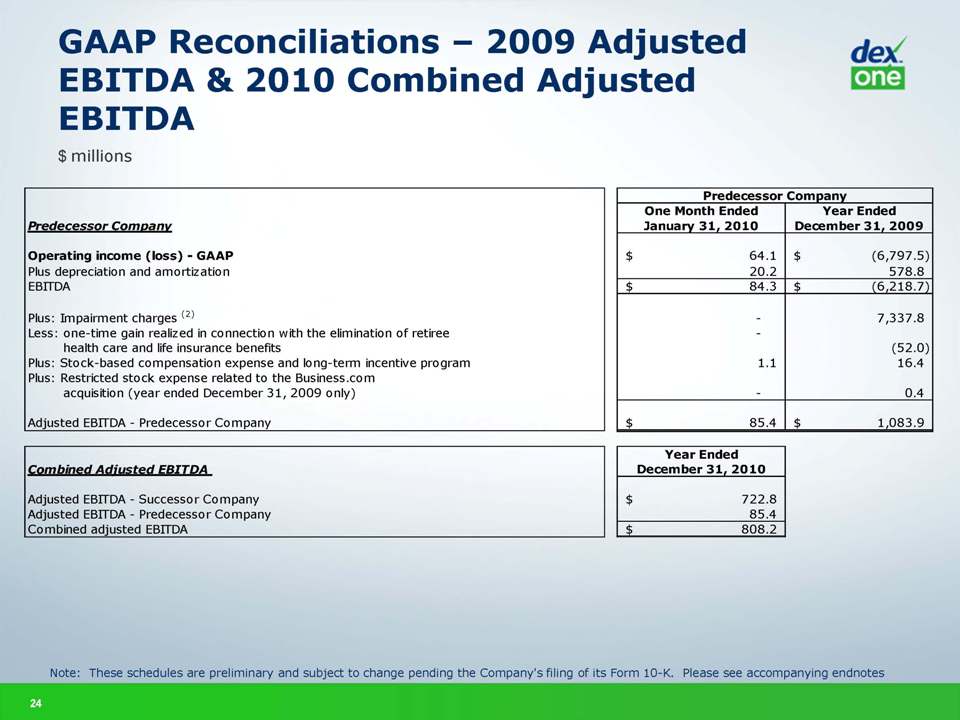
GAAP Reconciliations 2009 Adjusted EBITDA & 2010 Combined Adjusted EBITDA $ millions Predecessor Company One Month Ended January 31, 2010 Year Ended December 31, 2009 Year Ended December 31, 2010 Operating income (loss) GAAP Plus depreciation and amortization EBITDA 64.1 (6,797.5) 20.2 578.8 84.3 (6,218.7) Plus: Impairment charges (2) 7,337.8 Less: one time gain realized in connection with the elimination of retiree health care and life insurance benefits Plus: Stock-based compensation expense and long-term incentive program Plus: Restricted stock expense related to the Business.com acquisition (year ended December 31, 2009 only) 1.1 (52.0) 16.4 0.4 85.4 1,083.9 Combined Adjusted EBITDA Successor Company Note: These schedules are preliminary and subject to change pending the Company's filing of its Form 10-K. Please see accompanying endnotes
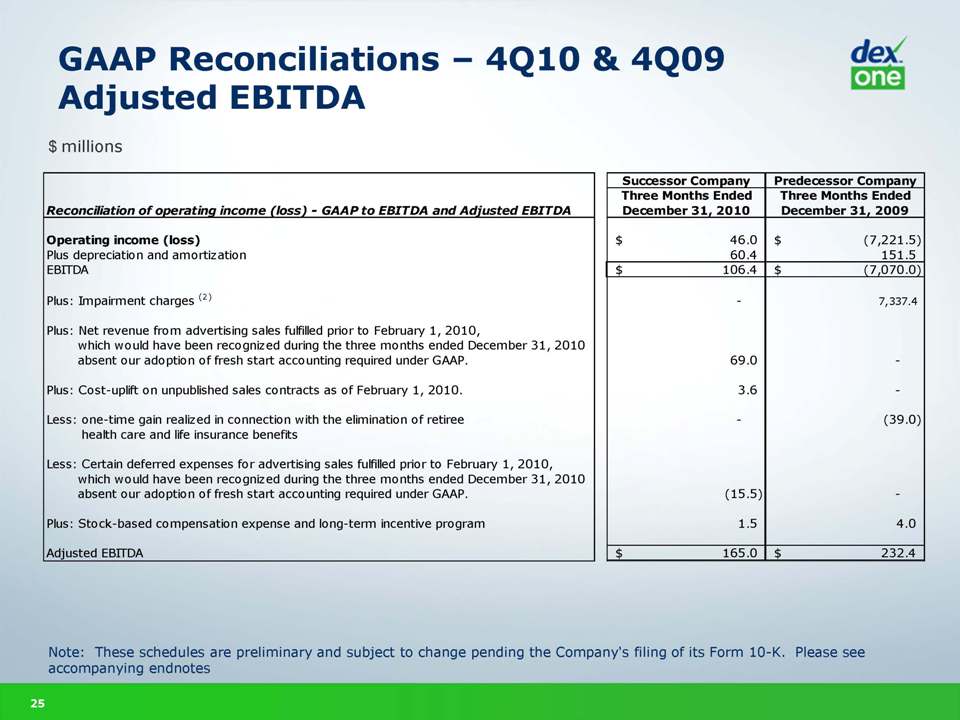
GAAP Reconciliations – 4Q10 & 4Q09 Adjusted EBITDA Note: These schedules are preliminary and subject to change pending the Company's filing of its Form 10-K. Please see accompanying endnotes $ millions Reconciliation of operating income (loss) GAAP to EBITDA and Adjusted EBITDA Operating income (loss) Plus depreciation and amortization EBITDA Plus: Impairment charges (2) Plus: Net revenue from advertising sales fulfilled prior to February 1, 2010, which would have been recognized during the three months ended December 31, 2010 absent our adoption of fresh start accounting required under GAAP. Plus: Cost-uplift on unpublished sales contracts as of February 1, 2010. Less: Certain deferred expenses for advertising sales fulfilled prior to February 1, 2010, which would have been recognized during the three months ended December 31. 2010 absent our adoption of fresh start accounting required under GAAP. Plus: Stock-based compensation expense and long-term incentive program Adjusted EBITDA Successor Company Three Months Ended December 31, 2010 Predecessor Company Three Months Ended December 31, 2009 46.0 60.4 106.4 69.0 3.6 (15.5) 1.5 165.0 (7,221.5) 151.5 (7,070.0) 7,337.4 (39.0) 4.0 232.4Note: These schedules are preliminary and subject to change pending the Company's filing of its Form 10-K. Please see accompanying endnotes
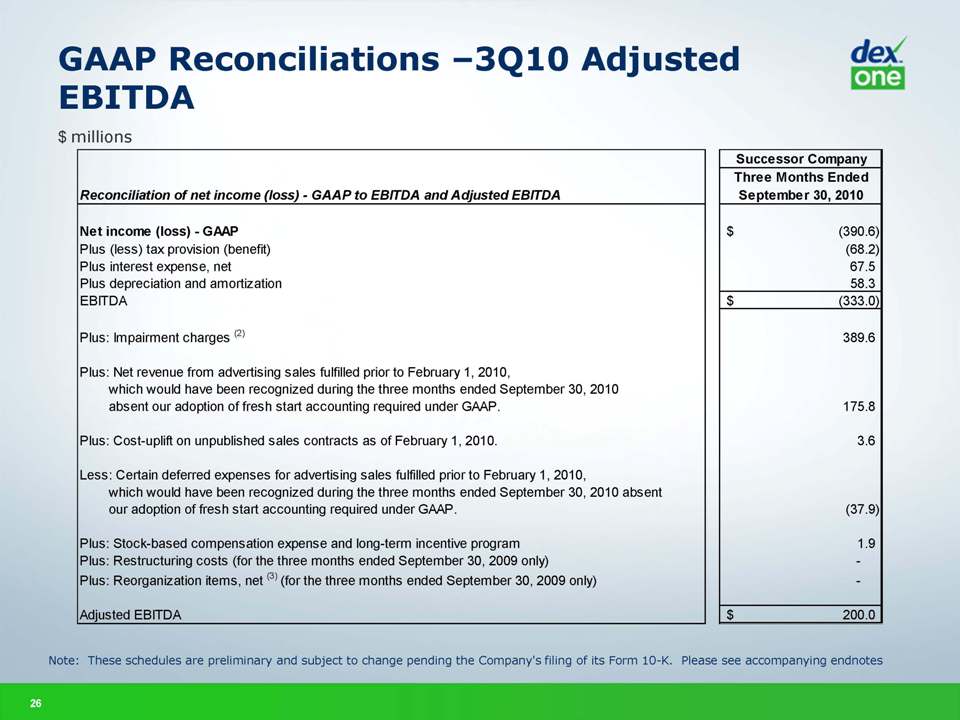
GAAP Reconciliations –3Q10 Adjusted EBITDA $ millions Reconciliation of net income (loss) GAAP to EBITDA and Adjusted EBITDA Net income (loss) GAAP (390.6) Plus (less) tax provision (benefit) (68.2) Plus interest expense, net 67.5 Plus depreciation and amortization 58.3 EBITDA (333.0) Plus: Impairment charges (2) 389.6 Plus: Net revenue from advertising sales fulfilled prior to February 1, 2010, which would have been recognized during the three months ended September 30, 2010 absent our adoption of fresh start accounting required under GAAP. 175.8 Plus: Cost-uplift on unpublished sales contracts as of February 1, 2010. 3.6 Less: Certain deferred expenses for advertising sales fulfilled prior to February 1, 2010, which would have been recognized during the three months ended September 30. 2010 absent our adoption of fresh start accounting required under GAAP. (37.9) Plus: Stock-based compensation expense and long-term incentive program 1.9 Plus restructuring costs (for the three months ended September 30, 2009 only) Plus reorganization items, net (3) (for the three months ended September 30, 2009 only) Adjusted EBITDA 200.0Note: These schedules are preliminary and subject to change pending the Company's filing of its Form 10-K. Please see accompanying endnotes
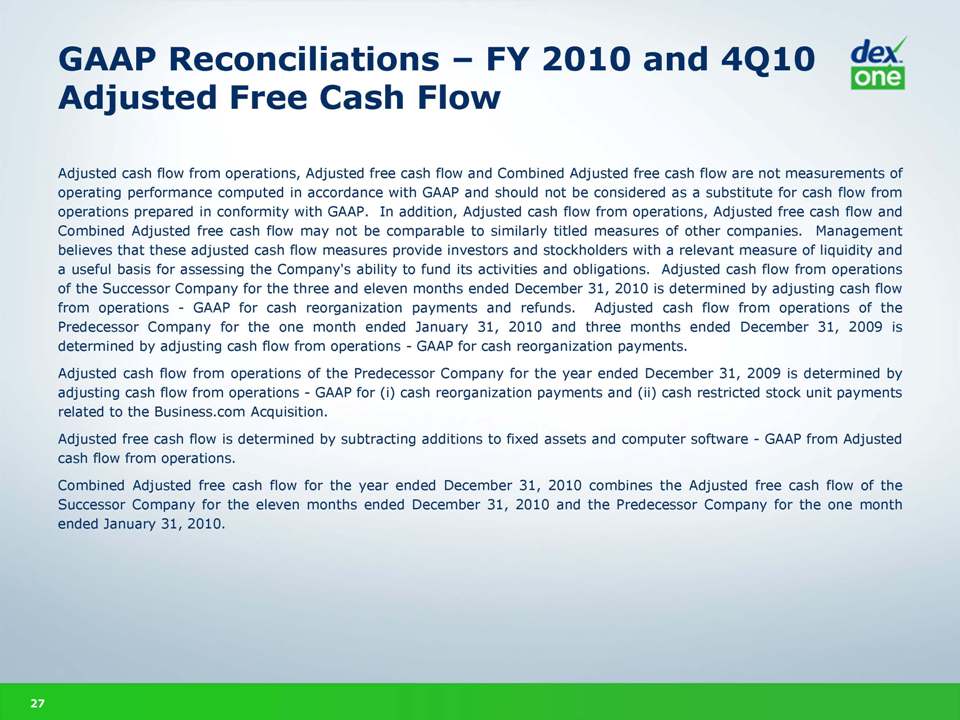
GAAP Reconciliations – FY 2010 and 4Q10 Adjusted Free Cash Flow Adjusted cash flow from operations, Adjusted free cash flow and Combined Adjusted free cash flow are not measurements of operating performance computed in accordance with GAAP and should not be considered as a substitute for cash flow from operations prepared in conformity with GAAP. In addition, Adjusted cash flow from operations, Adjusted free cash flow and Combined Adjusted free cash flow may not be comparable to similarly titled measures of other companies. Management believes that these adjusted cash flow measures provide investors and stockholders with a relevant measure of liquidity and a useful basis for assessing the Company's ability to fund its activities and obligations. Adjusted cash flow from operations of the Successor Company for the three and eleven months ended December 31, 2010 is determined by adjusting cash flow from operations - GAAP for cash reorganization payments and refunds. Adjusted cash flow from operations of the Predecessor Company for the one month ended January 31, 2010 and three months ended December 31, 2009 is determined by adjusting cash flow from operations - GAAP for cash reorganization payments.Adjusted cash flow from operations of the Predecessor Company for the year ended December 31, 2009 is determined by adjusting cash flow from operations - GAAP for (i) cash reorganization payments and (ii) cash restricted stock unit payments related to the Business.com Acquisition. Adjusted free cash flow is determined by subtracting additions to fixed assets and computer software - GAAP from Adjusted cash flow from operations. Combined Adjusted free cash flow for the year ended December 31, 2010 combines the Adjusted free cash flow of the Successor Company for the eleven months ended December 31, 2010 and the Predecessor Company for the one month ended January 31, 2010.
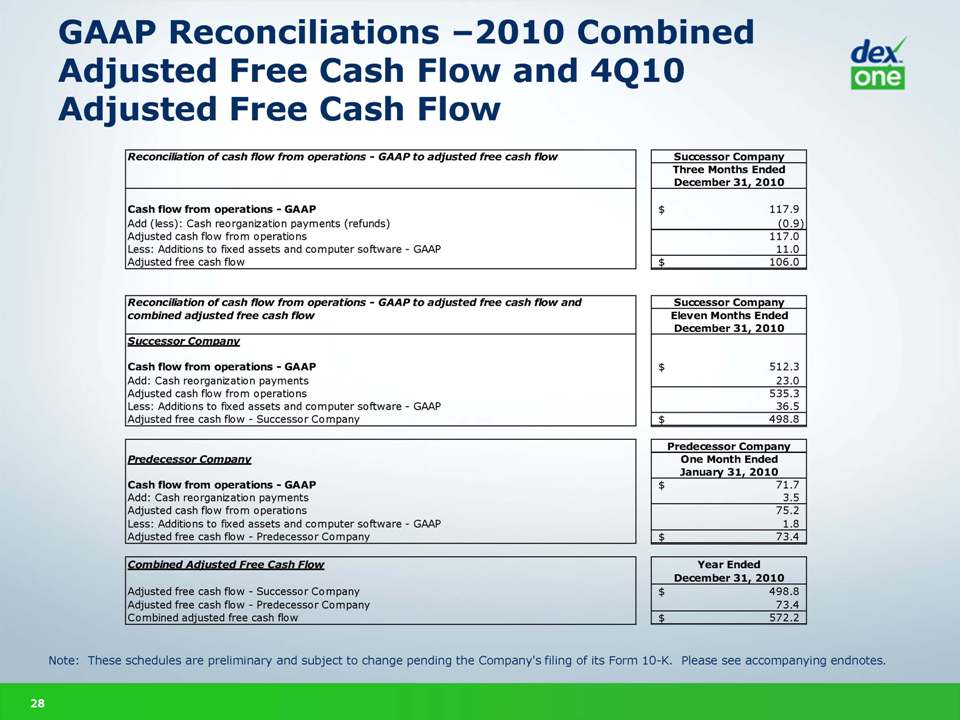
GAAP Reconciliations 2010 Combined Adjusted Free Cash Flow and 4Q10 Adjusted Free Cash Flow Reconciliation of cash flow from operations GAAP to adjusted free cash flow Successor Company Three Months Ended December 31, 2010 Cash flow from operations GAAP $117.9 Add (less) cash reorganization payments (refunds) (0.9) Adjusted cash flow from operations 117.0 Less additions to fixed assets and computer software GAAP 11.0 Adjusted free cash flow $106.0 Reconciliation of cash flow from operations GAAP to adjusted free cash flow and combined adjusted free cash flow Eleven Months Ended 512.3 23.0 535.3 36.5 498.8 Predecessor Company One Month Ended January 31, 2010 71.7 3.5 75.2 1.8 73.4 Year ended 398.8 73.4 572.2 Note: These schedules are preliminary and subject to change pending the Company's filing of its Form 10-K. Please see accompanying endnotes.
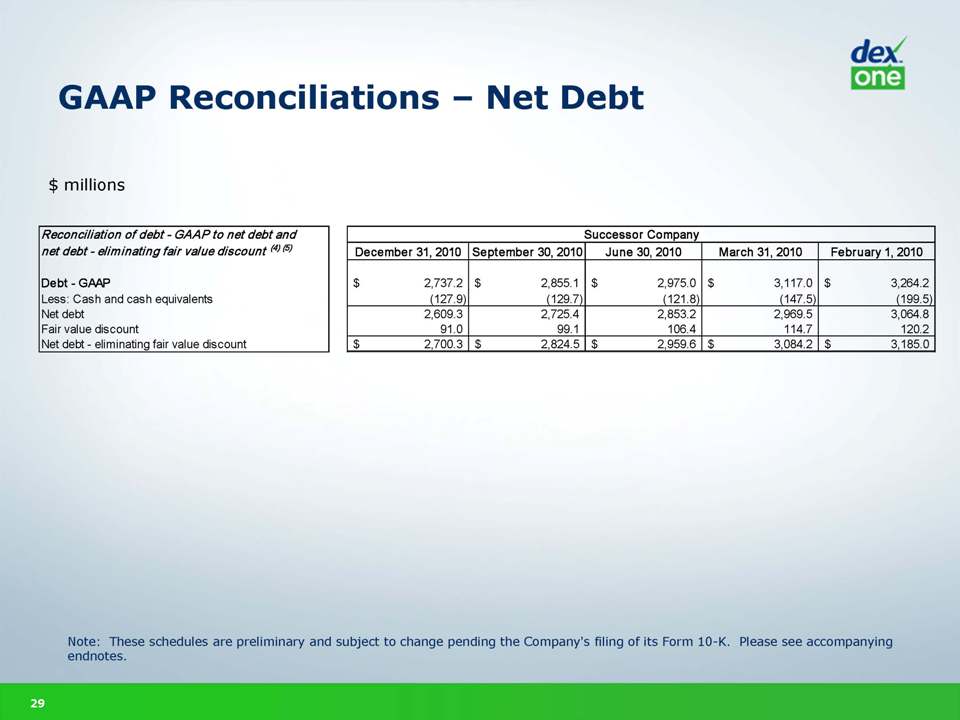
GAAP Reconciliations – Net Debt $ millions Reconciliation of debt GAAP to net debt and net debt eliminating fair value discount (4) (5) Successor Company December 31, 2010 September 30, 2010, June 30, 2010 March 31, 2010 February 1, 2010 Debt GAAP 2,737.2 2,855.1 2,975.0 3,117.0 3,264.2 Less Cash and cash equivalents (127.9) (129.7) (121.8) (147.5) (199.5) Net debt 2,609.3 2,725.4 2,853.2 2,969.5 3,064.8 Fair value discount 91.0 99.1 106.4 114.7 120.2 Net debt eliminating fair value discount 2,700.3 2,824.5 2,959.6 3,084.2 3,185.0 Note: These schedules are preliminary and subject to change pending the Company's filing of its Form 10-K. Please see accompanying endnotes.
Reconciliation Endnotes (1) Our advertising revenues are earned primarily from the sale of advertising in yellow pages directories we publish. Advertising revenues also include revenues for Internet-based advertising products including online directories, such as DexKnows.com and DexNet. Advertising revenues are affected by several factors, including changes in the quantity and size of advertisements, acquisition of new clients, renewal rates of existing clients, premium advertisements sold, changes in advertisement pricing, the introduction of new products, an increase in competition and more fragmentation in the local business search market and general economic factors. Revenues with respect to print advertising and Internet-based advertising products that are sold with print advertising are recognized under the deferral and amortization method. Revenues related to our print advertising and Internet-based advertising products that are sold with print advertising are initially deferred when a directory is published, net of sales claims and allowances, and recognized ratably over the directory’s life, which is typically 12 months. Revenues with respect to Internet-based services that are sold standalone, such as DexNet, are recognized as delivered or fulfilled. Revenues with respect to our advertising products that are non-performance based are recognized ratably over the life of the contract commencing when they are first delivered or fulfilled. Revenues with respect to our advertising products that are performance-based are recognized as the service is delivered or fulfilled. (2) We performed impairment tests as of September 30, 2010 and June 30, 2010 of our goodwill, definite-lived intangible assets and other long-lived assets. The testing results of our definite-lived intangible assets and other long-lived assets resulted in an impairment charge associated with trade names and trademarks, technology, local customer relationships and other from our former Business.com reporting unit of $21.6 million during the eleven months ended December 31, 2010. The testing results of our goodwill resulted in an impairment charge of $1,137.6 million during the eleven months ended December 31, 2010, for a total impairment charge of $1,159.2 million during the eleven months ended December 31, 2010. The Company has excluded the goodwill and intangible asset impairment charges from Combined Adjusted Results for the year ended December 31, 2010. As a result of the Chapter 11 petitions and continued negative industry and economic trends, the Predecessor Company recognized a non-goodwill intangible asset impairment charge of $7.3 billion during the fourth quarter of 2009, primarily representing the difference between the fair value and recorded value of our directory services agreements. The Predecessor Company has excluded the intangible asset impairment charge from Adjusted Results for the three months and year ended December 31, 2009. Note: These schedules are preliminary and subject to change pending the Company's filing of its Form 10-K
Endnotes (cont’d) Note: These schedules are preliminary and subject to change pending the Company's filing of its Form 10-K (3) Reorganization items directly associated with the process of reorganizing the business under Chapter 11 of the Bankruptcy Code were recorded on a separate line item on the unaudited condensed consolidated statements of operations. The Predecessor Company had recorded $7.8 billion of reorganization items during the one month ended January 31, 2010 associated with the gain on reorganization/settlement of liabilities subject to compromise and the impact of fresh start accounting adjustments. The Predecessor Company had recorded $16.9 million and $94.8 million of reorganization items during the three months and year ended December 31, 2009, respectively, associated with items such as professional fees, the write-off of unamortized deferred financing costs, net premiums / discounts and fair value adjustments due to purchase accounting associated with long-term debt classified as liabilities subject to compromise. Additionally, liabilities were segregated between liabilities not subject to compromise and liabilities subject to compromise on the audited consolidated balance sheet at December 31, 2009. The Predecessor Company's senior notes, senior discount notes and senior subordinated notes were classified as liabilities subject to compromise at December 31, 2009 and the Predecessor Company's credit facilities were excluded from liabilities subject to compromise at December 31, 2009. (4) In conjunction with our adoption of fresh start accounting, an adjustment was established to record our outstanding debt at fair value on the Fresh Start Reporting Date. The Company was required to record our amended and restated credit facilities at a discount as a result of their fair value on the Fresh Start Reporting Date. Therefore, the carrying amount of these debt obligations is lower than the principal amount due at maturity. This fair value adjustment is amortized as an increase to interest expense over the remaining term of the respective debt agreements and does not impact future scheduled interest or principal payments. The unamortized fair value adjustment resulting from fresh start accounting was $91.0 million at December 31, 2010. (5) Net debt represents total debt less cash and cash equivalents on the respective date. Net debt – eliminating fair value discount eliminates the fair value discount as a result of fresh start accounting described in Note 4 and represents principal amounts due at maturity. Net debt as of December 31, 2009 excludes $6.1 billion of long-term debt classified as liabilities subject to compromise.