Attached files
Table of Contents
Index to Financial Statements
UNITED STATES
SECURITIES AND EXCHANGE COMMISSION
Washington, DC 20549
FORM 10-K
(Mark One)
| þ | ANNUAL REPORT PURSUANT TO SECTION 13 OR 15(d) OF THE SECURITIES EXCHANGE ACT OF 1934 |
For the fiscal year ended December 31, 2010
OR
| ¨ | TRANSITION REPORT PURSUANT TO SECTION 13 OR 15(d) OF THE SECURITIES EXCHANGE ACT OF 1934 |
Commission File Number: 001-33380
PHARMERICA CORPORATION
(Exact name of registrant as specified in its charter)
| Delaware | 87-0792558 | |
| (State or other jurisdiction of incorporation or organization) |
(I.R.S. Employer Identification No.) | |
| 1901 Campus Place Louisville, KY |
40299 | |
| (Address of principal executive offices) | (Zip Code) | |
(502) 627-7000
(Registrant’s telephone number, including area code)
Securities registered pursuant to Section 12(b) of the Act:
| Title of each class | Name of exchange on which registered | |
| Common stock $0.01 par value | New York Stock Exchange |
Securities registered pursuant to Section 12(g) of the Act:
N/A
(Title of class)
Indicate by check mark if the registrant is a well-known seasoned issuer, as defined in Rule 405 of the Securities Act. Yes ¨ No þ
Indicate by check mark if the registrant is not required to file reports pursuant to Section 13 or Section 15(d) of the Act. Yes ¨ No þ
Indicate by check mark whether the registrant (1) has filed all reports required to be filed by Section 13 or 15(d) of the Securities Exchange Act of 1934 during the preceding 12 months (or for such shorter period that the registrant was required to file such reports), and (2) has been subject to such filing requirements for the past 90 days. Yes þ No ¨
Indicate by check mark whether the registrant has submitted electronically and posted on its corporate Web site, if any, every Interactive Data File required to be submitted and posted pursuant to Rule 405 of Regulation S-T during the preceding 12 months (or for such shorter period that the registrant was required to submit and post such files). Yes ¨ No ¨
Indicate by check mark if disclosure of delinquent filers pursuant to Item 405 of Regulation S-K is not contained herein, and will not be contained, to the best of registrant’s knowledge, in definitive proxy or information statements incorporated by reference in Part III of this Form 10-K or any amendment to this Form 10-K. þ
Indicate by check mark whether the registrant is a large accelerated filer, an accelerated filer, a non-accelerated filer, or a smaller reporting company. See the definitions of “large accelerated filer,” “accelerated filer” and “smaller reporting company” in Rule 12b-2 of the Exchange Act.
| Large accelerated filer ¨ | Accelerated filer þ | |
| Non-accelerated filer ¨ (Do not check if a smaller reporting company) |
Smaller reporting company ¨ |
Indicate by check mark whether the registrant is a shell company (as defined in Rule 12b-2 of the Act). Yes ¨ No þ
The aggregate market value of the voting and non-voting common equity of the registrant held by non-affiliates as of June 30, 2010 was $440,928,380.
| Class of Common Stock |
Outstanding at February 18, 2011 | |
| Common stock, $0.01 par value |
29,360,872 Shares |
DOCUMENTS INCORPORATED BY REFERENCE
Part III of this Form 10-K incorporates certain information by reference from registrant’s definitive proxy statement for the 2011 annual meeting of stockholders, which proxy statement will be filed no later than 120 days after the close of the registrant’s fiscal year ended December 31, 2010.
Table of Contents
Index to Financial Statements
FORM 10-K
INDEX
2
Table of Contents
Index to Financial Statements
Part I
Overview
The Corporation was formed on October 23, 2006, by Kindred Healthcare, Inc. (“Kindred” or “Former Parent”) and AmerisourceBergen Corporation (“AmerisourceBergen”) for the purpose of consummating the transactions contemplated by the Master Transaction Agreement dated October 25, 2006, as amended (the “Master Agreement”). Pursuant to the Master Agreement, Kindred and AmerisourceBergen, through a series of transactions (collectively, the “Pharmacy Transaction”), spun-off and combined their respective institutional pharmacy businesses, Kindred Pharmacy Services (“KPS”) and PharMerica Long-Term Care (“PharMerica LTC”), into a new, stand-alone, publicly traded company. The Pharmacy Transaction was consummated on July 31, 2007 (the “Closing Date”).
On November 4, 2010, the Corporation acquired substantially all of the assets and assumed selected vendor contracts of Chem Rx Corporation and certain of its wholly-owned subsidiaries (collectively, “Chem Rx”). The Corporation’s primary purpose in acquiring Chem Rx was to expand the Corporation’s long-term care business into the New York and New Jersey markets. The acquisition of Chem Rx was made pursuant to Section 363 of the United States Bankruptcy Code (“Bankruptcy Code”).
Institutional Pharmacy Business
The Corporation is the second largest institutional pharmacy services company in the United States based on revenues. We service healthcare facilities and also provide management pharmacy services to hospitals. The Corporation operates 97 institutional pharmacies in 43 states. The Corporation’s customers are typically institutional healthcare providers, such as skilled nursing facilities, nursing centers, assisted living facilities, hospitals, and other long-term alternative care settings. The Corporation is generally the primary source of supply of pharmaceuticals to its customers. The Corporation also provides pharmacy management services to 90 hospitals in the United States.
Our core business provides pharmacy products and services to residents and patients in skilled nursing facilities, assisted living facilities, hospitals, and other long-term alternative care settings. We purchase, repackage, and dispense prescription and non-prescription pharmaceuticals in accordance with physician orders and deliver such medication to healthcare facilities for administration to individual patients and residents. Depending on the specific location, we service healthcare facilities typically within a radius of 120 miles or less of our pharmacy locations at least once each day. Each pharmacy provides 24-hour, seven-day per week on-call pharmacist services for emergency dispensing, delivery, and/or consultation with the facility’s staff or the resident’s attending physician. We also provide various supplemental healthcare services that complement our institutional pharmacy services.
We offer prescription and non-prescription pharmaceuticals to our customers through unit dose or modified unit dose packaging, dispensing, and delivery systems, typically in a 15 to 30 day supply. Unit dose medications are packaged for dispensing in individual doses as compared to bulk packaging used by most retail pharmacies. The customers we serve prefer the unit dose delivery system over the bulk delivery system employed by retail pharmacies because it improves control over the storage and ordering of drugs and reduces errors in drug administration in healthcare facilities. Nursing staff in our customers’ facilities administer the pharmaceuticals to individual patients and residents.
3
Table of Contents
Index to Financial Statements
Our computerized dispensing and delivery systems are designed to improve efficiency and control over distribution of medications to patients and residents. We provide computerized physician orders and medication administration records for patients or residents on a monthly basis as requested. Data from these records are formulated into monthly management reports on patient and resident care and quality assurance. This system improves efficiencies in nursing time, reduces drug waste, and helps to improve patient outcomes.
Consultant Pharmacist Services
Federal and state regulations mandate that long-term care facilities, in addition to providing a source of pharmaceuticals, retain consultant pharmacist services to monitor and report on prescription drug therapy in order to maintain and improve the quality of resident care. On September 30, 2008, the United States Department of Health and Human Services (“HHS”) Office of Inspector General published OIG Supplemental Compliance Program Guidance for Nursing Homes. With quality of care being the first risk area identified, the supplemental guidance is part of a series of recent government efforts focused on improving quality of care at skilled nursing and long-term care facilities. The guidance contains new compliance recommendations and an expanded discussion of risk areas. The guidance stressed that facilities must provide pharmaceutical services to meet the needs of each resident and should be mindful of potential quality of care problems when implementing policies and procedures on proper medication management. It further stated that facilities can reduce risk by educating staff on medication management and improper pharmacy kickbacks for consultant pharmacists and that facilities should review the total compensation paid to consultant pharmacists to ensure it is not structured in a way that reflects the volume or value of particular drugs prescribed or administered to residents.
We provide consultant pharmacist services that help our customers comply with the federal and state regulations applicable to nursing homes. The services offered by our consultant pharmacists include:
| • | Monthly reviews of each resident’s drug regimen to assess the appropriateness and efficacy of drug therapies, including the review of medical records, monitoring drug interactions with other drugs or food, monitoring laboratory test results, and recommending alternative therapies; |
| • | Participation on quality assurance and other committees of our customers, as required or requested by such customers; |
| • | Monitoring and reporting on facility-wide drug utilization; |
| • | Development and maintenance of pharmaceutical policy and procedure manuals; and |
| • | Assistance with federal and state regulatory compliance pertaining to resident care. |
Local providers also provide these services.
Medical Records
The Corporation provides medical records services, which includes the completion and maintenance of medical record information for patients in the Corporation’s customer’s facilities. The medical records services include:
| • | Real-time access to medication and treatment administration records, physician order sheets and psychotropic drug monitoring sheets; |
| • | Online ordering to save time and resources; |
| • | A customized database with the medication profiles of each resident’s medication safety, efficiency and regulatory compliance; |
| • | Web-based individual patient records detailing each prescribed medicine; and |
| • | Electronic medical records to improve information to make it more legible and instantaneous. |
4
Table of Contents
Index to Financial Statements
Ancillary Services
The Corporation provides intravenous drug therapy products and services to its customers. We provide intravenous (“IV” or infusion therapy) products and services for these client facilities as well as hospice and home care patients. Infusion therapy consists of the product (a nutrient, antibiotic, chemotherapy, or other drugs in solution) and the intravenous administration of the product.
We prepare the product to be administered using proper equipment in an aseptic environment and then deliver the product to the facilities for administration by the nursing staff. Proper administration of IV drug therapy requires a highly trained nursing staff. Upon request, our nurse consultants provide an education and certification program on IV therapy to assure proper staff training and compliance with regulatory requirements in client facilities offering an IV therapy program.
Hospital Pharmacy Management Services
We also provide hospital pharmacy management services. These services generally entail the overall management of the hospital pharmacy operations, including the ordering, receipt, storage, and dispensing of pharmaceuticals to the hospital’s patients pursuant to the clinical guidelines established by the hospital. We offer the hospitals a wide range of regulatory and financial management services, including inventory control, budgetary analysis, staffing optimization, and assistance with obtaining and maintaining applicable regulatory licenses, certifications, and accreditations. We work with the hospitals to develop and implement pharmacy policies and procedures, including drug formulary development and utilization management. We also offer clinical pharmacy programs that encompass a wide range of drug therapy and disease management protocols, including protocols for anemia treatment, infectious diseases, wound care, nutritional support, renal dosing, and therapeutic substitution. The hospital pharmacy management services segment is comprised of a few customers, of which, our largest service is to substantially all of Kindred’s hospitals.
Additional business segment information is set forth in Part II, Item 8 “Financial Statements” and Note 12—“Business Segment Data” to the Consolidated Financial Statements of this annual report on Form 10-K.
Our Business Focus
Focusing on Client Retention and Customer Service. We will focus on consistently providing quality pharmaceutical services to our customers at competitive prices and delivery of prescriptions in a timely and effective manner. Our business seeks to implement innovative and cost-effective solutions to improve the provision of medication to our customers and the residents and patients that they serve.
Driving Organic Sales. We aim to grow our business through expansion in our existing markets and by servicing new customers. We intend to grow organically. We believe our industry has underlying market growth potential attributable to both an increase in drug utilization as well as the general aging population of the United States.
Acquiring Competitors. We also intend to expand our market share through selected geographic expansion in markets not currently served by us and through strategic acquisitions in existing and underserved markets. The Corporation currently operates in 43 states. We believe there are growth opportunities in several other markets. There are numerous businesses in our market, mostly small or regional companies that lack the scale that we believe will be necessary to ultimately compete in a market that is national in scope. We intend to actively seek opportunities to acquire these companies. Since its formation, the Corporation has acquired five institutional pharmacy businesses.
5
Table of Contents
Index to Financial Statements
Sales and Marketing
We sell our products and services through a national sales force. Our sales force is organized along geographic lines to maximize coverage, manage costs, and align more effectively with our operating regions. Our sales representatives specialize in the products and services we offer and the markets in which we operate. Their knowledge permits us to meet the unique needs of our customers while maintaining profitable relationships.
Customers
Institutional Care Settings. Our customers are typically institutional healthcare providers, such as skilled nursing facilities, nursing centers, assisted living facilities, hospitals and other long-term alternative care settings. We are generally the primary source of supply of pharmaceuticals for our customers.
Our customers depend on institutional pharmacies like us to provide the necessary pharmacy products and services and to play an integral role in monitoring patient medication regimens and safety. We dispense pharmaceuticals in patient specific packaging in accordance with physician instructions.
At December 31, 2010, we had contracts to provide pharmacy services to 363,844 licensed beds for patients in healthcare facilities throughout the country. We also have significant customer concentrations with facilities operated by Kindred. For the year ended December 31, 2010, Kindred institutional pharmacy contracts represented approximately 10.0% of the Corporation’s total revenues.
Hospital Pharmacy Management Services. At December 31, 2010, the Corporation provided hospital pharmacy management services to Kindred and other customers at 90 locations. For year ended December 31, 2010, revenues under the Kindred hospital pharmacy management service contracts represented approximately 3.0% of the Corporation’s total revenues.
Suppliers/Inventory
At the consummation of the Pharmacy Transaction, the Corporation entered into a prime vendor agreement with AmerisourceBergen Drug Corporation (“ABDC”), a wholly owned subsidiary of AmerisourceBergen. On January 4, 2011, the prime vendor agreement was amended and restated (“Prime Vendor Agreement”). The Prime Vendor Agreement became effective on January 1, 2011, superseded in its entirety the prior agreement and it expires September 30, 2013. Under the Prime Vendor Agreement the Corporation will purchase a certain percentage of the Corporation’s prescription pharmaceutical drugs from ABDC and will participate in ABDC’s generic formulary purchase program.
We also obtain pharmaceutical and other products from contracts negotiated directly with pharmaceutical manufacturers. We are a member of an industry buying group, which contracts with pharmaceutical manufacturers for discounted prices. While the loss of a supplier could adversely affect our business if alternate sources of supply are unavailable, numerous sources of supply are generally available to us and we have not experienced any difficulty in obtaining pharmaceuticals or other products and supplies to conduct our business.
We seek to maintain an on-site inventory of pharmaceuticals and supplies to ensure prompt delivery to our customers. ABDC maintains local distribution facilities in most major geographic markets in which we operate.
Brand versus Generic
The pharmaceutical industry has been experiencing a higher level of brand-to-generic drug conversions. We believe the generic dispensing rate will increase to over 80% over time as the result of a large number of patent expirations. Flomax, Mirapex, Lovenox, Exelon and Effexor XR, five brand drugs from the Corporation’s top 50 drug spend, converted to their generic alternative during the year ended December 31, 2010.
6
Table of Contents
Index to Financial Statements
The following table summarizes the generic drug dispensing rate:
| 2008 |
2009 |
2010 |
||||||
| 70.7% | 74.2 | % | 75.5 | % | ||||
The following table summarizes the material brand-to-generic conversions in 2010 and expected to occur through 2015:
| 2010 |
2011 |
2012 |
2013 |
2014 |
2015 | |||||
| Mirapex (1Q) | Xalatan (1Q) | Seroquel (1Q) | Humalog (2Q) | Nexium (2Q) | Abilify (2Q) | |||||
| Flomax (1Q) | Levaquin (2Q) | Lexapro (1Q) | Oxycontin (2Q) | Celebrex (2Q) | Zyvox (2Q) | |||||
| Effexor XR (3Q) | Zyprexa (4Q) | Detrol (3Q) | Advair (3Q) | Renvela (3Q) | Namenda (2Q) | |||||
| Exelon (3Q) | Lipitor (4Q) | Singulair (3Q) | Cymbalta (4Q) | Copaxone (4Q) | ||||||
| Lovenox (3Q) | Plavix (4Q) | Actos (3Q) | ||||||||
| Aricept (4Q) | Geodon (3Q) | |||||||||
| Prevacid ODT (4Q) | Diovan (3Q) | |||||||||
| Diovan HCT (3Q) | ||||||||||
| Xopenex (3Q) | ||||||||||
| (Number in parentheses equals the quarter of conversion) | ||||||||||
When a branded drug shifts to a generic, initial pricing of the generic drug in the market will vary depending on the number of manufacturers launching their generic version of the drug. Historically a shift from brand-to-generic decreased our revenue and improved our gross margin from sales of these classes of drugs during the initial time period a brand drug has a generic alternative. However, recent experience has indicated that the third-party payers may reduce their reimbursements to the Corporation faster than previously experienced. This acceleration in the reimbursement reduction has resulted in margin compression much earlier than we have historically experienced. Due to the unique nature of the brand-to-generic conversion, management cannot estimate the future financial impact of the brand-to-generic conversions on its results of operations.
Supplier and Manufacturer Rebates
We currently receive rebates from certain manufacturers and distributors of pharmaceutical products for achieving targets of market share or purchase volumes. Rebates are designed to prefer, protect, or maintain a manufacturer’s products that are dispensed by the pharmacy under its formulary. Rebates for brand name products are generally based upon achieving a defined market share tier within a therapeutic class. Rebates for generic products are more likely to be based on achieving volume requirements. For the years ended December 31, 2008, 2009 and 2010, rebates recorded as a reduction in cost of goods sold were $34.7 million, $34.1 million, and $37.2 million, respectively. The Corporation had $2.8 million, $3.0 million and $3.3 million of rebates capitalized in inventory as of December 31, 2008, 2009, and 2010, respectively.
Information Technology
Computerized medical records and documentation are an integral part of our distribution system. We primarily utilize a proprietary information technology infrastructure that automates order entry of medications, dispensing of medications, invoicing, and payment processing. These systems provide consulting drug review, electronic medication management, medical records, and regulatory compliance information to help ensure patient safety. These systems also support verification of eligibility and electronic billing capabilities for the Corporation’s pharmacies. They also provide order entry, shipment, billing, reimbursement and collection of service fees for medications, specialty services and other services rendered.
Based upon our electronic records, we are able to provide reports to our customers and management on patient care and quality assurance. These reports help to improve efficiency in patient care, reduce drug waste,
7
Table of Contents
Index to Financial Statements
and improve patient outcomes. We expect to continue to invest in technologies that help improve data integrity, critical information access, and system availability.
At the consummation of the Pharmacy Transaction, the Corporation entered into an Information Technology Services Agreement with Kindred Healthcare Operating, Inc. (“KHOI”), a wholly owned subsidiary of Kindred (the “IT Services Agreement”). Pursuant to the IT Services Agreement, KHOI is the Corporation’s exclusive provider of certain information services and support related to information technology infrastructure and financial systems for a period of five years, ending on July 31, 2012. The services provided by KHOI include business services necessary to operate, manage, and support certain financial applications the Corporation uses, including enabling or supporting technology infrastructure and technology procurement services to support certain business functions. Such services include, among other matters, functions for financial management and systems and payroll. The Corporation supports internally all other operating systems, including functions for order entry, pharmacy dispensing, clinical consulting, billing and collections, electronic medication management, sales and marketing, medical records management, human resources, internal and external customer call center support, and general business systems.
Except for certain services that will be provided at cost, KHOI will provide such services to the Corporation at its cost plus 10%, which will be the actual costs and expenses incurred in providing these services, including certain overhead costs and per hour costs of the KHOI employees providing the services. The initial term of the agreement is five years. The agreement will automatically renew for successive one-year periods after the expiration of the initial five year term, absent 120 days prior written notice of termination as provided for in the agreement. The IT Services Agreement may be terminated by either party for cause and, in certain circumstances, by the Corporation in the event that KHOI undergoes a change of control to one of the Corporation’s competitors. Following termination of the IT Services Agreement, KHOI must provide termination and expiration assistance for up to 180 days. The Corporation incurred $17.3 million, $11.5 million, and $11.1 million to Kindred under the terms of the IT Services Agreement for the years ended December 31, 2008, 2009, and 2010, respectively.
Sources of Pharmacy Revenues
We receive payment for our services from third party payers, including Medicare Part D Plans, government reimbursement programs under Medicare and Medicaid, and non-government sources such as institutional healthcare providers, commercial insurance companies, health maintenance organizations, preferred provider organizations, and contracted providers. The sources and amounts of our revenues will be determined by a number of factors, including the mix of our customers’ patients, brand to generic conversions and the rates and charges of reimbursement among payers. Changes in our customers’ censuses, the case mix of the patients, brand and generic dispensing rates, and the payer mix among private pay, Medicare Part D and Medicaid, will affect our profitability.
In December 2003, Congress enacted the Medicare Prescription Drug, Improvement and Modernization Act of 2003 (“MMA”) which included a major expansion of the Medicare program through the introduction of a prescription drug benefit (titled Medicare Part D) which is administered by commercial market insurers contracted with CMS. Under Medicare Part D, Medicare beneficiaries who are also entitled to benefits under a state Medicaid program (so called “dual eligibles”) now have their outpatient prescription drug costs covered by Medicare Part D, subject to certain limitations. Since January 1, 2006, most of the nursing center residents we serve whose drug costs were previously covered by state Medicaid programs are dual eligibles who qualify for Medicare Part D. Accordingly, Medicaid is no longer a primary payer for the pharmacy services provided to these residents. See “Overview of Reimbursement.”
8
Table of Contents
Index to Financial Statements
A summary of revenue by payer type for the years ended December 31, are as follows (dollars in millions):
| 2008 | 2009 | 2010 | ||||||||||||||||||||||
| Amount | % of Revenues |
Amount | % of Revenues |
Amount | % of Revenues |
|||||||||||||||||||
| Medicare Part D |
$ | 885.8 | 45.5 | % | $ | 852.6 | 46.3 | % | $ | 859.2 | 46.5 | % | ||||||||||||
| Institutional healthcare providers |
577.2 | 29.7 | 545.6 | 29.6 | 556.2 | 30.1 | ||||||||||||||||||
| Medicaid |
181.1 | 9.3 | 165.8 | 9.0 | 169.5 | 9.2 | ||||||||||||||||||
| Private and other |
133.2 | 6.8 | 122.4 | 6.6 | 107.3 | 5.8 | ||||||||||||||||||
| Insured |
101.4 | 5.2 | 91.5 | 5.0 | 89.8 | 4.9 | ||||||||||||||||||
| Medicare |
10.1 | 0.5 | 6.8 | 0.4 | 7.4 | 0.4 | ||||||||||||||||||
| Hospital management fees |
58.5 | 3.0 | 56.5 | 3.1 | 57.9 | 3.1 | ||||||||||||||||||
| Total |
$ | 1,947.3 | 100.0 | % | $ | 1,841.2 | 100.0 | % | $ | 1,847.3 | 100.0 | % | ||||||||||||
Competition
We face a highly competitive environment in the institutional pharmacy market. In each geographic market, there are national, regional and local institutional pharmacies that provide services comparable to those offered by our pharmacies which may have greater financial and other resources than we do and may be more established in the markets they serve than we are. In addition, owners of skilled nursing facilities are also entering the institutional pharmacy market, particularly in areas of their geographic concentration. On a nationwide basis, there is one other large competitor in the institutional pharmacy industry, Omnicare, Inc.
We believe that the competitive factors most important to our business are pricing, quality and the range of services offered, clinical expertise, ease of doing business with the provider and the ability to develop and maintain relationships with customers. Because relatively few barriers to entry exist in the local markets we serve, we have encountered and will continue to encounter substantial competition from local market entrants.
Patents, Trademarks and Licenses
We use a number of trademarks and service marks. All of the principal trademarks and service marks used in the course of our business have been registered in the United States or are the subject of pending applications for registration.
We have various proprietary products, processes, software and other intellectual property that are used either to facilitate the conduct of our business or that are made available as products or services to customers. We generally seek to protect such intellectual property through a combination of trade secret, patent and copyright laws and through confidentiality and other contractually imposed protections.
Although we believe that our products and processes do not infringe upon the intellectual property rights of any third parties, third parties may assert infringement claims against us from time to time.
Seasonality
Our largest customers in our institutional pharmacy segment are skilled nursing facilities. Both prescription and non-prescription drug sales at skilled nursing facilities are affected by the timing and severity of the cold/flu season and other seasonality of the long-term care facilities industry.
Working Capital
For information about the Corporation’s practices relating to working capital items, see “Item 7 Management’s Discussion and Analysis of Financial Condition and Results of Operations—Liquidity and Capital Resources”.
9
Table of Contents
Index to Financial Statements
Employees
As of December 31, 2010, we had approximately 6,400 employees which included approximately 1,000 part-time employees. As a result of the Chem Rx acquisition, the Corporation had 547 employees that were covered by collective bargaining agreements as of December 31, 2010. As of December 31, 2010, we employed approximately 1,700 licensed pharmacists. We believe that our relationships with our employees are good.
Government Regulation
General
Extensive federal, state and local regulations govern institutional pharmacies and the healthcare facilities that they serve. These regulations cover licenses, staffing qualifications, conduct of operations, reimbursement, recordkeeping and documentation requirements and the confidentiality and security of health-related information. Our institutional pharmacies are also subject to federal and state laws that regulate financial arrangements between healthcare providers, including the federal anti-kickback statutes and the federal physician self-referral statutes.
Licensure, Certification and Regulation
States generally require that the state board of pharmacy license a pharmacy operating within the state. Many states also regulate out-of-state pharmacies that deliver prescription products to patients or residents in their states. We have the necessary pharmacy state licenses, or pending applications, for each pharmacy we operate. Our pharmacies are also registered with the appropriate federal and state authorities pursuant to statutes governing the regulation of controlled substances. In addition, pharmacists, nurses and other healthcare professionals who provide services on our behalf are in most cases required to obtain and maintain professional licenses and are subject to state regulation regarding professional standards of conduct.
The Drug Enforcement Agency (the “DEA”), the U.S. Food and Drug Administration (the “FDA”) and various state regulatory authorities regulate the distribution of pharmaceutical products and controlled substances. These laws impose a host of requirements on the pharmaceutical supply channel, including providers of institutional pharmacy services. Under the Comprehensive Drug Abuse Prevention and Control Act of 1970, as a dispenser of controlled substances, we must register with the DEA, file reports of inventories and transactions and provide adequate security measures. In addition, we are required to comply with all the relevant requirements of the Controlled Substances Act for the transfer and shipment of pharmaceuticals. The FDA, DEA and state regulatory authorities have broad enforcement powers, including the ability to seize or recall products and impose significant criminal, civil and administrative sanctions for violations of these laws and regulations. We have received all necessary regulatory approvals and believe that our pharmacy operations are in substantial compliance with applicable federal and state good manufacturing practice requirements.
Client long-term care facilities are separately required to be licensed in the states in which they operate and, if serving Medicaid or Medicare patients, must be certified to be in compliance with applicable program participation requirements. Client facilities are also subject to the nursing home reforms of the Omnibus Budget Reconciliation Act of 1987, as amended, which imposed strict compliance standards relating to quality of care for facility operations, including vastly increased documentation and reporting requirements.
On September 20, 2006, CMS issued revised guidance to surveyors of long term care facilities regarding the survey protocol for review of pharmacy services provided in long-term care facilities participating in the Medicare and Medicaid programs. The new guidelines, which became effective December 18, 2006, expanded the areas and detail in which surveyors are to assess pharmacy services at the facility, including ordering, acquiring, receiving, storing, labeling, dispensing and disposing of all medications at the facility; the provision of medication-related information to health care professionals and residents; the process of identifying and addressing medication-related issues through medication regimen reviews and collaboration between the licensed
10
Table of Contents
Index to Financial Statements
consultant pharmacist, the facility and other healthcare professionals; and the provision, monitoring and use of medication-related devices. The guidelines also emphasize the important role of consultative services of pharmacists in promoting safe and effective medication use through the coordination of all aspects of pharmacy services provided to all residents within a facility. In addition, on September 30, 2008, the OIG published OIG Supplemental Compliance Program Guidance for Nursing Facilities. With quality of care being the first risk area identified, the supplemental guidance is part of a series of government efforts focused on improving quality of care at skilled nursing and long-term care facilities. The guidance contained new compliance recommendations and an expanded discussion of risk areas. The guidance stressed that facilities must provide pharmaceutical services to meet the needs of each resident and should be mindful of potential quality of care problems when implementing policies and procedures on proper medication management. It further stated that facilities can reduce risk by educating staff on medication management and improper pharmacy kickbacks for consultant pharmacists and that facilities should review the total compensation paid to consultant pharmacists to ensure it is not structured in a way that reflects the volume or value of particular drugs prescribed or administered to residents.
Laws Affecting Referrals and Business Practices
We are subject to federal and state laws that govern financial and other arrangements between healthcare providers. These laws prohibit certain direct and indirect payments or fee-splitting arrangements between healthcare providers that are designed to induce or encourage the referral of patients to, or the recommendation of, a particular provider for medical products and services. These laws include:
| • | the federal “anti-kickback” statute, which prohibits, among other things, knowingly or willfully soliciting, receiving, offering or paying remuneration “including any kickback, bribe or rebate” directly or indirectly in return for or to induce the referral of an individual to a person for the furnishing or arranging for the furnishing of any item or service for which payment may be made in whole or in part under Medicare, Medicaid or other federal healthcare programs; and |
| • | the federal “Stark laws” which prohibit, with limited exceptions, the referral of patients by physicians for certain designated health services, to an entity with which the physician has a financial relationship. |
These laws impact the relationships that we may have with potential referral sources. We have a variety of relationships with potential referral sources, including hospitals and skilled nursing facilities with which we have contracted to provide pharmacy services. With respect to the anti-kickback statute, the OIG has enacted safe harbor regulations that outline practices that are deemed protected from prosecution. While we endeavor to comply with the applicable safe harbors, certain of our current arrangements, none of which is material to us, may not qualify for safe harbor protection. Failure to meet a safe harbor does not mean that the arrangement necessarily violates the anti-kickback statute, but may subject the arrangement to greater scrutiny. In addition, as a means of providing guidance to healthcare providers, the OIG issues a variety of sub-regulatory guidance including Special Fraud Alerts, Special Advisory Bulletins, Advisory Opinions, and other compliance guidance documents. This guidance does not have the force of law, but identifies features of arrangements or transactions that may indicate that the arrangements or transactions violate the anti kickback statute or other federal health care laws. While we believe our practices comply with the anti-kickback statute, we cannot assure our practices that are outside of a safe harbor will not be found to violate the anti-kickback statute.
In addition to federal law, many states have enacted similar statutes which are not necessarily limited to items or services for which payment is made by federal healthcare programs. Violations of these laws may result in fines, imprisonment, denial of payment for services and exclusion from the Medicare and Medicaid programs and other state-funded programs.
Other provisions in the Social Security Act and in other federal and state laws authorize the imposition of penalties, including criminal and civil fines and exclusions from participation in Medicare, Medicaid and other federal healthcare programs for false claims, improper billing and other offenses. These laws include the federal
11
Table of Contents
Index to Financial Statements
False Claims Act, under which private parties have the right to bring “qui tam” whistleblower lawsuits against companies that submit false claims for payments to the government. Recent changes to the False Claims Act, expanding liability to certain additional parties and circumstances, may make these qui tam law lawsuits more prevalent. Some states have adopted similar state whistleblower and false claims laws.
In addition, a number of states have undertaken enforcement actions against pharmaceutical manufacturers involving pharmaceutical marketing programs, including looking at relationships with pharmacies and programs containing incentives for pharmacists to dispense one particular product rather than another. These enforcement actions arose under various state laws including fraud and abuse laws and consumer protection laws which generally prohibit false advertising, deceptive trade practices and the like.
In the ordinary course of business, we are subject regularly to inquiries, investigations and audits by federal and state agencies that oversee applicable healthcare program participation and payment regulations. We believe that the regulatory environment surrounding most segments of the healthcare industry remains intense. Federal and state governments continue to impose intensive enforcement policies resulting in a significant number of inspections, citations for regulatory deficiencies and other regulatory sanctions including demands for refund of overpayments, terminations from the Medicare and Medicaid programs, bars on Medicare and Medicaid payments and fines. To date, we have not experienced any demands for refund of overpayments, terminations from the Medicare and Medicaid programs, bars on Medicare and Medicaid payments or fines that are material to us. However, such sanctions could have a material adverse effect on our financial position, results of operation and liquidity.
We believe our contract arrangements with other healthcare providers, our pharmaceutical suppliers and our pharmacy practices are in substantial compliance with applicable federal and state laws. These laws may, however, be interpreted in the future in a manner inconsistent with our interpretation and application.
State Laws Affecting Access to Services
Some states have enacted “freedom of choice” or “any willing provider” requirements as part of their state Medicaid programs or in separate legislation. These laws may preclude a nursing center from requiring their patients and residents to purchase pharmacy or other ancillary medical services or supplies from particular providers that have a supplier relationship with the nursing center. Limitations such as these may increase the competition which we face in providing services to nursing center residents.
HIPAA
The federal Health Insurance Portability and Accountability Act of 1996, commonly known as “HIPAA”, mandates the adoption of regulations aimed at standardizing transaction formats and billing codes for documenting medical services, dealing with claims submissions and protecting the privacy and security of individually identifiable health information. HIPAA regulations that standardize transactions and code sets require standard formatting for healthcare providers, like us, that submit claims electronically.
The HIPAA privacy regulations apply to “protected health information,” or “PHI” which is defined generally as individually identifiable health information transmitted or maintained in any form or medium, excluding certain education records and student medical records. The privacy regulations seek to limit the use and disclosure of most paper and oral communications, as well as those in electronic form, regarding an individual’s past, present or future physical or mental health or condition, or relating to the provision of healthcare to the individual or payment for that healthcare, if the individual can or may be identified by such information. HIPAA provides for the imposition of civil or criminal penalties if PHI is improperly disclosed.
HIPAA’s security regulations require us to ensure the confidentiality, integrity and availability of all electronic protected health information that we create, receive, maintain or transmit. We must protect against reasonably anticipated threats or hazards to the security of such information and the unauthorized use or disclosure of such information.
12
Table of Contents
Index to Financial Statements
In addition to HIPAA, we are subject to state privacy laws and other state privacy or health information requirements not preempted by HIPAA, including those which may furnish greater privacy protection for individuals than HIPAA.
The scope of our operations involving health information is broad and the nature of those operations is complex. Although we believe that our contract arrangements with healthcare payers and providers and our business practices are in material compliance with applicable federal and state electronic transmissions, privacy and security of health information laws, the requirements of these laws, including HIPAA, are complicated and are subject to interpretation. In addition, state regulation of matters also covered by HIPAA, especially the privacy standards, is increasing, and determining which state laws are preempted by HIPAA is a matter of interpretation. Failure to comply with HIPAA or similar state laws could subject us to loss of customers, denial of the right to conduct business, civil damages, fines, criminal penalties and other enforcement actions.
The American Recovery and Reinvestment Act of 2009, commonly known as the “Stimulus Package”, changed several aspects of HIPAA inc luding, without limitation, the following: (i) applies HIPAA security provisions and penalties to busienss associates of covered entities; (ii) requires certain notifications in the event of a security breach involving PHI; (iii) restricts certain unauthorized disclosures; (iv) changes the treatment of certain marketing activities; and (v) strengthens enforcement activities. In addition, the Secretary issued an interim final rule on Augsut 24, 2009 that requires notifications for certain breaches of PHI. A final rule has yet to be issued.
Stimulus Package
The Stimulus Package is a $787.0 billion federal bill intended to stimulate the economy through both tax cuts and increased government spending. Within this package there are a variety of healthcare-related provisions including (i) the $87.0 billion temporary increase in Medicaid Federal Medical Assistance Percentage (“FMAP”), and (ii) the $21.0 billion of funding to encourage adoption of certain health information technology. At this time, the Corporation is unable to fully evaluate the impact of the Stimulus Package to its business.
2010 Health Care Legislation
On March 23, 2010, President Obama signed into law the Patient Protection and Affordable Care Act and on March 30, 2010, President Obama signed into law the reconciliation law known as Health Care and Education Affordability Reconciliation Act (the “Reconciliation Act”), combined both Acts will hereinafter be referred to as “2010 Health Care Legislation”. Four key provisions of the 2010 Health Care Legislation that are relevant to the Corporation are: (i) the gradual modification to the calculation of the Federal Upper Limit (“FUL”) for drug prices and the definition of Average Manufacturer’s Price (“AMP”), (ii) the closure, over time, of the Part D coverage gap, which is otherwise known as the “Donut Hole”, (iii) short cycle dispensing requirements, and (iv) Biosimilar Biological Products. The constitutionality of the 2010 Health Care Legislation has been challenged in several Federal courts. At this time, the courts have split on the constitutionality of the 2010 Health Care Legislation. These decisions have been appealed and are expected to eventually be collectively decided by the United States Supreme Court. Pending a final decision on the constitutionality of the legislation and the promulgation of regulations thereunder, the Corporation is unable to fully evaluate the impact of the 2010 Health Care Legislation.
FUL and AMP Changes
The 2010 Health Care Legislation amended the Deficit Reduction Act of 2005 (the “DRA”) to change the definition of the FUL by requiring the calculation of the FUL as no less than 175% of the weighted average, based on utilization, of the most recently reported monthly AMP for pharmaceutically and therapeutically equivalent multi-source drugs available through retail community pharmacies nationally.
In addition, the definition of AMP changed to reflect net sales only to drug wholesalers that distribute to retail community pharmacies and to retail community pharmacies that directly purchase from drug
13
Table of Contents
Index to Financial Statements
manufacturers. Further, the 2010 Health Care Legislation continues the current statutory exclusion of prompt pay discounts offered to wholesalers and adds three other exclusions to the AMP definition; i) bona fide services fees; ii) reimbursement for unsalable returned goods (recalled, expired, damaged, etc.); and iii) payments from and rebates/discounts to certain entities not conducting business as a wholesaler or retail community pharmacy. In addition to reporting monthly, the manufacturers will be required to report the total number of units used to calculate each monthly AMP. CMS will use this information when it establishes the FUL pursuant to the 2010 Health Care Legislation.
Manufacturers made their first reports of AMP to CMS in October 2010. CMS is reviewing the information reported by the manufacturers and has yet to revise the FUL based on its analysis of AMP.
Until CMS provides additional guidance, the Corporation is unable to fully evaluate the impact of the changes in FUL and AMP to its business.
Part D Coverage Gap
Starting on January 1, 2011, the Medicare Coverage Gap Discount Program (the “Program”) requires drug manufacturers to provide a 50% discount on the negotiated ingredient cost to certain Part D beneficiaries for certain drugs and biologics purchased during the coverage gap (this is exclusive of the pharmacy dispensing fee). In addition, the 2010 Health Care Legislation includes a requirement that closes or eliminates the coverage gap entirely by fiscal year 2020. The coverage gap will be eliminated by gradually reducing the coinsurance percentage for both drugs covered and not covered by the Program for each applicable beneficiary.
At this time, the Corporation is unable to fully evaluate the impact of the changes to the coverage gap to its business.
Short Cycle Dispensing
Pursuant to the 2010 Health Care Legislation, Prescription Drug Plans (“PDPs”), will be required under Medicare Part D and Medicare Advantage prescription drug plans (“Medicare Advantage” or “MAPDs”) to utilize specific, uniform dispensing techniques, such as weekly, daily, or automated dose dispensing, when dispensing covered Part D drugs to beneficiaries who reside in a long-term care facility to reduce waste associated with 30 to 90 day prescriptions for such beneficiaries. This short cycle dispensing provision will take effect on January 1, 2012. On November 22, 2010, CMS proposed regulations pursuant to the 2010 Health Care Legislation requiring pharmacies dispensing to long-term care facilities to dispense no more than 17-day supplies of brand-name medications covered by Part D except in limited circumstances (e.g. medications that are difficult to dispense in short-cycle form and medications that are dispensed to treat acute illnesses). Multiple stakeholders have commented extensively on these proposed regulations and requested significant changes and/or a delay to the implementation of short cycle dispensing.
Until the regulations become final the Corporation is unable to fully evaluate the impact of short cycle dispensing changes to its business. Depending on the ultimate outcome, short cycle dispensing could have a material adverse impact on the Corporation’s operating costs if the Corporation is not able to obtain increased reimbursement rates to cover such increased costs.
Biosimilar Biological Products
The 2010 Health Care Legislation creates a regulatory approval pathway for biosimilars (alternatively known as generics) for biological products. An innovator biological product will be granted 12 years of exclusivity. At this time, the Corporation is unable to fully evaluate the impact of the changes to biosimilars to its business.
Federal Trade Commission Red Flags Rule
Identity Theft Red Flags and Address Discrepancy Rules, referred to as the Red Flags Rule, require creditors that maintain certain kinds of “covered accounts” to develop and implement a written program to detect
14
Table of Contents
Index to Financial Statements
and respond to identity theft. Because the Corporation does not require full payment at the time of service of a patient, it is considered a creditor for purposes of the Red Flags Rule. The Corporation has implemented a program under the Red Flags Rule to detect and respond to identity theft. Failure to implement a program can result in substantial monetary penalties.
Overview of Reimbursement
Medicare is a federal program that provides certain hospital and medical insurance benefits to persons age 65 and over and to certain disabled persons. Medicaid is a medical assistance program administered by each state that provides healthcare benefits to certain indigent patients. Within the Medicare and Medicaid statutory framework, there are substantial areas subject to administrative rulings, interpretations, and discretion that may affect payments made under Medicare and Medicaid.
We receive payment for our services from institutional healthcare providers, commercial Medicare Part D Plans, third party payers government reimbursement programs such as Medicare and Medicaid, and other non-government sources such as commercial insurance companies, health maintenance organizations, preferred provider organizations, and contracted providers. With respect to our skilled nursing facilities customers, their residents are covered by Medicare Part A, Part B and Part D Plans, Medicaid, insurance, and other private payers (including managed care).
Medicare
The Medicare program consists of four parts: (i) Medicare Part A, which covers, among other things, in-patient hospital, skilled nursing facilities, home healthcare, and certain other types of healthcare services; (ii) Medicare Part B, which covers physicians’ services, outpatient services, and certain items and services provided by medical suppliers such as intravenous therapy; (iii) a managed care option for beneficiaries who are entitled to Medicare Part A and enrolled in Medicare Part B, known as Medicare Part C or Medicare Advantage; and (iv) Medicare Part D, which provides coverage for prescription drugs that are not otherwise covered under Medicare Part A or Part B for those beneficiaries that enroll.
Part A
The Balanced Budget Act of 1997 (the “BBA”) mandated the Prospective Payment System (“PPS”) for Medicare-eligible enrolled residents in skilled nursing facilities. Under PPS, Medicare pays skilled nursing facilities a fixed fee per patient per day for extended care services to patients, covering substantially all items and services furnished during such enrollee’s stay. Such services and items include pharmacy services and prescription drugs. We bill skilled nursing facilities based upon a negotiated fee schedule and are paid based on those contractual relationships. We do not receive direct payment from Medicare for patients covered under the Medicare Part A benefit. We classify the revenues recognized from these payers as Institutional Healthcare Providers.
Federal legislation continues to focus on reducing Medicare and Medicaid program expenditures. Such decreases may directly impact the Corporation’s customers and their Medicare reimbursement. Given the changing nature of these rules, we are unable at this time to fully evaluate the impact on our business. Any evaluation of budgeting, cost-cutting, and financing of health care must also consider the new federal administration and the impact its proposed health care policies could have on any future cost considerations.
Part B
The MMA also changed the Medicare payment methodology and conditions for coverage of certain items of durable medical equipment, prosthetics, orthotics, and supplies (“DMEPOS”) under Medicare Part B. The Corporation provides some of these products to its customers. The changes include, among other things, a new
15
Table of Contents
Index to Financial Statements
competitive bidding program. Beginning on January 1, 2011 in selected areas and for selected supplies, only suppliers that were winning bidders are eligible to provide services, at prices established as a result of the competitive bids, to Medicare beneficiaries. Enteral nutrients, equipment and supplies, and oxygen equipment and supplies are among the 10 categories of DMEPOS included in the first round of the competitive bidding process. The Corporation did not participate in the bidding process. The Corporation will continue to evaluate whether it will participate in additional rounds of the bidding, which CMS has not yet scheduled.
Part D
Medicare Part D provides coverage for prescription drugs that are not otherwise covered under Medicare Part A or Part B for those beneficiaries that enroll. Under Medicare Part D, beneficiaries may enroll in prescription drug plans offered by private commercial insurers who contract with CMS (or in a “fallback” plan offered on behalf of the government through a contractor, to the extent private entities fail to offer a plan in a given area), which provide coverage of outpatient prescription drugs (collectively, “Part D Plans”). Part D Plans include both plans providing the drug benefit on a stand alone basis and Medicare Advantage plans providing drug coverage as a supplement to an existing medical benefit under that Medicare Advantage plan. Medicare beneficiaries generally have to pay a premium to enroll in a Part D Plan, with the premium amount varying from one Part D Plan to another, although CMS provides various federal subsidies to Part D Plans to reduce the cost to beneficiaries.
Part D Plans are required to make available certain drugs on their formularies. Dually-eligible residents in nursing centers generally are entitled to have their prescription drug costs covered by a Part D Plan, provided that the prescription drugs which they are taking are either on the Part D Plan’s formulary or an exception to the Part D Plan’s formulary is granted. CMS reviews the formularies of Part D Plans and requires these formularies to include the types of drugs most commonly used by Medicare beneficiaries. CMS also reviews the formulary exceptions criteria of the Part D Plans that provide for coverage of drugs determined by the Part D Plan to be medically appropriate for the enrollee; however there currently is not a separate formulary for long-term care residents.
We obtain reimbursement for drugs we provide to enrollees of the given Part D Plan in accordance with the terms of agreements negotiated between us and the Part D Plan. The Medicare Part D final rule prohibits Part D plans from paying for drugs and services not specifically called for by the BBA. Beginning in 2010, CMS requires Part D sponsors to use pass-through pricing, based on the price actually received by the pharmacy for drugs, in order to determine beneficiary cost sharing and drug reporting. This change, and similar changes by CMS aimed at ensuring administrative costs are absorbed by the Pharmacy Benefit Manager (“PBM”) and not the government, may alter the way certain PBMs negotiate prices with pharmacies. Currently, we are unable to fully evaluate the impact of this change in pricing definition on the Corporation.
In addition, beginning January 2010, MIPPA required that all PDPs are required to provide prompt payment to pharmacies. PDP and MAPDs must pay clean claims to retail pharmacies within 14 days if submitted electronically, or within 30 days otherwise.
Medicare Part D does not alter federal reimbursement for residents of nursing centers whose stay at the nursing center is covered under Medicare Part A. Accordingly, Medicare’s fixed per diem payments to nursing centers under PPS will continue to include a portion attributable to the expected cost of drugs provided to such residents. We will, therefore, continue to receive reimbursement for drugs provided to such residents from the nursing center in accordance with the terms of our agreements with each nursing center.
In June 2009, CMS released a report indicating that approximately $41.0 million in Medicare Part D payments for prescription drugs, some dispensed by LTC pharmacies, were likely made incorrectly. CMS concluded many of the drugs, which were dispensed during Part A skilled nursing facility stays, should have been included in per diem payments under Medicare Part A. CMS stated it will focus on ensuring such improper
16
Table of Contents
Index to Financial Statements
payments do not occur in the future. We are unable to fully evaluate the impact of current and future federal initiatives aimed at eliminating these discrepancies.
In addition, we receive rebates from pharmaceutical manufacturers for undertaking certain activities that the manufacturers believe may increase the likelihood that we will dispense their products. CMS continues to question whether institutional pharmacies should be permitted to receive these access/performance rebates from manufacturers with respect to prescriptions covered under Medicare Part D, but has not prohibited the receipt of such rebates. CMS defines these as rebates a manufacturer provides to long-term care pharmacies that are designed to “prefer, protect, or maintain” that manufacturer’s product selection by the long-term care pharmacy or to increase the volume of that manufacturer’s products that are dispensed by the pharmacy under its formulary. CMS, in 2007, required PDPs to have policies and systems in place as part of their drug utilization management programs to protect beneficiaries and reduce costs when long-term care pharmacies receive incentives to move market share through access/performance rebates. The elimination or substantial reduction of manufacturer rebates, if not offset by other reimbursement, would have an adverse effect on our business.
Medicaid
The reimbursement rate for pharmacy services under Medicaid is determined on a state-by-state basis subject to review by CMS and applicable federal law. Although Medicaid programs vary from state to state, they generally provide for the payment of certain pharmacy services, up to established limits, at rates determined in accordance with each state’s regulations. The federal Medicaid statute specifies a variety of requirements that a state plan must meet, including the requirements related to eligibility, coverage for services, payment, and admissions. For residents that are eligible for Medicaid only, and are not dual eligibles covered under Medicare Part D, we bill the individual state Medicaid program or in certain circumstances the state’s designated managed care or other similar organizations. Federal regulations and the regulations of certain states establish “upper limits” for reimbursement of certain prescription drugs under Medicaid. In most states, pharmacy services are priced at the lower of “usual and customary” charges or cost, which generally is defined as a function of average wholesale price and may include a profit percentage plus a dispensing fee. Most states establish a fixed dispensing fee per prescription that is adjusted to reflect associated cost. Over the last several years, state Medicaid programs have lowered reimbursement through a variety of mechanisms, principally higher discounts off average wholesale price levels, expansion of the number of medications subject to federal upper limit pricing, and general reductions in contract payment methodology to pharmacies.
Other
Average wholesale price, (“AWP”), is a pricing benchmark published by First DataBank, Inc. in its Blue Book, which provides drug databases, content integration software, and drug reference products. AWP has been widely used to calculate the majority of the Medicaid, Medicare Part A and Medicare Part D drug reimbursements payable to pharmacy providers. In 2005, several pension funds brought an action against First DataBank and another healthcare provider alleging collusion to set AWPs for branded drugs.
On March 30, 2009, the Court approved the settlement of the litigation. Pursuant to the settlement on September 26, 2009, First DataBank: (i) adjusted its reporting of Blue Book AWP for those prescription drugs (approximately 1,400 National Drug Codes, or NDCs in number) identified in the plaintiffs’ previously filed complaint by reducing the mark-up factor utilized in connection with the calculation of the Blue Book AWP data field to 1.20 times the Wholesale Acquisition Cost, or WAC, or direct price for those prescription drugs that are on a mark-up basis; and (ii) established a centralized data repository to facilitate reasonable access to discoverable material from First DataBank concerning its drug price reporting practices.
Independent of the settlement and on the same schedule as the Blue Book AWP adjustment noted above, First DataBank applied the same 1.20 markup factor to all other NDCs, whose Blue Book AWP is set based upon a markup to WAC or direct price in excess of 1.20 times WAC. First DataBank will also independently discontinue publishing the Blue Book AWP data field for all drugs no later than September 26, 2011.
17
Table of Contents
Index to Financial Statements
The Corporation and the preponderance of the Corporation’s PDP’s, third party insurance companies and its Medicare Part A customers have voluntarily agreed to adjust reimbursement so that pricing would not increase or decrease as a result of the changes to AWP; however, the state Medicaid programs have been unwilling to remain price neutral and accordingly the Corporation is being reimbursed based on the adjusted AWP. This exposure is primarily related to the states in which the Corporation operates, who have refused to adjust their Medicaid reimbursement or otherwise were not reimbursing based on WAC. The National Association of Chain Drug Stores and the National Community Pharmacists Association, the industry trade groups, have filed lawsuits against several state Medicaid programs to force the state Medicaid programs to agree to price neutrality. These cases are still pending. We anticipate that the refusal of the state Medicaid programs to remain price neutral will continue to have a negative impact on our revenues.
The costs associated with complying with federal and state regulations could be significant and the failure to comply with any such legal requirements could have a material adverse effect on our financial condition, results of operations, and liquidity.
Environmental Matters
In operating our facilities, historically we have not encountered any material difficulties effecting compliance with applicable pollution control laws. No material capital expenditures for environmental control facilities are expected. While we cannot predict the effect which any future legislation, regulations or interpretations may have upon our operations, we do not anticipate any changes regarding pollution control laws that would have a material adverse impact on the Corporation.
Available Information
We make available free of charge on or through our web site, at www.pharmerica.com, our annual reports on Form 10-K, quarterly reports on Form 10-Q, current reports on Form 8-K and all amendments to those reports as soon as reasonably practicable after such material is electronically filed with the SEC. Additionally, the public may read and copy any materials we file with the SEC at the SEC’s Public Reference Room at 100 F Street, NE, Room 1580, Washington, D.C., 20549. Information regarding operation of the Public Reference Room is available by calling the SEC at 1-800-SEC-0330. Information that we file with the SEC is also available at the SEC’s web site at www.sec.gov.
Our SEC filings are available to the public through the New York Stock Exchange (“NYSE”), 20 Broad Street, New York, New York, 10005. Our Common Stock is listed on the NYSE and trades under the symbol “PMC”.
The certifications of our Chief Executive Officer and Chief Financial Officer required under Section 302 of the Sarbanes-Oxley Act have been filed as Exhibits 31.1 and 31.2 to this Annual Report on Form 10-K.
18
Table of Contents
Index to Financial Statements
You should consider carefully the risks described below, together with all of the other information, in evaluating our company and our common stock. If any of the risks described below actually occur, it could have a material adverse effect on our business, results of operations, financial position and stock price.
Risk Factors Relating to the Pharmacy Transaction
We may be charged for services and products from one of our former parents at amounts greater than those charged prior to the Pharmacy Transaction and those charged by third-parties.
Before the Pharmacy Transaction, our business was part of two separate public companies. Our former parent companies performed many corporate functions at costs that are less than those that are presently being charged. Kindred provides information technology services under the Information Technology Services Agreement. During the term of the Information Technology Services Agreement, we are not able to negotiate potentially better terms and thus this existing agreement could negatively impact our results of operations, financial position and competitive position.
Risk Factors Relating to Our Business
The integration of the remaining pharmacy locations and systems infrastructure including newly acquired pharmacies will be time consuming and could have a material adverse effect on our results of operations.
We will continue our information systems integration to one operating platform which will continue to be time consuming, may distract our management from our operations, may be disruptive to our customers and will be expensive, all of which could have a material adverse effect on our results of operations.
Financial soundness of our customers and suppliers may adversely affect our results of operations.
If our customers’ operating and financial performance deteriorates, or if they are unable to make scheduled payments or obtain credit, our customers may not be able to pay, or may delay payment of, accounts receivable owed to us. Any inability of customers to pay us for our products and services may adversely affect our earnings and cash flow. Additionally, both state and federal government sponsored payers, as a result of budget deficits or reductions, may seek to reduce their health care expenditures by renegotiating their contracts with us. Any reduction in payments by such government sponsored payers may adversely affect our earnings and cash flow.
Intense competition may erode our profit margins.
The distribution of pharmaceuticals to healthcare facilities is highly competitive. In each geographic market, there are national, regional and local institutional pharmacies and numerous local retail pharmacies, which provide services comparable to those offered by our pharmacies and which may have greater financial and other resources than we do and may be more established in the markets they serve than we are. We also compete against regional and local pharmacies that specialize in long-term care. Many of our competitors have equal or greater resources and access to capital than the Corporation. In addition, local pharmacies have strong personal relationships with their customers. Because relatively few barriers to entry exist in the local markets we serve, we may encounter substantial competition from local market entrants. Consolidation within the institutional pharmacy industry may also lead to increased competition. Competitive pricing pressures may adversely affect our earnings and cash flow.
We compete based on innovation and service as well as price. To attract new clients and retain existing clients, we must continually meet service expectations of our clients and customers. We cannot be sure that we will continue to remain competitive with the service to our clients at our current levels of profitability.
19
Table of Contents
Index to Financial Statements
If we lose relationships with one or more key pharmaceutical manufacturers or if the payments made or discounts provided by pharmaceutical manufacturers decline, our business and financial results could be adversely affected
We maintain contractual relationships with numerous pharmaceutical manufacturers that may provide us with, among other things:
| • | discounts for drugs we purchase to be dispensed from institutional pharmacies; |
| • | rebates based upon distributions of drugs from our institutional pharmacies; and |
| • | administrative fees for managing rebate programs. |
If several of these contractual relationships are terminated or materially altered by the pharmaceutical manufacturers, our business and financial results could be materially adversely affected. In addition, formulary fee programs have been the subject of debate in federal and state legislatures and various other public and governmental forums. Changes in existing laws or regulations or in interpretations of existing laws or regulations or the adoption of new laws or regulations relating to any of these programs may materially adversely affect our business.
Our operating revenue and profitability may suffer upon the occurrence of the loss of certain customers.
We have a number of customers that own or operate numerous facilities in our institutional pharmacy segment. In addition, our hospital segment revenues are primarily derived from one large multi-facility customer. If we are not able to continue these relationships or are only able to continue these relationships on less favorable terms than the ones currently in place, our operating revenues and results of operations would be materially impacted. There can be no assurance that these customers will not terminate all or a portion of their contracts with the Corporation.
Our operating revenue and profitability may suffer because of an increase in our generic dispensing rate.
A shift in prescriptions dispensed from brand-to-generic and a decline in generic reimbursement rates from the PDP/PBMs may affect our operating revenue. When a branded drug shifts to a generic, initial pricing of the generic drug in the market will vary depending on the number of manufacturers launching their generic version of the drug. Historically a shift from brand-to-generic decreased our revenue and improved our gross margin from sales of these classes of drugs during the initial time period a brand drug has a generic alternative. However, recent experience has indicated that the third-party payers may reduce their reimbursements to the Corporation faster than previously experienced. This acceleration in the reimbursement reduction has resulted in margin compression much earlier than we have historically experienced. Due to the unique nature of the brand-to-generic conversion, management cannot estimate the future financial impact of the brand-to-generic conversions on its results of operations.
If we fail to comply with complex and rapidly evolving laws and regulations, we could suffer penalties, be required to pay substantial damages or make significant changes to our operations.
We are subject to numerous federal and state regulations. If we fail to comply with existing or future applicable laws and regulations, we could suffer civil or criminal penalties, including the loss of our licenses to operate our institutional pharmacies and our ability to participate in federal and state healthcare programs. As a consequence of the severe penalties we could face, we must devote significant operational and managerial resources to complying with these laws and regulations. Although we believe that we are substantially compliant with all existing statutes and regulations applicable to our business, different interpretations and enforcement policies of these laws and regulations could subject our current practices to allegations of impropriety or illegality, or could require us to make significant changes to our operations. In addition, we cannot predict the impact of future legislation and regulatory changes on our business or assure that we will be able to obtain or maintain the regulatory approvals required to operate our business.
20
Table of Contents
Index to Financial Statements
Pharmaceutical products can develop unexpected safety or efficacy concerns.
Unexpected safety or efficacy concerns can arise with respect to marketed products, whether or not scientifically justified, leading to product recalls, withdrawals or declining sales. If we fail to or do not promptly withdraw pharmaceutical products upon a recall by a drug manufacturer, our business and results of operations could be negatively impacted.
Legal and regulatory changes reducing reimbursement rates for pharmaceuticals and/or medical treatments or services may reduce our profitability.
Both our own profit margins and the profit margins of our customers may be adversely affected by laws and regulations reducing reimbursement rates and charges. The sources and amounts of our revenues are determined by a number of factors, including licensed bed capacity and occupancy rates of our customers, the number of drugs administered to patients, the mix of pharmaceuticals dispensed, whether the drugs are brand or generic, and the rates of reimbursement among payers. Changes in the number of drugs administered to patients, as well as payer mix among private pay, Medicare and Medicaid, in our customers’ facilities will significantly affect our earnings and cash flow.
Medicare Part D
The Medicare Prescription Drug Improvement and Modernization Act of 2003 or MMA included a major expansion of the Medicare program with the addition of a prescription drug benefit under the new Medicare Part D program. The continued impact of these regulations depends upon a variety of factors, including our ongoing relationships with the Part D Plans and the patient mix of our customers. Future modifications to the Medicare Part D program may reduce revenue and impose additional costs to the industry. In addition, we cannot assure you that Medicare Part D and the regulations promulgated under Medicare Part D will not have a material adverse effect on our institutional pharmacy business.
Risks related to manufacturer rebates
Our pharmacies receive rebates from pharmaceutical manufacturers for undertaking certain activities that the manufacturers believe may increase the likelihood that their respective products will be dispensed. CMS has questioned whether long-term care pharmacies should be permitted to receive discounts, rebates and other price concessions from pharmaceutical manufacturers with respect to prescriptions covered under the Medicare Part D benefit. Our business would be adversely affected if CMS should take any action that has the effect of eliminating or significantly reducing the rebates that we receive from pharmaceutical manufacturers.
Changes in Medicaid Reimbursement
The 2010 Health Care Legislation amended the Deficit Reduction Act of 2005 (the “DRA”) to change the definition of the FUL by requiring the calculation of the FUL as no less than 175% of the weighted average, based on utilization, of the most recently reported monthly AMP for pharmaceutically and therapeutically equivalent multi-source drugs available through retail community pharmacies nationally.
In addition, the definition of AMP changed to reflect net sales only to drug wholesalers that distribute to retail community pharmacies and to retail community pharmacies that directly purchase from drug manufacturers. Further, the 2010 Health Care Legislation continues the current statutory exclusion of prompt pay discounts offered to wholesalers and adds three other exclusions to the AMP definition; i) bona fide services fees; ii) reimbursement for unsalable returned goods (recalled, expired, damaged, etc.); and iii) payments from and rebates/discounts to certain entities not conducting business as a wholesaler or retail community pharmacy. In addition to reporting monthly, the manufacturers will be required to report the total number of units used to calculate each monthly AMP. CMS will use this information when it establishes the FUL as a result of the new volume-weighted requirements pursuant to the 2010 Health Care Legislation.
21
Table of Contents
Index to Financial Statements
Manufacturers made their first reports of AMP to CMS in October 2010. CMS is reviewing the information reported by the manufacturers and has yet to revise the FUL based on its analysis of AMP.
Until CMS provides additional guidance, the Corporation is unable to fully evaluate the impact of the changes in FUL and AMP to its business.
The settlement by First DataBank, Inc. on pricing benchmark may reduce reimbursement to us.
Average wholesale price, or AWP, is a pricing benchmark published by First DataBank, Inc. in its Blue Book, that provides drug databases, content integration software, and drug reference products. AWP has been widely used to calculate a portion of the Medicaid and Medicare Part D drug reimbursements payable to pharmacy providers. In 2005, several pension funds brought an action against First DataBank and another healthcare provider alleging collusion to set AWPs for branded drugs.
On March 30, 2009, the Court approved the settlement of the litigation. Pursuant to the settlement, First DataBank: (i) adjusted its reporting of Blue Book AWP for those prescription drugs (approximately 1,400 National Drug Codes, or NDCs in number) identified in the plaintiffs’ previously filed complaint by reducing the mark-up factor utilized in connection with the calculation of the Blue Book AWP data field to 1.20 times the Wholesale Acquisition Cost, or WAC, or direct price for those prescription drugs that are on a mark-up basis; and (ii) established a centralized data repository to facilitate reasonable access to discoverable material from First DataBank concerning its drug price reporting practices. The price adjustment required under the provisions of the settlement agreement occurred on September 26, 2009.
Independent of the settlement and on the same schedule as the Blue Book AWP adjustment noted above, First DataBank intends to apply the same 1.20 markup factor to all NDCs whose Blue Book AWP is set based upon a markup to WAC or direct price in excess of 1.20 times WAC. First DataBank will also independently discontinue publishing the Blue Book AWP data field for all drugs no later than two years following the date that the Blue Book AWP adjustments noted above are implemented.
The Corporation and the vast preponderance of the Corporation’s PDP’s, third party insurance companies and its Medicare Part A customers have voluntarily agreed to adjust reimbursement so that pricing could not increase or decrease as a result of the changes to AWP; however, the state Medicaid programs have been unwilling to remain price neutral and accordingly the Corporation is being reimbursed based on the adjusted AWP. This exposure is limited to the states who are refusing to adjust prices at this time. Currently, the National Association of Chain Drug Stores and the National Community Pharmacists Association, the industry trade groups, have filed lawsuits against several state Medicaid programs to force the state Medicaid programs to agree to price neutrality. These cases are still pending.
As a result of political, economic, and regulatory influences, the healthcare delivery industry in the United States is under intense scrutiny and subject to fundamental changes. We cannot predict which reform proposals will be adopted, when they may be adopted, or what impact they may have on us.
The costs associated with complying with federal and state regulations could be significant and the failure to comply with any such legal requirements could have a material adverse effect on our financial condition, results of operations, and liquidity.
22
Table of Contents
Index to Financial Statements
Adverse results in material litigation matters or governmental inquiries could have a material adverse effect upon the Corporation’s business.
The Corporation may from time to time become subject in the ordinary course of business to material legal action related to, among other things, intellectual property disputes, professional liability and employee-related matters, as well as inquiries from governmental agencies and Medicare or Medicaid carriers requesting comment and information on allegations of billing irregularities and other matters that are brought to their attention through billing audits, third parties or other sources. The health care industry is subject to substantial federal and state government regulation and audit. Legal actions could result in substantial monetary damages as well as damage to the Corporation’s reputation with customers, which could have a material adverse effect upon our financial condition, results of operations, and liquidity.
If we or our customers fail to comply with Medicare and Medicaid regulations, we may be subjected to penalties or loss of eligibility to participate in these programs.
The Medicare and Medicaid programs are highly regulated. These programs are also subject to frequent and substantial changes. If we or our customers’ facilities fail to comply with applicable reimbursement laws and regulations, whether purposely or inadvertently, our reimbursement under these programs could be curtailed or reduced and our eligibility to continue to participate in these programs could be adversely affected. Federal or state governments may also impose other penalties on us for failure to comply with the applicable reimbursement regulations. Failure by our customers to comply with these or future laws and regulations could result in our inability to provide pharmacy services to these customers and their residents. We do not believe that we have taken any actions that could subject us to material penalties under these rules and regulations.
Among these laws is the federal anti-kickback statute. This statute prohibits anyone from knowingly and willfully soliciting, receiving, offering or paying any remuneration with the intent to refer, or to arrange for the referral or order of, services or items payable under a federal healthcare program. Courts have interpreted this statute broadly. Violations of the anti-kickback statute may be punished by a criminal fine of up to $25,000 for each violation or imprisonment, civil money penalties of up to $50,000 per violation and damages of up to three times the total amount of the remuneration and/or exclusion from participation in federal health care programs, including Medicare and Medicaid. This law impacts the relationships that we may have with potential referral sources. We have a variety of relationships with potential referral sources, including hospitals and skilled nursing facilities with which we have contracted to provide pharmacy services. The Office of Inspector General at HHS, or OIG, among other regulatory agencies, is responsible for identifying and eliminating fraud, abuse or waste. The OIG carries out this responsibility through a nationwide program of audits, investigations and inspections. The OIG has promulgated safe harbor regulations that outline practices that are deemed protected from prosecution under the anti-kickback statute. While we endeavor to comply with the applicable safe harbors, certain of our current arrangements may not qualify for safe harbor protection. Failure to meet a safe harbor does not mean that the arrangement necessarily violates the anti-kickback statute, but may subject the arrangement to greater scrutiny. It cannot be assured that practices outside of a safe harbor will not be found to violate the anti-kickback statute.
23
Table of Contents
Index to Financial Statements
The anti-kickback statute and similar state laws and regulations are expansive. We do not always have the benefit of significant regulatory or judicial interpretation of these laws and regulations. In the future, different interpretations or enforcement of these laws and regulations could subject our current or past practices to allegations of impropriety or illegality, or could require us to make changes in our facilities, equipment, personnel, services, capital expenditure programs and operating expenses. A determination that we have violated these laws, or the public announcement that we are being investigated for possible violations of these laws, could have a material adverse effect on our business, financial condition, results of operations or prospects and our business reputation could suffer significantly. If we fail to comply with the anti-kickback statute or other applicable laws and regulations, we could be subjected to liabilities, including criminal penalties, civil penalties (including the loss of our licenses to operate one or more facilities), and exclusion of one or more facilities from participation in the Medicare, Medicaid and other federal and state health care programs. In addition, we are unable to predict whether other legislation or regulations at the federal or state level will be adopted, what form such legislation or regulations may take or their impact.
Continuing government and private efforts to contain healthcare costs may reduce our future revenue.
We could be adversely affected by the continuing efforts of government and private payers to contain healthcare costs. To reduce healthcare costs, payers seek to lower reimbursement rates, limit the scope of covered services and negotiate reduced or capped pricing arrangements. While many of the proposed policy changes would require congressional approval to implement, we cannot assure you that reimbursement payments under governmental and private third party payer programs will remain at levels comparable to present levels or will be sufficient to cover the costs allocable to patients eligible for reimbursement under these programs. Any changes that lower reimbursement rates under Medicare, Medicaid or private pay programs could result in a substantial reduction in our net operating revenues. Our operating margins may continue to be under pressure because of deterioration in reimbursement, changes in payer mix and growth in operating expenses in excess of increases, if any, in payments by third party payers. For instance, the short cycle dispensing requirements set forth in the Patient Protection and Affordable Care Act, which would become effective January 2012, could impact our revenues and our profitability if the costs associated therewith are not fully reimbursed by the appropriate payers.
Healthcare reform could adversely affect the liquidity of our customers which would have an adverse effect on their ability to make timely payments to us for our products and services.
Healthcare reform and legislation may have an adverse effect on our business through decreasing funds available to our customers. Limitations or restrictions on Medicare and Medicaid payments to our customers could adversely impact the liquidity of our customers, resulting in their inability to pay us, or to timely pay us, for our products and services. This inability could have a material adverse effect on our financial condition, results of operations, and liquidity.
The changing U.S. healthcare industry and increasing enforcement environment may negatively impact our business.
Our products and services are part of the structure of the healthcare financing and reimbursement system currently existing in the United States. In recent years, the healthcare industry has undergone significant changes in an effort to reduce costs and government spending. These changes include an increased reliance on managed care, cuts in Medicare funding affecting our healthcare provider customer base and consolidation of competitors, suppliers and customers.
We expect the healthcare industry to continue to change significantly in the future. Some of these potential changes, such as a reduction in governmental support of healthcare services or adverse changes in legislation or regulations governing prescription drug pricing, healthcare services or mandated benefits, may cause healthcare providers to reduce the amount of our products and services they purchase or the price they are willing to pay for our products and services. If we are unable to adjust to changes in the healthcare environment, it could have a material adverse effect on our financial position, results of operations and liquidity.
24
Table of Contents
Index to Financial Statements
Further, both federal and state government agencies have increased their focus on and coordination of civil and criminal enforcement efforts in the healthcare area. The OIG and the U.S. Department of Justice have, from time to time, established national enforcement initiatives, targeting all providers of a particular type, that focus on specific billing practices or other suspected areas of abuse. In addition, under the federal False Claims Act, private parties have the right to bring “qui tam” whistleblower lawsuits against companies that submit false claims for payments to the government. A number of states have adopted similar state whistleblower and false claims provisions. We do not believe that we have taken any actions that could subject us to material penalties under these provisions.
Further consolidation of managed care organizations and other third-party payers may adversely affect our profits.
Managed care organizations and other third-party payers have continued to consolidate in order to enhance their ability to influence the delivery of healthcare services. Consequently, the healthcare needs of a large percentage of the U.S. population are increasingly served by a small number of managed care organizations. These organizations generally enter into service agreements with a limited number of providers for needed services. In addition, private payers, including managed care payers, increasingly are demanding discounted fee structures. To the extent that these organizations terminate us as a preferred provider, engage our competitors as a preferred or exclusive provider or demand discounted fee structures, our liquidity and results of operations could be materially and adversely affected.
Possible changes in, or our failure to satisfy our manufacturers’ rebate programs could adversely affect our results of operations.
We currently earn rebates from certain manufacturers of pharmaceutical products for meeting tiered market share and purchase volumes. There can be no assurance that pharmaceutical manufacturers will continue to offer these rebates or that they will not change the terms upon which rebates are offered. A decrease in prescription volumes dispensed or a decrease in the number of brand drugs used by the geriatric population could affect our ability to satisfy our manufacturers’ rebate programs. The termination of such programs or our failure to satisfy the criterion for earning rebates may have an adverse affect on our cost of goods sold, financial condition, results of operations and liquidity.
If we or our customers fail to comply with licensure requirements, laws and regulations in respect of healthcare fraud or other applicable laws and regulations, we could suffer penalties or be required to make significant changes to our operations.
Our pharmacies must be licensed by the state board of pharmacy in the state in which they operate. Many states also regulate out-of-state pharmacies that are delivering prescription products to patients or residents in their states. The failure to obtain or renew any required regulatory approvals or licenses could adversely impact the operation of our business. In addition, the healthcare facilities we service are also subject to extensive federal, state and local regulations and are required to be licensed in the states in which they are located. The failure by these healthcare facilities to comply with these or future regulations or to obtain or renew any required licenses could result in our inability to provide pharmacy services to these facilities and their residents and could have a material adverse effect on our financial position, results of operations and liquidity.
25
Table of Contents
Index to Financial Statements
While we believe that we are in substantial compliance with all applicable laws, many of the regulations applicable to us, including those relating to marketing incentives offered by pharmaceutical suppliers, and rebates paid by pharmaceutical manufacturers are vague or indefinite and have not been interpreted by the courts. They may be interpreted or applied by a prosecutorial, regulatory or judicial authority in a manner that could require us to make changes in our operations. These changes may be material and may require the expenditure of material funds to implement. We believe that the regulatory environment surrounding most segments of the healthcare industry remains intense. Federal and state governments continue to impose intensive enforcement policies resulting in a significant number of inspections, citations of regulatory deficiencies and other regulatory sanctions including demands for refund of overpayments, terminations from the Medicare and Medicaid programs, bans on Medicare and Medicaid payments and fines. If we or our customers fail to comply with the extensive applicable laws and regulations, we could become ineligible to receive government program reimbursement, suffer civil or criminal penalties or be required to make significant changes to our operations. In addition, we could be forced to expend considerable resources responding to an investigation or other enforcement action under these laws or regulations regardless of whether we have actually been involved in any violations or wrong-doing.
Federal and state medical privacy regulations may increase the costs of operations and expose us to civil and criminal sanctions.
We must comply with extensive federal and state requirements regarding the transmission and retention of health information. The Health Insurance Portability and Accountability Act of 1996 and its implementing regulations, referred to as HIPAA, was enacted to ensure that employees can retain and at times transfer their health insurance when they change jobs, to enhance the privacy and security of personal health information and to simplify healthcare administrative processes. HIPAA requires the adoption of standards for the exchange of electronic health information. Failure to comply with HIPAA could result in fines and penalties that could have a material adverse effect on our results of operations, financial condition, and liquidity.
Acquisitions, investments and strategic alliances that we have made or may make in the future may use significant resources, may be unsuccessful and could expose us to unforeseen liabilities.
We have made and anticipate that we may continue to make acquisitions of, investments in and strategic alliances with complementary businesses to enable us to capitalize on our position in the geographic markets in which we operate and to expand our businesses in new geographic markets. At any particular time, we may be in various stages of assessment, discussion and negotiation with regard to one or more potential acquisitions, investments or strategic alliances, not all of which, if any, will be consummated. Our acquisition program and strategy has and may lead us to contemplate acquisitions of companies in bankruptcy, which entail additional risks and uncertainties. Such risks and uncertainties include, without limitation, that, before assets may be acquired, customers may leave in search of more stable providers and vendors may terminate key relationships. Also, assets are generally acquired on an “as is” basis, with no recourse to the seller if the assets are not as valuable as may be represented. Finally, while bankrupt companies may be acquired for comparatively little money, the cost of continuing the operations may significantly exceed expectations. Our growth plans rely, in part, on the successful completion of future acquisitions. If we are unsuccessful, our business would suffer.
We intend to make public disclosure of pending and completed acquisitions when appropriate or required by applicable securities laws and regulations. Acquisitions may involve significant cash expenditures, debt incurrence, additional operating losses, amortization of certain intangible assets of acquired companies, and expenses that could have a material adverse effect on our financial position, results of operations and liquidity. Acquisitions involve numerous risks and uncertainties, including, without limitation:
| • | difficulties integrating acquired operations, personnel and information systems, or in realizing projected efficiencies and cost savings; |
| • | diversion of management’s time from existing operations; |
26
Table of Contents
Index to Financial Statements
| • | potential loss of key employees or customers of acquired companies; |
| • | inaccurate assessment of assets and liabilities and exposure to undisclosed or unforeseen liabilities of acquired companies, including liabilities for failure to comply with healthcare laws; |
| • | increases in our indebtedness and a limitation on our ability to access additional capital when needed; and |
| • | failure to operate acquired facilities profitably or to achieve improvements in their financial performance. |
Risks generally associated with our sophisticated information systems may adversely affect our results of operations.
We rely on sophisticated information systems in our business to obtain, rapidly process, analyze, and manage data to facilitate the dispensing of prescription and non-prescription pharmaceuticals in accordance with physician orders and deliver those medications to patients and long-term care residents on a timely basis; to manage the accurate billing and collections for thousands of customers; and to process payments to suppliers. Our business and results of operations may be materially adversely affected if these systems are interrupted or damaged or if they fail for an extended period of time.
We purchase a significant portion of our pharmaceutical products from one supplier—AmerisourceBergen.
We are required to purchase a substantial amount of our pharmaceutical products from AmerisourceBergen, pursuant to the Prime Vendor Agreement. If AmerisourceBergen fails to deliver products in accordance with the Prime Vendor Agreement, there can be no assurance that our operations would not be disrupted or that we could obtain the products at similar cost or at all. In this event, failure to satisfy our customers’ requirements would result in defaults under these customer contracts subjecting us to damages and the potential termination of those contracts. Such events could have a material adverse effect on our financial position, results of operations and liquidity. In addition, under the terms of the Prime Vendor Agreement, we are unable to negotiate potentially better pricing and other terms with other drug distributors which could negatively impact our competitive position.
Prescription volumes may decline, and our net revenues and profitability may be negatively impacted, if products are withdrawn from the market or if increased safety risk profiles of specific drugs result in utilization decreases.
We dispense significant volumes of drugs from our pharmacies. These volumes are the basis for our net revenues and profitability. When increased safety risk profiles of specific drugs or classes of drugs result in utilization decreases, physicians may cease writing or reduce the numbers of prescriptions written for these drugs. Additionally, negative press regarding drugs with higher safety risk profiles may result in reduced consumer demand for such drugs. On occasion, products are withdrawn by their manufacturers. In cases where there are no acceptable prescription drug equivalents or alternatives for these prescription drugs, our volumes, net revenues, profitability and cash flows may decline.
27
Table of Contents
Index to Financial Statements
We could be required to record a material non-cash charge to income if our recorded intangible assets are impaired, or if we shorten intangible asset useful lives.
We have $102.2 million of recorded intangible assets, net, on our consolidated balance sheet as of December 31, 2010. Our intangible assets primarily represent the value of client relationships that were recorded from past acquisitions. Under current accounting rules, intangible assets are amortized over their useful lives. These assets may become impaired with the loss of significant clients. If the carrying amount of the assets exceeds the undiscounted pre-tax expected future cash flows from the lowest appropriate asset grouping, we would be required to record a non-cash impairment charge to our consolidated income statements in the amount the carrying value of these assets exceeds its fair value. In addition, while the intangible assets may not be impaired, the useful lives are subject to continual assessment, taking into account historical and expected losses of relationships that were in the base at time of acquisition. This assessment may result in a reduction of the remaining weighted average useful life of these assets, resulting in potentially significant increases to non-cash amortization expense that is charged to our consolidated income statements. An intangible asset impairment charge, or a reduction of useful lives, could have a material effect on our results of operations. For the year ended December 31, 2008, we incurred a pre-tax impairment charge of $14.8 million or $0.30 earnings per diluted share as a result of a review of our lost customer base of pre-Pharmacy Transaction assets.
We primarily obtain our information services from one provider. Failure to provide information services in a timely manner could cause delays in the delivery of our services, which could damage our reputation, cause us to lose customers and negatively impact our growth.
We obtain substantially all of our information services from Kindred, one of our former parent companies, pursuant to the IT Services Agreement. Kindred is not in the business of providing comprehensive information technology outsourcing services to third parties and does not have any significant prior experience providing comprehensive outsourcing information technology services for any third party. If Kindred or other third parties upon whom we are dependent fail to devote sufficient time and resources to us or if their performance is substandard, our business may be harmed. Any delays, malfunctions, inefficiencies or interruptions in these products or services could adversely affect the reliability or operation of our business, which could cause us to experience difficulty retaining current customers and attracting new customers. This could result in our failure to satisfy our customers’ requirements or comply with certain of our financial or regulatory reporting requirements, which could have a material adverse effect on our financial position, results of operations and liquidity.
We are highly dependent on our senior management team and our pharmacy professionals.
We are highly dependent upon the members of our senior management and our pharmacists and other pharmacy professionals. Our business is managed by a small number of senior management personnel. If we were unable to retain these persons, we might be materially adversely affected due to the limited pool of senior management personnel with significant experience in our industry. Accordingly, we believe we could experience significant difficulty in replacing key management personnel. We expect that any employment contracts we enter into with our key management personnel will be subject to termination without cause by either party. Moreover, although the majority of the members of our senior management team have significant experience in the industry, they will need time to fully assess and understand our business and operations. We can offer no assurance how long these members of senior management will choose to remain with us.
In addition, our continued success depends on our ability to attract and retain pharmacists and other pharmacy professionals. Competition for qualified pharmacists and other pharmacy professionals is intense. The loss of pharmacy personnel or the inability to attract or retain sufficient numbers of qualified pharmacy professionals could adversely affect our business. Although we generally have been able to meet our staffing requirements for pharmacists and other pharmacy professionals, our inability to do so in the future could have a material adverse effect on our financial position, results of operations and liquidity.
28
Table of Contents
Index to Financial Statements
Risk Factors Relating to Ownership of Our Common Stock and Our Senior Secured Credit Facility
The market price and trading volume of our common stock may be volatile.
The market price of our common stock could fluctuate significantly for many reasons, including, without limitation the following:
| • | as a result of the risk factors listed in this document; |
| • | actual or anticipated fluctuations in our results of operations; |
| • | for reasons unrelated to our specific performance, such as reports by industry analysts, investor perceptions, or negative announcements by our customers or competitors regarding their own performance; |
| • | regulatory changes that could impact our business or that of our customers; and |
| • | general economic and industry conditions. |
In addition, when the market price of a company’s common stock drops significantly, stockholders often institute securities class action lawsuits against the company. A lawsuit against us could cause us to incur substantial costs and could divert the time and attention of our management and other resources.
Certain provisions of our certificate of incorporation and bylaws and provisions of Delaware law could delay or prevent a change of control that stockholders favor.
Provisions of our certificate of incorporation and bylaws may discourage, delay or prevent a merger or other change of control that stockholders may consider favorable or may impede the ability of the holders of our common stock to change our management. The provisions of our certificate of incorporation and bylaws, among other things:
| • | prohibit stockholder action except at an annual or special meeting. Specifically, this means our stockholders will be unable to act by written consent; |
| • | regulate how stockholders may present proposals or nominate directors for election at annual meetings of stockholders. Advance notice of such proposals or nominations will be required; |
| • | regulate how special meetings of stockholders may be called. Our stockholders will not have the right to call special meetings; |
| • | authorize our board of directors to issue preferred stock in one or more series, without stockholder approval. Under this authority, our board of directors could adopt a rights plan which could ensure continuity of management by rendering it more difficult for a potential acquirer to obtain control of us; and |
| • | require an affirmative vote of the holders of three-quarters or more of the combined voting power of our common stock entitled to vote in the election of our directors in order for the stockholders to amend our bylaws. |
In addition, because we have not chosen to be exempt from Section 203 of the Delaware General Corporation Law (“DGCL”), this provision could also delay or prevent a change of control that may be favorable. Section 203 provides that unless board and/or shareholder approval is obtained pursuant to the requirements of the statute, persons that acquire, or are affiliated with a person that acquires, more than 15% of the outstanding voting stock of a Delaware corporation shall not engage in any business combination with that corporation, including by merger, consolidation or acquisitions of additional shares, for a three-year period following the date on which that person or its affiliate becomes the holder of more than 15% of the corporation’s outstanding voting stock.
29
Table of Contents
Index to Financial Statements
Acquisitions, investments and strategic alliances we may make in the future may need to be financed by borrowings from the senior secured credit facility for which funds may not be made available by certain participants.
We have made and anticipate that we may continue to make acquisitions of, investments in and strategic alliances with complementary businesses to enable us to capitalize on our position in the geographic markets in which we operate and to expand our business in new geographic markets. Our growth plans rely, in part, on the successful completion of future acquisitions. At any particular time, we may need to finance such acquisitions and strategic alliances with borrowings from our senior secured credit facility. The financial markets are very volatile and certain participants in our senior secured credit facility may not be able to participate in funding their commitments under the revolving line of credit. If we are unsuccessful in obtaining the financing, our business would be impacted.
We are exposed to interest rate changes.
We are exposed to market risk related to changes in interest rates. As of December 31, 2010, we had outstanding debt of $245.6 million, all of which was subject to variable rates of interest. See Item 7, “Management’s Discussion and Analysis of Financial Condition and Results of Operations—Market Risk.”
We have indebtedness, which restricts our ability to pay dividends and has a negative impact on our financing options and liquidity.
We have $245.6 million in indebtednesses outstanding as of December 31, 2010 under our senior secured credit facility and revolver.
The credit agreement contains customary restrictions, requirements and other limitations on our ability to incur indebtedness. The senior secured credit facility also contains financial covenants that require us to satisfy certain financial tests and maintain certain financial ratios, including a maximum of debt to EBITDA ratio. The senior secured credit facility limits our ability to declare and pay dividends or other distributions on our shares of common stock. If our lenders permit us to declare dividends, the dividend amounts, if any, will be determined by our board of directors, which will consider a number of factors, including our financial condition, capital requirements, funds generated from operations, future business prospects, applicable contractual restrictions and any other factors our board of directors may deem relevant. The amount of this outstanding indebtedness could limit our ability to pay dividends and to obtain additional financing in the future for working capital, capital expenditure and acquisition purposes. A significant portion of our cash flows will be dedicated to debt service and will be unavailable for investment, capital expenditures or other operating expenses.
As a result of these and other factors, we cannot assure you that our business will generate sufficient cash flows from operations or that future borrowings will be available to us in amounts sufficient to enable us to pay our indebtedness or to fund our other liquidity needs. If we do not generate or are unable to borrow sufficient amounts of cash on satisfactory terms to meet these needs, we may need to seek to refinance all or a portion of our indebtedness on or before maturity, sell assets, curtail discretionary capital expenditures or seek additional capital. There can be no assurance that additional capital will be available to us on acceptable terms, or at all, which could adversely impact our business, results of operations, liquidity, capital resources, and financial position.
The ability to successfully renegotiate the Credit Agreement could adversely affect the Corporation’s liquidity.
The Corporation’s Credit Agreement is scheduled to expire on July 31, 2012. The Corporation is discussing a new facility with potential lenders, but there can be no assurance that it will be able to enter into a new agreement or that a new agreement will have terms similar to the existing agreement.
30
Table of Contents
Index to Financial Statements
Our ability to pay dividends is limited by our financial results and we do not anticipate paying any distributions in the foreseeable future.
We anticipate that future earnings will be used principally to support operations and finance the growth of our business. Thus, we do not intend to pay dividends or other cash distributions on our common stock in the foreseeable future. See “Dividend Policy”.
We entered into a senior secured credit facility providing for both term and revolving credit borrowings. Our ability to make payments on our existing and future debt and to fund working capital needs and planned capital expenditures will depend on our ability to generate cash in the future, which is largely subject to general economic, financial, competitive, regulatory, legislative and other factors that are beyond our control. Cost containment and lower reimbursement levels relative to increases in cost by third party payers, including federal and state governments, could have a significant negative impact on our business and on our cash flows. Our operating margins continue to be under pressure because of continuing reimbursement and regulatory changes and growth in our operating expenses, such as product and labor costs.
See “Management’s Discussion and Analysis of Financial Condition and Results of Operations—Liquidity and Capital Resources.”
Item 1B. Unresolved Staff Comments
None.
31
Table of Contents
Index to Financial Statements
We have facilities including offices and key operating facilities (e.g. institutional pharmacies) in various locations throughout the United States. The Corporation’s corporate headquarters are located in Louisville, Kentucky. In addition to the institutional pharmacies listed below, the Corporation also has four facilities throughout the nation with several overhead and administrative functions. As of December 31, 2010, all facilities were leased. We consider all of these facilities to be suitable, adequate, and are utilized at full capacity by the institutional pharmacy business segment.
The following table presents certain information with respect to operating leases of our institutional pharmacies identified by the Corporation as properties as of December 31, 2010:
| Property |
# of Facilities |
Square |
Property |
# of Facilities |
Square Footage |
|||||||||||||
| Alabama |
2 | 7,200 | Mississippi | 1 | 11,600 | |||||||||||||
| Arizona |
2 | 21,436 | Missouri | 1 | 4,090 | |||||||||||||
| Arkansas |
1 | 6,850 | Montana | 1 | 2,440 | |||||||||||||
| California |
10 | 100,451 | Nebraska | 1 | 5,120 | |||||||||||||
| Colorado |
2 | 14,067 | Nevada | 1 | 7,000 | |||||||||||||
| Connecticut |
1 | 15,600 | New Hamphire | 1 | 7,500 | |||||||||||||
| Delaware |
1 | 5,616 | New Jersey | 1 | 14,309 | |||||||||||||
| Florida |
7 | 77,254 | New Mexico | 1 | 4,798 | |||||||||||||
| Georgia |
2 | 32,800 | New York | 2 | 56,738 | |||||||||||||
| Hawaii |
5 | 15,506 | North Carolina | 4 | 26,950 | |||||||||||||
| Idaho |
1 | 5,750 | Ohio | 3 | 22,051 | |||||||||||||
| Illinois |
1 | 15,256 | Pennsylvania | 9 | 59,388 | |||||||||||||
| Indiana |
1 | 20,386 | Rhode Island | 1 | 7,800 | |||||||||||||
| Iowa |
1 | 6,250 | South Dakota | 2 | 12,050 | |||||||||||||
| Kansas |
1 | 9,977 | Tennessee | 3 | 28,862 | |||||||||||||
| Kentucky |
2 | 43,500 | Texas | 10 | 73,654 | |||||||||||||
| Louisiana |
1 | 4,914 | Utah | 1 | 8,002 | |||||||||||||
| Maine |
1 | 10,200 | Virginia | 3 | 23,647 | |||||||||||||
| Maryland |
1 | 10,744 | Washington | 2 | 14,792 | |||||||||||||
| Massachusetts |
1 | 53,111 | West Virginia | 1 | 1,419 | |||||||||||||
| Michigan |
2 | 13,185 | Wisconsin | 1 | 10,700 | |||||||||||||
| Minnesota |
1 | 13,871 | ||||||||||||||||
From time to time, we are involved in legal and regulatory proceedings. While it is not possible to determine the ultimate disposition of the various ongoing proceedings and whether they will be resolved in our favor, we do not believe that the outcome of these proceedings, individually or in the aggregate, will have a material adverse effect on our financial condition, results of operations or liquidity.
Item 4. (Removed and Reserved)
32
Table of Contents
Index to Financial Statements
PART II
| Item 5. | Market for Registrant’s Common Equity, Related Stockholder Matters and Issuer Purchases of Equity Securities |
Market Information
Our only class of common equity is our $0.01 par value common stock, which trades on the NYSE under the symbol “PMC.” Trading in our common stock commenced on the NYSE on August 1, 2007. Prior to that time, there was no public trading market for our common stock.
The following table sets forth the high and low closing prices per share during the period and the closing price of our common stock as reported by the NYSE for the fiscal periods indicated.
| High | Low | Close | ||||||||||
| Fiscal 2009 |
||||||||||||
| First Quarter |
$ | 19.38 | $ | 14.51 | $ | 16.64 | ||||||
| Second Quarter |
$ | 19.86 | $ | 15.99 | $ | 19.63 | ||||||
| Third Quarter |
$ | 21.47 | $ | 18.57 | $ | 18.57 | ||||||
| Fourth Quarter |
$ | 18.49 | $ | 14.59 | $ | 15.88 | ||||||
| Fiscal 2010 |
||||||||||||
| First Quarter |
$ | 18.94 | $ | 16.23 | $ | 18.22 | ||||||
| Second Quarter |
$ | 20.71 | $ | 14.49 | $ | 14.66 | ||||||
| Third Quarter |
$ | 14.36 | $ | 6.93 | $ | 9.53 | ||||||
| Fourth Quarter |
$ | 11.83 | $ | 9.40 | $ | 11.45 | ||||||
Stockholders
As of February 18, 2011, we had approximately 2,739 stockholders of record of the Corporation’s common stock. Because many of our shares of common stock are held by brokers and other institutions on behalf of stockholders, we are unable to estimate the total number of stockholders represented by these record holders.
Dividends
The Corporation has never paid a cash dividend on its common stock and does not expect to pay cash dividends on its common stock in the foreseeable future. Our Senior Secured Credit Facility also limits our ability to declare and pay dividends or other distributions on our shares of common stock. Management believes the stockholders are better served if all of the Corporation’s earnings are retained for expansion of the business.
Securities authorized for issuance under equity compensation plans
The Corporation has adopted the Amended and Restated PharMerica Corporation 2007 Omnibus Incentive Plan (as amended and restated, “Omnibus Plan”) under which the Corporation is authorized to grant equity-based and other awards to its employees, officers, directors and consultants. In connection with the Corporation’s 2010 Annual Meeting of Stockholders, the stockholders of the Corporation approved and adopted the amended and restated Omnibus Plan to, among other things, implement a “fungible share pool” effective as of January 1, 2010, and preserve preferential tax treatment as “qualified performance-based compensation” under Section 162(m) of the Internal Revenue Code.
33
Table of Contents
Index to Financial Statements
The Corporation has reserved 7,237,000 shares of its common stock for awards to be granted under the Omnibus Plan plus 534,642 shares issued for substitute equity awards for employees of KPS and PharMerica LTC. Under the “fungible share pool,” one share of stock will be subtracted from the share limit for each share of stock covered by a stock option or stock appreciation right award and 1.65 shares of stock will be subtracted from the share limit for each share of stock covered by any full-value award, including restricted stock awards, restricted stock units and performance share awards at target. The following shares are not available for re-grant under the Omnibus Plan: (i) shares tendered by a participant or withheld by the Corporation to pay the purchase price of a stock option award or to satisfy taxes owed with respect to an award, (ii) shares subject to a stock appreciation right that are not issued in connection with such award’s settlement upon the exercise thereof, and (iii) shares reacquired by the Corporation using cash proceeds received by the Corporation from the exercise of stock options. Effective January 1, 2010, shares subject to an award that is forfeited, expired or settled for cash, are available for re-grant under the Omnibus Plan as one share of stock for each share of stock covered by a stock option or appreciation right and 1.65 shares of stock for each share of stock covered by any other type of award.
The following table sets forth equity compensation plan information:
| Plan Category |
Number of securities to be issued upon exercise of outstanding options and rights |
Weighted-average exercise price of outstanding options and rights |
Number of securities remaining available for future issuance under equity compensation plans (excluding securities reflected in column (a)) |
|||||||||
| (a) | (b) | (c) | ||||||||||
| Equity compensation plans approved by stockholders |
2,713,598 (1) | $ 16.28 (2) | 4,214,058 (3) | |||||||||
See Note 9 to the Consolidated Financial Statements for information regarding the material features of the Omnibus Plan.
(1) Includes the following:
| • | 2,223,743 shares of common stock to be issued upon exercise of outstanding stock options granted under the Omnibus Plan; |
| • | 312,233 shares of common stock to be issued upon vesting of performance share units under the Omnibus Plan; |
| • | 88,810 shares of common stock to be issued upon vesting of restricted stock awards under the Omnibus Plan; and |
| • | 88,812 shares of common stock to be issued upon vesting of restricted stock units under the Omnibus Plan. |
(2) The weighted average exercise price in column (b) does not take into account the 489,855 shares of common stock potentially to be issued under performance share units and restricted stock units.
(3) The 4,214,058 shares does not take into consideration the dilution of 1.65 shares of stock for any full-value award, including restricted stock awards, restricted stock units and performance share awards at target. The number of shares remaining available for future issuance calculated under the fungible share pool would be 4,118,502.
34
Table of Contents
Index to Financial Statements
Stock Performance Graph
The following graph compares the cumulative total return on a $100 investment in each of the Common Stock of the Corporation, the Standard & Poor’s 500 Stock Index and the Standard & Poor’s Healthcare Index for the period from August 1, 2007 to December 31, 2010. This graph assumes an investment in the Corporation’s common stock and the indices of $100 on August 1, 2007 and that all dividends were reinvested:
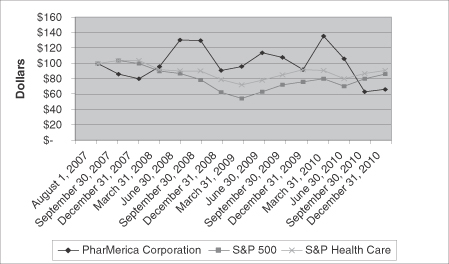
| PharMerica Corporation |
S&P 500 | S&P Healthcare |
||||||||||
| August 1, 2007 |
$ | 100 | $ | 100 | $ | 100 | ||||||
| September 30, 2007 |
86 | 104 | 104 | |||||||||
| December 31, 2007 |
80 | 100 | 104 | |||||||||
| March 31, 2008 |
96 | 90 | 92 | |||||||||
| June 30, 2008 |
131 | 87 | 90 | |||||||||
| September 30, 2008 |
130 | 79 | 90 | |||||||||
| December 31, 2008 |
91 | 62 | 79 | |||||||||
| March 31, 2009 |
96 | 54 | 72 | |||||||||
| June 30, 2009 |
114 | 63 | 78 | |||||||||
| September 30, 2009 |
108 | 72 | 85 | |||||||||
| December 31, 2009 |
92 | 76 | 92 | |||||||||
| March 31, 2010 |
136 | 80 | 91 | |||||||||
| June 30, 2010 |
106 | 70 | 80 | |||||||||
| September 30, 2010 |
63 | 80 | 87 | |||||||||
| December 31, 2010 |
66 | 86 | 91 | |||||||||
Recent Sales of Unregistered Securities
None.
35
Table of Contents
Index to Financial Statements
Purchases of Equity Securities by the Issuer and Affiliated Purchasers
In August 2010, the Board of Directors authorized a share repurchase of up to $25.0 million of the Corporation’s common stock.
During 2010, the Corporation purchased a total of 1,336,817 shares of its common stock.
Share repurchases under this authorization may be made in the open market through unsolicited or solicited privately negotiated transactions, or in such other appropriate manner, and will be funded from available cash. The amount and timing of the repurchases will be determined by the Corporation’s management and will depend on a variety of factors including price, corporate and regulatory requirements, capital availability and other market conditions. Common stock acquired through the share repurchase program will be held as treasury shares and may be used for general corporate purposes, including reissuances in connection with acquisitions, employee stock option exercises or other employee stock plans. During the year ended December 31, 2010, the Corporation repurchased 1,327,803 shares for an aggregate purchase price, including commissions, of $10.5 million at an average purchase price of $7.90 per share.
Additionally, the Corporation may redeem shares from employees upon vesting of the Corporation’s stock awards for minimum statutory tax withholding purposes. The Corporation redeemed 9,014 shares of certain vested awards for an aggregate price of less than $0.1 million, during the year ended December 31, 2010. These shares have been designated by the Corporation as treasury stock.
The following table summarizes our share repurchase activity by month for the three months ended December 31, 2010:
| Period |
Total Number of Shares Purchased |
Weighted Average Price Paid per Share |
Total Number of Shares Purchased as Part of a Publicly Announced Program (2) |
Approximate Dollar Value of Shares that may yet be Purchased under the Program |
||||||||||||
| (in millions) | ||||||||||||||||
| October 1, 2010—October 31, 2010 |
— | $ | — | — | $ | 14.5 | ||||||||||
| November 1, 2010—November 30, 2010 |
5,188 | (1) | 11.07 | — | 14.5 | |||||||||||
| December 1, 2010—December 31, 2010 |
— | — | — | 14.5 | ||||||||||||
| (1) | The Corporation repurchased 5,188 shares of common stock in connection with the vesting of certain stock awards to cover minimum statutory withholding taxes. |
| (2) | On August 24, 2010, the Corporation announced a share repurchase program where the Corporation is authorized to repurchase up to $25.0 million of the Corporation’s common stock. The share repurchase program does not have an expiration date and may be limited, terminated or extended at any time without prior notice. The Corporation did not repurchase shares under this program during the three months ended December 31, 2010. |
36
Table of Contents
Index to Financial Statements
Item 6. Selected Financial Data
The following table presents our selected historical consolidated financial and operating data. The selected historical financial and operating data should be read in conjunction with, and is qualified in its entirety by reference to, Item 7, “Management’s Discussion and Analysis of Financial Condition and Results of Operations” and our consolidated financial statements and notes thereto included elsewhere in this Annual Report on Form 10-K (in millions, except where indicated):
| Years Ended December 31, | ||||||||||||||||||||
| 2006 (1) | 2007 (1) | 2008 | 2009 | 2010 | ||||||||||||||||
| Statement of operations data: |
||||||||||||||||||||
| Revenues |
$ | 652.6 | $ | 1,217.8 | $ | 1,947.3 | $ | 1,841.2 | $ | 1,847.3 | ||||||||||
| Cost of goods sold |
557.9 | 1,044.0 | 1,660.0 | 1,565.7 | 1,607.0 | |||||||||||||||
| Gross profit |
94.7 | 173.8 | 287.3 | 275.5 | 240.3 | |||||||||||||||
| Selling, general and administrative |
67.3 | 169.3 | 216.8 | 190.8 | 180.6 | |||||||||||||||
| Amortization expense |
3.4 | 5.0 | 6.5 | 9.0 | 9.3 | |||||||||||||||
| Impairment of intangible assets |
— | — | 14.8 | — | — | |||||||||||||||
| Integration, merger and acquisition related costs and other charges |
2.9 | 29.8 | 26.7 | 5.2 | 14.6 | |||||||||||||||
| Operating income (loss) (2) |
$ | 21.1 | $ | (30.3 | ) | $ | 22.5 | $ | 70.5 | $ | 35.8 | |||||||||
| Net income (loss) |
$ | 12.8 | $ | (24.1 | ) | $ | 5.0 | $ | 42.2 | $ | 19.2 | |||||||||
| Earnings (loss) per common share: (3) |
||||||||||||||||||||
| Basic |
NM | $ | (1.13 | ) | $ | 0.17 | $ | 1.39 | $ | 0.64 | ||||||||||
| Diluted |
NM | $ | (1.13 | ) | $ | 0.17 | $ | 1.39 | $ | 0.64 | ||||||||||
| Adjusted earnings per diluted share (4) |
NM | $ | 0.52 | $ | 1.00 | $ | 1.30 | $ | 0.93 | |||||||||||
| Shares used in computing earnings (loss) per common share: |
||||||||||||||||||||
| Basic |
NM | 21.3 | 30.1 | 30.3 | 30.0 | |||||||||||||||
| Diluted |
NM | 21.3 | 30.2 | 30.4 | 30.1 | |||||||||||||||
| Balance sheet data: |
||||||||||||||||||||
| Cash and cash equivalents |
$ | 3.7 | $ | 32.0 | $ | 41.3 | $ | 51.2 | $ | 10.8 | ||||||||||
| Working capital |
$ | 79.2 | $ | 268.6 | $ | 272.3 | $ | 312.8 | $ | 270.2 | ||||||||||
| Goodwill |
$ | 45.2 | $ | 111.3 | $ | 113.7 | $ | 140.1 | $ | 193.9 | ||||||||||
| Intangible assets, net |
$ | 38.0 | $ | 77.5 | $ | 73.4 | $ | 90.8 | $ | 102.2 | ||||||||||
| Total assets |
$ | 236.8 | $ | 680.1 | $ | 679.2 | $ | 724.3 | $ | 759.9 | ||||||||||
| Long-term debt |
$ | — | $ | 250.0 | $ | 240.0 | $ | 240.0 | $ | 245.6 | ||||||||||
| Total stockholders’ equity |
$ | 198.3 | $ | 309.2 | $ | 319.8 | $ | 370.9 | $ | 384.4 | ||||||||||
| Supplemental information: |
||||||||||||||||||||
| Adjusted EBITDA (4) |
$ | 32.8 | $ | 44.5 | $ | 92.5 | $ | 102.7 | $ | 78.5 | ||||||||||
| Adjusted EBITDA Margin (4) |
5.0 | % | 3.7 | % | 4.8 | % | 5.6 | % | 4.2 | % | ||||||||||
| Adjusted EBITDA per prescription dispensed (4) |
$ | 2.59 | $ | 1.80 | $ | 2.29 | $ | 2.63 | $ | 2.08 | ||||||||||
| Net cash provided by operating activities |
$ | 10.0 | $ | 36.3 | $ | 65.7 | $ | 85.0 | $ | 98.2 | ||||||||||
| Net cash used by investing activities |
$ | (25.0 | ) | $ | (22.0 | ) | $ | (47.4 | ) | $ | (76.1 | ) | $ | (133.2 | ) | |||||
| Net cash provided by (used in) financing activities |
$ | 17.3 | $ | 14.0 | $ | (9.0 | ) | $ | 1.0 | $ | (5.4 | ) | ||||||||
| Statistical information (in whole numbers except where indicated) |
||||||||||||||||||||
| Institutional Pharmacy |
||||||||||||||||||||
| Volume information: |
||||||||||||||||||||
| Prescriptions dispensed (in thousands) |
12,644 | 24,751 | 40,319 | 39,037 | 37,826 | |||||||||||||||
| Revenue per prescription dispensed |
$ | 47.63 | $ | 46.99 | $ | 46.85 | $ | 45.72 | $ | 47.31 | ||||||||||
| Gross profit per prescription dispensed |
$ | 6.65 | $ | 6.57 | $ | 6.85 | $ | 6.84 | $ | 6.15 | ||||||||||
| Institutional pharmacy gross margin |
14.0 | % | 14.0 | % | 14.6 | % | 15.0 | % | 13.0 | % | ||||||||||
| Generic drug dispensing rate |
NA | 67.4 | % | 70.7 | % | 74.2 | % | 75.5 | % | |||||||||||
| Customer licensed beds under contract: |
||||||||||||||||||||
| Beginning of period |
93,282 | 102,347 | 336,759 | 321,068 | 313,873 | |||||||||||||||
| Additions |
19,567 | 260,085 | 21,398 | 35,921 | 95,949 | |||||||||||||||
| Losses and other |
(10,502 | ) | (25,673 | ) | (37,089 | ) | (43,116 | ) | (45,978 | ) | ||||||||||
| End of period |
102,347 | 336,759 | 321,068 | 313,873 | 363,844 | |||||||||||||||
| Hospital management contracts serviced |
81 | 86 | 84 | 86 | 90 | |||||||||||||||
| (1) | The historical periods of the Corporation exclude the results of PharMerica LTC for the year ended December 31, 2006. For the year ended December 31, 2007, PharMerica LTC is included beginning August 1, 2007. See Note 1 of Notes to Consolidated Financial Statements—“Pharmacy Transaction”. |
| (2) | Includes depreciation expense of $5.4 million, $15.6 million, $22.0 million, $18.0 million and $18.8 million for the years ended December 31, 2006, 2007, 2008, 2009 and 2010, respectively. |
| (3) | The Corporation has never declared a cash dividend. Earnings (loss) per share in whole dollars and cents. |
| (4) | See “Use of Non GAAP Measures for Measuring Annual Results” for a definition and reconciliation. |
37
Table of Contents
Index to Financial Statements
Use of Non-GAAP Measures For Measuring Annual Results
The Corporation calculates Adjusted EBITDA as provided in the reconciliation below and calculates Adjusted EBITDA Margin by taking Adjusted EBITDA and dividing it by revenues. The Corporation calculates and uses Adjusted EBITDA as an indicator of its ability to generate cash from reported operating results. The measurement is used in concert with net income and cash flows from operating activities, which measure actual cash generated in the period. In addition, the Corporation believes that Adjusted EBITDA and Adjusted EBITDA Margin are supplemental measurement tools used by analysts and investors to help evaluate overall operating performance and the ability to incur and service debt and make capital expenditures. In addition, Adjusted EBITDA, as defined in the Credit Agreement, is used in conjunction with the Corporation’s debt leverage ratio and this calculation sets the applicable margin for the quarterly interest charge. Adjusted EBITDA, as defined in the Credit Agreement, is not the same calculation as this Adjusted EBITDA table. Adjusted EBITDA does not represent funds available for the Corporation’s discretionary use and is not intended to represent or to be used as a substitute for net income or cash flows from operating activities data as measured under U.S. generally accepted accounting principles (“GAAP”). The items excluded from Adjusted EBITDA but included in the calculation of the Corporation’s reported net income and cash flows from operating activities are significant components of the accompanying consolidated income statements and cash flows, and must be considered in performing a comprehensive assessment of overall financial performance. The Corporation’s calculation of Adjusted EBITDA may not be consistent with calculations of EBITDA used by other companies. The following is a reconciliation of the Corporation’s net income, net operating cash flows and earnings per diluted share for the periods presented.
Reconciliation of Net Income (Loss) to Adjusted EBITDA
| Years Ended December 31, | ||||||||||||||||||||
| 2006 | 2007 | 2008 | 2009 | 2010 | ||||||||||||||||
| Net income (loss) |
$ | 12.8 | $ | (24.1 | ) | $ | 5.0 | $ | 42.2 | $ | 19.2 | |||||||||
| Add: |
||||||||||||||||||||
| Interest expense, net |
(0.1 | ) | 7.2 | 14.2 | 9.4 | 3.6 | ||||||||||||||
| Integration, merger and acquisition related costs and other charges |
2.9 | 29.8 | 26.7 | 5.2 | 14.6 | |||||||||||||||
| Provision (benefit) for income taxes |
8.4 | (13.4 | ) | 3.3 | 18.9 | 13.0 | ||||||||||||||
| Effect of change in estimate on cost of goods sold |
— | (3.1 | ) | — | — | — | ||||||||||||||
| Effect of change in estimate on allowance for doubtful accounts |
— | 27.9 | — | — | — | |||||||||||||||
| Impairment of intangible assets |
— | — | 14.8 | — | — | |||||||||||||||
| Depreciation and amortization expense |
8.8 | 20.2 | 28.5 | 27.0 | 28.1 | |||||||||||||||
| Adjusted EBITDA |
$ | 32.8 | $ | 44.5 | $ | 92.5 | $ | 102.7 | $ | 78.5 | ||||||||||
| Adjusted EBITDA Margin |
5.0 | % | 3.7 | % | 4.8 | % | 5.6 | % | 4.2 | % | ||||||||||
38
Table of Contents
Index to Financial Statements
Reconciliation of Adjusted EBITDA to Net Operating Cash Flows
| Years Ended December 31, | ||||||||||||||||||||
| 2006 | 2007 | 2008 | 2009 | 2010 | ||||||||||||||||
| Adjusted EBITDA |
$ | 32.8 | $ | 44.5 | $ | 92.5 | $ | 102.7 | $ | 78.5 | ||||||||||
| Interest expense, net |
0.1 | (7.2 | ) | (14.2 | ) | (9.4 | ) | (3.6 | ) | |||||||||||
| (Provision) benefit for income taxes |
(8.4 | ) | 13.4 | (3.3 | ) | (18.9 | ) | (13.0 | ) | |||||||||||
| Effect of change in estimate on cost of goods sold |
— | 3.1 | — | — | — | |||||||||||||||
| Effect of change in estimate on allowance for doubtful accounts |
— | (27.9 | ) | — | — | — | ||||||||||||||
| Integration, merger and acquisition related costs and other charges |
(2.9 | ) | (22.6 | ) | (22.2 | ) | (4.8 | ) | (14.0 | ) | ||||||||||
| Provision for bad debt |
7.3 | 44.1 | 24.7 | 16.6 | 18.5 | |||||||||||||||
| Stock-based compensation |
0.9 | 1.5 | 4.9 | 4.6 | 4.8 | |||||||||||||||
| Amortization of deferred financing fees |
— | 0.2 | 0.4 | 0.4 | 0.6 | |||||||||||||||
| Loss on disposition of equipment |
0.5 | 0.1 | 0.2 | 0.3 | 0.3 | |||||||||||||||
| Deferred income taxes |
(1.6 | ) | (13.4 | ) | 2.8 | 19.7 | 12.3 | |||||||||||||
| Other |
(3.5 | ) | (0.9 | ) | (0.5 | ) | (0.3 | ) | — | |||||||||||
| Changes in assets and liabilities |
(15.2 | ) | 1.4 | (19.6 | ) | (25.9 | ) | 13.8 | ||||||||||||
| Net Cash Flows from Operating Activities |
$ | 10.0 | $ | 36.3 | $ | 65.7 | $ | 85.0 | $ | 98.2 | ||||||||||
The Corporation calculates and uses earnings per diluted share, exclusive of the impact of impairment of intangible assets, integration, merger and acquisition related costs and other charges, and favorable impact on tax ruling as an indicator of its core operating results. The measurement is used in concert with net income and earnings per diluted share, which measure actual earnings per share generated in the period. The Corporation believes the exclusion of these charges in expressing earnings per share provides management with a useful measure to assess period to period comparability and is useful to investors in evaluating the Corporation’s operating results from period to period. Earnings per diluted share, exclusive of the impact of impairment of intangible assets, integration, merger and acquisition related costs and other charges, and favorable impact on tax ruling does not represent the amount that effectively accrues directly to stockholders (i.e., such costs are a reduction in earnings and stockholders’ equity) and is not intended to represent or to be used as a substitute for earnings per diluted share as measured under GAAP. The integration, merger and acquisition related costs and other charges, impairment on intangible assets and favorable impact of tax rate matters excluded from the earnings per diluted share are significant components of the accompanying consolidated income statements, and must be considered in performing a comprehensive assessment of overall financial performance.
Unaudited Reconciliation of Earnings Per Diluted Share to Adjusted Earnings Per Diluted Share
| Years Ended December 31, | ||||||||||||||||||||
| 2006 | 2007 | 2008 | 2009 | 2010 | ||||||||||||||||
| Earnings per diluted share |
NM | $ | (1.13 | ) | $ | 0.17 | $ | 1.39 | $ | 0.64 | ||||||||||
| Add: |
||||||||||||||||||||
| Diluted earnings per share impact of: |
||||||||||||||||||||
| Impairment of intangible assets |
NM | — | 0.30 | — | — | |||||||||||||||
| Integration, merger, and acquisition related costs and other charges |
NM | 0.90 | 0.53 | 0.10 | 0.29 | |||||||||||||||
| Effect of change in estimate on cost of good sold |
— | (0.09) | — | — | — | |||||||||||||||
| Effect of change in estimate on allowance for doubtful accounts |
— | 0.84 | — | — | — | |||||||||||||||
| Tax rate matters |
NM | — | — | (0.19 | ) | — | ||||||||||||||
| Adjusted earnings per diluted common share after impact of above items |
NM | $ | 0.52 | $ | 1.00 | $ | 1.30 | $ | 0.93 | |||||||||||
39
Table of Contents
Index to Financial Statements
Item 7. Management’s Discussion and Analysis of Financial Condition and Results of Operations
CAUTIONARY STATEMENT REGARDING FORWARD-LOOKING STATEMENTS
This Annual Report on Form 10-K contains forward-looking statements, within the meaning of Section 27A of the Securities Act of 1933, as amended, and Section 21E of the Securities Exchange Act of 1934, as amended, which reflect the Corporation’s current estimates, expectations and projections about the Corporation’s future results, performance, prospects and opportunities. Forward looking statements include, among other things, the information concerning the Corporation’s possible future results of operations including revenue, costs of goods sold, and gross margin, business and growth strategies, financing plans, the Corporation’s competitive position and the effects of competition, the projected growth of the industries in which we operate, and the Corporation’s ability to consummate strategic acquisitions. Forward-looking statements include statements that are not historical facts and can be identified by forward-looking words such as “anticipate”, “believe”, “could”, “estimate”, “expect”, “intend”, “plan”, “may”, “should”, “will”, “would”, “project” and similar expressions. These forward-looking statements are based upon information currently available to the Corporation and are subject to a number of risks, uncertainties and other factors that could cause the Corporation’s actual results, performance, prospects or opportunities to differ materially from those expressed in, or implied by, these forward-looking statements. Important factors that could cause the Corporation’s actual results to differ materially from the results referred to in the forward-looking statements the Corporation makes in this report include:
| • | the Corporation’s access to capital, credit ratings, indebtedness, and ability to raise additional financings and operate under the terms of the Corporation’s debt obligations; |
| • | anti-takeover provisions of the Delaware General Corporation Law, our certificate of incorporation and our by-laws could delay or deter a change in control; |
| • | certain restrictions resulting from continuing relationships with the Corporation’s former parent companies; |
| • | the effects of adverse economic trends or intense competition in the markets in which we operate; |
| • | the demand for the Corporation’s products and services; |
| • | the effects of retaining existing customers and service contracts and the Corporation’s ability to attract new customers for growth of the Corporation’s business; |
| • | the effects of renegotiating contract pricing relating to significant customers and suppliers, including the hospital pharmacy segment which is substantially dependent to service provided to one customer; |
| • | the effects of an increase in credit risk, loss or bankruptcy of or default by any significant customer, supplier, or other entity relevant to the Corporation’s operations; |
| • | Corporation’s ability to successfully renegotiate its Credit Agreement; |
| • | the Corporation’s ability to successfully pursue the Corporation’s development and acquisition activities and successfully integrate new operations and systems, including the realization of anticipated revenues, economies of scale, cost savings, and productivity gains associated with such operations; |
| • | the Corporation’s ability to control costs, particularly labor and employee benefit costs, rising pharmaceutical costs, and regulatory compliance costs; |
| • | the effects of healthcare reform and government regulations, including, interpretation of regulations and changes in the nature and enforcement of regulations governing the healthcare and institutional pharmacy services industries; |
| • | changes in the reimbursement rates or methods of payment from Medicare and Medicaid and other third party payers to both us and our customers; |
40
Table of Contents
Index to Financial Statements
| • | the potential impact of state government budget shortfalls and their ability to pay the Corporation and its customers for services provided; |
| • | the Corporation’s ability, and the ability of the Corporation’s customers, to comply with Medicare or Medicaid reimbursement regulations or other applicable laws; |
| • | the effects of changes in the interest rate on the Corporation’s outstanding floating rate debt instrument and the increases in interest expense, including increases in interest rate terms on any new debt financing; |
| • | the Corporation’s ability to implement the short cycle dispensing requirements of the 2010 Health Care Legislation without incurring significant additional operating costs; |
| • | further consolidation of managed care organizations and other third party payers; |
| • | political and economic conditions nationally, regionally, and in the markets in which the Corporation operates; |
| • | natural disasters, war, civil unrest, terrorism, fire, floods, tornadoes, earthquakes, hurricanes, epidemic, pandemic, catastrophic event or other matters beyond the Corporation’s control; |
| • | increases in energy costs, including state and federal taxes, and the impact on the costs of delivery expenses and utility expenses; |
| • | elimination of, changes in, or the Corporation’s failure to satisfy pharmaceutical manufacturers’ rebate programs; |
| • | the Corporation’s ability to attract and retain key executives, pharmacists, and other healthcare personnel; |
| • | the Corporation’s risk of loss not covered by insurance; |
| • | the outcome of litigation to which the Corporation is a party from time to time, including adverse results in material litigation or governmental inquiries; |
| • | changes in accounting rules and standards, audits, compliance with the Sarbanes-Oxley Act, and regulatory investigations; |
| • | the effects on the Corporation’s results of operations related to the accounting for the costs of acquisitions; |
| • | changes in market conditions that would result in the impairment of goodwill or other assets of the Corporation; |
| • | changes in market conditions in which we operate that would influence the value of the Corporation’s stock; |
| • | changes in volatility of the Corporation’s stock price and the risk of litigation following a decline in the price of the Corporation’s stock price; |
| • | the Corporation’s ability to anticipate a shift in demand for generic drug equivalents and the impact on the financial results including the negative impact on brand drug rebates; |
| • | prescription volumes may decline, and our net revenues and profitability may be negatively impacted, if the safety risk profiles of drugs increase or if drugs are withdrawn from the market, including as a result of manufacturing issues, or if prescription drugs transition to over-the-counter products; |
| • | the effects on the Corporation’s results of operations related to interpretations of accounting principles by the SEC staff that may differ from those of management; |
| • | changes in tax laws and regulations; |
| • | the effects of changes to critical accounting estimates; and |
| • | other factors, risks and uncertainties referenced in the Corporation’s filings with the Commission, including the “Risk Factors” set forth in this Report on Form 10-K. |
41
Table of Contents
Index to Financial Statements
YOU ARE CAUTIONED NOT TO PLACE UNDUE RELIANCE ON ANY FORWARD-LOOKING STATEMENTS, ALL OF WHICH SPEAK ONLY AS OF THE DATE OF THIS ANNUAL REPORT. EXCEPT AS REQUIRED BY LAW, WE UNDERTAKE NO OBLIGATION TO PUBLICLY UPDATE OR RELEASE ANY REVISIONS TO THESE FORWARD-LOOKING STATEMENTS TO REFLECT ANY EVENTS OR CIRCUMSTANCES AFTER THE DATE OF THIS ANNUAL REPORT OR TO REFLECT THE OCCURRENCE OF UNANTICIPATED EVENTS. ALL SUBSEQUENT WRITTEN AND ORAL FORWARD-LOOKING STATEMENTS ATTRIBUTABLE TO US OR ANY PERSON ACTING ON THE CORPORATION’S BEHALF ARE EXPRESSLY QUALIFIED IN THEIR ENTIRETY BY THE CAUTIONARY STATEMENTS CONTAINED OR REFERRED TO IN THIS SECTION AND IN OUR RISK FACTORS SET FORTH IN PART I, ITEM 1A OF THIS REPORT ON FORM 10-K AND IN OTHER REPORTS FILED WITH THE SEC BY THE CORPORATION.
The Corporation’s Business and Industry Trends
The Corporation is an institutional pharmacy services company, which services healthcare facilities and provides management pharmacy services to hospitals. The Corporation is the second largest institutional pharmacy services company in the United States. The Corporation operates 97 institutional pharmacies in 43 states. The Corporation’s customers are typically institutional healthcare providers, such as nursing centers, assisted living facilities, hospitals and other long-term alternative care settings. The Corporation is generally the primary source of supply of pharmaceuticals to its customers. The Corporation also provides pharmacy management services to 90 hospitals in the United States.
The institutional pharmacy services business is highly competitive. Competition is a significant factor that can impact the Corporation’s overall financial results, pricing to customers, and bed retention. In each geographic market, there are national, regional and local institutional pharmacies that provide services comparable to those offered by the Corporation’s pharmacies. These pharmacies may have greater financial and other resources than we do and may be more established in the markets they serve than we are. The Corporation also competes against regional and local pharmacies that specialize in the highly-fragmented long-term care markets. In the future some of the Corporation’s customers may seek to in-source the provision of pharmaceuticals to patients in their facilities by establishing an internal pharmacy.
A variety of factors are affecting the institutional pharmacy industry. With an aging population and the extension of drug coverage to a greater number of individuals through Medicare Part D, the consumption of pharmaceuticals by residents of long-term care facilities is likely to increase in the future. In addition, individuals are expected to enter assisted living facilities, independent living facilities and continuing care retirement communities at increasing rates. Under Medicare Part D, eligible individuals may choose to enroll in various Medicare Part D Plans to receive prescription drug coverage. Each Medicare Part D Plan determines a distinct formulary for the long-term care residents enrolled in its plan. Accordingly, institutional pharmacies have incurred increased administrative costs to manage each Part D Plan’s formulary, reimbursement and administrative processes for their long-term care enrollees. Institutional pharmacies may continue to experience increased administrative burdens and costs due to the greater complexity of the requirements for drug reimbursement, including costs associated with the short cycle dispensing requirements which take effect January 1, 2012. Medicare Part D also requires increased choices for patients with respect to complex drug categories and therapeutic interchange opportunities. Institutional pharmacies may realize increased revenue by providing long-term care residents with specialized services in these areas. Continued industry consolidation may also impact the dynamics of the institutional pharmacy market.
In addition, our continued success depends on our ability to attract and retain pharmacists and other pharmacy professionals. Competition for qualified pharmacists and other pharmacy professionals is strong. The loss of pharmacy personnel or the inability to attract, retain or motivate sufficient numbers of qualified pharmacy professionals could adversely affect our business. Although we generally have been able to meet our staffing requirements for pharmacists and other pharmacy professionals in the past, our inability to do so in the future could have a material adverse impact on us.
42
Table of Contents
Index to Financial Statements
Critical Accounting Estimates
The preparation of financial statements in accordance with accounting principles generally accepted in the U.S. requires us to make estimates and assumptions that affect reported amounts and related disclosures. Management considers an accounting estimate to be critical if:
| • | It requires assumptions to be made that were uncertain at the time the estimate was made; and |
| • | Changes in the estimate or different estimates could have a material impact on our consolidated results of operations or financial condition. |
The Corporation’s management has discussed the development and selection of these critical accounting estimates with the audit committee of the Board of Directors and with the Corporation’s independent registered public accounting firm, and they both have reviewed the disclosure presented below relating to critical accounting estimates.
The table of critical accounting estimates is not intended to be a comprehensive list of all of the Corporation’s accounting policies that require estimates. Management believes that of the significant accounting policies, as discussed in Note 1 of the consolidated financial statements included elsewhere in this report, the estimates discussed below involve a higher degree of judgment and complexity. Management believes the current assumptions and other considerations used to estimate amounts reflected in the consolidated financial statements are appropriate. However, if actual experience differs from the assumptions and other considerations used in estimating amounts reflected in the consolidated financial statements, the resulting changes could have a material adverse effect on the consolidated results of operations and financial condition of the Corporation.
The table that follows presents information about our critical accounting estimates, as well as the effects of hypothetical changes in the material assumptions used to develop each estimate. Our sensitivity analysis was performed assuming the assumptions listed, based upon the actual results of the Corporation for the year ended December 31, 2010, and the actual diluted shares.
43
Table of Contents
Index to Financial Statements
44
Table of Contents
Index to Financial Statements
45
Table of Contents
Index to Financial Statements
46
Table of Contents
Index to Financial Statements
47
Table of Contents
Index to Financial Statements
48
Table of Contents
Index to Financial Statements
49
Table of Contents
Index to Financial Statements
50
Table of Contents
Index to Financial Statements
51
Table of Contents
Index to Financial Statements
Impact of Recent Accounting Pronouncements
Management reviewed the most recent issued accounting pronouncements as of December 31, 2010 and determined that none were applicable to the Corporation.
Key Financial Statement Components
Consolidated Income Statements
Our revenues are comprised primarily of product revenues and are derived from the sale of prescription drugs through our institutional pharmacies. The majority of our product revenues are derived on a fee-for-service basis. Our revenues are recorded net of certain discounts and estimates for returns. Hospital pharmacy revenues represent management fees and pass through costs associated with managing the clients’ hospital pharmacy.
Cost of goods sold is comprised primarily of the cost of product and is principally attributable to the dispensing of prescription drugs. Our cost of product relating to drugs dispensed by our institutional pharmacies consists primarily of the cost of inventory dispensed and our costs incurred to process and dispense the prescriptions. Cost of goods also includes direct labor, delivery costs, rent, utilities, depreciation, travel costs, professional fees and other costs attributable to the dispensing of medications. In addition, cost of product includes a credit for rebates earned from brand-name pharmaceutical manufacturers whose drugs are included in our formularies. These rebates generally take the form of formulary rebates, which are earned based on the volume of a specific drug dispensed, or market share rebates, which are earned based on the achievement of contractually specified market share levels. The Corporation also receives rebates on generic drugs dispensed and administrative rebates.
Selling, general and administrative expenses reflect the costs of operations dedicated to executive management, the generation of new sales, maintenance of existing client relationships, management of clinical programs, enhancement of technology capabilities, direction of pharmacy operations, human resources and performance of reimbursement activities, in addition to finance, legal and other staff activities.
Integration, merger and acquisition related costs and other charges represents the costs associated with the Pharmacy Transaction, as well as costs related to other acquisitions.
Interest expense, net, primarily includes interest expense relating to our senior secured credit facility and the swap agreement that expired on July 31, 2009, partially offset by interest income generated by cash and cash equivalents.
Consolidated Balance Sheets
Our assets include cash and cash equivalent investments, accounts receivable, inventory, fixed assets, deferred tax assets, goodwill and intangibles.
Cash reflects the accumulation of positive cash flows from our operations and financing activities, and primarily includes deposits with banks or other financial institutions. Our cash balances are at the highest on Thursday nights and at the lowest on Friday nights. Friday is usually our largest cash disbursement day as a result of payments for our drug costs and our payrolls.
Accounts receivable primarily consist of amounts due from Prescription Drug Plans under Medicare Part D, the respective state Medicaid programs, long-term care institutions, third party insurance companies, and private payers, net of allowances for doubtful accounts, as well as contractual allowances.
52
Table of Contents
Index to Financial Statements
Inventory reflects the cost of prescription products held for dispensing by our institutional pharmacies, net of capitalized rebates, and are recorded on a first-in, first-out basis. We perform quarterly inventory counts and record our inventory and cost of goods sold based on such quarterly inventories. We also include an estimate for returns on inventory.
Deferred tax assets primarily represent temporary differences between the financial statement basis and the tax basis of certain accrued expenses, tax deductible goodwill, net operating loss carryforwards, and stock-based compensation.
Fixed assets include investments in our institutional pharmacies and information technology, including capitalized software development. Goodwill and intangible assets are comprised primarily of goodwill and intangibles related to our previous acquisitions.
Our primary liabilities include accounts payable, accrued salaries and wages, other current liabilities, debt, and deferred tax liabilities. Accounts payable primarily consist of amounts payable for prescription inventory purchases under our Prime Vendor Agreement and other purchases made in the normal course of business. The balances in accounts payable and accrued salaries and wages are at the highest on Thursday nights and at the lowest on Friday nights, as a result of payments for drug costs and payroll being funded on Friday. Accrued expenses and other current liabilities primarily consist of employee and facility-related cost accruals incurred in the normal course of business, as well as income taxes payable. Our debt is primarily comprised of a loan under our senior secured credit facility as well as our revolver. We do not have any off-balance sheet arrangements, other than purchase commitments and lease obligations.
Consolidated Statements of Cash Flows
An important element of our operating cash flows is the timing of billing cycles, subsequent cash collections and payments for drug costs and labor. Due to the nature of the Corporation’s cash cycle, cash flows from operations can fluctuate significantly depending on the day of the week of the respective close process. We pay for our prescription drug inventory in accordance with payment terms offered under our Prime Vendor Agreement. The Corporation receives rebates from its prime vendor and suppliers each period. Rebates are capitalized into inventory and also recorded as a reduction to cost of goods sold in the period earned. Outgoing cash flows include inventory purchases, employee payroll and benefits, facility operating expenses, capital expenditures including technology investments, interest and principal payments on our outstanding debt, and income taxes. The cost of acquisitions will also result in cash outflows.
Definitions
Listed below are definitions of terms used by the Corporation in managing the business. The definitions are necessary to the understanding of the Management’s Discussion and Analysis section of this document.
Assisted Living Facilities (ALF): Represents assisted living facility. Its units or beds will represent the number of apartment type units within the facility.
Bps: Represents basis points. Basis points are based on percentages. For example, 100 bps represents a change of 1.0%.
DNA: Represents data not available.
NA: Represents not applicable.
NM: Represents not meaningful.
53
Table of Contents
Index to Financial Statements
Prescriptions Dispensed: Represents a prescription filled for an individual patient. A prescription will usually be for a 15 or 30 day period and will include only one drug type.
Revenues per prescription dispensed: Represents the revenues from the institutional pharmacy segment divided by the total prescriptions dispensed.
Skilled Nursing Facilities (SNF): Represents skilled nursing facilities. Its licensed beds will represent the customer licensed beds and this may not be indicative of its census.
Results of Operations
The following table presents selected consolidated comparative results of operations and statistical information (dollars in millions, except per prescription and per patient amounts, and prescriptions in thousands):
| Years Ended December 31, | ||||||||||||||||||||||||||||||||||||||||
| 2008 | Increase (Decrease) |
2009 | Increase (Decrease) |
2010 | ||||||||||||||||||||||||||||||||||||
| Amount | % of Revenues |
Amount | % of Revenues |
Amount | % of Revenues |
|||||||||||||||||||||||||||||||||||
| Net revenues: |
||||||||||||||||||||||||||||||||||||||||
| Institutional Pharmacy |
$ | 1,888.8 | 97.0 | % | $ | (104.1 | ) | (5.5 | )% | $ | 1,784.7 | 96.9 | % | $ | 4.7 | 0.3 | % | $ | 1,789.4 | 96.9 | % | |||||||||||||||||||
| Hospital Management |
58.5 | 3.0 | (2.0 | ) | (3.4 | ) | 56.5 | 3.1 | 1.4 | 2.5 | 57.9 | 3.1 | ||||||||||||||||||||||||||||
| Total net revenues |
1,947.3 | 100.0 | (106.1 | ) | (5.4 | ) | 1,841.2 | 100.0 | 6.1 | 0.3 | 1,847.3 | 100.0 | ||||||||||||||||||||||||||||
| Cost of goods sold: |
||||||||||||||||||||||||||||||||||||||||
| Institutional Pharmacy |
1,612.6 | 82.8 | (94.9 | ) | (5.9 | ) | 1,517.7 | 82.4 | 38.9 | 2.6 | 1,556.6 | 84.3 | ||||||||||||||||||||||||||||
| Hospital Management |
47.4 | 2.4 | 0.6 | 1.3 | 48.0 | 2.6 | 2.4 | 5.0 | 50.4 | 2.7 | ||||||||||||||||||||||||||||||
| Total cost of goods sold |
1,660.0 | 85.2 | (94.3 | ) | (5.7 | ) | 1,565.7 | 85.0 | 41.3 | 2.6 | 1,607.0 | 87.0 | ||||||||||||||||||||||||||||
| Gross profit: |
||||||||||||||||||||||||||||||||||||||||
| Institutional Pharmacy |
276.2 | 14.2 | (9.2 | ) | (3.3 | ) | 267.0 | 14.5 | (34.2 | ) | (12.8 | ) | 232.8 | 12.6 | ||||||||||||||||||||||||||
| Hospital Management |
11.1 | 0.6 | (2.6 | ) | (23.4 | ) | 8.5 | 0.5 | (1.0 | ) | (11.8 | ) | 7.5 | 0.4 | ||||||||||||||||||||||||||
| Total gross profit |
$ | 287.3 | 14.8 | % | $ | (11.8 | ) | (4.1 | )% | $ | 275.5 | 15.0 | % | $ | (35.2 | ) | (12.8 | )% | $ | 240.3 | 13.0 | % | ||||||||||||||||||
| Institutional Pharmacy (in whole numbers except where indicated) |
||||||||||||||||||||||||||||||||||||||||
| Volume information |
||||||||||||||||||||||||||||||||||||||||
| Prescriptions dispensed (in thousands) |
40,319 | (1,282 | ) | (3.2 | )% | 39,037 | (1,211 | ) | (3.1 | )% | 37,826 | |||||||||||||||||||||||||||||
| Revenue per prescription dispensed |
$ | 46.85 | $ | (1.13 | ) | (2.4 | )% | $ | 45.72 | $ | 1.59 | 3.5 | % | $ | 47.31 | |||||||||||||||||||||||||
| Gross profit per prescription dispensed |
$ | 6.85 | $ | (0.01 | ) | (0.1 | )% | $ | 6.84 | $ | (0.69 | ) | (10.1 | )% | $ | 6.15 | ||||||||||||||||||||||||
| Gross profit percent |
14.6 | % | 0.4 | 2.7 | % | 15.0 | % | (2.0 | ) | (13.3 | )% | 13.0 | % | |||||||||||||||||||||||||||
| Generic dispensing rate |
70.7 | % | 3.5 | 5.0 | % | 74.2 | % | 1.3 | 1.8 | % | 75.5 | % | ||||||||||||||||||||||||||||
| Customer licensed beds under contract |
||||||||||||||||||||||||||||||||||||||||
| Beginning of period |
336,759 | (15,691 | ) | (4.7 | )% | 321,068 | (7,195 | ) | (2.2 | )% | 313,873 | |||||||||||||||||||||||||||||
| Additions |
21,398 | 14,523 | 67.9 | 35,921 | 60,028 | 167.1 | 95,949 | |||||||||||||||||||||||||||||||||
| Losses and other |
(37,089 | ) | (6,027 | ) | 16.3 | (43,116 | ) | (2,862 | ) | 6.6 | (45,978 | ) | ||||||||||||||||||||||||||||
| End of period |
321,068 | (7,195 | ) | (2.2 | )% | 313,873 | 49,971 | 15.9 | % | 363,844 | ||||||||||||||||||||||||||||||
| Hospital Management (in whole numbers except where indicated) |
||||||||||||||||||||||||||||||||||||||||
| Volume information |
||||||||||||||||||||||||||||||||||||||||
| Hospital management contracts serviced |
84 | 2 | 2.4 | % | 86 | 4 | 4.7 | % | 90 | |||||||||||||||||||||||||||||||
54
Table of Contents
Index to Financial Statements
Revenues
Institutional pharmacy revenues increased $4.7 million for the year ended December 31, 2010 compared to the year ended December 31, 2009. The increase in revenues was due primarily to the acquisition of Chem Rx on November 4, 2010, which resulted in additional revenues of $59.1 million or 1,096,000 prescriptions dispensed, offset by a decline in the existing institutional pharmacy revenues of $54.4 million. The acquisition of Chem Rx had an impact of a positive rate increase on revenue of $0.20 per prescription dispensed in the year. The existing institutional pharmacy revenues decline of $54.4 million resulted from an unfavorable volume variance of approximately $105.5 million or 2,307,000 fewer prescriptions dispensed, offset by a favorable rate variance of approximately $51.1 million or a $1.39 increase per prescription dispensed. The rate variance was comprised of approximately $101.0 million due to inflation on drugs dispensed between periods offset by $49.9 million due to the increase in the generic drug dispensing rate during the period from 74.2% to 75.5% and the September 2009 change in the AWP for which state Medicaid reimbursement has not been upwardly adjusted, continued Medicare Part D pricing pressures and other concessions. The unfavorable volume variance of approximately $105.5 million was due to the decline in customer licensed beds under contract prior to the acquisition of Chem Rx and Lone Star. The Lone Star acquisition closed on December 31, 2010; and accordingly no revenues from this acquisition are included in the results of operations for the year ended December 31, 2010.
The increase in hospital management revenues for the year ended December 31, 2010 compared to the year ended December 31, 2009 of $1.4 million was primarily due to an increase in the number of hospital management contracts serviced, partially offset by concessions with certain hospital management contracts serviced in the period.
The decrease in institutional pharmacy revenues of $104.1 million for the year ended December 31, 2009 compared to the year ended December 31, 2008 was the result of an unfavorable rate variance of approximately $44.0 million or a $1.13 decline per prescription dispensed and an unfavorable volume variance of approximately $60.1 million or 1,282,000 fewer prescriptions dispensed. The rate variance was comprised of approximately $85.6 million due to inflation on brand and generic drugs, offset by a decline in revenues of approximately $129.6 million due to the increase in the generic drug dispensing rate from 70.7% to 74.2% during the period, the AWP impact of $1.4 million and other concessions. The volume variance of approximately $60.1 million was due to the decline in net customer licensed beds under contract and one less calendar day. The year ended December 31, 2009, had one less business and calendar day of activity compared to the year ended December 31, 2008, resulting in less revenue for the current period of approximately $4.9 million or 107,000 fewer prescriptions dispensed.
The decrease in hospital management revenues for the year ended December 31, 2009 of $2.0 million was due primarily to concessions with certain hospital management contracts serviced in the period.
Cost of Goods Sold
Institutional pharmacy cost of goods sold increased $38.9 million for the year ended December 31, 2010 as compared to the year ended December 31, 2009 primarily due to the acquisition of Chem Rx offset by lower costs as a result of fewer prescriptions dispensed from the existing institutional pharmacy business and other factors. The Chem Rx acquisition increased cost of goods sold approximately $52.6 million or 1,096,000 prescriptions dispensed. The decline of $13.7 million in the existing institutional pharmacy business is due to 2,307,000 fewer prescriptions dispensed. Excluding the Chem Rx acquisition overall total drug costs as a percent of revenues increased 138 bps and other costs included in cost of goods sold as a percent of revenues increased 52 bps, of which the increase primarily related to higher delivery expense as a result of the DEA’s new interpretation of the Controlled Substances Act regarding the ability of nurses in skilled nursing facilities to order controlled substances for the residents of these facilities. The Lone Star acquisition closed on December 31, 2010 and accordingly, no costs of goods sold from this acquisition are included in the results of operations for the year ended December 31, 2010.
55
Table of Contents
Index to Financial Statements
Hospital management cost of goods sold increased $2.4 million for the year ended December 31, 2010 as compared to the year ended December 31, 2009 due to four additional hospital management contracts serviced during the period.
Institutional pharmacy cost of goods sold decreased $94.9 million for the year ended December 31, 2009, compared to the year ended December 31, 2008, due primarily to a reduction in drug purchases as a result of less prescriptions being dispensed. Drug spend as a percentage of revenues increased 31 bps but was offset by an improvement in rebates of 9 bps during the comparable periods. Other costs included within cost of goods sold as a percent of revenues improved a combined 62 bps, predominately as a result of operational efficiencies. The year ended December 31, 2008, also included a reduction related to the reimbursement of overcharges on self-insured employee health benefits of $1.5 million, of which approximately $0.9 million related to 2007.
Hospital management cost of goods sold for the year ended December 31, 2009, increased $0.6 million, compared to the respective prior periods, due to the increase in the number of hospital contracts serviced between periods.
Gross Profit and Operating Expenses
Gross profit and other operating expenses were the following for the periods presented (dollars in millions):
| Years Ended December 31, | ||||||||||||||||||||||||||||||||||||||||
| 2008 | Increase (Decrease) |
2009 | Increase (Decrease) |
2010 | ||||||||||||||||||||||||||||||||||||
| Amount | % of Revenues |
Amount | % of Revenues |
Amount | % of Revenues |
|||||||||||||||||||||||||||||||||||
| Gross profit and operating expenses: |
||||||||||||||||||||||||||||||||||||||||
| Total gross profit |
$ | 287.3 | 14.8 | % | $ | (11.8 | ) | (4.1 | )% | $ | 275.5 | 15.0 | % | $ | (35.2 | ) | (12.8 | )% | $ | 240.3 | 13.0 | % | ||||||||||||||||||
| Selling, general and administrative expenses |
216.8 | 11.1 | (26.0 | ) | (12.0 | ) | 190.8 | 10.4 | (10.2 | ) | (5.3 | ) | 180.6 | 9.8 | ||||||||||||||||||||||||||
| Amortization expense |
6.5 | 0.3 | 2.5 | 38.5 | 9.0 | 0.5 | 0.3 | 3.3 | 9.3 | 0.5 | ||||||||||||||||||||||||||||||
| Impairment of intangible assets |
14.8 | 0.8 | (14.8 | ) | (100.0 | ) | — | — | — | — | — | — | ||||||||||||||||||||||||||||
| Integration, merger related costs and other charges |
26.7 | 1.4 | (21.5 | ) | (80.5 | ) | 5.2 | 0.3 | 9.4 | 180.8 | 14.6 | 0.8 | ||||||||||||||||||||||||||||
| Interest expense, net |
14.2 | 0.7 | (4.8 | ) | (33.8 | ) | 9.4 | 0.5 | (5.8 | ) | (61.7 | ) | 3.6 | 0.2 | ||||||||||||||||||||||||||
| Income before provision for income taxes |
8.3 | 0.5 | 52.8 | 636.1 | 61.1 | 3.3 | (28.9 | ) | (47.3 | ) | 32.2 | 1.7 | ||||||||||||||||||||||||||||
| Provision for income taxes |
3.3 | 0.2 | 15.6 | 472.7 | 18.9 | 1.0 | (5.9 | ) | (31.2 | ) | 13.0 | 0.7 | ||||||||||||||||||||||||||||
| Net income |
$ | 5.0 | 0.3 | % | $ | 37.2 | 744.0 | % | $ | 42.2 | 2.3 | % | $ | (23.0 | ) | (54.5 | )% | $ | 19.2 | 1.0 | % | |||||||||||||||||||
Institutional gross profit for the year ended December 31, 2010 was $232.8 million or $6.15 per prescription dispensed, compared to $267.0 million or $6.84 per prescription dispensed for the year ended December 31, 2009. The Chem Rx acquisition resulted in $6.5 million of gross profit, or $5.93 per prescription dispensed. The gross margin for the Chem Rx business during the year was approximately 11.0%, which is lower than the Corporation’s existing institutional pharmacy business primarily because of the nature of the customers they service and markets in which they operate. The institutional pharmacy gross profit margin for the year ended December 31, 2010 was 13.0% compared to 15.0% for the year ended December 31, 2009. Gross profit was impacted by a continuation of reimbursement pressure under the Medicare Part D and Medicaid programs, other pricing concessions and a decline in licensed beds under contract prior to the acquisition of Chem Rx and Lone Star and higher delivery expenses. Delivery expense increased as a result of the DEA’s new interpretation of the Controlled Substances Act regarding the ability of nurses in skilled nursing facilities to order controlled substances for the residents of these facilities. The Lone Star acquisition closed on December 31, 2010 and accordingly, no gross profit from this acquisition is included in the results of operations for the year ended December 31, 2010.
56
Table of Contents
Index to Financial Statements
The decrease in hospital management gross profit for the year ended December 31, 2010 of $1.0 million as compared to the year ended December 31, 2009 was due primarily to the June 30, 2009 pricing concessions related to the renegotiated Kindred contract, partially offset by the four additional hospital contracts serviced in 2010.
Institutional pharmacy gross profit for the year ended December 31, 2009 was $267.0 million, or $6.84 per prescription dispensed, compared to $276.2 million, or $6.85 per prescription dispensed for the year ended December 31, 2008. The year ended December 31, 2008 included the reimbursement of overcharges on self-insured employee health benefits of $1.5 million of which approximately $0.9 million related to 2007 ($0.02 per script). Excluding the favorable impact of the reimbursement of the self-insurance, the gross profit per prescription dispensed would be consistent from 2008 to 2009. The institutional pharmacy gross profit margin for the year ended December 31, 2009 was 15.0% compared to 14.6% for the year ended December 31, 2008. After considering the impact of the reimbursement of overcharges on self-insurance, the gross profit margin increased 40 bps from 14.6% for the year ended December 31, 2008 to 15.0% for the year ended December 31, 2009. The increase in institutional pharmacy gross profit margin as a percent of institutional pharmacy revenues is due primarily to synergies from the consolidation of pharmacy locations, partially offset by margin compression as reimbursement declined on generic drugs as more alternatives become available.
The decrease in hospital management gross profit for the year ended December 31, 2009 of $2.6 million was due primarily to concessions with certain hospital management contracts serviced during the periods.
Selling, General and Administrative Expenses (Dollars in millions)
| Years Ended December 31, | ||||||||||||||||||||||||||||||||||||||||
| 2008 | Increase (Decrease) |
2009 | Increase (Decrease) |
2010 | ||||||||||||||||||||||||||||||||||||
| Amount | % of Revenues |
Amount | % of Revenues |
Amount | % of Revenues |
|||||||||||||||||||||||||||||||||||
| Selling, general and administrative expenses |
||||||||||||||||||||||||||||||||||||||||
| Total wages, benefits and contract labor |
$ | 110.2 | 5.7 | % | $ | (5.3 | ) | (4.8 | )% | $ | 104.9 | 5.7 | % | $ | (12.6 | ) | (12.0 | )% | $ | 92.3 | 5.0 | % | ||||||||||||||||||
| Contracted services |
17.2 | 0.9 | (4.0 | ) | (23.3 | ) | 13.2 | 0.7 | 1.7 | 12.9 | 14.9 | 0.8 | ||||||||||||||||||||||||||||
| Provision for doubtful accounts |
24.7 | 1.3 | (8.1 | ) | (32.8 | ) | 16.6 | 0.9 | 1.9 | 11.4 | 18.5 | 1.0 | ||||||||||||||||||||||||||||
| Supplies |
7.5 | 0.4 | — | — | 7.5 | 0.4 | (0.8 | ) | (10.7 | ) | 6.7 | 0.4 | ||||||||||||||||||||||||||||
| Travel expenses |
5.9 | 0.3 | (1.4 | ) | (23.7 | ) | 4.5 | 0.2 | 0.2 | 4.4 | 4.7 | 0.3 | ||||||||||||||||||||||||||||
| Professional fees |
9.6 | 0.5 | (0.3 | ) | (3.1 | ) | 9.3 | 0.5 | (0.7 | ) | (7.5 | ) | 8.6 | 0.5 | ||||||||||||||||||||||||||
| Stock-based compensation |
4.9 | 0.3 | (0.3 | ) | (6.1 | ) | 4.6 | 0.3 | 0.2 | 4.3 | 4.8 | 0.3 | ||||||||||||||||||||||||||||
| Depreciation |
10.7 | 0.5 | (2.1 | ) | (19.6 | ) | 8.6 | 0.5 | 0.8 | 9.3 | 9.4 | 0.5 | ||||||||||||||||||||||||||||
| Rent |
8.9 | 0.4 | (4.8 | ) | (53.9 | ) | 4.1 | 0.2 | (0.1 | ) | (2.4 | ) | 4.0 | 0.2 | ||||||||||||||||||||||||||
| Maintenance |
3.1 | 0.2 | (0.5 | ) | (16.1 | ) | 2.6 | 0.2 | (0.1 | ) | (3.8 | ) | 2.5 | 0.1 | ||||||||||||||||||||||||||
| Other costs |
14.1 | 0.6 | 0.8 | 5.7 | 14.9 | 0.8 | (0.7 | ) | (4.7 | ) | 14.2 | 0.7 | ||||||||||||||||||||||||||||
| Total selling, general and administrative expenses |
$ | 216.8 | 11.1 | % | $ | (26.0 | ) | (12.0 | )% | $ | 190.8 | 10.4 | % | $ | (10.2 | ) | (5.3 | )% | $ | 180.6 | 9.8 | % | ||||||||||||||||||
Selling, general and administrative expenses, excluding the $4.8 million of Chem Rx expenses, decreased $15.0 million over the comparable period in the prior year. Total labor costs decreased $12.6 million for the year ended December 31, 2010 over the comparable period in the prior year, which included $2.5 million of additional labor costs related to the Chem Rx acquisition. The decrease of $15.1 million in labor costs excluding Chem Rx is due to a reduction in staffing and employee performance based compensation of approximately $8.8 million. Other costs in selling, general and administrative expenses increased $2.4 million during the year ended December 31, 2010 due primarily to the Chem Rx acquisition. The Lone Star acquisition closed on December 31, 2010 and accordingly, no selling, general and administrative expenses from this acquisition are included in the results of operations for the year ended December 31, 2010.
57
Table of Contents
Index to Financial Statements
Total labor costs decreased $5.3 million for the year ended December 31, 2009, over the comparable period in the prior year as a result of management’s effort to eliminate duplicate overhead positions within the pharmacy locations and reduce certain corporate overhead functions. Total labor costs in 2008 were reduced by $0.3 million related to the health insurance reimbursement which related to 2007, without which the total labor decrease would have been $5.6 million. Costs associated with contracted services decreased $4.0 million predominantly due to lower costs associated with the IT Services Agreement. The provision for doubtful accounts decreased $8.1 million primarily as a result of improved collections from certain payer types. Total rent decreased $4.8 million primarily as a result of the pharmacy consolidations in the prior period. Other costs within selling, general and administrative expenses declined during the year ended December 31, 2009 a combined $3.8 million due primarily to synergies resulting from the pharmacy consolidations.
Depreciation and Amortization
Depreciation expense for the periods presented is as follows (dollars in millions):
| Years Ended December 31, | ||||||||||||||||||||||||
| 2008 | 2009 | 2010 | ||||||||||||||||||||||
| Amount | % of Revenues |
Amount | % of Revenues |
Amount | % of Revenues |
|||||||||||||||||||
| Leasehold improvements |
$ | 2.3 | 0.1 | % | $ | 1.5 | 0.1 | % | $ | 1.7 | 0.1 | % | ||||||||||||
| Equipment and software |
19.3 | 1.0 | 15.9 | 0.9 | 16.4 | 0.9 | ||||||||||||||||||
| Leased equipment |
0.4 | NM | 0.6 | NM | 0.7 | NM | ||||||||||||||||||
| Total depreciation expense |
$ | 22.0 | 1.1 | % | $ | 18.0 | 1.0 | % | $ | 18.8 | 1.0 | % | ||||||||||||
| Depreciation expense recorded in cost of goods sold |
$ | 11.3 | 0.6 | % | $ | 9.4 | 0.5 | % | $ | 9.4 | 0.5 | % | ||||||||||||
| Depreciation expense recorded in selling, general & administrative expenses |
10.7 | 0.5 | 8.6 | 0.5 | 9.4 | 0.5 | ||||||||||||||||||
| Total depreciation expense |
$ | 22.0 | 1.1 | % | $ | 18.0 | 1.0 | % | $ | 18.8 | 1.0 | % | ||||||||||||
| Total capital expenditures |
$ | 22.1 | 1.1 | % | $ | 21.6 | 1.2 | % | $ | 12.6 | 0.7 | % | ||||||||||||
Depreciation expense increased $0.8 million for the year ended December 31, 2010, as compared to the year ended December 31, 2009. The Corporation acquired Integrity Pharmacy Services on December 31, 2009, therefore, the year ended December 31, 2010 included a full year of depreciation expense for assets acquired as a result of this acquisition. In addition, the Corporation also recognized additional depreciation expense for the year ended December 31, 2010 due to the acquisition of Chem Rx on November 4, 2010. The Lone Star acquisition closed on December 31, 2010 and accordingly, no depreciation from this acquisition is included in the results of operations for the year ended December 31, 2010.
Depreciation expense decreased for the year ended December 31, 2009, compared to the year ended December 31, 2008, due primarily to assets acquired as a result of the Pharmacy Transaction nearing the end of their weighted average useful life and the consolidation of pharmacy locations. Capital expenditures declined in 2009 compared to the same period in 2008 primarily as a result of the completion of substantially all consolidations in 2008.
58
Table of Contents
Index to Financial Statements
Amortization expense related to certain identifiable intangibles for the periods presented is as follows (dollars in millions):
| Years Ended December 31, | ||||||||||||||||||||||||
| 2008 | 2009 | 2010 | ||||||||||||||||||||||
| Amount | % of Revenues |
Amount | % of Revenues |
Amount | % of Revenues |
|||||||||||||||||||
| Amortization of intangibles: |
||||||||||||||||||||||||
| Trade names |
$ | 1.3 | 0.1 | % | $ | 1.4 | 0.1 | % | $ | 1.5 | 0.1 | % | ||||||||||||
| Non-compete agreements |
0.4 | NM | 1.1 | NM | 1.8 | 0.1 | ||||||||||||||||||
| Customer relationships |
4.8 | 0.2 | 6.5 | 0.4 | 6.0 | 0.3 | ||||||||||||||||||
| Total amortization expense |
$ | 6.5 | 0.3 | % | $ | 9.0 | 0.5 | % | $ | 9.3 | 0.5 | % | ||||||||||||
Amortization expense for the year ended December 31, 2010 increased $0.3 million, compared to the year ended December 31, 2009. The Corporation acquired Integrity Pharmacy Services on December 31, 2009, therefore, the year ended December 31, 2010 included a full year of amortization expense for assets acquired as a result of this acquisition. In addition, the Corporation also recognized additional amortization expense for the year ended December 31, 2010 due to the acquisition of Chem Rx on November 4, 2010. The Lone Star acquisition closed on December 31, 2010 and accordingly, no amortization from this acquisition is included in the results of operations for the year ended December 31, 2010.
Total amortization expense of $9.3 million was reduced in the period due to certain customer relationships being fully amortized in the period that related to acquisitions that occurred prior to the Pharmacy Transaction.
Amortization expense for the year ended December 31, 2009, compared to the year ended December 31, 2008, increased due primarily to additional amortization associated with intangibles capitalized as a result of acquisitions in the respective periods.
Impairment of intangible assets
During the fourth quarter 2008, the Corporation recorded a pre-tax impairment charge of $14.8 million related to finite lived customer relationships. The impairment, which related to the Institutional Pharmacy segment, was incurred when the reporting unit experienced a higher than expected loss of licensed beds. The impairment was related to assets acquired in acquisitions by KPS during the years ended December 31, 2005 and 2006. Using a discounted cash flow analysis, the Corporation determined that a pre-tax impairment charge of $14.8 million was required to write the carrying value down to the fair value, resulting in a loss per diluted share impact of $0.30.
59
Table of Contents
Index to Financial Statements
Integration, Merger, and Acquisition Related Costs and Other Charges (Dollars in millions)
| Years Ended December 31, | ||||||||||||
| 2008 | 2009 | 2010 | ||||||||||
| Integration costs and other charges: |
||||||||||||
| Pre-Pharmacy litigation matters |
$ | — | $ | — | $ | 5.0 | ||||||
| Professional and advisory fees |
1.7 | 0.2 | 2.3 | |||||||||
| General and administrative |
3.2 | 0.8 | 0.7 | |||||||||
| Employee costs |
7.2 | 1.5 | 0.5 | |||||||||
| Severance costs |
5.3 | 0.9 | 0.6 | |||||||||
| Facility costs |
9.3 | 0.8 | 0.3 | |||||||||
| 26.7 | 4.2 | 9.4 | ||||||||||
| Acquisition related costs: |
||||||||||||
| Professional and advisory fees |
— | 1.0 | 3.5 | |||||||||
| General and administrative |
— | — | 1.5 | |||||||||
| Employee costs |
— | — | 0.4 | |||||||||
| Facility costs |
— | — | 1.3 | |||||||||
| Contingent consideration |
— | — | (1.7 | ) | ||||||||
| Other costs |
— | — | 0.2 | |||||||||
| — | 1.0 | 5.2 | ||||||||||
| Total integration, merger and acquisition related costs and other charges |
$ | 26.7 | $ | 5.2 | $ | 14.6 | ||||||
| Negative effect on earnings per diluted share |
$ | (0.53 | ) | $ | (0.10 | ) | $ | (0.29 | ) | |||
The Corporation incurred integration, merger and acquisition related costs and other charges during the years ended December 31, 2009 and 2010 related to costs to convert data, integrate systems and its acquisitions. The Corporation expects to continue to incur costs related to the integration of its pharmacy operating systems during fiscal 2011. During the second quarter of 2010 the Corporation recorded an estimated liability of $5.0 million related to certain legal claims arising from time periods prior to the 2007 Pharmacy Transaction. The Corporation believes the estimated liability is still appropriate as of December 31, 2010.
For the year ended December 31, 2010, the Corporation incurred costs of $5.2 million compared to $1.0 million for acquisition related costs for the year ended December 31, 2009. Acquisition related costs were higher in the current period due to costs incurred related to the Integrity Pharmacy Services acquisition and integration along with costs incurred related to the acquisitions of Chem Rx and Lone Star. Acquisition related costs were reduced in the period by $1.7 million due to the Corporation concluding it is not probable the amount related to the previously recognized contingent consideration will be paid under the terms of the agreement.
Integration, merger, and acquisition related costs and other charges decreased for the year ended December 31, 2009, compared to the year ended December 31, 2008. The decrease was due to the completion of the majority of the planned pharmacy consolidations during 2008. The costs incurred for the year ended December 31, 2009 were primarily related to the planned integration of our pharmacy operating systems. Acquisition costs increased $1.0 million as a result of the acquisitions during the third and fourth quarters of 2009. Effective January 1, 2009, the accounting standards for the accounting of business combinations changed. Prior to the adoption of this accounting change, substantially all costs incurred as a result of an acquisition were capitalized as part of the purchase price of the business combination. The new rules require such costs to be expensed and recorded as a component of the income statements. Acquisition related costs will continue to be material as the Corporation consummates future acquisitions.
60
Table of Contents
Index to Financial Statements
Interest Expense (Dollars in millions)
| Years Ended December 31, | ||||||||||||
| 2008 | 2009 | 2010 | ||||||||||
| Interest expense: |
||||||||||||
| Term Debt |
$ | 14.2 | $ | 8.7 | $ | 2.8 | ||||||
| Revolving Credit Facility |
0.3 | 0.4 | 0.4 | |||||||||
| Subtotal (including commitment fees and letters of credit fees) |
14.5 | 9.1 | 3.2 | |||||||||
| Other: |
||||||||||||
| Interest income |
(0.7 | ) | (0.2 | ) | (0.2 | ) | ||||||
| Amortization of deferred financing fees |
0.4 | 0.5 | 0.6 | |||||||||
| Total interest expense, net |
$ | 14.2 | $ | 9.4 | $ | 3.6 | ||||||
| Interest rate (excluding applicable margin): |
||||||||||||
| Average interest rate on variable term debt |
3.05 | % | 0.65 | % | 0.28 | % | ||||||
| LIBOR—1month, at beginning of period |
4.60 | 0.44 | 0.23 | |||||||||
| LIBOR—1month, at end of period |
0.44 | 0.23 | 0.26 | |||||||||
| LIBOR—3 months, at beginning of period |
4.70 | 1.43 | 0.25 | |||||||||
| LIBOR—3 months, at end of period |
1.43 | 0.25 | 0.30 | |||||||||
The decrease in interest expense during the year ended December 31, 2010, as compared to the year ended December 31, 2009, was due to the lower LIBOR and the expiration of the interest rate swap on July 31, 2009. The margin over LIBOR was 0.75%—1.00% during the year ended December 31, 2010. Total long-term debt outstanding, including capital lease obligations, as of December 31, 2009 and 2010, was $241.5 million and $246.6 million, respectively.
The decrease in interest expense during the year ended December 31, 2009, as compared to the year ended December 31, 2008, was due to lower LIBOR and the expiration of the interest rate swap on July 31, 2009. The margin over LIBOR was between 0.75% and 1.00% during the year ended December 31, 2009. Total long-term debt outstanding, including capital lease obligations, as of December 31, 2008 and 2009, was $240.0 million and $241.5 million, respectively. Due to the expiration of the interest rate swap on July 31, 2009, the Corporation’s $240.0 million term debt is now subject to variable interest rates. The margin over LIBOR was 1.0% at December 31, 2009.
Tax Provision (Dollars in millions)
| Years Ended December 31, | ||||||||||||
| 2008 | 2009 | 2010 | ||||||||||
| Tax provision |
$ | 3.3 | $ | 18.9 | $ | 13.0 | ||||||
| Total provision as a percentage of income |
39.7 | % | 30.9 | % | 40.2 | % | ||||||
The effective tax rate for the year ended December 31, 2010 was 40.2%, which was comprised of the 35.0% federal rate, 4.7% for the state rate and 0.5% for the permanent differences and other discrete items. Our effective tax rate for the year ended December 31, 2009 was 30.9%, which was comprised of the 35.0% federal rate, 4.5% for the state rate, and a net benefit of 8.6% on the valuation allowance releases, permanent rate differences and other discrete items.
The effective tax rate for the year ended December 31, 2008, was 39.7% comprised of the 35.0% federal rate and 4.7% for the state and permanent rate differences.
61
Table of Contents
Index to Financial Statements
Liquidity and Capital Resources
The primary source of liquidity for the Corporation is cash flows from operations and the availability under the Credit Agreement. Based upon our existing cash levels, expected operating cash flows, capital spending, potential future acquisitions, and the availability of funds under our revolving credit facility, we believe that we have the necessary financial resources to satisfy our expected short-term and long-term liquidity needs. The Corporation is currently working to renegotiate its Credit Agreement in 2011.
Cash Flows. The following table presents selected data from our consolidated statements of cash flows (dollars in millions):
| Years Ended December 31, | ||||||||||||
| 2008 | 2009 | 2010 | ||||||||||
| Net cash provided by operating activities |
$ | 65.7 | $ | 85.0 | $ | 98.2 | ||||||
| Net cash used in investing activities |
(47.4 | ) | (76.1 | ) | (133.2 | ) | ||||||
| Net cash (used in) provided by financing activities |
(9.0 | ) | 1.0 | (5.4 | ) | |||||||
| Net increase (decrease) in cash and cash equivalents |
9.3 | 9.9 | (40.4 | ) | ||||||||
| Cash and cash equivalents at beginning of period |
32.0 | 41.3 | 51.2 | |||||||||
| Cash and cash equivalents at end of period |
$ | 41.3 | $ | 51.2 | $ | 10.8 | ||||||
Operating Activities—Cash provided by operations aggregated $98.2 million for the year ended December 31, 2010, compared to $85.0 million for the year ended December 31, 2009. The increase is due to the Chem Rx acquisition and the improvement in cash collections from the Part D payers due to the requirements of MIPPA. As a result of the MIPPA requirements, the Corporation collected a larger amount of receivables in the first quarter of 2010 than normal. The Corporation does not expect MIPPA to have an incremental benefit in future periods.
Cash provided by operations aggregated $85.0 million for the year ended December 31, 2009, compared to $65.7 million for the year ended December 31, 2008. Operating cash flows for the year ended December 31, 2009 were positively impacted by an improvement in the results of operations following the fiscal 2008 pharmacy consolidations.
Investing Activities—Cash used in investing activities aggregated $133.2 million for the year ended December 31, 2010, compared to $76.1 million for the year ended December 31, 2009. The increase in cash used in investing activities is due primarily to $70.6 million paid for Chem Rx and approximately $50.0 million paid for Lone Star compared to the $54.7 million used for 2009 acquisitions.
Cash used in investing activities aggregated $76.1 million for the year ended December 31, 2009, compared to $47.4 million for the year ended December 31, 2008. The year ended December 31, 2009 had a higher amount of cash used in investing activities due to the acquisitions in 2009 of $54.7 million.
Financing Activities—Cash used in financing activities aggregated $5.4 million for the year ended December 31, 2010, as compared to cash provided by financing activities of $1.0 million for the year ended December 31, 2009. The decrease of $6.4 million is due to the common stock purchased by the Corporation of $10.6 million along with a revolving credit facility payment of $7.6 million for the year ended December 31, 2010. These uses of cash were partially offset by a borrowing on the revolving credit facility of $13.2 million.
Cash provided by financing activities aggregated $1.0 million for the year ended December 31, 2009 due to cash proceeds received from the exercise of stock options in the period. Cash flows used in financing activities for the year ended December 31, 2008, were due to the Corporation’s decision to make a $10.0 million early payment on long-term debt. Management did not make an early payment on long-term debt during the year ended December 31, 2009.
62
Table of Contents
Index to Financial Statements
Credit Agreement
The Corporation is a party to a Credit Agreement among the Corporation, the Lenders named therein, and JPMorgan Chase Bank, N.A. (“JPMorgan”), as Administrative Agent. The Credit Agreement consists of a $275.0 million term loan facility and a $150.0 million revolving credit facility. Indebtedness under the Credit Agreement matures on July 31, 2012. There is no scheduled amortization under the term loan facility but the term loan is subject to certain prepayment obligations relating to certain asset sales, certain casualty losses and the incurrence by the Corporation of certain indebtedness.
Borrowings under the Credit Agreement bear interest at a floating rate equal to, at our option, a base rate plus a margin between 0.0% and 0.75% per annum, or an adjusted London Interbank Offered Rate (“LIBO rate” or “LIBOR”) plus a margin between 0.625% and 1.75% per annum, in each case depending on the leverage ratio of the Corporation. The base rate is the higher of the prime lending rate announced by JPMorgan in New York from time to time and the federal funds rate published by the Federal Reserve Bank of New York plus 0.50%. The Credit Agreement also provides for letter of credit participation fees between 0.625% and 1.75% letter of credit fronting fees of 0.125%, and a commitment fee payable on the unused portion of the revolving credit facility, which shall accrue at a rate per annum ranging from 0.125% to 0.250%, in each case depending on the leverage ratio of the Corporation. As of December 31, 2010, the term debt borrowings under the Credit Agreement bore interest at a rate of 1.27%, including the applicable margin of 1.00% per annum based upon the one month LIBO rate. As of December 31, 2010, the revolver borrowings under the Credit Agreement bore interest at a rate of 3.25% per annum based upon the Federal Prime Rate.
The obligations of the Corporation under and related to the Credit Agreement are secured by substantially all of its assets. Those obligations are guaranteed by many of the Corporation’s wholly owned subsidiaries and the obligations of the guarantors are secured by substantially all of their assets. The foregoing includes a pledge of all of the equity interests of substantially all of our direct and indirect domestic subsidiaries and a portion of the equity interests of any future foreign subsidiaries. The Credit Agreement also contains financial and non-financial affirmative and negative covenants, representations, warranties, and events of default that are customary to facilities of this nature.
The Corporation had a total of $240.0 million outstanding of term debt under the Credit Agreement and $5.6 million outstanding under the revolving portion of the Credit Agreement as of December 31, 2010. The Credit Agreement provides for the issuance of letters of credit which, when issued, constitute usage and reduce availability on the revolving portion of the Credit Agreement. The amount of letters of credit outstanding as of December 31, 2010 was $3.5 million. After giving effect to the letters of credit and amounts outstanding under the revolving credit agreement, total availability under the revolving credit facility was $140.9 million as of December 31, 2010.
Covenants
The Credit Agreement requires the Corporation to satisfy a fixed charge coverage ratio and a leverage ratio. The minimum fixed charge coverage ratio, which is tested quarterly on a trailing four quarter basis, can be no less than: 2.50:1.00 beginning with January 1, 2010 and thereafter. The maximum leverage ratio, which also is tested quarterly, cannot exceed 3.00:1.00 beginning with January 1, 2010 and thereafter. The maximum leverage ratio is not tested when at any time it is less than 2.00:1.00, or both S&P and Moody’s have in effect corporate credit ratings for the Corporation that are investment grade. Pursuant to the terms of the Credit Agreement, the covenant requirements have become more restrictive, however, the Corporation remains compliant and has been compliant since the consummation of the Pharmacy Transaction. In addition, capital expenditures (other than those funded with proceeds of asset sales or insurance) are restricted in any fiscal year to 3.0% of revenues.
63
Table of Contents
Index to Financial Statements
The financial covenant ratio and requirements are as follows:
| Minimum Fixed Charge Coverage Ratio |
Maximum Leverage Ratio |
Capital Expenditure |
||||||||||
| Requirement |
>=2.00 to 1.00 | <=4.50 to 1.00 | <=3.00 | % | ||||||||
| December 31, 2008 |
3.67 | 1.99 | 1.13 | % | ||||||||
| Requirement |
>=2.25 to 1.00 | <=3.50 to 1.00 | <=3.00 | % | ||||||||
| December 31, 2009 |
5.09 | 1.88 | 1.17 | % | ||||||||
| Requirement |
>=2.50 to 1.00 | <=3.00 to 1.00 | <=3.00 | % | ||||||||
| December 31, 2010 |
5.94 | 2.20 | 0.68 | % | ||||||||
In addition, the Credit Agreement contains customary affirmative and negative covenants, which among other things, limit the Corporation’s ability to incur additional debt, create liens, pay dividends, effect transactions with the Corporation’s affiliates, sell assets, pay subordinated debt, merge, consolidate, enter into acquisitions, and effect sale leaseback transactions.
Prime Vendor Agreement
At the consummation of the Pharmacy Transaction, the Corporation entered into a prime vendor agreement with AmerisourceBergen Drug Corporation (“ABDC”), a wholly owned subsidiary of AmerisourceBergen. On January 4, 2011, the prime vendor agreement was amended and restated (“Prime Vendor Agreement”). The Prime Vendor Agreement became effective on January 1, 2011, superseded in its entirety the prior agreement and expires September 30, 2013. Under the Prime Vendor Agreement, the Corporation to will purchase a certain percentage of the Corporation’s prescription pharmaceutical drugs from ABDC and will participate in ABDC’s generic formulary purchase program.
As of December 31, 2010, the Corporation was in compliance with the terms of the Prime Vendor Agreement.
Information Technology Services Agreement
At the consummation of the Pharmacy Transaction, the Corporation entered into an Information Technology Services Agreement with Kindred Healthcare Operating, Inc. (“KHOI”), a wholly owned subsidiary of Kindred. Pursuant to this IT Services Agreement, KHOI is the Corporation’s exclusive provider of certain information services and support related to information technology infrastructure and financial systems for a period of five years. The services provided by KHOI includes business services necessary to operate, manage and support certain financial applications the Corporation uses, including enabling and/or supporting technology infrastructure and technology procurement services to support certain business functions. Such services include, among other matters, functions for financial management and systems and payroll. The Corporation internally supports all other operating systems, including functions for order entry, pharmacy dispensing, clinical consulting, billing and collections, electronic medication management, sales and marketing, medical records management, human resources, internal and external customer call center support and general business systems.
Except for certain services that will be provided at cost, KHOI will provide such services to the Corporation at its cost plus 10%, which will be the actual costs and expenses incurred in providing these services, including certain overhead costs and per hour costs of the KHOI employees providing the services. The IT Services Agreement shall automatically renew for successive one-year periods after the expiration of the initial five year term, absent 120 days prior notice of termination as provided for in the agreement. The initial term expires on July 31, 2012. The IT Services Agreement may be terminated by either party for cause and, in certain circumstances, by the Corporation in the event that KHOI undergoes a change of control to one of the
64
Table of Contents
Index to Financial Statements
Corporation’s competitors. Following termination, KHOI must provide termination and expiration assistance for up to 180 days. The Corporation incurred $17.3 million, $11.5 million, and $11.1 million to Kindred under the terms of the IT Services Agreement for the years ended December 31, 2008, 2009, and 2010, respectively.
Treasury Stock
In August 2010, the Board of Directors authorized a share repurchase of up to $25.0 million of the Corporation’s common stock. Share repurchases under this authorization may be made in the open market through unsolicited or solicited privately negotiated transactions, or in such other appropriate manner, and will be funded from available cash. The amount and timing of the repurchases will be determined by the Corporation’s management and will depend on a variety of factors including price, corporate and regulatory requirements, capital availability and other market conditions. Common stock acquired through the share repurchase program will be held as treasury shares and may be used for general corporate purposes, including reissuances in connection with acquisitions, employee stock option exercises or other employee stock plans. The share repurchase program does not have an expiration date and may be limited, terminated or extended at any time without prior notice. During the year ended December 31, 2010, we repurchased 1,327,803 million shares of common stock for an aggregate purchase price, including commissions, of $10.5 million, an average purchase price of $7.90 per share.
Additionally, the Corporation may redeem shares from employees upon vesting of the Corporation’s stock awards for minimum statutory tax withholding purposes. The Corporation redeemed 9,014 shares of certain vested awards for an aggregate price of less than $0.1 million during the year ended December 31, 2010. These shares have been designated by the Corporation as treasury stock.
Off-Balance Sheet Arrangements
We do not have any off-balance sheet arrangements, other than purchase commitments and lease obligations. See “Contractual Obligations” below.
Contractual Obligations
The Corporation is obligated to make future payments under various contracts such as long-term purchase obligations, debt agreements, and lease agreements, and has certain commitments. The Corporation has grouped these contractual obligations and off-balance sheet arrangements into operating activities, financing activities, and investing activities in the same manner as they are classified in the Consolidated Statements of Cash Flows in order to provide a better understanding of the nature of the obligations and arrangements and to provide a basis for comparison to historical information.
The table below provides a summary of contractual obligations and off-balance sheet arrangements as of December 31, 2010 (dollars in millions):
| 2011 | 2012 | 2013 | 2014 | 2015 | Thereafter | |||||||||||||||||||
| Operating activities: |
||||||||||||||||||||||||
| Prime Vendor Agreement (1) |
$ | — | $ | — | $ | — | $ | — | $ | — | $ | — | ||||||||||||
| Non-cancelable operating leases |
13.9 | 10.4 | 8.4 | 5.7 | 4.1 | 17.8 | ||||||||||||||||||
| Technology services agreement |
11.1 | 6.5 | — | — | — | — | ||||||||||||||||||
| Financing activities: |
||||||||||||||||||||||||
| Total debt and estimated interest (2) |
3.1 | 247.4 | — | — | — | — | ||||||||||||||||||
| Totals |
$ | 28.1 | $ | 264.3 | $ | 8.4 | $ | 5.7 | $ | 4.1 | $ | 17.8 | ||||||||||||
| (1) | Under the Prime Vendor Agreement the Corporation is required to purchase a certain percentage of its drug purchases through AmerisourceBergen through September 30, 2013. |
| (2) | At December 31, 2010, the Corporation had $5.6 million outstanding on the revolving credit facility and is included in the 2012 column as a long-term obligation. |
65
Table of Contents
Index to Financial Statements
Supplemental Quarterly Information
The following tables represent the results of the Corporation’s quarterly operations for the years ended December 31, 2009 and 2010 (in millions, except where indicated):
| 2009 Quarters | 2010 Quarters | |||||||||||||||||||||||||||||||
| First | Second | Third | Fourth | First | Second | Third | Fourth | |||||||||||||||||||||||||
| Net revenues: |
||||||||||||||||||||||||||||||||
| Institutional pharmacy revenues |
$ | 453.4 | $ | 446.5 | $ | 447.1 | $ | 437.7 | $ | 448.3 | $ | 435.9 | $ | 427.7 | $ | 477.5 | ||||||||||||||||
| Hospital management revenues |
14.8 | 14.1 | 13.9 | 13.7 | 13.9 | 14.6 | 15.4 | 14.0 | ||||||||||||||||||||||||
| Total revenues |
468.2 | 460.6 | 461.0 | 451.4 | 462.2 | 450.5 | 443.1 | 491.5 | ||||||||||||||||||||||||
| Cost of goods sold: |
||||||||||||||||||||||||||||||||
| Institutional pharmacy |
384.0 | 379.1 | 381.7 | 372.9 | 386.8 | 380.1 | 372.8 | 416.9 | ||||||||||||||||||||||||
| Hospital management |
12.0 | 11.9 | 12.2 | 11.9 | 12.1 | 12.8 | 13.5 | 12.0 | ||||||||||||||||||||||||
| Total cost of goods sold |
396.0 | 391.0 | 393.9 | 384.8 | 398.9 | 392.9 | 386.3 | 428.9 | ||||||||||||||||||||||||
| Gross profit: |
||||||||||||||||||||||||||||||||
| Institutional pharmacy |
69.4 | 67.4 | 65.4 | 64.8 | 61.5 | 55.8 | 54.9 | 60.6 | ||||||||||||||||||||||||
| Hospital management |
2.8 | 2.2 | 1.7 | 1.8 | 1.8 | 1.8 | 1.9 | 2.0 | ||||||||||||||||||||||||
| Total gross profit |
72.2 | 69.6 | 67.1 | 66.6 | 63.3 | 57.6 | 56.8 | 62.6 | ||||||||||||||||||||||||
| Selling, general and administrative |
51.7 | 48.0 | 45.0 | 46.1 | 44.8 | 43.0 | 43.3 | 49.5 | ||||||||||||||||||||||||
| Amortization expense |
1.8 | 1.9 | 2.5 | 2.8 | 2.3 | 2.4 | 2.2 | 2.4 | ||||||||||||||||||||||||
| Integration, merger and acquisition related costs and other charges |
2.0 | 0.6 | 0.9 | 1.7 | 1.2 | 9.2 | 2.4 | 1.8 | ||||||||||||||||||||||||
| Operating income |
16.7 | 19.1 | 18.7 | 16.0 | 15.0 | 3.0 | 8.9 | 8.9 | ||||||||||||||||||||||||
| Interest expense, net |
3.2 | 3.3 | 1.9 | 1.0 | 0.9 | 0.8 | 0.9 | 1.0 | ||||||||||||||||||||||||
| Income before income taxes |
13.5 | 15.8 | 16.8 | 15.0 | 14.1 | 2.2 | 8.0 | 7.9 | ||||||||||||||||||||||||
| Provision for income taxes |
5.3 | 6.6 | 2.2 | 4.8 | 5.7 | 0.9 | 3.2 | 3.2 | ||||||||||||||||||||||||
| Net income |
$ | 8.2 | $ | 9.2 | $ | 14.6 | $ | 10.2 | $ | 8.4 | $ | 1.3 | $ | 4.8 | $ | 4.7 | ||||||||||||||||
| Earnings per common share (1): |
||||||||||||||||||||||||||||||||
| Basic |
$ | 0.27 | $ | 0.30 | $ | 0.48 | $ | 0.34 | $ | 0.28 | $ | 0.04 | $ | 0.16 | $ | 0.16 | ||||||||||||||||
| Diluted |
$ | 0.27 | $ | 0.30 | $ | 0.48 | $ | 0.33 | $ | 0.27 | $ | 0.04 | $ | 0.16 | $ | 0.16 | ||||||||||||||||
| Adjusted earnings per diluted share (1)(2): |
$ | 0.31 | $ | 0.31 | $ | 0.35 | $ | 0.32 | $ | 0.29 | $ | 0.22 | $ | 0.21 | $ | 0.20 | ||||||||||||||||
| Shares used in computing earnings per common share: |
||||||||||||||||||||||||||||||||
| Basic |
30.2 | 30.2 | 30.3 | 30.3 | 30.4 | 30.4 | 30.0 | 29.2 | ||||||||||||||||||||||||
| Diluted |
30.3 | 30.4 | 30.5 | 30.5 | 30.6 | 30.6 | 30.1 | 29.3 | ||||||||||||||||||||||||
| Balance sheet data: |
||||||||||||||||||||||||||||||||
| Cash and cash equivalents |
$ | 52.1 | $ | 77.7 | $ | 73.8 | $ | 51.2 | $ | 73.5 | $ | 91.2 | $ | 96.7 | $ | 10.8 | ||||||||||||||||
| Working capital |
$ | 307.4 | $ | 324.2 | $ | 323.7 | $ | 312.8 | $ | 331.3 | $ | 344.6 | $ | 341.9 | $ | 270.2 | ||||||||||||||||
| Goodwill |
$ | 113.7 | $ | 115.6 | $ | 128.5 | $ | 140.1 | $ | 140.6 | $ | 140.4 | $ | 140.4 | $ | 193.9 | ||||||||||||||||
| Intangible assets, net |
$ | 71.6 | $ | 69.9 | $ | 72.3 | $ | 90.8 | $ | 88.8 | $ | 86.6 | $ | 84.8 | $ | 102.2 | ||||||||||||||||
| Total assets |
$ | 677.6 | $ | 684.2 | $ | 705.9 | $ | 724.3 | $ | 720.3 | $ | 731.2 | $ | 721.5 | $ | 759.9 | ||||||||||||||||
| Long-term debt |
$ | 240.0 | $ | 240.0 | $ | 240.0 | $ | 240.0 | $ | 240.0 | $ | 240.0 | $ | 240.0 | $ | 245.6 | ||||||||||||||||
| Total stockholder’s equity |
$ | 330.0 | $ | 341.9 | $ | 359.2 | $ | 370.9 | $ | 380.2 | $ | 383.4 | $ | 378.2 | $ | 384.4 | ||||||||||||||||
| Supplemental information: |
||||||||||||||||||||||||||||||||
| Adjusted EBITDA (2) |
$ | 25.2 | $ | 25.8 | $ | 26.6 | $ | 25.1 | $ | 23.1 | $ | 19.3 | $ | 18.3 | $ | 17.8 | ||||||||||||||||
| Adjusted EBITDA Margin (2) |
5.4 | % | 5.6 | % | 5.6 | % | 5.6 | % | 5.0 | % | 4.3 | % | 4.1 | % | 3.6 | % | ||||||||||||||||
| Adjusted EBITDA per prescription dispensed |
$ | 2.54 | $ | 2.63 | $ | 2.74 | $ | 2.62 | $ | 2.39 | $ | 2.07 | $ | 2.04 | $ | 1.80 | ||||||||||||||||
| Net cash provided by operating activities |
$ | 13.9 | $ | 28.8 | $ | 16.9 | $ | 25.4 | $ | 24.7 | $ | 20.6 | $ | 23.5 | $ | 29.4 | ||||||||||||||||
| Net cash used in investing activities |
$ | (3.2 | ) | $ | (3.2 | ) | $ | (21.7 | ) | $ | (48.0 | ) | $ | (2.3 | ) | $ | (2.9 | ) | $ | (7.2 | ) | $ | (120.8 | ) | ||||||||
| Net cash provided by (used in) financing activities |
$ | 0.1 | $ | — | $ | 0.9 | $ | — | $ | (0.1 | ) | $ | — | $ | (10.8 | ) | $ | 5.5 | ||||||||||||||
| Statistical information (in whole numbers except where indicated) |
||||||||||||||||||||||||||||||||
| Institutional Pharmacy |
||||||||||||||||||||||||||||||||
| Volume information |
||||||||||||||||||||||||||||||||
| Prescriptions dispensed (in thousands) |
9,919 | 9,815 | 9,713 | 9,590 | 9,664 | 9,316 | 8,949 | 9,897 | ||||||||||||||||||||||||
| Revenue per prescription dispensed |
$ | 45.71 | $ | 45.49 | $ | 46.03 | $ | 45.64 | $ | 46.39 | $ | 46.79 | $ | 47.79 | $ | 48.25 | ||||||||||||||||
| Gross profit per prescription dispensed |
$ | 7.00 | $ | 6.87 | $ | 6.73 | $ | 6.76 | $ | 6.36 | $ | 5.99 | $ | 6.13 | $ | 6.12 | ||||||||||||||||
| Gross profit percentage |
15.3 | % | 15.1 | % | 14.6 | % | 14.8 | % | 13.7 | % | 12.8 | % | 12.8 | % | 12.7 | % | ||||||||||||||||
| Generic drug dispensing rate |
73.5 | % | 74.2 | % | 74.5 | % | 74.7 | % | 74.5 | % | 75.7 | % | 75.9 | % | 75.8 | % | ||||||||||||||||
| Customer licensed beds under contract |
||||||||||||||||||||||||||||||||
| Beginning of period |
321,068 | 318,761 | 314,698 | 314,324 | 313,873 | 307,874 | 299,527 | 290,691 | ||||||||||||||||||||||||
| Additions |
6,762 | 6,473 | 10,549 | 12,137 | 4,111 | 2,586 | 4,867 | 84,385 | ||||||||||||||||||||||||
| Losses |
(9,069 | ) | (10,536 | ) | (10,923 | ) | (12,588 | ) | (10,110 | ) | (10,933 | ) | (13,703 | ) | (11,232 | ) | ||||||||||||||||
| End of period |
318,761 | 314,698 | 314,324 | 313,873 | 307,874 | 299,527 | 290,691 | 363,844 | ||||||||||||||||||||||||
| Hospital management contracts serviced |
84 | 85 | 85 | 86 | 86 | 89 | 89 | 90 | ||||||||||||||||||||||||
| (1) | The Corporation has never declared a cash dividend. Earnings per common share in actual cents. |
| (2) | See “Use of Non-GAAP Measures For Measuring Quarterly Results” for a definition and reconciliation. |
66
Table of Contents
Index to Financial Statements
Use of Non-GAAP Measures For Measuring Quarterly Results
The Corporation calculates Adjusted EBITDA as provided in the reconciliation below and calculates Adjusted EBITDA Margin by taking Adjusted EBITDA and dividing it by revenues. The Corporation calculates and uses Adjusted EBITDA as an indicator of its ability to generate cash from reported operating results. The measurement is used in concert with net income and cash flows from operating activities, which measure actual cash generated in the period. In addition, the Corporation believes that Adjusted EBITDA and Adjusted EBITDA Margin are supplemental measurement tools used by analysts and investors to help evaluate overall operating performance and the ability to incur and service debt and make capital expenditures. In addition, Adjusted EBITDA, as defined in the Credit Agreement, is used in conjunction with the Corporation’s debt leverage ratio and this calculation sets the applicable margin for the quarterly interest charge. Adjusted EBITDA, as defined in the Credit Agreement, is not the same calculation as this Adjusted EBITDA table. Adjusted EBITDA does not represent funds available for the Corporation’s discretionary use and is not intended to represent or to be used as a substitute for net income or cash flows from operating activities data as measured under U.S. generally accepted accounting principles (“GAAP”). The items excluded from Adjusted EBITDA but included in the calculation of the Corporation’s reported net income and cash flows from operating activities are significant components of the accompanying consolidated income statements and cash flows, and must be considered in performing a comprehensive assessment of overall financial performance. The Corporation’s calculation of Adjusted EBITDA may not be consistent with calculations of EBITDA used by other companies. The following is a reconciliation of the Corporation’s net income, net operating cash flows and earnings per diluted share for the periods presented.
Unaudited Reconciliation of Net Income to Adjusted EBITDA
| 2009 Quarters | 2010 Quarters | |||||||||||||||||||||||||||||||
| First | Second | Third | Fourth | First | Second | Third | Fourth | |||||||||||||||||||||||||
| Net income |
$ | 8.2 | $ | 9.2 | $ | 14.6 | $ | 10.2 | $ | 8.4 | $ | 1.3 | $ | 4.8 | $ | 4.7 | ||||||||||||||||
| Add: |
||||||||||||||||||||||||||||||||
| Interest expense, net |
3.2 | 3.3 | 1.9 | 1.0 | 0.9 | 0.8 | 0.9 | 1.0 | ||||||||||||||||||||||||
| Integration, merger, and acqusition related costs and other charges |
2.0 | 0.6 | 0.9 | 1.7 | 1.2 | 9.2 | 2.4 | 1.8 | ||||||||||||||||||||||||
| Provision for income taxes |
5.3 | 6.6 | 2.2 | 4.8 | 5.7 | 0.9 | 3.2 | 3.2 | ||||||||||||||||||||||||
| Depreciation and amortization expense |
6.5 | 6.1 | 7.0 | 7.4 | 6.9 | 7.1 | 7.0 | 7.1 | ||||||||||||||||||||||||
| Adjusted EBITDA |
$ | 25.2 | $ | 25.8 | $ | 26.6 | $ | 25.1 | $ | 23.1 | $ | 19.3 | $ | 18.3 | $ | 17.8 | ||||||||||||||||
| Adjusted EBITDA Margin |
5.4 | % | 5.6 | % | 5.6 | % | 5.6 | % | 5.0 | % | 4.3 | % | 4.1 | % | 3.6 | % | ||||||||||||||||
67
Table of Contents
Index to Financial Statements
Unaudited Reconciliation of Adjusted EBITDA to Net Operating Cash Flows
| 2009 Quarters | 2010 Quarters | |||||||||||||||||||||||||||||||
| First | Second | Third | Fourth | First | Second | Third | Fouth | |||||||||||||||||||||||||
| Adjusted EBITDA |
$ | 25.2 | $ | 25.8 | $ | 26.6 | $ | 25.1 | $ | 23.1 | $ | 19.3 | $ | 18.3 | $ | 17.8 | ||||||||||||||||
| Interest expense, net |
(3.2 | ) | (3.3 | ) | (1.9 | ) | (1.0 | ) | (0.9 | ) | (0.8 | ) | (0.9 | ) | (1.0 | ) | ||||||||||||||||
| Provision for income taxes |
(5.3 | ) | (6.6 | ) | (2.2 | ) | (4.8 | ) | (5.7 | ) | (0.9 | ) | (3.2 | ) | (3.2 | ) | ||||||||||||||||
| Integration, merger and acquisition related costs and other charges |
(1.8 | ) | (0.6 | ) | (0.9 | ) | (1.5 | ) | (1.1 | ) | (8.8 | ) | (2.3 | ) | (1.8 | ) | ||||||||||||||||
| Provision for bad debt |
7.1 | 3.6 | 2.5 | 3.4 | 3.8 | 4.6 | 4.5 | 5.6 | ||||||||||||||||||||||||
| Stock-based compensation |
0.6 | 1.3 | 1.3 | 1.4 | 0.8 | 1.7 | 0.8 | 1.5 | ||||||||||||||||||||||||
| Amortization of deferred financing fees |
0.1 | 0.1 | 0.1 | 0.1 | 0.2 | 0.1 | 0.1 | 0.2 | ||||||||||||||||||||||||
| Deferred income taxes |
4.8 | 6.8 | 2.7 | 5.4 | 4.8 | 0.9 | 3.4 | 3.2 | ||||||||||||||||||||||||
| Loss on disposition of equipment |
0.1 | — | — | 0.2 | — | 0.1 | 0.1 | 0.1 | ||||||||||||||||||||||||
| Other |
(0.1 | ) | — | (0.1 | ) | (0.1 | ) | 0.1 | (0.1 | ) | — | — | ||||||||||||||||||||
| Changes in assets and liabilities |
(13.6 | ) | 1.7 | (11.2 | ) | (2.8 | ) | (0.4 | ) | 4.5 | 2.7 | 7.0 | ||||||||||||||||||||
| Net Cash Flows from Operating Activities |
$ | 13.9 | $ | 28.8 | $ | 16.9 | $ | 25.4 | $ | 24.7 | $ | 20.6 | $ | 23.5 | $ | 29.4 | ||||||||||||||||
The Corporation calculates and uses earnings per diluted share, exclusive of the impact of integration, merger and acquisition related costs and other charges, and favorable impact on tax ruling as an indicator of its core operating results. The measurement is used in concert with net income and earnings per diluted share, which measure actual earnings per share generated in the period. The Corporation believes the exclusion of these charges in expressing earnings per share provides management with a useful measure to assess period to period comparability and is useful to investors in evaluating the Corporation’s operating results from period to period. Earnings per diluted share, exclusive of the integration, merger and acquisition related costs and other charges, and favorable impact on tax ruling does not represent the amount that effectively accrues directly to stockholders (i.e., such costs are a reduction in earnings and stockholders’ equity) and is not intended to represent or to be used as a substitute for earnings per diluted share as measured under GAAP. The impact of integration, merger and acquisition related costs and other charges, and favorable impact of tax rate matters excluded from the earnings per diluted share are significant components of the accompanying consolidated income statements, and must be considered in performing a comprehensive assessment of overall financial performance.
Unaudited Reconciliation of Earnings Per Diluted Share to Adjusted Earnings Per Diluted Share
| 2009 Quarters | 2010 Quarters | |||||||||||||||||||||||||||||||
| First | Second | Third | Fourth | First | Second | Third | Fourth | |||||||||||||||||||||||||
| Earnings per diluted share |
$ | 0.27 | $ | 0.30 | $ | 0.48 | $ | 0.33 | $ | 0.27 | $ | 0.04 | $ | 0.16 | $ | 0.16 | ||||||||||||||||
| Add: |
||||||||||||||||||||||||||||||||
| Diluted earnings per share impact of: |
||||||||||||||||||||||||||||||||
| Integration, merger, and acquisition related costs and other charges |
0.04 | 0.01 | 0.02 | 0.03 | 0.02 | 0.18 | 0.05 | 0.04 | ||||||||||||||||||||||||
| Tax rate matters |
— | — | (0.15 | ) | (0.04 | ) | — | — | ||||||||||||||||||||||||
| Adjusted earnings per diluted common share after impact of above items |
$ | 0.31 | $ | 0.31 | $ | 0.35 | $ | 0.32 | $ | 0.29 | $ | 0.22 | $ | 0.21 | $ | 0.20 | ||||||||||||||||
68
Table of Contents
Index to Financial Statements
Following Represent the Fourth Quarter 2010 Results compared to the Fourth Quarter 2009
Results of Operations
The following table presents selected consolidated comparative results of operations and statistical information (dollars in millions):
| Quarter Ended | ||||||||||||||||||||||||
| December 31, 2009 |
Increase (Decrease) |
December 31, 2010 |
||||||||||||||||||||||
| Amount | % of Revenues |
Amount | % of Revenues |
|||||||||||||||||||||
| Net revenues: |
||||||||||||||||||||||||
| Institutional Pharmacy |
$ | 437.7 | 97.0 | % | $ | 39.8 | 9.1 | % | $ | 477.5 | 97.2 | % | ||||||||||||
| Hospital Management |
13.7 | 3.0 | 0.3 | 2.2 | 14.0 | 2.8 | ||||||||||||||||||
| Total net revenues |
451.4 | 100.0 | 40.1 | 8.9 | 491.5 | 100.0 | ||||||||||||||||||
| Cost of goods sold: |
||||||||||||||||||||||||
| Institutional Pharmacy |
372.9 | 82.6 | 44.0 | 11.8 | 416.9 | 84.9 | ||||||||||||||||||
| Hospital Management |
11.9 | 2.6 | 0.1 | 0.8 | 12.0 | 2.4 | ||||||||||||||||||
| Total cost of goods sold |
384.8 | 85.2 | 44.1 | 11.5 | 428.9 | 87.3 | ||||||||||||||||||
| Gross profit: |
||||||||||||||||||||||||
| Institutional Pharmacy |
64.8 | 14.4 | (4.2 | ) | (6.5 | ) | 60.6 | 12.3 | ||||||||||||||||
| Hospital Management |
1.8 | 0.4 | 0.2 | 11.1 | 2.0 | 0.4 | ||||||||||||||||||
| Total gross profit |
$ | 66.6 | 14.8 | % | $ | (4.0 | ) | (6.0 | )% | $ | 62.6 | 12.7 | % | |||||||||||
| Institutional Pharmacy (in whole numbers except where indicated) |
||||||||||||||||||||||||
| Volume information |
||||||||||||||||||||||||
| Prescriptions dispensed (in thousands) |
9,590 | 307 | 3.2 | % | 9,897 | |||||||||||||||||||
| Revenue per prescription dispensed |
$ | 45.64 | $ | 2.61 | 5.7 | % | $ | 48.25 | ||||||||||||||||
| Gross profit per prescription dispensed |
$ | 6.76 | $ | (0.64 | ) | (9.5 | )% | $ | 6.12 | |||||||||||||||
| Institutional pharmacy gross margin |
14.8 | % | (2.1 | ) | (14.2 | )% | 12.7 | % | ||||||||||||||||
| Generic dispensing rate |
74.7 | % | 1.1 | 1.5 | % | 75.8 | % | |||||||||||||||||
| Customer licensed beds under contract |
||||||||||||||||||||||||
| Beginning of period |
314,324 | (23,633 | ) | (7.5 | )% | 290,691 | ||||||||||||||||||
| Additions |
12,137 | 72,248 | 595.3 | 84,385 | ||||||||||||||||||||
| Losses and other |
(12,588 | ) | 1,356 | (10.8 | ) | (11,232 | ) | |||||||||||||||||
| End of period |
313,873 | 49,971 | 15.9 | % | 363,844 | |||||||||||||||||||
| Hospital Management (in whole numbers except where indicated) |
||||||||||||||||||||||||
| Volume information |
||||||||||||||||||||||||
| Hospital management contracts serviced |
86 | 4.0 | 4.7 | % | 90 | |||||||||||||||||||
Revenues
Institutional pharmacy revenues increased $39.8 million for the three months ended December 31, 2010 compared to the three months ended December 31, 2009. The increase in revenues was due primarily to the acquisition of Chem Rx on November 4, 2010, which resulted in additional revenues of $59.1 million or 1,096,000 prescriptions dispensed, offset by a decline in the existing institutional pharmacy revenues of $19.3 million. The acquisition of Chem Rx had an impact of a positive rate increase on revenue per prescription dispensed of $0.71 in the quarter. The existing institutional pharmacy revenues decline of $19.3 million resulted from an unfavorable volume variance of approximately $36.0 million or 789,000 fewer prescriptions dispensed, partially offset by a favorable rate variance of approximately $16.7 million or $1.90 increase per prescription dispensed. The rate variance was comprised of approximately $28.7 million due to inflation on drugs dispensed between periods offset by $12.0 million due to the increase in the generic dispensing rate from 74.7% to 75.8%. The unfavorable volume variance of approximately $36.0 million was due to the decline in customer licensed beds under contract prior to the acquisition of Chem Rx and Lone Star. The Lone Star acquisition closed on
69
Table of Contents
Index to Financial Statements
December 31, 2010 and accordingly, no revenues from this acquisition are included in the results of operations for the quarter ended December 31, 2010.
The increase in hospital management revenues of $0.3 million for the three months ended December 31, 2010 compared to the three months ended December 31, 2009 was due to an increase of hospital management contracts serviced.
Cost of Goods Sold
Institutional pharmacy cost of goods sold increased $44.0 million for the three months ended December 31, 2010 compared to the three months ended December 31, 2009 primarily due to the acquisition of Chem Rx on November 4, 2010, offset by lower cost as a result of fewer prescriptions dispensed and other factors. The Chem Rx acquisition increased cost of goods sold approximately $52.6 million or 1,096,000 prescriptions dispensed. The decline of $8.6 million in the existing institutional pharmacy business is due to 789,000 fewer prescriptions dispensed. Excluding the Chem Rx acquisition overall total drug costs increased as a percent of revenues 72 bps, and other costs included in cost of goods sold increased as a percent of revenues 100 bps, of which the increase primarily related to higher delivery expenses as a result of the DEA’s new interpretation of the Controlled Substances Act regarding the ability of nurses in skilled nursing facilities to order controlled substances for the residents of these facilities. The Lone Star acquisition closed on December 31, 2010 and accordingly, no costs of goods sold from this acquisition are included in the results of operations for the quarter ended December 31, 2010.
Gross Profit and Operating Expenses
Gross profit and other operating expenses were the following for the periods presented (dollars in millions):
| Quarter Ended | ||||||||||||||||||||||||
| December 31, 2009 | Increase (Decrease) |
December 31, 2010 | ||||||||||||||||||||||
| Amount | % of Revenue |
Amount | % of Revenue |
|||||||||||||||||||||
| Gross profit and operating expenses: |
||||||||||||||||||||||||
| Total gross profit |
$ | 66.6 | 14.8 | % | $ | (4.0 | ) | (6.0 | )% | $ | 62.6 | 12.7 | % | |||||||||||
| Selling, general and administrative expenses |
46.1 | 10.3 | 3.4 | 7.4 | 49.5 | 10.1 | ||||||||||||||||||
| Amortization expense |
2.8 | 0.6 | (0.4 | ) | (14.3 | ) | 2.4 | 0.5 | ||||||||||||||||
| Integration, merger related costs and other charges |
1.7 | 0.4 | 0.1 | 5.9 | 1.8 | 0.3 | ||||||||||||||||||
| Interest expense, net |
1.0 | 0.2 | — | — | 1.0 | 0.2 | ||||||||||||||||||
| Income before provision for income taxes |
15.0 | 3.3 | (7.1 | ) | (47.3 | ) | 7.9 | 1.6 | ||||||||||||||||
| Provision for income taxes |
4.8 | 1.0 | (1.6 | ) | (33.3 | ) | 3.2 | 0.6 | ||||||||||||||||
| Net income |
$ | 10.2 | 2.3 | % | $ | (5.5 | ) | (53.9 | )% | $ | 4.7 | 1.0 | % | |||||||||||
Institutional gross profit for the three months ended December 31, 2010 was $60.6 million or $6.12 per prescription dispensed compared to $64.8 million or $6.76 per prescription dispensed for the three months ended December 31, 2009. The Chem Rx acquisition resulted in $6.5 million in gross profit, or $5.93 per prescription dispensed. The gross margin for the Chem Rx business during the quarter was approximately 11.0%, which is lower than the Corporation’s existing institutional pharmacy business primarily because of the nature of the customers they service and markets in which they operate. Institutional gross profit margin for the three months ended December 31, 2010 was 12.7% compared to 14.8% for the three months ended December 31, 2009. Gross profit was further impacted by a continuation of reimbursement pressure under the Medicare Part D and Medicaid programs, other pricing concessions and a decline in licensed beds under contract and higher delivery
expenses, offset by the gross profit recognized from the Chem Rx acquisition in the period. Delivery expense increased as a result of the DEA’s new interpretation of the Controlled Substances Act regarding the ability of nurses in skilled nursing facilities to order controlled substances for the residents of these facilities.
70
Table of Contents
Index to Financial Statements
The Lone Star acquisition closed on December 31, 2010 and accordingly, no gross profit from this acquisition is included in the results of operations for the quarter ended December 31, 2010.
Selling, General and Administrative Expenses (Dollars in millions)
| Quarter Ended | ||||||||||||||||||||||||
| December 31, 2009 |
Increase (Decrease) |
December 31, 2010 |
||||||||||||||||||||||
| Amount | % of Revenue |
Amount | % of Revenue |
|||||||||||||||||||||
| Selling, general and administrative expenses: |
||||||||||||||||||||||||
| Total wages, benefits and contract labor |
$ | 25.1 | 5.6 | % | $ | (0.4 | ) | (1.6 | )% | $ | 24.7 | 5.0 | % | |||||||||||
| Contracted services |
3.4 | 0.8 | 0.3 | 8.8 | 3.7 | 0.8 | ||||||||||||||||||
| Provision for doubtful accounts |
3.4 | 0.8 | 2.2 | 64.7 | 5.6 | 1.1 | ||||||||||||||||||
| Supplies |
1.9 | 0.4 | (0.1 | ) | (5.3 | ) | 1.8 | 0.4 | ||||||||||||||||
| Travel expenses |
1.2 | 0.3 | 0.1 | 8.3 | 1.3 | 0.3 | ||||||||||||||||||
| Professional fees |
2.0 | 0.4 | 0.6 | 30.0 | 2.6 | 0.5 | ||||||||||||||||||
| Stock-based compensation |
1.4 | 0.3 | 0.1 | 7.1 | 1.5 | 0.3 | ||||||||||||||||||
| Depreciation |
2.2 | 0.5 | 0.1 | 4.5 | 2.3 | 0.5 | ||||||||||||||||||
| Rent |
1.0 | 0.2 | — | — | 1.0 | 0.2 | ||||||||||||||||||
| Maintenance |
0.6 | 0.1 | 0.2 | 33.3 | 0.8 | 0.2 | ||||||||||||||||||
| Other costs |
3.9 | 0.9 | 0.3 | 7.7 | 4.2 | 0.8 | ||||||||||||||||||
| Total selling general and administrative expenses |
$ | 46.1 | 10.3 | % | $ | 3.4 | 7.4 | % | $ | 49.5 | 10.1 | % | ||||||||||||
Selling, general and administrative expenses, excluding the $4.8 million of Chem Rx expenses, decreased $1.4 million over the comparable period in the prior year. Total labor costs decreased $0.4 million for the three months ended December 31, 2010 over the comparable period in the prior year which included $2.5 million of additional labor costs related to the Chem Rx acquisition. The decrease of $2.9 million in labor costs excluding Chem Rx is mainly due to a reduction in employee performance based compensation of approximately $1.6 million. The provision for bad debt increased $2.2 million, of which $1.0 million related to Chem Rx. All other costs increased $1.6 million primarily due to the acquisition of Chem Rx. The Lone Star acquisition closed on December 31, 2010 and accordingly, no selling, general and administrative expense from this acquisition is included in the results of operations for the quarter ended December 31, 2010.
71
Table of Contents
Index to Financial Statements
Depreciation and Amortization (Dollars in millions)
| Quarter Ended | ||||||||||||||||
| December 31, 2009 |
December 31, 2010 |
|||||||||||||||
| Amount | % of Revenues |
Amount | % of Revenues |
|||||||||||||
| Leasehold improvements |
$ | 0.4 | 0.1 | % | $ | 0.4 | 0.1 | % | ||||||||
| Equipment and software |
4.0 | 0.9 | 4.1 | 0.9 | ||||||||||||
| Leased equipment |
0.2 | NM | 0.2 | NM | ||||||||||||
| Total depreciation expense |
$ | 4.6 | 1.0 | % | $ | 4.7 | 1.0 | % | ||||||||
| Depreciation expense recorded in cost of goods sold |
$ | 2.4 | 0.5 | % | $ | 2.4 | 0.5 | % | ||||||||
| Depreciation expense recorded in selling, general & administrative expenses |
2.2 | 0.5 | 2.3 | 0.5 | ||||||||||||
| Total depreciation expense |
$ | 4.6 | 1.0 | % | $ | 4.7 | 1.0 | % | ||||||||
| Total capital expenditures |
$ | 9.3 | 2.1 | % | $ | 3.8 | 0.8 | % | ||||||||
Depreciation expense increased $0.1 million for the three months ended December 31, 2010 compared to the three months ended December 31, 2009, due primarily to the assets acquired as a result of the Chem Rx acquisition on November 4, 2010. The Lone Star acquisition closed on December 31, 2010 and accordingly, no depreciation expense from this acquisition is included in the results of operations for the quarter ended December 31, 2010.
| Quarter Ended | ||||||||||||||||
| December 31, 2009 |
December 31, 2010 |
|||||||||||||||
| Amount | % of Revenues |
Amount | % of Revenues |
|||||||||||||
| Amortization of intangibles: |
||||||||||||||||
| Trade names |
$ | 0.3 | 0.1 | % | $ | 0.4 | 0.1 | % | ||||||||
| Non-compete agreements |
0.6 | 0.1 | 0.4 | 0.1 | ||||||||||||
| Customer relationships |
1.9 | 0.4 | 1.6 | 0.3 | ||||||||||||
| Total amortization expense |
$ | 2.8 | 0.6 | % | $ | 2.4 | 0.5 | % | ||||||||
Amortization expense decreased $0.4 million for the three months ended December 31, 2010 compared to the three months ended December 31, 2009. The Chem Rx acquisition accounted for a $0.1 increase in amortization expense. The remaining $0.5 million decrease was due to certain customer relationships becoming fully amortized prior to the fourth quarter that related to acquisitions that occurred prior to the Pharmacy Transaction. The Lone Star acquisition closed on December 31, 2010 and accordingly, no amortization expense from this acquisition is included in the results of operations for the quarter ended December 31, 2010.
72
Table of Contents
Index to Financial Statements
Integration, Merger and Acquisition Related Costs and Other Charges (Dollars in millions)
| Quarter Ended | ||||||||
| December 31, 2009 |
December 31, 2010 |
|||||||
| Integration costs and other charges: |
||||||||
| Professional and advisory fees |
$ | 0.2 | $ | 0.1 | ||||
| General and administrative |
0.4 | 0.2 | ||||||
| Employee costs |
0.3 | 0.1 | ||||||
| Severance costs |
0.3 | — | ||||||
| Facility costs |
0.1 | 0.2 | ||||||
| Other costs |
— | (0.1 | ) | |||||
| 1.3 | 0.5 | |||||||
| Acquisition related costs: |
||||||||
| Professional and advisory fees |
0.4 | 2.4 | ||||||
| General and administrative |
— | 0.4 | ||||||
| Employee costs |
— | 0.2 | ||||||
| Contingent Consideration |
— | (1.7 | ) | |||||
| 0.4 | 1.3 | |||||||
| Total integration, merger related costs and other charges |
$ | 1.7 | $ | 1.8 | ||||
| Negative effect on earnings per diluted share |
$ | (0.03 | ) | $ | (0.04 | ) | ||
The Corporation incurred integration, merger and acquisition related costs and other charges during the three months ended December 31, 2009 and 2010 related to costs to convert data, integrate systems and its acquisitions. The Corporation expects to continue to incur costs related to the integration of its pharmacy operating systems during fiscal 2011.
For the three months ended December 31, 2010, the Corporation incurred acquisition related costs of $1.3 million as compared to $0.4 million in the previous period. Costs were higher in the current period due to the costs associated with the Chem Rx and Lone Star acquisitions for the three months ended December 31, 2010. Acquisition related costs were reduced in the period by $1.7 million due to the Corporation concluding it is not probable the amount related to the previously recognized contingent consideration will be paid under the terms of the agreement.
73
Table of Contents
Index to Financial Statements
Interest Expense (Dollars in millions)
| Quarter Ended | ||||||||
| December 31, 2009 |
December 31, 2010 |
|||||||
| Amount | Amount | |||||||
| Interest expense, net: |
||||||||
| Term Debt |
$ | 0.9 | $ | 0.7 | ||||
| Revolving credit facility |
— | 0.1 | ||||||
| Subtotal (including commitment fees and letters of credit fees) |
0.9 | 0.8 | ||||||
| Other: |
||||||||
| Interest expense (income) |
— | — | ||||||
| Amortization of deferred financing fees |
0.1 | 0.2 | ||||||
| Total interest expense, net |
$ | 1.0 | $ | 1.0 | ||||
| Interest rate (excluding applicable margin): |
||||||||
| Average interest rate on variable term debt |
0.25 | % | 0.26 | % | ||||
| LIBOR—1 month, at beginning of period |
0.24 | % | 0.26 | % | ||||
| LIBOR—1 month, at end of period |
0.23 | % | 0.26 | % | ||||
| LIBOR—3 months, at beginning of period |
0.28 | % | 0.29 | % | ||||
| LIBOR—3 months, at end of period |
0.25 | % | 0.30 | % | ||||
Interest expense remained unchanged for the comparable periods.
Tax Provision (Dollars in millions)
| Quarter Ended | ||||||||
| December 31, 2009 |
December 31, 2010 |
|||||||
| Tax provision |
$ | 4.8 | $ | 3.2 | ||||
| Total provision as a percentage of pre-tax income |
31.9 | % | 39.6 | % | ||||
Our effective tax rate for the three months ended December 31, 2010 was 39.6%, comprised of the 35.0% federal rate and 4.6 % for the state rate, permanent differences and other discrete items. Our effective tax rate for the three months ended December 31, 2009 was 31.9%, comprised of the 35.0% federal rate and a net benefit of 3.1% for the state rate, permanent differences and other discrete items.
The rate for the period ended December 31, 2009 was favorably impacted by a benefit of $1.2 million associated with various internal restructuring transactions implemented during the period. Exclusive of these transactions the effective rate for the period ended December 31, 2009 would have been 40.1%, comprised of the 35.0% federal rate and 5.1 % for the state rate and permanent items.
74
Table of Contents
Index to Financial Statements
Liquidity and Capital Resources
The following compares the Corporation’s Statement of Cash Flows for the quarters ended December 31, 2009 and 2010 (dollars in millions):
| Quarter Ended | ||||||||
| December 31, 2009 |
December 31, 2010 |
|||||||
| Cash flows provided by (used in) operating activities: |
||||||||
| Net income |
$ | 10.2 | $ | 4.7 | ||||
| Adjustments to reconcile net income to net cash provided by (used in) operating activities: |
||||||||
| Depreciation |
4.6 | 4.7 | ||||||
| Amortization |
2.8 | 2.4 | ||||||
| Integration, merger and acquisition related costs and other charges |
0.2 | — | ||||||
| Stock-based compensation |
1.4 | 1.5 | ||||||
| Amortization of deferred financing fees |
0.1 | 0.2 | ||||||
| Deferred income taxes |
5.4 | 3.2 | ||||||
| Loss on disposition of equipment |
0.2 | 0.1 | ||||||
| Other |
(0.1 | ) | — | |||||
| Change in operating assets and liabilities: |
||||||||
| Accounts receivable, net |
7.1 | 7.1 | ||||||
| Inventory |
(2.5 | ) | 3.6 | |||||
| Prepaids and other assets |
(4.2 | ) | (0.2 | ) | ||||
| Accounts payable |
1.8 | 10.8 | ||||||
| Salaries, wages and other compensation |
(4.8 | ) | (5.9 | ) | ||||
| Other accrued and long-term liabilities |
3.2 | (2.8 | ) | |||||
| Net cash provided by operating activities |
25.4 | 29.4 | ||||||
| Cash flows provided by (used in) investing activities: |
||||||||
| Purchase of equipment and leasehold improvements |
(9.3 | ) | (3.8 | ) | ||||
| Acquisitions, net of cash acquired |
(38.8 | ) | (117.1 | ) | ||||
| Cash proceeds from sale of assets |
— | 0.1 | ||||||
| Other |
0.1 | — | ||||||
| Net cash used in investing activities |
(48.0 | ) | (120.8 | ) | ||||
| Cash flows provided by (used in) financing activities: |
||||||||
| Proceeds from long-term revolving credit facility |
— | 13.2 | ||||||
| Repayments of long-term revolving credit facility |
— | (7.6 | ) | |||||
| Repayments of capital lease obligations |
(0.2 | ) | (0.2 | ) | ||||
| Issuance of common stock |
0.1 | — | ||||||
| Treasury stock at cost |
— | (0.1 | ) | |||||
| Tax benefit from stock-based compensation |
0.1 | 0.2 | ||||||
| Net cash provided by financing activities |
— | 5.5 | ||||||
| Change in cash and cash equivalents |
(22.6 | ) | (85.9 | ) | ||||
| Cash and cash equivalents at beginning of period |
73.8 | 96.7 | ||||||
| Cash and cash equivalents at end of period |
$ | 51.2 | $ | 10.8 | ||||
| Supplemental information: |
||||||||
| Cash paid for interest |
$ | 0.9 | $ | 0.9 | ||||
| Cash paid for taxes |
$ | — | $ | — | ||||
75
Table of Contents
Index to Financial Statements
Following Represents the Fourth Quarter 2010 Results compared to the Third Quarter 2010
Results of Operations
The following table presents selected consolidated comparative results of operations and statistical information (dollars in millions, except where indicated):
| Quarter Ended | ||||||||||||||||||||||||
| September 30, 2010 |
Increase (Decrease) |
December 31, 2010 |
||||||||||||||||||||||
| Amount | % of Revenues |
Amount | % of Revenues |
|||||||||||||||||||||
| Net revenues: |
||||||||||||||||||||||||
| Institutional Pharmacy |
$ | 427.7 | 96.5 | % | $ | 49.8 | 11.6 | % | $ | 477.5 | 97.2 | % | ||||||||||||
| Hospital Management |
15.4 | 3.5 | (1.4 | ) | (9.1 | ) | 14.0 | 2.8 | ||||||||||||||||
| Total net revenues |
443.1 | 100.0 | 48.4 | 10.9 | 491.5 | 100.0 | ||||||||||||||||||
| Cost of goods sold: |
||||||||||||||||||||||||
| Institutional Pharmacy |
372.8 | 84.2 | 44.1 | 11.8 | 416.9 | 84.9 | ||||||||||||||||||
| Hospital Management |
13.5 | 3.1 | (1.5 | ) | (11.1 | ) | 12.0 | 2.4 | ||||||||||||||||
| Total cost of goods sold |
386.3 | 87.2 | 42.6 | 11.0 | 428.9 | 87.3 | ||||||||||||||||||
| Gross profit: |
||||||||||||||||||||||||
| Institutional Pharmacy |
54.9 | 12.4 | 5.7 | 10.4 | 60.6 | 12.3 | ||||||||||||||||||
| Hospital Management |
1.9 | 0.4 | 0.1 | 5.3 | 2.0 | 0.4 | ||||||||||||||||||
| Total gross profit |
$ | 56.8 | 12.8 | % | $ | 5.8 | 10.2 | % | $ | 62.6 | 12.7 | % | ||||||||||||
| Institutional Pharmacy (in whole numbers except where indicated) |
||||||||||||||||||||||||
| Volume information |
||||||||||||||||||||||||
| Prescriptions dispensed (in thousands) |
8,949 | 948 | 10.6 | % | 9,897 | |||||||||||||||||||
| Revenue per prescription dispensed |
$ | 47.79 | $ | 0.46 | 1.0 | % | $ | 48.25 | ||||||||||||||||
| Gross Profit per prescription dispensed |
$ | 6.13 | $ | (0.01 | ) | (0.2 | )% | $ | 6.12 | |||||||||||||||
| Gross Profit percent |
12.8 | % | (0.1 | ) | (0.8 | )% | 12.7 | % | ||||||||||||||||
| Generic dispensing rate |
75.9 | % | (0.1 | ) | (0.1 | )% | 75.8 | % | ||||||||||||||||
| Customer licensed beds under contract |
||||||||||||||||||||||||
| Beginning of period |
299,527 | (8,836 | ) | (2.9 | )% | 290,691 | ||||||||||||||||||
| Additions |
4,867 | 79,518 | 1,633.8 | 84,385 | ||||||||||||||||||||
| Losses |
(13,703 | ) | 2,471 | (18.0 | ) | (11,232 | ) | |||||||||||||||||
| End of period |
290,691 | 73,153 | 25.2 | % | 363,844 | |||||||||||||||||||
| Hospital Management (in whole numbers except where indicated) |
||||||||||||||||||||||||
| Volume information |
||||||||||||||||||||||||
| Hospital management contracts serviced |
89 | 1.0 | 1.1 | % | 90 | |||||||||||||||||||
76
Table of Contents
Index to Financial Statements
Revenues
Institutional pharmacy revenues increased $49.8 million for the three months ended December 31, 2010 compared to the three months ended September 30, 2010. The increase in revenues was primarily due to the acquisition of Chem Rx on November 4, 2010, which resulted in revenues of $59.1 million or 1,096,000 prescriptions dispensed, offset by a decline in the existing institutional pharmacy revenues of $9.3 million. The acquisition of Chem Rx had a positive rate increase impact on revenue per prescription dispensed of $0.71 million in the quarter. The decline in existing institutional pharmacy revenues of $9.3 million was the result of an unfavorable volume variance of $7.1 million or 148,000 fewer prescriptions dispensed along with an unfavorable rate variance of $2.2 million or $0.25 per prescription dispensed, without considering the Chem Rx acquisition. The rate variance was due primarily to the make-up of drugs dispensed between periods. The unfavorable volume variance of $7.1 million was due to the decline in net customer licensed bed under contract prior to the acquisition of Chem Rx and Lone Star. The Lone Star acquisition closed on December 31, 2010 and accordingly, no revenues from this acquisition are included in the results of operation for the quarter ended December 31, 2010.
Hospital management revenues decreased $1.4 million for three months ended December 31, 2010 compared to the three months ended September 30, 2010 primarily as a result of a decrease in direct cost pass-through and labor and benefits costs, billed to existing hospital contracts during the period.
Cost of Goods Sold
Institutional pharmacy cost of goods sold increased $44.1 for the three months ended December 31, 2010, as compared to the three months ended September 30, 2010, due primarily to the acquisition of Chem Rx on November 4, 2010 offset by lower costs as a result of fewer prescriptions dispensed and other factors. The Chem Rx acquisition increased cost of goods sold approximately $52.6 million. The decline of $8.6 million in the existing institutional pharmacy business is due to 148,000 fewer prescriptions dispensed. Excluding the Chem Rx acquisition overall total drug costs as a percent of revenues increased 19 bps, other costs included in cost of goods sold decreased as a percent of revenues 28 bps primarily due to labor and other costs. The Lone Star acquisition closed on December 31, 2010 and accordingly, no costs of goods sold from this acquisition are included in the results of operations for the quarter ended December 31, 2010.
Hospital management cost of goods sold decreased $1.5 million for three months ended December 31, 2010, compared to the three months ended September 30, 2010, as a result of a decrease in direct cost pass-through, primarily labor and benefits costs during the period.
Gross Profit and Operating Expenses
Gross Profit and other operating expenses were the following for the periods presented (dollars in millions):
| Quarter Ended | ||||||||||||||||||||||||
| September 30, 2010 |
Increase (Decrease) |
December 31, 2010 |
||||||||||||||||||||||
| Amount | % of Revenue |
Amount | % of Revenue |
|||||||||||||||||||||
| Gross profit and operating expenses: |
||||||||||||||||||||||||
| Total gross profit |
$ | 56.8 | 12.8 | % | $ | 5.8 | 10.2 | % | $ | 62.6 | 12.7 | % | ||||||||||||
| Selling, general and administrative expenses |
43.3 | 9.7 | 6.2 | 14.3 | 49.5 | 10.1 | ||||||||||||||||||
| Amortization expense |
2.2 | 0.5 | 0.2 | 9.1 | 2.4 | 0.5 | ||||||||||||||||||
| Integration, merger and acquisition related costs and other charges |
2.4 | 0.6 | (0.6 | ) | (25.0 | ) | 1.8 | 0.3 | ||||||||||||||||
| Interest expense, net |
0.9 | 0.2 | 0.1 | 11.1 | 1.0 | 0.2 | ||||||||||||||||||
| Income before income taxes |
8.0 | 1.8 | (0.1 | ) | (1.3 | ) | 7.9 | 1.6 | ||||||||||||||||
| Provision for income taxes |
3.2 | 0.7 | — | — | 3.2 | 0.6 | ||||||||||||||||||
| Net income |
$ | 4.8 | 1.1 | % | $ | (0.1 | ) | (2.1 | )% | $ | 4.7 | 1.0 | % | |||||||||||
77
Table of Contents
Index to Financial Statements
Institutional gross profit for the three months ended December 31, 2010 was $60.6 million or $6.12 per prescription dispensed, compared to $54.9 million or $6.13 per prescription dispensed for the three months ended September 30, 2010. The Chem Rx acquisition resulted in $6.5 million in gross profit, or $5.93 per prescription dispensed. The gross margin for the Chem Rx business during the quarter was approximately 11.0%, which is lower than the Corporation’s existing institutional pharmacy business primarily because of the nature of the customer they service and market in which they operate. Institutional gross profit margin for the three months ended December 31, 2010 was 12.7% compared to 12.8% for the three months ended September 30, 2010. Gross profit was further impacted by a continuation of reimbursement pressure under the Medicare Part D and Medicaid programs, other pricing concessions and a decline in licensed beds under contract, offset by the gross profit recognized from the Chem Rx acquisition in the period. The Lone Star acquisition closed on December 31, 2010 and accordingly, no gross profit from this acquisition is included in the results of operations for the quarter ended December 31, 2010.
Selling, General and Administrative Expenses (Dollars in millions)
| Quarter Ended | ||||||||||||||||||||||||
| September 30, 2010 |
Increase (Decrease) |
December 31, 2010 |
||||||||||||||||||||||
| Amount | % of Revenue |
Amount | % of Revenue |
|||||||||||||||||||||
| Selling, general and administrative expenses: |
||||||||||||||||||||||||
| Total wages, benefits and contract labor |
$ | 21.9 | 4.9 | % | $ | 2.8 | 12.8 | % | $ | 24.7 | 5.0 | % | ||||||||||||
| Contracted services |
3.7 | 0.8 | — | — | 3.7 | 0.8 | ||||||||||||||||||
| Provision for doubtful accounts |
4.5 | 1.0 | 1.1 | 24.4 | 5.6 | 1.1 | ||||||||||||||||||
| Supplies |
1.5 | 0.3 | 0.3 | 20.0 | 1.8 | 0.4 | ||||||||||||||||||
| Travel expenses |
1.1 | 0.3 | 0.2 | 18.2 | 1.3 | 0.3 | ||||||||||||||||||
| Professional fees |
2.4 | 0.5 | 0.2 | 8.3 | 2.6 | 0.5 | ||||||||||||||||||
| Stock-based compensation |
0.8 | 0.2 | 0.7 | 87.5 | 1.5 | 0.3 | ||||||||||||||||||
| Depreciation |
2.4 | 0.5 | (0.1 | ) | (4.2 | ) | 2.3 | 0.5 | ||||||||||||||||
| Rent |
0.9 | 0.2 | 0.1 | 11.1 | 1.0 | 0.2 | ||||||||||||||||||
| Maintenance |
0.6 | 0.1 | 0.2 | 33.3 | 0.8 | 0.2 | ||||||||||||||||||
| Other costs |
3.5 | 0.9 | 0.7 | 20.0 | 4.2 | 0.8 | ||||||||||||||||||
| Total selling, general and administrative expenses |
$ | 43.3 | 9.7 | % | $ | 6.2 | 14.3 | % | $ | 49.5 | 10.1 | % | ||||||||||||
Selling, general and administrative expenses, excluding the $4.8 million of Chem Rx expenses, increased $1.4 million compared to the quarter ended September 30, 2010. The increase of $1.4 million is primarily due to higher labor costs as the Corporation reversed performance based compensation recorded prior to September 30, 2010 in the period ended September 30, 2010 and no performance based compensation was incurred in the period ended December 31, 2010. The Lone Star acquisition closed on December 31, 2010 and accordingly, no selling, general and administrative expenses from this acquisition are included in the results of operations for the quarter ended December 31, 2010.
78
Table of Contents
Index to Financial Statements
Depreciation and Amortization (Dollars in millions)
| Quarter Ended | ||||||||||||||||
| September 30, 2010 |
December 31, 2010 |
|||||||||||||||
| Amount | % of Revenues |
Amount | % of Revenues |
|||||||||||||
| Leasehold improvements |
$ | 0.5 | 0.1 | % | $ | 0.4 | 0.1 | % | ||||||||
| Equipment and software |
4.2 | 0.9 | 4.1 | 0.9 | ||||||||||||
| Leased equipment |
0.1 | NM | 0.2 | NM | ||||||||||||
| Total depreciation expense |
$ | 4.8 | 1.0 | % | $ | 4.7 | 1.0 | % | ||||||||
| Depreciation expense recorded in cost of goods sold |
$ | 2.4 | 0.5 | % | $ | 2.4 | 0.5 | % | ||||||||
| Depreciation expense recorded in selling, general & administrative expenses |
2.4 | 0.5 | 2.3 | 0.5 | ||||||||||||
| Total depreciation expense |
$ | 4.8 | 1.0 | % | $ | 4.7 | 1.0 | % | ||||||||
| Total capital additions |
$ | 3.7 | 0.8 | % | $ | 3.8 | 0.8 | % | ||||||||
Depreciation expense decreased $0.1 million for the three months ended December 31, 2010 compared to the three months ended September 30, 2010, due to assets acquired as a result of the Pharmacy Transaction being at the end of their useful life by September 30, 2010 partially offset by an increase due to assets acquired in the Chem Rx acquisition. The Lone Star acquisition closed on December 31, 2010 and accordingly, no depreciation expense from this acquisition is included in the results of operations for the quarter ended December 31, 2010.
Amortization expense related to certain identifiable intangibles for the periods presented were as follows (dollars in millions):
| Quarter Ended | ||||||||||||||||
| September 30, 2010 |
December 31, 2010 |
|||||||||||||||
| Amount | % of Revenues |
Amount | % of Revenues |
|||||||||||||
| Amortization of intangibles: |
||||||||||||||||
| Trade names |
$ | 0.4 | 0.1 | % | $ | 0.4 | 0.1 | % | ||||||||
| Non-compete agreements |
0.4 | 0.1 | 0.4 | 0.1 | ||||||||||||
| Customer relationships |
1.4 | 0.3 | 1.6 | 0.3 | ||||||||||||
| Total amortization expense |
$ | 2.2 | 0.5 | % | $ | 2.4 | 0.5 | % | ||||||||
Amortization expense increased $0.2 million for the three months ended December 31, 2010 compared to the three months ended September 30, 2010 due to the amortization of intangible assets acquired as a result of the Chem Rx acquisition.
79
Table of Contents
Index to Financial Statements
Integration, Merger and Acquisition Related Costs and Other Charges
The following is a summary of integration, merger and acquisition related costs and other charges incurred by the Corporation (dollars in millions, except per share amounts):
| Quarter Ended | ||||||||
| September 30, 2010 |
December 31, 2010 |
|||||||
| Integration costs: |
||||||||
| Professional and advisory fees |
$ | 0.7 | $ | 0.1 | ||||
| General and administrative |
0.1 | 0.2 | ||||||
| Employee costs |
0.2 | 0.1 | ||||||
| Severance costs |
0.4 | — | ||||||
| Facility costs |
— | 0.2 | ||||||
| Other costs |
0.1 | (0.1 | ) | |||||
| 1.5 | 0.5 | |||||||
| Acquisition costs: |
||||||||
| Professional and advisory fees |
0.5 | 2.4 | ||||||
| General and administrative |
0.1 | 0.4 | ||||||
| Employee costs |
— | 0.2 | ||||||
| Facility costs |
0.1 | — | ||||||
| Contingent consideration |
— | (1.7 | ) | |||||
| Other costs |
0.2 | — | ||||||
| 0.9 | 1.3 | |||||||
| Total integration, merger and acquisition related costs and other charges |
$ | 2.4 | $ | 1.8 | ||||
| Negative effect on diluted earnings per share |
$ | (0.05 | ) | $ | (0.04 | ) | ||
The Corporation incurred integration, merger and acquisition related costs and other charges during the three months ended December 31, 2010 and September 30, 2010 related to costs to convert data, integrate systems and its acquisitions. The Corporation expects to continue to incur costs related to the integration of its pharmacy operating systems during fiscal 2011.
For the three months ended December 31, 2010, the Corporation incurred $1.3 million compared to $0.9 million during the three months ended September 30, 2010, for acquisition related costs, respectively. Costs were higher in the current period due to the costs associated with the Chem Rx and Lone Star acquisitions in the fourth quarter of 2010. Acquisition related costs were reduced in the period by $1.7 million due to the Corporation concluding it is not probable the amount related to the contingent consideration will be paid under the terms of the agreement.
80
Table of Contents
Index to Financial Statements
Interest Expense (Dollars in millions)
| Quarter Ended | ||||||||
| September 30, 2010 |
December 31, 2010 |
|||||||
| Interest Expense, net: |
||||||||
| Term Debt |
$ | 0.7 | $ | 0.7 | ||||
| Revolving Credit Facility |
0.1 | 0.1 | ||||||
| Subtotal |
0.8 | 0.8 | ||||||
| Other: |
||||||||
| Interest income |
— | — | ||||||
| Amortization of deferred financing fees |
0.1 | 0.2 | ||||||
| Total interest expense, net |
$ | 0.9 | $ | 1.0 | ||||
| Interest rate (excluding applicable margin): |
||||||||
| Average interest rate on variable term debt |
0.31 | % | 0.26 | % | ||||
| LIBOR—1month, at beginning of period |
0.35 | % | 0.26 | % | ||||
| LIBOR—1month, at end of period |
0.26 | % | 0.26 | % | ||||
| LIBOR—3 months, at beginning of period |
0.53 | % | 0.29 | % | ||||
| LIBOR—3 months, at end of period |
0.29 | % | 0.30 | % | ||||
Interest expense increased $0.1 million for the quarter ended December 31, 2010, compared to the quarter ended September 30, 2010 due to the increase in total debt at December 31, 2010.
Tax Provision (Dollars in millions)
| Quarter Ended | ||||||||
| September 30, 2010 |
December 31, 2010 |
|||||||
| Provision for income taxes |
$ | 3.2 | $ | 3.2 | ||||
| Total provision as a percentage of income before income taxes |
40.5 | % | 39.6 | % | ||||
Our effective tax rate for the three months ended December 31, 2010 was 39.6%, comprised of the 35.0% federal rate and 4.6 % for the state rate, permanent differences and other discrete items. Our effective tax rate for the three months ended September 30, 2010 was 40.5%, comprised of the 35.0% federal rate and 5.5 % for the state rate, permanent differences and other discrete items. The decreased rate in the fourth quarter was attributable to minor fluctuations in our state rate based on returns filed during the period and other discrete items.
81
Table of Contents
Index to Financial Statements
Liquidity and Capital Resources
The following compares the Corporation’s Statement of Cash Flows for the three months ended September 30, 2010 and December 31, 2010 (dollars in millions):
| Quarter Ended | ||||||||
| September 30, 2010 |
December 31, 2010 |
|||||||
| Cash flows provided by (used in) operating activities: |
||||||||
| Net income |
$ | 4.8 | $ | 4.7 | ||||
| Adjustments to reconcile net income to net cash provided by (used in) operating activities: |
||||||||
| Depreciation |
4.8 | 4.7 | ||||||
| Amortization |
2.2 | 2.4 | ||||||
| Integration, merger and acquisition related costs and other charges |
0.1 | — | ||||||
| Stock-based compensation |
0.8 | 1.5 | ||||||
| Amortization of deferred financing fees |
0.1 | 0.2 | ||||||
| Deferred income taxes |
3.4 | 3.2 | ||||||
| Loss on disposition of equipment |
0.1 | 0.1 | ||||||
| Change in operating assets and liabilities: |
||||||||
| Accounts receivable, net |
6.7 | 7.1 | ||||||
| Inventory |
3.1 | 3.6 | ||||||
| Prepaids and other assets |
2.2 | (0.2 | ) | |||||
| Accounts payable |
(4.6 | ) | 10.8 | |||||
| Salaries, wages and other compensation |
(0.6 | ) | (5.9 | ) | ||||
| Other accrued and long-term liabilities |
0.4 | (2.8 | ) | |||||
| Net cash provided by operating activities |
23.5 | 29.4 | ||||||
| Cash flows used in investing activities: |
||||||||
| Purchases of equipment and leasehold improvements |
(3.7 | ) | (3.8 | ) | ||||
| Acquisitions, net of cash acquired |
(3.5 | ) | (117.1 | ) | ||||
| Cash proceeds from sale of assets |
— | 0.1 | ||||||
| Net cash used in investing activities |
(7.2 | ) | (120.8 | ) | ||||
| Cash flows provided by (used in) financing activities: |
||||||||
| Proceeds from long-term revolving credit facility |
— | 13.2 | ||||||
| Repayments of long-term revolving credit facility |
— | (7.6 | ) | |||||
| Repayments of capital lease obligations |
(0.1 | ) | (0.2 | ) | ||||
| Treasury stock at cost |
(10.5 | ) | (0.1 | ) | ||||
| Tax benefit from stock-based compensation |
(0.2 | ) | 0.2 | |||||
| Net cash provided by (used in) financing activities |
(10.8 | ) | 5.5 | |||||
| Change in cash and cash equivalents |
5.5 | (85.9 | ) | |||||
| Cash and cash equivalents at beginning of period |
91.2 | 96.7 | ||||||
| Cash and cash equivalents at end of period |
$ | 96.7 | $ | 10.8 | ||||
| Supplemental information: |
||||||||
| Cash paid for interest |
$ | 0.8 | $ | 0.9 | ||||
| Cash paid for taxes |
$ | 0.1 | $ | — | ||||
| Supplemental schedule of non-cash activities: |
||||||||
| Capital lease obligations |
$ | — | $ | — | ||||
| Integrity working capital adjustment |
$ | — | $ | — | ||||
82
Table of Contents
Index to Financial Statements
Item 7A. Quantitative and Qualitative Disclosures about Market Risk
On July 31, 2007, the Corporation entered into the Credit Agreement consisting of a $275.0 million term loan facility and a $150.0 million revolving credit facility. The Corporation borrowed $275.0 million under the term loan portion of the Credit Agreement and an additional $20.0 million under the revolving credit portion of the Credit Agreement on July 31, 2007, to refinance the initial financings entered into by PharMerica LTC and KPS to finance their respective cash distributions, to pay fees and expenses incurred in connection with the Pharmacy Transaction and for working capital and other general corporate purposes. Borrowings under the Credit Agreement bear interest at a floating rate equal to, at the Corporation’s option, a base rate plus a margin between 0.0% and 0.75% per annum, or an adjusted LIBO rate plus a margin between 0.625% and 1.75% per annum, in each case depending on the leverage ratio of the Corporation. The base rate is the higher of the prime lending rate announced by JPMorgan in New York from time to time and the federal funds rate published by the Federal Reserve Bank of New York plus 0.50%. As of December 31, 2010, borrowing under the Credit Agreement bore interest at a rate of 1.27% per annum based upon the one month adjusted LIBO rate and the revolving credit facility bore interest at a rate of 3.25% per annum based upon the prime rate.
Based upon the amount of variable rate debt outstanding as of December 31, 2010, a 100 basis point change in interest rates would affect the Corporation’s future pre-tax earnings by approximately $2.5 million on an annual basis. The estimated change to the Corporation’s interest expense is determined by considering the impact of hypothetical interest rates on the Corporation’s borrowing cost and debt balances. These analyses do not consider the effects, if any, of the potential changes in the Corporation’s credit ratings or leverage and the overall level of economic activity of the Corporation. Further, in the event of a change of significant magnitude, the Corporation’s management would expect to take actions intended to further mitigate its exposure to such change.
83
Table of Contents
Index to Financial Statements
Item 8. Financial Statements and Supplementary Data
Index to Consolidated Financial Statements
F-1
Table of Contents
Index to Financial Statements
Report of Independent Registered Public Accounting Firm
The Board of Directors and Stockholders
PharMerica Corporation:
We have audited the accompanying consolidated balance sheet of PharMerica Corporation and its subsidiaries (the Corporation) as of December 31, 2010, and the related consolidated statements of income, stockholders’ equity, and cash flows for the year then ended. We also have audited the Corporation’s internal control over financial reporting as of December 31, 2010, based on criteria established in Internal Control—Integrated Framework issued by the Committee of Sponsoring Organizations of the Treadway Commission. The Corporation’s management is responsible for these consolidated financial statements, for maintaining effective internal control over financial reporting, and for its assessment of the effectiveness of internal control over financial reporting, included in Management’s Annual Report on Internal Control over Financial Reporting under Item 9A. Our responsibility is to express an opinion on these consolidated financial statements and an opinion on the Corporation’s internal control over financial reporting based on our audits.
We conducted our audits in accordance with the standards of the Public Company Accounting Oversight Board (United States). Those standards require that we plan and perform the audits to obtain reasonable assurance about whether the financial statements are free of material misstatement and whether effective internal control over financial reporting was maintained in all material respects. Our audit of the consolidated financial statements included examining, on a test basis, evidence supporting the amounts and disclosures in the financial statements, assessing the accounting principles used and significant estimates made by management, and evaluating the overall financial statement presentation. Our audit of internal control over financial reporting included obtaining an understanding of internal control over financial reporting, assessing the risk that a material weakness exists, and testing and evaluating the design and operating effectiveness of internal control based on the assessed risk. Our audits also included performing such other procedures as we considered necessary in the circumstances. We believe that our audits provide a reasonable basis for our opinions.
A company’s internal control over financial reporting is a process designed to provide reasonable assurance regarding the reliability of financial reporting and the preparation of financial statements for external purposes in accordance with generally accepted accounting principles. A company’s internal control over financial reporting includes those policies and procedures that (1) pertain to the maintenance of records that, in reasonable detail, accurately and fairly reflect the transactions and dispositions of the assets of the company; (2) provide reasonable assurance that transactions are recorded as necessary to permit preparation of financial statements in accordance with generally accepted accounting principles, and that receipts and expenditures of the company are being made only in accordance with authorizations of management and directors of the company; and (3) provide reasonable assurance regarding prevention or timely detection of unauthorized acquisition, use, or disposition of the company’s assets that could have a material effect on the financial statements.
Because of its inherent limitations, internal control over financial reporting may not prevent or detect misstatements. Also, projections of any evaluation of effectiveness to future periods are subject to the risk that controls may become inadequate because of changes in conditions, or that the degree of compliance with the policies or procedures may deteriorate.
In our opinion, the consolidated financial statements referred to above present fairly, in all material respects, the financial position of PharMerica Corporation and its subsidiaries as of December 31, 2010, and the results of their operations and their cash flows for the year ended December 31, 2010, in conformity with U.S. generally accepted accounting principles. Also in our opinion, PharMerica Corporation maintained, in all material respects, effective internal control over financial reporting as of December 31, 2010, based on criteria established in Internal Control—Integrated Framework issued by the Committee of Sponsoring Organizations of the Treadway Commission.
F-2
Table of Contents
Index to Financial Statements
As described in Management’s Annual Report on Internal Control over Financial Reporting under Item 9A, management has excluded the Chem Rx and Lone Star Pharmacy Services acquisitions from its assessment of internal control over financial reporting as of December 31, 2010 because they were acquired by the Corporation in separate purchase business combinations during 2010. We have also excluded the Chem Rx and Lone Star Pharmacy Services acquisitions from our audit of internal control over financial reporting. The total combined assets and total combined revenues of Chem Rx and Lone Star Pharmacy Services represent 20.0% and 3.0%, respectively, of the related consolidated financial statement amounts as of and for the year ended December 31, 2010.
/s/ KPMG LLP
Louisville, Kentucky
February 24, 2011
F-3
Table of Contents
Index to Financial Statements
Report of Independent Registered Public Accounting Firm
To the Board of Directors and Stockholders of
PharMerica Corporation:
In our opinion, the consolidated balance sheet as of December 31, 2009 and the related consolidated statements of income, shareholders’ equity and cash flows for each of the two years in the period ended December 31, 2009 present fairly, in all material respects, the financial position of PharMerica Corporation and its subsidiaries at December 31, 2009, and the results of their operations and their cash flows for each of the two years in the period ended December 31, 2009, in conformity with accounting principles generally accepted in the United States of America. These financial statements are the responsibility of the Company’s management. Our responsibility is to express an opinion on these financial statements based on our audits. We conducted our audits of these statements in accordance with the standards of the Public Company Accounting Oversight Board (United States). Those standards require that we plan and perform the audit to obtain reasonable assurance about whether the financial statements are free of material misstatement. An audit includes examining, on a test basis, evidence supporting the amounts and disclosures in the financial statements, assessing the accounting principles used and significant estimates made by management, and evaluating the overall financial statement presentation. We believe that our audits provide a reasonable basis for our opinion.
/s/ PricewaterhouseCoopers LLP
Louisville, Kentucky
February 4, 2010
F-4
Table of Contents
Index to Financial Statements
CONSOLIDATED INCOME STATEMENTS
For the Years Ended December 31 2008, 2009 and 2010
(In millions, except share and per share amounts)
| 2008 | 2009 | 2010 | ||||||||||
| Revenues |
$ | 1,947.3 | $ | 1,841.2 | $ | 1,847.3 | ||||||
| Cost of goods sold |
1,660.0 | 1,565.7 | 1,607.0 | |||||||||
| Gross profit |
287.3 | 275.5 | 240.3 | |||||||||
| Selling, general and administrative expenses |
216.8 | 190.8 | 180.6 | |||||||||
| Amortization expense |
6.5 | 9.0 | 9.3 | |||||||||
| Impairment of intangible assets |
14.8 | — | — | |||||||||
| Integration, merger and acquisition related costs and other charges (See Note 8) |
26.7 | 5.2 | 14.6 | |||||||||
| Operating income |
22.5 | 70.5 | 35.8 | |||||||||
| Interest expense, net |
14.2 | 9.4 | 3.6 | |||||||||
| Income before income taxes |
8.3 | 61.1 | 32.2 | |||||||||
| Provision for income taxes |
3.3 | 18.9 | 13.0 | |||||||||
| Net income |
$ | 5.0 | $ | 42.2 | $ | 19.2 | ||||||
| Earnings per common share: |
||||||||||||
| Basic |
$ | 0.17 | $ | 1.39 | $ | 0.64 | ||||||
| Diluted |
$ | 0.17 | $ | 1.39 | $ | 0.64 | ||||||
| Shares used in computing earnings per common share: |
||||||||||||
| Basic |
30,095,582 | 30,266,272 | 30,007,268 | |||||||||
| Diluted |
30,190,893 | 30,402,768 | 30,133,031 | |||||||||
See accompanying Notes to Consolidated Financial Statements
F-5
Table of Contents
Index to Financial Statements
CONSOLIDATED BALANCE SHEETS
As of December 31, 2009 and 2010
(In millions, except share and per share amounts)
| December 31, 2009 |
December 31, 2010 |
|||||||
| ASSETS | ||||||||
| Current assets: |
||||||||
| Cash and cash equivalents |
$ | 51.2 | $ | 10.8 | ||||
| Accounts receivable, net |
215.3 | 226.5 | ||||||
| Inventory |
79.8 | 88.6 | ||||||
| Deferred tax assets |
39.8 | 23.5 | ||||||
| Prepaids and other assets |
23.6 | 24.3 | ||||||
| 409.7 | 373.7 | |||||||
| Equipment and leasehold improvements |
119.6 | 136.0 | ||||||
| Accumulated depreciation |
(59.0 | ) | (76.5 | ) | ||||
| 60.6 | 59.5 | |||||||
| Deferred tax assets, net |
21.0 | 24.9 | ||||||
| Goodwill |
140.1 | 193.9 | ||||||
| Intangible assets, net |
90.8 | 102.2 | ||||||
| Other |
2.1 | 5.7 | ||||||
| $ | 724.3 | $ | 759.9 | |||||
| LIABILITIES AND STOCKHOLDERS’ EQUITY | ||||||||
| Current liabilities: |
||||||||
| Accounts payable |
$ | 59.6 | $ | 74.5 | ||||
| Salaries, wages and other compensation |
30.9 | 22.0 | ||||||
| Other accrued liabilities |
6.4 | 7.0 | ||||||
| 96.9 | 103.5 | |||||||
| Long-term debt |
240.0 | 245.6 | ||||||
| Other long-term liabilities |
16.5 | 26.4 | ||||||
| Commitments and contingencies (See Note 6) |
||||||||
| Stockholders’ equity: |
||||||||
| Preferred stock, $0.01 par value per share; 1,000,000 shares authorized and no shares issued, December 31, 2009 and 2010 |
— | — | ||||||
| Common stock, $0.01 par value per share; 175,000,000 shares authorized; 30,619,830 and 30,696,261 shares issued as of December 31, 2009 and 2010, respectively |
0.3 | 0.3 | ||||||
| Capital in excess of par value |
344.8 | 349.7 | ||||||
| Retained earnings |
25.8 | 45.0 | ||||||
| Treasury stock at cost, 1,336,817 shares at December 31, 2010 |
— | (10.6 | ) | |||||
| 370.9 | 384.4 | |||||||
| $ | 724.3 | $ | 759.9 | |||||
See accompanying Notes to Consolidated Financial Statements
F-6
Table of Contents
Index to Financial Statements
CONSOLIDATED STATEMENTS OF CASH FLOWS
For the Years Ended December 31, 2008, 2009 and 2010
(In millions)
| 2008 | 2009 | 2010 | ||||||||||
| Cash flows provided by (used in) operating activities: |
||||||||||||
| Net income |
$ | 5.0 | $ | 42.2 | $ | 19.2 | ||||||
| Adjustments to reconcile net income to net cash provided by (used in) operating activities: |
||||||||||||
| Depreciation |
22.0 | 18.0 | 18.8 | |||||||||
| Amortization |
6.5 | 9.0 | 9.3 | |||||||||
| Impairment charge |
14.8 | — | — | |||||||||
| Integration, merger and acquisition related costs and other charges |
4.5 | 0.4 | 0.6 | |||||||||
| Stock-based compensation |
4.9 | 4.6 | 4.8 | |||||||||
| Amortization of deferred financing fees |
0.4 | 0.4 | 0.6 | |||||||||
| Deferred income taxes |
2.8 | 19.7 | 12.3 | |||||||||
| Loss on disposition of equipment |
0.2 | 0.3 | 0.3 | |||||||||
| Other |
(0.5 | ) | (0.3 | ) | — | |||||||
| Change in operating assets and liabilities: |
||||||||||||
| Accounts receivable, net |
(4.4 | ) | 11.3 | 28.4 | ||||||||
| Inventory |
4.2 | (2.4 | ) | 8.1 | ||||||||
| Prepaids and other assets |
3.3 | (6.2 | ) | 4.6 | ||||||||
| Accounts payable |
1.1 | (1.2 | ) | 1.5 | ||||||||
| Salaries, wages and other compensation |
(2.3 | ) | (9.8 | ) | (11.2 | ) | ||||||
| Other accrued liabilities |
3.2 | (1.0 | ) | 0.9 | ||||||||
| Net cash provided by operating activities |
65.7 | 85.0 | 98.2 | |||||||||
| Cash flows provided by (used in) investing activities: |
||||||||||||
| Purchase of equipment and leasehold improvements |
(22.1 | ) | (21.6 | ) | (12.6 | ) | ||||||
| Acquisitions, net of cash acquired |
(25.9 | ) | (54.7 | ) | (120.7 | ) | ||||||
| Cash proceeds from sale of assets |
0.6 | 0.1 | 0.1 | |||||||||
| Other |
— | 0.1 | — | |||||||||
| Net cash used in investing activities |
(47.4 | ) | (76.1 | ) | (133.2 | ) | ||||||
| Cash flows provided by (used in) financing activities: |
||||||||||||
| Proceeds from long-term revolving credit facility |
— | — | 13.2 | |||||||||
| Repayments of long-term revolving credit facility |
— | — | (7.6 | ) | ||||||||
| Repayments of long-term debt |
(10.0 | ) | — | — | ||||||||
| Repayments of capital lease obligations |
— | (0.6 | ) | (0.7 | ) | |||||||
| Cash contributions received from minority shareholders |
0.1 | — | — | |||||||||
| Issuance of common stock |
0.9 | 1.4 | 0.3 | |||||||||
| Treasury stock at cost |
— | — | (10.6 | ) | ||||||||
| Tax benefit from stock-based compensation |
— | 0.2 | — | |||||||||
| Net cash (used in) provided by financing activities |
(9.0 | ) | 1.0 | (5.4 | ) | |||||||
| Change in cash and cash equivalents |
9.3 | 9.9 | (40.4 | ) | ||||||||
| Cash and cash equivalents at beginning of period |
32.0 | 41.3 | 51.2 | |||||||||
| Cash and cash equivalents at end of period |
$ | 41.3 | $ | 51.2 | $ | 10.8 | ||||||
| Supplemental information: |
||||||||||||
| Cash paid for interest |
$ | 14.6 | $ | 11.2 | $ | 3.2 | ||||||
| Cash paid for taxes |
$ | 1.5 | $ | 1.6 | $ | 0.4 | ||||||
| Supplemental schedule of non-cash activities: |
||||||||||||
| Fair value of assets acquired |
$ | (1.7 | ) | $ | (1.5 | ) | $ | — | ||||
| Fair value of liabilities assumed or incurred |
$ | (1.0 | ) | $ | — | $ | — | |||||
| Capital lease obligations |
$ | — | $ | 1.8 | $ | 0.4 | ||||||
See accompanying Notes to Consolidated Financial Statements
F-7
Table of Contents
Index to Financial Statements
CONSOLIDATED STATEMENTS OF STOCKHOLDERS’ EQUITY
For the Years Ended December 31, 2008, 2009 and 2010
(In millions, except share amounts)
| Common Stock | Capital in Excess of Par Value |
Accumulated Other Comprehensive Income (Loss) |
Retained (Deficit) Earnings |
Treasury Stock |
Total | |||||||||||||||||||||||
| Shares | Amount | |||||||||||||||||||||||||||
| Balance at December 31, 2007 |
30,360,612 | $ | 0.3 | $ | 332.9 | $ | (2.6 | ) | $ | (21.4 | ) | $ | — | $ | 309.2 | |||||||||||||
| Comprehensive income: |
||||||||||||||||||||||||||||
| Net income |
— | 5.0 | 5.0 | |||||||||||||||||||||||||
| Change in fair value of interest rate swap, net |
(0.2 | ) | — | (0.2 | ) | |||||||||||||||||||||||
| Total comprehensive income |
(0.2 | ) | 5.0 | 4.8 | ||||||||||||||||||||||||
| Grant and forfeiture of non-vested restricted stock |
49,068 | — | 0.1 | — | — | — | 0.1 | |||||||||||||||||||||
| Exercise of stock options |
67,878 | — | 0.8 | — | — | — | 0.8 | |||||||||||||||||||||
| Stock-based compensation—non-vested restricted stock |
— | — | 2.3 | — | — | — | 2.3 | |||||||||||||||||||||
| Stock-based compensation—stock options |
— | — | 2.6 | — | — | — | 2.6 | |||||||||||||||||||||
| Balance at December 31, 2008 |
30,477,558 | $ | 0.3 | $ | 338.7 | $ | (2.8 | ) | $ | (16.4 | ) | $ | $ | 319.8 | ||||||||||||||
| Comprehensive income: |
||||||||||||||||||||||||||||
| Net income |
— | 42.2 | 42.2 | |||||||||||||||||||||||||
| Change in fair value of interest rate swap, net |
2.8 | — | 2.8 | |||||||||||||||||||||||||
| Total comprehensive income |
2.8 | 42.2 | 45.0 | |||||||||||||||||||||||||
| Grant and forfeiture of non-vested restricted stock |
34,964 | — | — | — | — | — | — | |||||||||||||||||||||
| Exercise of stock options |
107,308 | — | 1.4 | — | — | — | 1.4 | |||||||||||||||||||||
| Stock-based compensation—non-vested restricted stock |
— | — | 2.5 | — | — | — | 2.5 | |||||||||||||||||||||
| Stock-based compensation—stock options |
— | — | 2.1 | — | — | — | 2.1 | |||||||||||||||||||||
| Income tax benefit in connection with the issuance of common stock under stock-based compensation plans |
— | — | 0.1 | — | — | — | 0.1 | |||||||||||||||||||||
| Balance at December 31, 2009 |
30,619,830 | $ | 0.3 | $ | 344.8 | $ | — | $ | 25.8 | $ | — | $ | 370.9 | |||||||||||||||
| Comprehensive income: |
||||||||||||||||||||||||||||
| Net income |
— | 19.2 | 19.2 | |||||||||||||||||||||||||
| Total comprehensive income |
— | 19.2 | 19.2 | |||||||||||||||||||||||||
| Exercise of stock options and tax components of stock-based awards, net |
22,072 | — | 0.1 | — | — | — | 0.1 | |||||||||||||||||||||
| Vested restricted stock units |
49,664 | — | — | — | — | — | — | |||||||||||||||||||||
| Vested performance share units |
4,695 | — | — | — | — | — | — | |||||||||||||||||||||
| Treasury stock at cost |
(1,336,817 | ) | — | — | — | — | (10.6 | ) | (10.6 | ) | ||||||||||||||||||
| Stock-based compensation—non-vested restricted stock |
— | — | 2.2 | — | — | — | 2.2 | |||||||||||||||||||||
| Stock-based compensation—stock options |
— | — | 2.6 | — | — | — | 2.6 | |||||||||||||||||||||
| Balance at December 31, 2010 |
29,359,444 | $ | 0.3 | $ | 349.7 | $ | — | $ | 45.0 | $ | (10.6 | ) | $ | 384.4 | ||||||||||||||
See accompanying Notes to Consolidated Financial Statements
F-8
Table of Contents
Index to Financial Statements
NOTES TO CONSOLIDATED FINANCIAL STATEMENTS
NOTE 1—ORGANIZATION AND SUMMARY OF SIGNIFICANT ACCOUNTING POLICIES
Nature of Business
PharMerica Corporation (the “Corporation”) is an institutional pharmacy services company that services healthcare facilities and provides pharmacy management services to hospitals. The Corporation is the second largest institutional pharmacy services company in the United States, operating 97 institutional pharmacies in 43 states. The Corporation’s customers are typically institutional healthcare providers, such as nursing centers, assisted living facilities, hospitals and other long-term alternative care settings and generally the primary source of supply of pharmaceuticals to its customers. The Corporation also provides pharmacy management services to 90 hospitals in the United States.
Principles of Consolidation
All intercompany transactions have been eliminated.
Use of Estimates
The accompanying consolidated financial statements have been prepared in accordance with U.S. GAAP which require management to make estimates and assumptions that affect the reported amounts of assets, liabilities and disclosure of contingent liabilities as of the date of the financial statements and the reported amounts of revenues and expenses during the reporting period. Significant estimates are involved in collectability of accounts receivable, revenue recognition, inventory valuation, supplier rebates, the valuation of long-lived assets and goodwill, accounting for income taxes and stock-based compensation. Actual amounts may differ from these estimates.
Potential risks and uncertainties, many of which are beyond the control of the Corporation, include, but are not necessarily limited to, such factors as overall economic, financial and business conditions; delays and reductions in reimbursement by the government and other payers to the Corporation and/or its customers; the overall financial condition of the Corporation’s customers; the effect of new government regulations, executive orders and/or legislative initiatives, including those relating to reimbursement and drug pricing policies and changes in the interpretation and application of such policies; efforts by payers to control costs; the outcome of litigation; the outcome of audit, compliance, administrative or investigatory reviews, including governmental/ regulatory inquiries; delays or difficulties in integrating acquired businesses; other contingent liabilities; changes in international economic and political conditions; changes in interest rates; changes in the valuation of the Corporation’s financial instruments; changes in tax laws and regulations; access to capital and financing; the demand for the Corporation’s products and services; pricing and other competitive factors in the industry; changes in manufacturers’ rebate programs; shifts in demand for generic drug equivalents; changes in insurance claims experience and related assumptions; variations in costs or expenses; and changes in accounting rules and standards.
Cash and Cash Equivalents
Cash and cash equivalents consist of cash on hand and cash equivalents with original maturities of three months or less. The Corporation places its cash in financial institutions that are federally insured. As of December 31, 2009 and December 31, 2010, the Corporation did not hold a material amount of funds in cash equivalent money market accounts. Management believes it effectively safeguards cash assets.
F-9
Table of Contents
Index to Financial Statements
PHARMERICA CORPORATION
NOTES TO CONSOLIDATED FINANCIAL STATEMENTS—(Continued)
NOTE 1—ORGANIZATION AND SUMMARY OF SIGNIFICANT ACCOUNTING POLICIES (Continued)
Fair Value of Financial Instruments
Fair value is an exit price, representing the amount that would be received to sell an asset or paid to transfer a liability in an orderly transaction between market participants. As such, fair value is a market-based measurement that should be determined based upon assumptions that market participants would use in pricing an asset or liability. As a basis for considering such assumptions, the Corporation follows a three-tier fair value hierarchy, which prioritizes the inputs used in measuring fair value as follows:
| Level 1: |
Observable inputs such as quoted prices in active markets; | |
| Level 2: |
Inputs, other than quoted prices in active markets, that are observable either directly or indirectly; and | |
| Level 3: |
Unobservable inputs in which there is little or no market data, which require the reporting entity to develop its own assumptions. | |
Assets and liabilities measured at fair value are based on one or more of the following three valuation techniques:
| A. | Market approach: Prices and other relevant information generated by market transactions involving identical or comparable assets or liabilities. |
| B. | Cost approach: Amount that would be required to replace the service capacity of an asset (replacement cost). |
| C. | Income approach: Techniques to convert future amounts to a single present amount based upon market expectations (including present value techniques, option-pricing and excess earnings models). |
Financial liabilities recorded at fair value at December 31, 2009 and December 31, 2010, are set forth in the tables below (dollars in millions):
| As of December 31, 2009 |
Liabilities | Level 1 | Level 2 | Level 3 | Valuation Technique |
|||||||||||||||
| Deferred Compensation Plan |
$ | 2.9 | $ | — | $ | 2.9 | $ | — | A | |||||||||||
| Contingent Consideration |
$ | 1.7 | $ | — | $ | — | $ | 1.7 | C | |||||||||||
| As of December 31, 2010 |
Liabilities | Level 1 | Level 2 | Level 3 | Valuation Technique |
|||||||||||||||
| Deferred Compensation Plan |
$ | 4.0 | $ | — | $ | 4.0 | $ | — | A | |||||||||||
| Contingent Consideration |
$ | — | $ | — | $ | — | $ | — | C | |||||||||||
The deferred compensation plan liability represents an unfunded obligation associated with the deferred compensation plan offered to eligible employees and members of the Board of Directors of the Corporation. The fair value of the liability associated with the deferred compensation plan is derived using pricing and other relevant information for similar assets or liabilities generated by market transactions. The contingent consideration represented a future earn-out associated with our acquisition of an institutional pharmacy business based in West Virginia (“West Virginia Acquisition”). The fair value of the liability associated with the contingent consideration was derived using the income approach with unobservable inputs, which included future gross profit forecast and present value assumptions, and there was little or no market data. The Corporation no longer believes it is probable that a contingent consideration will be paid to the sellers, therefore, at December 31, 2010 the liability was relieved (See Note 8). There were no transfers between the three-tier fair value hierarchy levels during the period.
F-10
Table of Contents
Index to Financial Statements
PHARMERICA CORPORATION
NOTES TO CONSOLIDATED FINANCIAL STATEMENTS—(Continued)
NOTE 1—ORGANIZATION AND SUMMARY OF SIGNIFICANT ACCOUNTING POLICIES (Continued)
The carrying amounts reported in the accompanying consolidated balance sheets for cash and cash equivalents, accounts receivable, inventory and accounts payable approximate fair value because of the short-term maturity of these instruments. The Corporation’s debt approximates fair value due to the terms of the interest being set at variable market interest rates.
Accounts Receivable and Allowance for Doubtful Accounts
Accounts receivable primarily consist of amounts due from Prescription Drug Plans (“PDPs”) under Medicare Part D, institutional healthcare providers, the respective state Medicaid programs, third party insurance companies, and private payers. The Corporation’s ability to collect outstanding receivables is critical to its results of operations and cash flows. To provide for accounts receivable that could become uncollectible in the future, the Corporation establishes an allowance for doubtful accounts to reduce the carrying value of such receivables to the extent it is probable that a portion or all of a particular account will not be collected.
The Corporation has an established process to determine the adequacy of the allowance for doubtful accounts, which relies on analytical tools, specific identification, and benchmarks to arrive at a reasonable allowance. No single statistic or measurement determines the adequacy of the allowance for doubtful accounts. In evaluating the collectibility of accounts receivable, the Corporation considers a number of factors, which include, but are not limited to, the impact of changes in the regulatory and payer environment, historical trends, the financial viability of the payer, contractual reimbursement terms and other factors that may impact ultimate reimbursement. Accounts receivable are written off after collection efforts have been completed in accordance with the Corporation’s policies.
The Corporation’s accounts receivable accounts and summarized aging categories are as follows (dollars in millions):
| December 31, 2009 |
December 31, 2010 |
|||||||
| Institutional healthcare providers |
$ | 138.7 | $ | 149.8 | ||||
| Medicare Part D |
60.2 | 52.3 | ||||||
| Private payor and other |
34.5 | 35.7 | ||||||
| Insured |
9.7 | 10.0 | ||||||
| Medicaid |
10.9 | 13.4 | ||||||
| Medicare |
1.5 | 2.1 | ||||||
| Allowance for doubtful accounts |
(40.2 | ) | (36.8 | ) | ||||
| $ | 215.3 | $ | 226.5 | |||||
| 0 to 60 days |
64.9 | % | 64.5 | % | ||||
| 61 to 120 days |
17.1 | % | 19.8 | % | ||||
| Over 120 days |
18.0 | % | 15.7 | % | ||||
| 100.0 | % | 100.0 | % | |||||
F-11
Table of Contents
Index to Financial Statements
PHARMERICA CORPORATION
NOTES TO CONSOLIDATED FINANCIAL STATEMENTS—(Continued)
NOTE 1—ORGANIZATION AND SUMMARY OF SIGNIFICANT ACCOUNTING POLICIES (Continued)
The following is a summary of activity in the Corporation’s allowance for doubtful accounts (dollars in millions):
| Beginning Balance |
Acquisitions/ Transfers |
Charges to Costs and Expenses |
Write-offs | Ending Balance |
||||||||||||||||
| Allowance for doubtful accounts: |
||||||||||||||||||||
| Year Ended December 31, 2008 |
$ | 43.4 | $ | 0.3 | $ | 24.7 | $ | (21.9 | ) | $ | 46.5 | |||||||||
| Year Ended December 31, 2009 |
$ | 46.5 | $ | 3.5 | $ | 16.6 | $ | (26.4 | ) | $ | 40.2 | |||||||||
| Year Ended December 31, 2010 |
$ | 40.2 | $ | — | $ | 18.5 | $ | (21.9 | ) | $ | 36.8 | |||||||||
For the year ended December 31, 2008, the Corporation recognized an allowance for accounts receivable of $0.3 million from an acquisition. The allowance for doubtful accounts for 2009 included a transfer of reserves on contractual adjustments into the allowance for doubtful accounts during the period. The reclassification did not impact the provision for bad debt. Beginning January 1, 2009 any receivables acquired were recognized at fair value, therefore, there is no allowance on receivables acquired during the years ended December 31, 2009 and 2010.
Concentration of Credit Risk
For the year ended December 31, 2009 and 2010, the Corporation derived approximately 13.0% of its revenues from a single customer, including all payer sources associated with the residents of its long-term care facilities.
Deferred Financing Fees
The Corporation capitalizes financing fees related to acquiring or issuing new debt instruments. These expenditures include bank fees and premiums, legal costs, and filing fees. The Corporation amortizes these deferred financing fees using the effective interest method.
Inventory
Inventory is primarily located at the Corporation’s institutional pharmacy locations. Inventory consists solely of finished products (primarily prescription drugs) and is valued at the lower of first-in, first-out cost (“FIFO”) or market. Physical inventories are performed on a quarterly basis at the end of the quarter at all pharmacy sites. Cost of goods sold is recorded based upon the actual results of the physical inventory counts.
Equipment and Leasehold Improvements
Equipment and leasehold improvements are recorded at cost at the acquisition date and are depreciated using the straight-line method over their estimated useful lives or lease term, if shorter, as follows (in years):
| Estimated Useful Lives |
||||
| Leasehold improvements |
1-7 | |||
| Equipment and software |
3-10 | |||
| Leased equipment |
1-5 | |||
F-12
Table of Contents
Index to Financial Statements
PHARMERICA CORPORATION
NOTES TO CONSOLIDATED FINANCIAL STATEMENTS—(Continued)
NOTE 1—ORGANIZATION AND SUMMARY OF SIGNIFICANT ACCOUNTING POLICIES (Continued)
Expenditures for maintenance, repairs and renewals of minor items are expensed as incurred. Major rebuilds and improvements are capitalized. For the years ended December 31, 2008, 2009 and 2010, maintenance and repairs were $7.3 million, $6.4 million, and $6.1 million, respectively.
Long-lived assets are reviewed for impairment whenever events or changes in circumstances indicate that the carrying amount of an asset may not be recoverable. Recoverability of long-lived assets is assessed by a comparison of the carrying amount of the asset to the estimated future undiscounted net cash flows expected to be generated by the asset or group of assets. If estimated future undiscounted net cash flows are less than the carrying amount of the asset or group of assets, the asset is considered impaired and an expense is recorded in an amount required to reduce the carrying amount of the asset to its then fair value. The Corporation did not record impairment charges on equipment and leasehold improvements for the years ended December 31, 2008, 2009 or 2010.
The Corporation’s equipment and leasehold improvements are further described in Note 3.
Capitalization of Internal Software Costs
The Corporation capitalizes the costs incurred during the application development stage, which include costs to design the software configuration and interfaces, coding, installation, and testing. Costs incurred during the preliminary project stage along with post-implementation stages of internal use computer software are expensed as incurred. Capitalized development costs are amortized over various periods up to three years and are subject to impairment evaluations. Costs incurred to maintain existing software development are expensed as incurred. The capitalization and ongoing assessment of recoverability of development costs requires judgment by management with respect to certain external factors, including, but not limited to, technological and economic feasibility and estimated economic life. For the years ended December 31, 2009 and 2010, the Corporation capitalized internally developed software costs of $2.5 million and $1.4 million, respectively. As of December 31, 2009 and 2010, net capitalized software costs, including acquired assets and amounts for projects which have not been completed, totaled $9.3 million and $14.2 million, respectively.
Goodwill and Other Intangibles
Goodwill represents the excess purchase price of an acquired entity over the net amounts assigned to assets acquired and liabilities assumed. Goodwill and intangible assets with indefinite lives are reviewed by the Corporation at least annually for impairment, each of which are reviewed separately for impairment. The Corporation’s business is comprised of two reporting units, institutional pharmacy and hospital management, each of which are reviewed separately for impairment. The Corporation performed its annual impairment test for goodwill recorded as of December 31, 2010 and did not incur an impairment charge.
The Corporation’s finite-lived intangible assets are comprised primarily of trade names, customer relationship assets and non-compete agreements primarily originating from business acquisitions. Finite-lived intangible assets are amortized on a straight-line basis over the terms of the agreements ranging from 5 to 20 years. For impairment reviews, intangible assets are reviewed on a specific pharmacy basis or as a group of pharmacies depending on the intangible assets under review. The Corporation’s goodwill and intangible assets are further described in Note 4.
F-13
Table of Contents
Index to Financial Statements
PHARMERICA CORPORATION
NOTES TO CONSOLIDATED FINANCIAL STATEMENTS—(Continued)
NOTE 1—ORGANIZATION AND SUMMARY OF SIGNIFICANT ACCOUNTING POLICIES (Continued)
Self-Insured Employee Health Benefits
The Corporation is self-insured for employee health benefits. The Corporation’s self-insurance for employee health benefits includes a stop-loss policy to limit the maximum potential liability of the Corporation for both individual and aggregate claims per year. The Corporation records a monthly expense for self-insurance based on historical claims data and inputs from third-party administrators. For years ended December 31, 2008, 2009 and 2010, the expense for employee health benefits was $16.5 million, $19.3 million and $18.3 million, respectively. As of December 31, 2009 and 2010, the Corporation had $2.5 million and $2.4 million, respectively, recorded as a liability for self-insured employee health benefits.
Supplier Rebates
The Corporation receives rebates on purchases from its vendors and suppliers. The Corporation generally accounts for these rebates and other incentives received from its vendors and suppliers, relating to the purchase or distribution of inventory, as a reduction of cost of goods sold and inventory. The Corporation considers these rebates to represent product discounts, and as a result, the rebates are capitalized as a reduction of product cost and relieved through cost of goods sold upon the sale of the related inventory. For the years ended December 31, 2008, 2009 and 2010, rebates were $34.7 million, $34.1 million, and $37.2 million, respectively. The Corporation had $2.8 million, $3.0 million, and $3.3 million of rebates capitalized in inventory as of December 31, 2008, 2009, and 2010, respectively.
Delivery Expenses
The Corporation incurred delivery expenses of $61.9 million, $55.6, million, and $58.4 million for the years ended December 31, 2008, 2009, and 2010, respectively, to deliver products sold to its customers. Delivery expenses are reported as a component of cost of goods sold in the accompanying consolidated income statements.
Accumulated Other Comprehensive (Loss) Income
On July 31, 2007, the Corporation entered into an interest rate swap agreement, which the Corporation designated as a cash flow hedge. The swap expired on July 31, 2009. The Corporation recognized all derivatives on the balance sheet at fair value. Derivatives that are not hedges must be adjusted to fair value through income. Depending on the nature of the hedge, changes in the fair value of the derivative are either offset against the change in fair value of assets and liabilities through earnings or recognized in accumulated other comprehensive (loss) income until the hedged item is recognized into earnings. The ineffective portion of a derivative’s change in fair value, if any, is immediately recognized into earnings.
The changes in the fair value of the interest rate swap for the years ended December 31, 2008 and 2009, resulted in comprehensive (loss) income of $(0.2) million and $2.8 million, net of income taxes, respectively.
Stock Option Accounting
The Corporation recognizes stock-based compensation expense in its consolidated financial statements using the Black-Scholes-Merton option valuation model for non-vested stock options. See Note 9.
F-14
Table of Contents
Index to Financial Statements
PHARMERICA CORPORATION
NOTES TO CONSOLIDATED FINANCIAL STATEMENTS—(Continued)
NOTE 1—ORGANIZATION AND SUMMARY OF SIGNIFICANT ACCOUNTING POLICIES (Continued)
Income Taxes
Deferred tax assets and liabilities are recognized for the future tax consequences attributable to temporary differences between the financial statement carrying amounts of existing assets and liabilities and their respective tax basis. Deferred tax assets and liabilities are measured using enacted tax rates expected to apply to taxable income in the years in which those temporary differences are expected to be recovered or settled. The Corporation accrues for tax obligations as appropriate based on facts and circumstances in the various regulatory environments. Deferred tax assets and liabilities are more fully described in Note 10.
Pharmacy Transaction
The Corporation, formerly known as Safari Holding Corporation, was formed on October 23, 2006, by Kindred Healthcare, Inc. (“Kindred” or “Former Parent”) and AmerisourceBergen Corporation (“AmerisourceBergen”) for the purpose of consummating the transactions contemplated by the Master Transaction Agreement dated October 25, 2006, as amended (the “Master Agreement”). Pursuant to the Master Agreement, Kindred and AmerisourceBergen, through a series of transactions (collectively, the “Pharmacy Transaction”), spun-off and combined their respective institutional pharmacy businesses, Kindred Pharmacy Services (“KPS”) and PharMerica Long-Term Care (“PharMerica LTC”), into a new, stand-alone, publicly traded company. The Pharmacy Transaction was consummated on July 31, 2007 (the “Closing Date”).
Reclassifications
For the years ended December 31, 2008 and 2009, the Corporation has reclassified certain amounts historically recorded as rebates in its footnotes. The amounts have been reclassified out of rebates and treated as a direct reduction to cost of goods sold. These reclassifications have no impact on the Corporation’s total assets, liabilities, stockholders’ equity, net income or cash flows for the years ended December 31, 2008 or 2009.
NOTE 2—ACQUISITIONS
Chem Rx Acquisition
On November 4, 2010, the Corporation acquired substantially all of the assets and assumed selected vendor contracts of Chem Rx Corporation and certain of its wholly-owned subsidiaries (collectively, “Chem Rx”). The Corporation’s primary purpose in acquiring Chem Rx was to expand the Corporation’s long-term care business into the New York and New Jersey markets. The acquisition of Chem Rx was made pursuant to Section 363 of the United States Bankruptcy Code (“Bankruptcy Code”).
The acquisition was accounted for under the acquisition method of accounting. The total purchase price of Chem Rx was allocated to the net tangible and identifiable intangible assets based upon the associated fair values on November 4, 2010. The excess of the purchase price over the fair value of the net tangible and identifiable intangible assets was recorded as goodwill. For tax purposes, the transaction was considered an asset acquisition, therefore, the amount of goodwill recorded in the transaction of $27.3 million will be tax deductible to the Corporation. The Corporation believes the resulting amount of goodwill reflects its expectation of the synergistic benefits of being able to integrate Chem Rx. The Chem Rx acquisition contributed $59.1 million of revenues from the acquisition date through the period ended December 31, 2010. The earnings of the Chem Rx acquisition were not material to the consolidated earnings of the Corporation for the period ended December 31, 2010.
F-15
Table of Contents
Index to Financial Statements
PHARMERICA CORPORATION
NOTES TO CONSOLIDATED FINANCIAL STATEMENTS—(Continued)
NOTE 2—ACQUISITIONS (Continued)
The allocation of the purchase price was based upon the fair value of net tangible and identifiable intangible assets as of November 4, 2010. The preliminary purchase price allocation was as follows (dollars in millions):
| Accounts receivable |
$ | 33.1 | ||
| Inventory |
14.1 | |||
| Other current assets |
3.9 | |||
| Equipment and leasehold improvements |
4.9 | |||
| Identifiable intangibles |
4.0 | |||
| Other long-term assets |
5.1 | |||
| Goodwill |
27.6 | |||
| Total assets |
92.7 | |||
| Current liabilities |
(13.3 | ) | ||
| Other long-term liabilities |
(8.8 | ) | ||
| Total liabilities |
(22.1 | ) | ||
| Purchase price of Chem Rx |
$ | 70.6 | ||
The Corporation recorded accounts receivable with a contractual fair value of $33.1 million as part of the preliminary purchase price allocation. In addition, the Corporation also recorded a liability with a fair value of $9.8 million related to an unfavorable operating lease as part of the preliminary purchase price allocation. The unfavorable operating lease liability will be amortized to rental expense over the contractual term of the operating lease agreement.
The following are the fair values of the equipment and leasehold improvements of Chem Rx acquired at the date of acquisition (dollars in millions):
| Equipment and leasehold improvements |
Fair-Value | Weighted Average Useful Life (Yr.) |
||||||
| Leasehold improvements |
$ | 1.0 | 6.9 | |||||
| Equipment and software |
3.9 | 3.5 | ||||||
| $ | 4.9 | 5.2 | ||||||
The following are the fair values of the identifiable intangible assets of Chem Rx acquired at the date of acquisition (dollars in millions):
| Identifiable Intangibles |
Fair-Value | Weighted Average Useful Life (Yr.) |
||||||
| Trade name |
$ | 0.7 | 7.0 | |||||
| Customer relationships |
3.3 | 6.0 | ||||||
| $ | 4.0 | 6.2 | ||||||
Lone Star Acquisition
On December 31, 2010, the Corporation through a wholly-owned subsidiary, acquired all of the membership interests of Lone Star Pharmacy LTD, a Texas Limited partnership, and Pharmastat Transport, LTD, a Texas limited partnership (collectively, “Lone Star”), for $50.0 million in cash. The Corporation’s primary purpose in acquiring Lone Star was to increase the Corporation’s market share in the respective regions.
F-16
Table of Contents
Index to Financial Statements
PHARMERICA CORPORATION
NOTES TO CONSOLIDATED FINANCIAL STATEMENTS—(Continued)
NOTE 2—ACQUISITIONS (Continued)
The acquisition of Lone Star has been accounted for under the acquisition method of accounting. The total purchase price of Lone Star was allocated to the net tangible and identifiable intangible assets based upon their fair values on December 31, 2010. The excess of the purchase price over the fair values of the net tangible and identifiable intangible assets was recorded as goodwill. For tax purposes, the transaction was considered an asset acquisition; therefore, the amount of goodwill recorded in the transaction of $25.9 million will be tax deductible to the Corporation. The Corporation believes the resulting amount of goodwill reflects its expectations of the synergistic benefits of being able to fully integrate the Lone Star business into its existing institutional pharmacy locations.
The allocation of the purchase price was based upon the fair value of net tangible and identifiable intangible assets as of December 31, 2010. The preliminary purchase price allocation was as follows (dollars in millions):
| Accounts receivable |
$ | 6.7 | ||
| Inventory |
2.9 | |||
| Other current assets |
0.4 | |||
| Equipment and leasehold improvements |
0.9 | |||
| Identifiable intangibles |
15.7 | |||
| Goodwill |
25.9 | |||
| Total assets |
52.5 | |||
| Current liabilities |
(1.3 | ) | ||
| Accrued salaries |
(1.1 | ) | ||
| Other current liabilities |
(0.1 | ) | ||
| Other long-term liabilities |
||||
| Total liabilities |
(2.5 | ) | ||
| Purchase price of Lone Star, net of cash acquired |
$ | 50.0 | ||
The following are the fair values of the equipment and leasehold improvements of Lone Star acquired at the date of acquisition (dollars in millions):
| Equipment and leasehold improvements |
Fair-Value | Weighted Average Useful Life (Yr.) |
||||||
| Equipment and software |
$ | 0.9 | 3.4 | |||||
The following are the fair values of the identifiable intangible assets of Lone Star acquired at the date of acquisition (dollars in millions):
| Identifiable Intangibles |
Fair-Value | Weighted Average Useful Life (Yr.) |
||||||
| Customer relationships |
$ | 15.2 | 8.0 | |||||
| Trade name |
0.3 | 6.0 | ||||||
| Non-compete agreement |
0.2 | 6.0 | ||||||
| $15.7 | 7.9 | |||||||
F-17
Table of Contents
Index to Financial Statements
PHARMERICA CORPORATION
NOTES TO CONSOLIDATED FINANCIAL STATEMENTS—(Continued)
NOTE 2—ACQUISITIONS (Continued)
2009 Acquisitions
Integrity Pharmacy Services Acquisition
On December 31, 2009, the Corporation through a wholly-owned subsidiary, acquired all of the membership interests in Integrity Pharmacy Services, LLC (“IPS”), and Integrity Medical Supplies, LLC (“IMS” together with IPS, “Integrity”), for $38.0 million in cash plus $3.3 million to retire outstanding promissory notes in favor of the sellers. The Corporation’s primary purpose in acquiring Integrity was to increase the Corporation’s market share in certain regions.
The acquisition of Integrity has been accounted for as a business combination using the acquisition method of accounting. The total purchase price of Integrity was allocated to the net tangible and identifiable intangible assets based upon their fair values on December 31, 2009. The excess of the purchase price over the fair values of the net tangible and identifiable intangible assets was recorded as goodwill. For tax purposes, the transaction was considered an asset acquisition, therefore, the amount of goodwill recorded in the transaction of $12.0 million will be tax deductible to the Corporation. The Corporation believes the resulting amount of goodwill reflects its expectations of the synergistic benefits of being able to fully integrate the Integrity business into its existing institutional pharmacy locations.
Except for identifiable intangible assets, and equipment and leasehold improvements, the assets acquired and liabilities assumed were valued at their respective carrying amounts recorded by Integrity as the Corporation believes that their carrying value amounts approximate their fair value at the acquisition date.
The purchase price allocation was recorded as follows (dollars in millions):
| Current assets, net of cash acquired |
$ | 9.8 | ||
| Equipment and leasehold improvements |
1.2 | |||
| Identifiable intangible assets |
20.6 | |||
| Goodwill |
12.0 | |||
| Total assets |
43.6 | |||
| Current liabilities |
(4.4 | ) | ||
| Purchase price, net of cash acquired |
$ | 39.2 | ||
The following are the fair values of the equipment and leasehold improvements of Integrity acquired at the date of acquisition (dollars in millions):
| Fair Value | Weighted Average Useful Lives |
|||||||
| Leasehold improvements |
$ | 0.3 | 7.0 | |||||
| Equipment and software |
0.9 | 4.0 | ||||||
| Total equipment and leasehold improvements acquired |
$ | 1.2 | 5.1 | |||||
F-18
Table of Contents
Index to Financial Statements
PHARMERICA CORPORATION
NOTES TO CONSOLIDATED FINANCIAL STATEMENTS—(Continued)
NOTE 2—ACQUISITIONS (Continued)
The following are the fair values of the identifiable intangible assets of Integrity acquired at the date of acquisition (dollars in millions):
| Fair Value | Weighted Average Useful Lives |
|||||||
| Non-competition agreement |
$ | 0.2 | 5.0 | |||||
| Customer relationships |
20.4 | 15.0 | ||||||
| Total identifiable intangible assets acquired |
$ | 20.6 | 14.9 | |||||
West Virginia Acquisition
On August 10, 2009, the Corporation acquired certain assets and assumed certain liabilities of an institutional pharmacy business providing medications, pharmacy and medical supplies and services to residents of long-term care facilities located mostly in West Virginia. The Corporation paid $15.9 million in cash for the business, with an additional amount not to exceed $10.0 million in the form of contingent consideration to be paid at the end of a three year period based upon the cumulative achievement of certain financial performance measures. The transaction was accounted for under the acquisition method of accounting, in which the preliminary purchase price was allocated based upon the fair value of the assets acquired and liabilities assumed with the difference recorded as goodwill. As a result of the acquisition the Corporation recorded $4.4 million as finite-lived intangible assets and $12.6 million of goodwill. The contingent consideration was recorded at fair value at the acquisition date in the amount of $1.7 million. The Corporation no longer believes it is probable that a contingent consideration will be paid to the sellers, therefore, at December 31, 2010 a liability was not recognized.
Other
For the years ended December 31, 2009 and 2010, the Corporation incurred $1.0 million and $5.2 million, respectively, of acquisition related costs, which have been classified as a component of integration, merger, and acquisition related costs and other charges.
Pro forma
The following unaudited pro forma consolidated financial information is not intended to represent or be indicative of the consolidated results of operations or financial condition of the Corporation that would have been reported had the acquisitions been completed as of the date or for the periods presented, and should not be taken as representative of the future consolidated results of operations or financial condition of the Corporation.
F-19
Table of Contents
Index to Financial Statements
PHARMERICA CORPORATION
NOTES TO CONSOLIDATED FINANCIAL STATEMENTS—(Continued)
NOTE 2—ACQUISITIONS (Continued)
The unaudited pro forma effect of the Chem Rx, Lone Star, Integrity and West Virginia acquisitions assuming the acquisitions occurred on January 1, 2009, excluding the integration, merger and acquisition related costs and other charges and assuming an effective tax rate of approximately 40.0% for the years ended December 31, 2009 and 2010, would be as follows (dollars in millions, except per share amounts):
| For the years ended December 31, |
||||||||
| 2009 | 2010 | |||||||
| Revenues |
$ | 2,330.8 | $ | 2,213.3 | ||||
| Net income |
$ | 47.7 | $ | 30.9 | ||||
| Earnings per common share: |
||||||||
| Basic |
$ | 1.57 | $ | 1.03 | ||||
| Diluted |
$ | 1.57 | $ | 1.02 | ||||
NOTE 3—EQUIPMENT AND LEASEHOLD IMPROVEMENTS
Equipment and leasehold improvements consist of the following (dollars in millions):
| December 31, 2009 |
December 31, 2010 |
|||||||
| Leasehold improvements |
$ | 11.6 | $ | 13.6 | ||||
| Equipment and software |
95.3 | 115.4 | ||||||
| Leased equipment |
2.6 | 3.0 | ||||||
| Construction in progress |
10.1 | 4.0 | ||||||
| 119.6 | 136.0 | |||||||
| Accumulated depreciation |
(59.0 | ) | (76.5 | ) | ||||
| Total Equipment and leasehold improvements |
$ | 60.6 | $ | 59.5 | ||||
The following is a progression of equipment and leasehold improvements for the period presented (dollars in millions):
| Balance at December 31, 2008 |
Additions | Disposals | Balance at December 31, 2009 |
Additions | Disposals | Balance at December 31, 2010 |
||||||||||||||||||||||
| Equipment and leasehold improvements: |
||||||||||||||||||||||||||||
| Leasehold improvements |
$ | 8.9 | $ | 3.5 | $ | (0.8 | ) | $ | 11.6 | $ | 2.1 | $ | (0.1 | ) | $ | 13.6 | ||||||||||||
| Equipment and software |
83.2 | 14.1 | (2.0 | ) | 95.3 | 22.3 | (2.2 | ) | 115.4 | |||||||||||||||||||
| Leased equipment |
0.7 | 1.9 | — | 2.6 | 0.4 | — | 3.0 | |||||||||||||||||||||
| Construction in progress |
4.3 | 5.8 | — | 10.1 | (6.1 | ) | — | 4.0 | ||||||||||||||||||||
| Sub-Total |
97.1 | 25.3 | (2.8 | ) | 119.6 | 18.7 | (2.3 | ) | 136.0 | |||||||||||||||||||
| Accumulated depreciation |
(43.1 | ) | (18.0 | ) | 2.1 | (59.0 | ) | (18.8 | ) | 1.3 | (76.5 | ) | ||||||||||||||||
| Total |
$ | 54.0 | $ | 7.3 | $ | (0.7 | ) | $ | 60.6 | $ | (0.1 | ) | $ | (1.0 | ) | $ | 59.5 | |||||||||||
F-20
Table of Contents
Index to Financial Statements
PHARMERICA CORPORATION
NOTES TO CONSOLIDATED FINANCIAL STATEMENTS—(Continued)
NOTE 3—EQUIPMENT AND LEASEHOLD IMPROVEMENTS (Continued)
Depreciation expense totaled $22.0 million, $18.0 million, and $18.8 million for the years ended December 31, 2008, 2009, and 2010, respectively.
Total estimated depreciation expense for the Corporation’s equipment and leasehold improvements for the next five years and thereafter are as follows (dollars in millions):
| Year Ending December 31, |
||||
| 2011 |
$ | 18.4 | ||
| 2012 |
14.1 | |||
| 2013 |
9.4 | |||
| 2014 |
5.7 | |||
| 2015 |
3.5 | |||
| Thereafter |
8.4 | |||
| Total |
$ | 59.5 | ||
NOTE 4—GOODWILL AND INTANGIBLES
The following table presents the changes in the carrying amount of goodwill for the years ended December 31, 2009 and 2010 (dollars in millions):
| Balance at December 31, 2008 |
$ | 113.7 | ||
| Release of escrow deposit from 2008 acquisition |
0.5 | |||
| Tax related and other adjustments associated with Pharmacy Transaction |
1.7 | |||
| Goodwill acquired from 2009 acquisitions |
24.2 | |||
| Balance at December 31, 2009 |
$ | 140.1 | ||
| Integrity purchase accounting adjustments |
0.3 | |||
| Goodwill acquired from 2010 acquisitions |
53.5 | |||
| Balance at December 31, 2010 |
$ | 193.9 | ||
The Corporation does not have accumulated impairments that reduce the gross value of goodwill.
The following table presents the components of the Corporation’s intangible assets (dollars in millions):
| Finite Lived Intangible Assets |
Balance at December 31, 2008 |
Additions | Balance at December 31, 2009 |
Additions | Balance at December 31, 2010 |
|||||||||||||||
| Customer relationships |
$ | 53.1 | $ | 23.5 | $ | 76.6 | $ | 18.5 | $ | 95.1 | ||||||||||
| Trade name |
27.9 | 0.6 | 28.5 | 1.0 | 29.5 | |||||||||||||||
| Non-compete agreements |
2.4 | 2.3 | 4.7 | 1.2 | 5.9 | |||||||||||||||
| Sub Total |
83.4 | 26.4 | 109.8 | 20.7 | 130.5 | |||||||||||||||
| Accumulated amortization |
(10.0 | ) | (9.0 | ) | (19.0 | ) | (9.3 | ) | (28.3 | ) | ||||||||||
| Net intangible assets |
$ | 73.4 | $ | 17.4 | $ | 90.8 | $ | 11.4 | $ | 102.2 | ||||||||||
Amortization expense relating to finite-lived intangible assets was $6.5 million, $9.0 million, and $9.3 million for the years ended December 31, 2008, 2009 and 2010, respectively.
F-21
Table of Contents
Index to Financial Statements
PHARMERICA CORPORATION
NOTES TO CONSOLIDATED FINANCIAL STATEMENTS—(Continued)
NOTE 4—GOODWILL AND INTANGIBLES (Continued)
Total estimated amortization expense for the Corporation’s finite-lived intangible assets for the next five years and thereafter are as follows (dollars in millions):
| Year Ending December 31, |
||||
| 2011 |
$ | 9.9 | ||
| 2012 |
9.2 | |||
| 2013 |
9.2 | |||
| 2014 |
9.2 | |||
| 2015 |
9.1 | |||
| Thereafter |
55.6 | |||
| $ | 102.2 | |||
NOTE 5—CREDIT AGREEMENT
The Corporation is a party to a credit agreement among the Corporation, the Lenders named therein, and JPMorgan Chase Bank, N.A. (“JPMorgan”), as Administrative Agent (the “Credit Agreement”). The Credit Agreement consists of a $275.0 million term loan facility and a $150.0 million revolving credit facility. As of December 31, 2010, $240.0 million was outstanding under the term loan facility and $5.6 million was outstanding under the revolving credit facility. Indebtedness under the Credit Agreement matures on July 31, 2012, at which time the commitment of the Lenders to make revolving loans also shall expire. There is no scheduled amortization under the term loan facility but the term loans are subject to certain prepayment obligations relating to asset sales, casualty losses and the incurrence by the Corporation of certain indebtedness.
The table below summarizes the term debt and revolving credit facility of the Corporation (dollars in millions):
| December 31, 2009 |
December 31, 2010 |
|||||||
| Credit Agreement: |
||||||||
| Term Debt—payable to lenders at LIBOR plus applicable margin (1.27% as of December 31, 2010), matures July 31, 2012 |
$ | 240.0 | $ | 240.0 | ||||
| Revolving Credit Facility payable to lenders, interest at LIBOR plus applicable margin (3.25% as of December 31, 2010), matures July 31, 2012 |
— | 5.6 | ||||||
| Total debt |
$ | 240.0 | $ | 245.6 | ||||
The maturity of all of the Corporation’s long-term debt will occur on July 31, 2012.
The Credit Agreement provides for the issuance of letters of credit which, when issued, reduce availability under the revolving credit facility. The aggregate amount of letters of credit outstanding as of December 31, 2010 was $3.5 million. After giving effect to the letters of credit, total availability under the revolving credit facility was $140.9 million as of December 31, 2010. The revolving credit facility contains a $50.0 million accordion feature, which permits the Corporation to increase the size of the credit facility, up to an aggregate of $200.0 million, subject to securing additional commitments from existing or new lenders.
F-22
Table of Contents
Index to Financial Statements
PHARMERICA CORPORATION
NOTES TO CONSOLIDATED FINANCIAL STATEMENTS—(Continued)
NOTE 5—CREDIT AGREEMENT (Continued)
Borrowings under the Credit Agreement bear interest at a floating rate equal to, at our option, a base rate plus a margin between 0.0% and 0.75% per annum, or an adjusted London Interbank Offered Rate (“LIBO rate” or “LIBOR”) plus a margin between 0.625% and 1.75% per annum, in each case depending on the leverage ratio of the Corporation. The base rate is the higher of the prime lending rate announced by JPMorgan in New York from time to time and the federal funds rate published by the Federal Reserve Bank of New York plus 0.50%. The Credit Agreement also provides for letter of credit participation fees between 0.625% and 1.75%, letter of credit fronting fees of 0.125%, and a commitment fee payable on the unused portion of the revolving credit facility, which shall accrue at a rate per annum ranging from 0.125% to 0.250%, in each case depending on the leverage ratio of the Corporation.
The obligations of the Corporation under and related to the Credit Agreement are secured by substantially all of its assets. Those obligations are guaranteed by many of the Corporation’s wholly owned subsidiaries and the obligations of the guarantors are secured by substantially all of their assets. The foregoing includes a pledge of all of the equity interests of substantially all of our direct and indirect domestic subsidiaries and a portion of the equity interests of any future foreign subsidiaries. The Credit Agreement also contains financial and non-financial affirmative and negative covenants, representations, warranties, and events of default that are customary to facilities of this nature.
Covenants
The Credit Agreement requires the Corporation to satisfy a fixed charge coverage ratio and a leverage ratio. The minimum fixed charge coverage ratio, which is tested quarterly on a trailing four quarter basis, can be no less than: 2.50:1.00 beginning with January 1, 2010 and thereafter. The maximum total leverage coverage ratio, which also is tested quarterly, cannot exceed 3.00:1.00 beginning with January 1, 2010 and thereafter. The maximum total leverage coverage ratio is not tested when at any time it is less than 2.00:1.00, or both S&P and Moody’s have in effect corporate credit ratings for the Corporation that are investment grade. The Corporation remains compliant under the terms of the Credit Agreement. In addition, capital expenditures (other than those funded with proceeds of asset sales or insurance) are restricted in any fiscal year to 3.0% of revenues.
The financial covenant requirements as defined by the Corporation’s Credit Agreement are as follows:
| Minimum Fixed Charge Coverage Ratio |
Maximum Leverage Ratio |
Capital | ||||||||||
| Requirement |
> = 2.00 to 1.00 | < = 4.50 to 1.00 | < = 3.00 | % | ||||||||
| December 31, 2008 |
3.67 | 1.99 | 1.13 | % | ||||||||
| Requirement |
> = 2.25 to 1.00 | < = 3.50 to 1.00 | < = 3.00 | % | ||||||||
| December 31, 2009 |
5.09 | 1.88 | 1.17 | % | ||||||||
| Requirement |
> = 2.50 to 1.00 | < = 3.00 to 1.00 | < = 3.00 | % | ||||||||
| December 31, 2010 |
5.94 | 2.20 | 0.68 | % | ||||||||
In addition, the Credit Agreement contains customary affirmative and negative covenants, which among other things, limit the Corporation’s ability to incur additional debt, create liens, pay dividends, effect transactions with the Corporation’s affiliates, sell assets, pay subordinated debt, merge, consolidate, enter into acquisitions, and effect sale leaseback transactions.
F-23
Table of Contents
Index to Financial Statements
PHARMERICA CORPORATION
NOTES TO CONSOLIDATED FINANCIAL STATEMENTS—(Continued)
NOTE 5—CREDIT AGREEMENT (Continued)
Deferred Financing Fees
The Corporation capitalized a total of $2.0 million in deferred financing fees associated with the Credit Agreement and recorded them as other assets in the accompanying consolidated balance sheets. As of December 31, 2009 and 2010, the Corporation had $1.0 million and $0.3 million of unamortized deferred financing fees, respectively. The Corporation amortizes these deferred financing fees using the effective interest method.
NOTE 6—COMMITMENTS AND CONTINGENCIES
Legal Action and Regulatory
The Corporation is involved in certain legal actions and regulatory investigations arising in the ordinary course of business. None of these legal proceedings are, in the opinion of management, expected to have a material adverse effect on the consolidated financial position, results of operations, or liquidity of the Corporation.
FUL and AMP Changes
The 2010 Health Care Legislation amended the Deficit Reduction Act of 2005 (the “DRA”) to change the definition of the FUL by requiring the calculation of the FUL as no less than 175% of the weighted average, based on utilization, of the most recently reported monthly AMP for pharmaceutically and therapeutically equivalent multi-source drugs available through retail community pharmacies nationally.
In addition, the definition of AMP changed to reflect net sales only to drug wholesalers that distribute to retail community pharmacies and to retail community pharmacies that directly purchase from drug manufacturers. Further, the 2010 Health Care Legislation continues the current statutory exclusion of prompt pay discounts offered to wholesalers and adds three other exclusions to the AMP definition; i) bona fide services fees; ii) reimbursement for unsalable returned goods (recalled, expired, damaged, etc.); and iii) payments from and rebates/discounts to certain entities not conducting business as a wholesaler or retail community pharmacy. In addition to reporting monthly, the manufacturers will be required to report the total number of units used to calculate each monthly AMP. CMS will use this information when it establishes FULs as a result of the new volume-weighted requirements pursuant to the 2010 Health Care Legislation.
Manufacturers made their first reports of AMP to CMS in October 2010. CMS is reviewing the information reported by the manufacturers and has yet to revise the FUL based on its analysis of the AMP.
Until CMS provides additional guidance, the Corporation is unable to fully evaluate the impact of the changes in FUL and AMP to its business.
AWP Changes
Average wholesale price, or AWP, is a pricing benchmark published by First DataBank, Inc. in its Blue Book, which provides drug databases, content integration software, and drug reference products. AWP has been widely used to calculate the majority of the Medicaid, Medicare Part A and Medicare Part D drug reimbursements payable to pharmacy providers. In 2005, several pension funds brought an action against First DataBank and another healthcare provider alleging collusion to set AWPs for branded drugs.
F-24
Table of Contents
Index to Financial Statements
PHARMERICA CORPORATION
NOTES TO CONSOLIDATED FINANCIAL STATEMENTS—(Continued)
NOTE 6—COMMITMENTS AND CONTINGENCIES (Continued)
On March 30, 2009, the Court approved the settlement of the litigation. Pursuant to the settlement agreement dated September 26, 2009, First DataBank: (i) adjusted its reporting of Blue Book AWP for those prescription drugs (approximately 1,400 National Drug Codes, or NDCs in number) identified in the plaintiffs’ previously filed complaint by reducing the mark-up factor utilized in connection with the calculation of the Blue Book AWP data field to 1.20 times the Wholesale Acquisition Cost, or WAC, or direct price for those prescription drugs that are on a mark-up basis; and (ii) established a centralized data repository to facilitate reasonable access to discoverable material from First DataBank concerning its drug price reporting practices.
Independent of the settlement and on the same schedule as the Blue Book AWP adjustment noted above, First DataBank has applied the same 1.20 markup factor to all other NDCs, whose Blue Book AWP is set based upon a markup to WAC or direct price in excess of 1.20 times WAC. First DataBank will also independently discontinue publishing the Blue Book AWP data field for all drugs no later than September 26, 2011.
The Corporation and the preponderance of the Corporation’s PDPs, third party insurance companies and its Medicare Part A customers have voluntarily agreed to adjust reimbursement so that pricing would not increase or decrease as a result of the changes to AWP; however, the state Medicaid programs have been unwilling to remain price neutral.
Acquisitions
The Corporation has historically acquired the assets of businesses with prior operating histories. Acquired companies may have unknown or contingent liabilities, including liabilities for failure to comply with healthcare laws and regulations, medical, and general professional liabilities, workers’ compensation liabilities, previous tax liabilities, and unacceptable business practices. Although the Corporation institutes policies designed to conform practices to its standards following completion of acquisitions, there can be no assurance the Corporation will not become liable for past activities that may later be asserted to be improper by private plaintiffs or government agencies.
Although the Corporation generally seeks to obtain indemnification from prospective sellers covering such matters, there can be no assurance that any such matter will be covered by indemnification, or if covered, that such indemnification will be adequate to cover potential losses and fines. In the ordinary course of business, the Corporation enters into contracts containing standard indemnification provisions and indemnifications specific to a transaction such as business acquisitions and disposals of an operating facility. These indemnifications may cover claims against employment-related matters, governmental regulations, environmental issues, tax matters, as well as customer, third party payer, supplier, and contractual relationships. Obligations under these indemnities generally would be initiated by a breach of the terms of the contract or by a third party claim or event.
F-25
Table of Contents
Index to Financial Statements
PHARMERICA CORPORATION
NOTES TO CONSOLIDATED FINANCIAL STATEMENTS—(Continued)
NOTE 6—COMMITMENTS AND CONTINGENCIES (Continued)
Prime Vendor Agreement
At the consummation of the Pharmacy Transaction, the Corporation entered into a Prime Vendor Agreement (the “Prime Vendor Agreement”), with AmerisourceBergen Drug Corporation (“ABDC”), a wholly owned subsidiary of AmerisourceBergen. Pursuant to this agreement, the Corporation has agreed to purchase at least 95% of the Corporation’s prescription pharmaceutical drugs from ABDC and to participate in its generic formulary purchase program for a period of five years following the Closing Date. In addition, ABDC will support the distribution of pharmaceuticals that the Corporation purchases directly from manufacturers and provide inventory management support and packaging services.
The Corporation amended the Prime Vendor Agreement effective January 1, 2011, see Subsequent Events Note 14.
Information Technology Services Agreement
At the consummation of the Pharmacy Transaction, the Corporation entered into an Information Technology Services Agreement with Kindred Healthcare Operating, Inc. (“KHOI”), a wholly owned subsidiary of Kindred (the “IT Services Agreement”). Pursuant to this agreement, KHOI is the Corporation’s exclusive provider of certain information services and support related to information technology infrastructure and financial systems for a period of five years, ending on July 31, 2012. The services provided by KHOI include business services necessary to operate, manage, and support certain financial applications the Corporation uses, including enabling and/or supporting technology infrastructure and technology procurement services to support certain business functions. Such services include, among other matters, functions for financial management, systems, and payroll. The Corporation will support internally all other operating systems, including functions for order entry, pharmacy dispensing, clinical consulting, billing and collections, electronic medication management, sales and marketing, medical records management, human resources, internal and external customer call center support, and general business systems.
Except for certain services that will be provided at cost, KHOI will provide such services to the Corporation at its cost plus 10%, which will be the actual costs and expenses incurred in providing these services, including certain overhead costs and per hour costs of the KHOI employees providing the services. The initial term of the agreement is five years. The agreement will automatically renew for successive one-year periods after the expiration of the initial five year term, absent 120 days prior written notice of termination as provided for in the agreement. The IT Services Agreement may be terminated by either party for cause and, in certain circumstances, by the Corporation in the event that KHOI undergoes a change of control to one of the Corporation’s competitors. Following termination of the IT Services Agreement, KHOI must provide termination and expiration assistance for up to 180 days. The Corporation has incurred $17.3 million, $11.5 million, and $11.1 million in fees for the years ended December 31, 2008, 2009, and 2010, respectively, under the IT Services Agreement.
F-26
Table of Contents
Index to Financial Statements
PHARMERICA CORPORATION
NOTES TO CONSOLIDATED FINANCIAL STATEMENTS—(Continued)
NOTE 6—COMMITMENTS AND CONTINGENCIES (Continued)
Employment Agreements
The Corporation has entered into employment agreements with certain of its executive officers. During the employment period, certain executive officers will be eligible to (i) participate in any short-term and long-term incentive programs established or maintained by the Corporation, (ii) participate in all incentive, savings and retirement plans and programs of the Corporation, (iii) participate, along with their dependents, in all welfare benefit plans and programs provided by the Corporation, and (iv) receive four weeks of paid vacation per calendar year.
The type of compensation due to each of the executive officers in the event of the termination of their employment period varies depending on the nature of the termination. The employment agreements do not entitle the executive officers to any additional payment or benefits solely upon the occurrence of a change in control but do provide additional payments or benefits or both upon a termination of employment in connection with a change in control. Additionally, the vesting of certain equity based grants made to certain executive officers accelerate upon the occurrence of a change in control.
Leases
The Corporation leases real estate properties, buildings, vehicles, and equipment under cancelable and non-cancelable leases. The leases expire at various times and have various renewal options. Certain leases that meet the lease capitalization criteria have been recorded as an asset and liability at the net present value of the minimum lease payments at the inception of the lease. Interest rates used in computing the net present value of the lease payments are based on the Corporation’s incremental borrowing rate at the inception of the lease. The Corporation recorded the following lease expense for the periods presented (dollars in millions):
| 2008 | 2009 | 2010 | ||||||||||
| Pharmacy locations and administrative offices lease expense |
$ | 16.4 | $ | 13.9 | $ | 14.0 | ||||||
| Office equipment lease expense |
5.7 | 2.8 | 2.1 | |||||||||
| Total lease expense |
$ | 22.1 | $ | 16.7 | $ | 16.1 | ||||||
Future minimum lease payments for those leases having an initial or remaining non-cancelable lease term in excess of one year are as follows for the years indicated (dollars in millions):
| Year Ending December 31, |
Operating Leases |
Capital Lease Obligations |
Total | |||||||||
| 2011 |
$ | 13.9 | $ | 0.8 | $ | 14.7 | ||||||
| 2012 |
10.4 | 0.2 | 10.6 | |||||||||
| 2013 |
8.4 | — | 8.4 | |||||||||
| 2014 |
5.7 | — | 5.7 | |||||||||
| 2015 |
4.1 | — | 4.1 | |||||||||
| Thereafter |
17.8 | — | 17.8 | |||||||||
| Total |
$ | 60.3 | $ | 1.0 | $ | 61.3 | ||||||
F-27
Table of Contents
Index to Financial Statements
PHARMERICA CORPORATION
NOTES TO CONSOLIDATED FINANCIAL STATEMENTS—(Continued)
NOTE 7—REVENUES
The Corporation recognizes revenues at the time services are provided or products are delivered. A significant portion of these revenues are billed to PDPs under Medicare Part D, the state Medicaid programs, long-term care institutions, third party insurance companies, and private payers. Some claims are electronically adjudicated through online processing at the point the prescription is dispensed such that the Corporation’s operating system is automatically updated with the actual amount to be reimbursed. As a result, revenues and the associated receivables are based upon the actual reimbursement to be received by the Corporation. For claims that are adjudicated on-line and are rejected or otherwise denied upon submission, the Corporation provides contractual allowances based upon historical trends, contractual reimbursement terms and other factors which may impact ultimate reimbursement. Amounts are adjusted to actual reimbursed amounts upon cash receipt.
Under the Medicare Part D benefit, payment is determined in accordance with the agreements the Corporation has negotiated with the Medicare Part D Plans. The remainder of the Corporation’s billings are paid or reimbursed by individual residents, long-term care facilities (including revenues for residents funded under Medicare Part A), and other third party payers, including Medicaid and private insurers.
The Medicaid and Medicare programs are highly regulated. The failure, even if inadvertent, of the Corporation and/or client facilities to comply with applicable reimbursement regulations could adversely affect the Corporation’s reimbursement under these programs and the Corporation’s ability to continue to participate in these programs. In addition, failure to comply with these regulations could subject the Corporation to other penalties.
As noted, the Corporation obtains reimbursement for drugs it provides to enrollees of a given Medicare Part D Plan in accordance with the terms of the agreement negotiated between it and that Medicare Part D Plan. The Corporation has entered into such agreements with nearly all Medicare Part D Plan sponsors under which it will provide drugs and associated services to their enrollees. The Corporation in the ordinary course of business has ongoing discussions with Medicare Part D Plans and may, as appropriate, renegotiate agreements.
The Corporation’s hospital pharmacy management revenues represent contractually defined management fees and the reimbursement of costs associated with the direct operations of hospital pharmacies, which are primarily comprised of personnel costs.
A summary of revenues by payer type follows (dollars in millions):
| 2008 | 2009 | 2010 | ||||||||||||||||||||||
| Amount | % of Revenues |
Amount | % of Revenues |
Amount | % of Revenues |
|||||||||||||||||||
| Medicare Part D |
$ | 885.8 | 45.5 | % | $ | 852.6 | 46.3 | % | $ | 859.2 | 46.5 | % | ||||||||||||
| Institutional healthcare providers |
577.2 | 29.7 | 545.6 | 29.6 | 556.2 | 30.1 | ||||||||||||||||||
| Medicaid |
181.1 | 9.3 | 165.8 | 9.0 | 169.5 | 9.2 | ||||||||||||||||||
| Private and other |
133.2 | 6.8 | 122.4 | 6.6 | 107.3 | 5.8 | ||||||||||||||||||
| Insured |
101.4 | 5.2 | 91.5 | 5.0 | 89.8 | 4.9 | ||||||||||||||||||
| Medicare |
10.1 | 0.5 | 6.8 | 0.4 | 7.4 | 0.4 | ||||||||||||||||||
| Hospital management fees |
58.5 | 3.0 | 56.5 | 3.1 | 57.9 | 3.1 | ||||||||||||||||||
| Total |
$ | 1,947.3 | 100.0 | % | $ | 1,841.2 | 100.0 | % | $ | 1,847.3 | 100.0 | % | ||||||||||||
F-28
Table of Contents
Index to Financial Statements
PHARMERICA CORPORATION
NOTES TO CONSOLIDATED FINANCIAL STATEMENTS—(Continued)
NOTE 7—REVENUES (Continued)
Co-payments for the Corporation’s services can be applicable under Medicare Part D, the state Medicaid programs, and certain third party payers and are typically not collected at the time products are delivered or services are provided. Co-payments under the Medicaid programs and third party plans are generally billed to the responsible party as part of the Corporation’s normal billing procedures and are subject to the Corporation’s normal collection procedures.
Under Medicare Part D, co-payments related to institutional residents who are both Medicare and Medicaid eligible (“dual eligible”) are due from the responsible party for up to the first thirty days of a beneficiary’s stay in a skilled nursing facility, subsequent to which the PDPs are responsible for reimbursement.
Under certain circumstances, including state-mandated return policies under various Medicaid programs, the Corporation accepts returns of medications and issues a credit memorandum to the applicable payer. Product returns are processed in the period in which the return is accepted by the Corporation. A reserve has been established for such returns based on historical trends.
NOTE 8—INTEGRATION, MERGER AND ACQUISITION RELATED COSTS AND OTHER CHARGES
In fiscal year 2007, we began the integration of our pharmacy operating systems which continued through 2010. The Corporation expects to continue to incur costs related to the integration of its pharmacy operating systems during fiscal 2011. In addition, the Corporation also incurs and will continue to incur costs related to acquisitions.
The following is a summary of integration, merger and acquisition related costs and other charges incurred by the Corporation (dollars in millions):
| Years Ended December 31, | ||||||||||||
| 2008 | 2009 | 2010 | ||||||||||
| Integration costs and other charges: |
||||||||||||
| Pre-Pharmacy litigation matters |
$ | — | $ | — | $ | 5.0 | ||||||
| Professional and advisory fees |
1.7 | 0.2 | 2.3 | |||||||||
| General and administrative |
3.2 | 0.8 | 0.7 | |||||||||
| Employee costs |
7.2 | 1.5 | 0.5 | |||||||||
| Severance costs |
5.3 | 0.9 | 0.6 | |||||||||
| Facility costs |
9.3 | 0.8 | 0.3 | |||||||||
| 26.7 | 4.2 | 9.4 | ||||||||||
| Acquisition related costs: |
||||||||||||
| Professional and advisory fees |
— | 1.0 | 3.5 | |||||||||
| General and administrative |
— | — | 1.5 | |||||||||
| Employee costs |
— | — | 0.4 | |||||||||
| Facility costs |
— | — | 1.3 | |||||||||
| Contingent consideration |
— | — | (1.7 | ) | ||||||||
| Other costs |
— | — | 0.2 | |||||||||
| — | 1.0 | 5.2 | ||||||||||
| Total integration, merger and acquisition related costs and other charges |
$ | 26.7 | $ | 5.2 | $ | 14.6 | ||||||
| Negative effect on earnings per diluted share |
$ | (0.53 | ) | $ | (0.10 | ) | $ | (0.29 | ) | |||
F-29
Table of Contents
Index to Financial Statements
PHARMERICA CORPORATION
NOTES TO CONSOLIDATED FINANCIAL STATEMENTS—(Continued)
NOTE 9—COMMON STOCK, PREFERRED STOCK, TREASURY STOCK, STOCK-BASED COMPENSATION AND OTHER BENEFITS
Common Stock
Holders of the Corporation’s common stock are entitled to one vote for each share held of record on all matters on which stockholders may vote. There are no preemptive, conversion, redemption or sinking fund provisions applicable to our common stock. In the event of liquidation, dissolution or winding up, holders of common stock are entitled to share ratably in the assets available for distribution, subject to any prior rights of any holders of preferred stock then outstanding. Delaware law prohibits the Corporation from paying any dividends unless it has capital surplus or net profits available for this purpose. In addition, the Corporation’s Credit Agreement imposes restrictions on its ability to pay dividends.
Preferred Stock
The certificate of incorporation authorizes the issuance of an aggregate of 1.0 million shares of preferred stock. As of December 31, 2010, there were no shares of preferred stock outstanding.
Our Board of Directors may, from time to time, direct the issuance of shares of preferred stock in series and may, at the time of issuance, determine the designation, powers, rights, preferences and limitations of each series. Satisfaction of any dividend preferences of outstanding preferred stock would reduce the amount of funds available for the payment of dividends on our shares of common stock. Holders of preferred stock may be entitled to receive a preference payment in the event of any liquidation, dissolution or winding-up of the Corporation before any payment is made to the holders of our common stock. Under certain circumstances, the issuance of preferred stock may render more difficult or tend to discourage a merger, tender offer or proxy contest, the assumption of control by a holder of a large block of the Corporation’s securities or the removal of incumbent management. The Board of Directors may issue shares of preferred stock with voting and conversion rights that could adversely affect the holders of shares of our common stock. Specifically, our certificate of incorporation authorizes our board to adopt a rights plan without stockholder approval. This could delay or prevent a change in control of us or the removal of existing management.
Treasury Stock Purchases
In August 2010, the Board of Directors authorized a share repurchase of up to $25.0 million of the Corporation’s common stock. Share repurchases under this authorization may be made in the open market through unsolicited or solicited privately negotiated transactions, or in such other appropriate manner, and will be funded from available cash. The amount and timing of the repurchases will be determined by the Corporation’s management and will depend on a variety of factors including price, corporate and regulatory requirements, capital availability and other market conditions. Common stock acquired through the share repurchase program will be held as treasury shares and may be used for general corporate purposes, including reissuances in connection with acquisitions, employee stock option exercises or other employee stock plans. The share repurchase program does not have an expiration date and may be limited, terminated or extended at any time without prior notice. During the year ended December 31, 2010, the Corporation repurchased 1,327,803 shares of common stock for an aggregate purchase price, including commissions, of $10.5 million at an average purchase price of $7.90 per share.
Additionally, the Corporation may redeem shares from employees upon the vesting of the Corporation’s stock awards for minimum statutory tax withholding purposes. The Corporation redeemed 9,014 shares of certain vested awards for an aggregate price of less than $0.1 million, during the year ended December 31, 2010. These shares have also been designated by the Corporation as treasury stock.
As of December 31, 2010, the Corporation had a total of 1,336,817 shares held as treasury stock.
F-30
Table of Contents
Index to Financial Statements
PHARMERICA CORPORATION
NOTES TO CONSOLIDATED FINANCIAL STATEMENTS—(Continued)
NOTE 9—COMMON STOCK, PREFERRED STOCK, TREASURY STOCK, STOCK-BASED COMPENSATION AND OTHER BENEFITS (Continued)
Amended and Restated 2007 Omnibus Incentive Plan
The Corporation has adopted the Amended and Restated PharMerica Corporation 2007 Omnibus Incentive Plan (as amended and restated, the “Omnibus Plan”) under which the Corporation is authorized to grant equity-based and other awards to its employees, officers, directors, and consultants. In connection with the Corporation’s 2010 Annual Meeting of Stockholders, the stockholders of the Corporation approved and adopted the amended and restated Omnibus Plan to, among other things, implement a “fungible share
pool” effective as of January 1, 2010, and preserve preferential tax treatment as “qualified performance-based compensation” under Section 162(m) of the Internal Revenue Code.
The Corporation has reserved 7,237,000 shares of its common stock for awards to be granted under the Omnibus Plan plus 534,642 shares reserved for substitute equity awards for former employees of KPS and PharMerica LTC. Under the “fungible share pool,” one share of stock will be subtracted from the share limit for each share of stock covered by a stock option or stock appreciation right award and 1.65 shares of stock will be subtracted from the share limit for each share of stock covered by any full-value award, including restricted stock awards, restricted stock units and performance share awards at target. The following shares are not available for re-grant under the Omnibus Plan: (i) shares tendered by a participant or withheld by the Corporation to pay the purchase price of a stock option award or to satisfy taxes owed with respect to an award, (ii) shares subject to a stock appreciation right that are not issued in connection with such award’s settlement upon the exercise thereof, and (iii) shares reacquired by the Corporation using cash proceeds received by the Corporation from the exercise of stock options. Effective January 1, 2010, shares subject to an award that is forfeited, expired or settled for cash, are available for re-grant under the Omnibus Plan as one share of stock for each share of stock covered by a stock option or appreciation right and 1.65 shares of stock for each share of stock covered by any other type of award.
The Corporation’s Compensation Committee administers the Omnibus Plan and has the authority to determine the recipient of the awards, the types of awards, the number of shares covered, and the terms and conditions of the awards. The Omnibus Plan allows for grants of incentive stock options, non-qualified stock options, stock appreciation rights, restricted stock and restricted stock units, deferred shares, performance awards, including cash bonus awards, and other stock-based awards.
Stock options granted to officers and employees under the Omnibus Plan generally vest in four equal annual installments and have a term of seven years. The restricted stock granted to officers and employees generally vests in full upon the three-year anniversary of the date of grant. The restricted stock units granted to officers generally vest in two equal annual installments. The restricted stock grant to members of the Board of Directors vests in three equal annual installments. The restricted stock units granted to members of the Board of Directors vest in one annual installment. The performance share units granted under the Omnibus Plan vest based upon the achievement of a target amount of the Corporation’s earnings before interest, income taxes, depreciation and amortization, integration, merger and acquisition related costs and other charges, impairment of intangible assets, and any changes in accounting principles, which reinforces the importance of achieving the Corporation’s profitability objectives. The performance is generally measured over a three-year period.
As of December 31, 2010, total shares available for grants of stock-based awards pursuant to the Omnibus Plan were 4,214,058 shares.
F-31
Table of Contents
Index to Financial Statements
PHARMERICA CORPORATION
NOTES TO CONSOLIDATED FINANCIAL STATEMENTS—(Continued)
NOTE 9—COMMON STOCK, PREFERRED STOCK, TREASURY STOCK, STOCK-BASED COMPENSATION AND OTHER BENEFITS (Continued)
Stock-Based Compensation Expense
The following is a summary of stock-based compensation incurred by the Corporation (dollars in millions):
| Years Ended December 31, | ||||||||||||
| 2008 | 2009 | 2010 | ||||||||||
| Stock option compensation expense |
$ | 2.6 | $ | 2.1 | $ | 2.6 | ||||||
| Nonvested stock compensation expense |
2.3 | 2.5 | 2.2 | |||||||||
| Total Stock Compensation Expense |
$ | 4.9 | $ | 4.6 | $ | 4.8 | ||||||
As of December 31, 2010, there was $6.5 million of total unrecognized compensation cost related to the Corporation’s stock compensation arrangements. Total unrecognized compensation cost will be adjusted for future changes in estimated forfeitures.
Total estimated stock-based compensation expense for the Corporation’s stock options and nonvested stock awards for the next five years and thereafter are as follows (dollars in millions):
| Stock Options | Nonvested Restricted Stock |
Nonvested Restricted Stock Units |
Total | |||||||||||||
| Year Ending December 31, |
||||||||||||||||
| 2011 |
$ | 2.1 | $ | 0.6 | $ | 0.9 | $ | 3.6 | ||||||||
| 2012 |
1.6 | 0.1 | — | 1.7 | ||||||||||||
| 2013 |
1.0 | — | — | 1.0 | ||||||||||||
| 2014 |
0.2 | — | — | 0.2 | ||||||||||||
| 2015 |
— | — | — | — | ||||||||||||
| Thereafter |
— | — | — | — | ||||||||||||
| Total |
$ | 4.9 | $ | 0.7 | $ | 0.9 | $ | 6.5 | ||||||||
The following weighted average assumptions were used to estimate the fair value of options granted during the periods presented, using the Black-Scholes-Merton option valuation model:
| 2008 | 2009 | 2010 | ||||||||||
| Expected volatility (range) |
33.3-41.7 | % | 36.36-41.07 | % | 38.53-45.54 | % | ||||||
| Risk free interest rate (range) |
1.53-2.45 | % | 0.75-2.09 | % | 0.49-2.47 | % | ||||||
| Expected dividends |
— | — | — | |||||||||
| Average expected term (years) |
2.0-5.0 | 2.0-5.0 | 2.0-5.0 | |||||||||
| Average fair value per share of stock options granted based on the Black-Scholes- |
$ | 4.67 | $ | 4.40 | $ | 5.79 | ||||||
| Weighted average fair value of options granted during the year (in millions) |
$ | 1.5 | $ | 2.5 | $ | 3.3 | ||||||
F-32
Table of Contents
Index to Financial Statements
PHARMERICA CORPORATION
NOTES TO CONSOLIDATED FINANCIAL STATEMENTS—(Continued)
NOTE 9—COMMON STOCK, PREFERRED STOCK, TREASURY STOCK, STOCK-BASED COMPENSATION AND OTHER BENEFITS (Continued)
Expected Volatility
Volatility is a measure of the tendency of investment returns to vary around a long-term average rate. Historical volatility is an appropriate starting point for setting this assumption. The Corporation also considers how future experience may differ from the past. This may require using other factors to adjust historical volatility, such as implied volatility, peer-group volatility and the range and mean-reversion of volatility estimates over various historical periods. The peer-group utilized consisted of fourteen companies in 2009 and 2010, in the same or similar industries as the Corporation. In addition, if a best estimate cannot be made, management uses the mid-point in the range of reasonable estimates for volatility. The Corporation estimates the volatility of its common stock in conjunction with the Corporation’s annual grant and volatility is calculated utilizing the historical volatility of the Corporation and its peer-group. To the extent material grants are made subsequent to the Corporation’s annual grant, the volatility calculation is updated through the most recent grant date of the awards.
Risk-Free Interest Rate
The risk-free rate is based on the U.S. Treasury yield curve in effect at the time of grant for the expected term of the option.
Expected Dividends
The Corporation has never paid any cash dividends on its common stock and does not anticipate paying any cash dividends in the foreseeable future. Consequently, it uses an expected dividend yield of zero.
Expected Term
The Corporation calculated an expected term using management’s estimate and expectation of option exercises. The majority of the Corporation’s stock options are on a graded-vesting schedule. The Corporation estimates the value of awards with graded vesting by treating each vesting tranche as a separate award. Management has determined to value each tranche of the awards separately utilizing a “multiple fair value” method.
F-33
Table of Contents
Index to Financial Statements
PHARMERICA CORPORATION
NOTES TO CONSOLIDATED FINANCIAL STATEMENTS—(Continued)
NOTE 9—COMMON STOCK, PREFERRED STOCK, TREASURY STOCK, STOCK-BASED COMPENSATION AND OTHER BENEFITS (Continued)
Stock Option Activity
The following table summarizes option activity for the periods presented:
| Number of Shares |
Weighted- Average Exercise Price Per Share |
Weighted- Average Remaining Term |
Aggregate Instrinsic Value (in millions) |
|||||||||||||
| Outstanding shares at December 31, 2007 |
1,270,383 | $ | 15.23 | 6.8 years | ||||||||||||
| Granted |
324,507 | 15.65 | ||||||||||||||
| Exercised |
(67,878 | ) | 13.28 | |||||||||||||
| Canceled |
(194,363 | ) | 14.88 | |||||||||||||
| Outstanding shares at December 31, 2008 |
1,332,649 | $ | 15.47 | 5.7 years | $ | 0.9 | ||||||||||
| Granted |
567,633 | 15.18 | ||||||||||||||
| Exercised |
(107,308 | ) | 12.69 | |||||||||||||
| Canceled |
(59,649 | ) | 14.63 | |||||||||||||
| Outstanding shares at December 31, 2009 |
1,733,325 | $ | 15.60 | 5.2 years | $ | 1.0 | ||||||||||
| Granted |
562,993 | 18.27 | ||||||||||||||
| Exercised |
(22,072 | ) | 12.66 | |||||||||||||
| Canceled |
(50,503 | ) | 16.60 | |||||||||||||
| Outstanding shares at December 31, 2010 |
2,223,743 | $ | 16.28 | 4.7 years | $ | 0.1 | ||||||||||
| Exercisable shares at December 31, 2010 |
1,054,975 | $ | 15.74 | 3.9 years | $ | — | ||||||||||
| Expired shares during 2010 |
10,052 | $ | 14.53 | |||||||||||||
The total intrinsic value of stock options exercised for the years ended December 31, 2008, 2009, and 2010 was $0.5 million, $0.8 million, and $0.1 million, respectively. Cash received from stock option exercises during the year ended December 31, 2010 was $0.3 million. The total fair value of options vested for the years ended December 31, 2008, 2009, and 2010 was $1.9 million, $2.1 million, and $2.3 million, respectively. The Corporation expects to recognize stock based compensation expense for stock options over a weighted average period of 1.83 years.
F-34
Table of Contents
Index to Financial Statements
PHARMERICA CORPORATION
NOTES TO CONSOLIDATED FINANCIAL STATEMENTS—(Continued)
NOTE 9—COMMON STOCK, PREFERRED STOCK, TREASURY STOCK, STOCK-BASED COMPENSATION AND OTHER BENEFITS (Continued)
Nonvested Shares
The following table summarizes nonvested share activity for the periods presented:
| Number of Shares |
Weighted-Average Grant Date Fair Value |
|||||||
| Outstanding shares at December 31, 2007 |
360,904 | $ | 15.13 | |||||
| Granted—Restricted Stock |
72,548 | 18.40 | ||||||
| Granted—Performance Share Units |
68,275 | 15.17 | ||||||
| Forfeited |
(33,578 | ) | 12.84 | |||||
| Vested |
(125,558 | ) | 16.23 | |||||
| Outstanding shares at December 31, 2008 |
342,591 | $ | 15.93 | |||||
| Granted—Restricted Stock |
35,633 | 17.96 | ||||||
| Granted—Restricted Stock Units |
99,332 | 15.06 | ||||||
| Granted—Performance Share Units |
152,580 | 15.16 | ||||||
| Forfeited |
(11,533 | ) | 14.52 | |||||
| Vested |
(84,201 | ) | 14.34 | |||||
| Outstanding shares at December 31, 2009 |
534,402 | $ | 15.98 | |||||
| Granted—Restricted Stock Units |
39,144 | 16.35 | ||||||
| Granted—Performance Share Units |
178,472 | 18.00 | ||||||
| Forfeited |
(70,387 | ) | 15.52 | |||||
| Vested |
(191,776 | ) | 16.20 | |||||
| Outstanding shares at December 31, 2010 |
489,855 | $ | 16.72 | |||||
The total fair value of shares vested for the years ended December 31, 2008, 2009, and 2010 was $2.0 million, $1.2 million, and $3.1 million, respectively. The Corporation expects to recognize stock based compensation expense for nonvested shares over a weighted average period of less than one year.
Based upon the achievement of the performance criteria at the end of the performance cycle for the performance share units issued to date, the Corporation may issue no shares or a maximum of 539,110 shares.
401K Plan
The Corporation sponsors a defined contribution retirement plan for all eligible employees, as defined in the plan document. The plan is qualified under Section 401(k) of the Internal Revenue Code. Contributions to the plan are based upon employee contributions and the Corporation’s matching contributions. For the years ended December 31, 2008, 2009, and 2010, the Corporation’s matching contributions to the plan were $5.9 million, $5.3 million, and $5.1 million, respectively.
F-35
Table of Contents
Index to Financial Statements
PHARMERICA CORPORATION
NOTES TO CONSOLIDATED FINANCIAL STATEMENTS—(Continued)
NOTE 9—COMMON STOCK, PREFERRED STOCK, TREASURY STOCK, STOCK-BASED COMPENSATION AND OTHER BENEFITS (Continued)
Deferred Compensation Plans
The Corporation maintains an unfunded deferred compensation plan for certain management and highly compensated employees. Under the plan, a participant may elect to defer up to 50% of such participant’s annual base salary and up to 100% of such participant’s annual short-term incentive program cash bonus into the plan during each plan year. In addition, the Corporation may, in its sole discretion, make discretionary contributions to a participant’s account.
The Corporation also maintains a deferred compensation plan for the directors of the Corporation. The directors of the Corporation may elect to defer up to 100% of their cash fees and their stock fees in any one year. If a director elects to defer his/her restricted stock grant, the stock will be deferred as it vests until the participant elects for the deferred compensation to be a taxable event.
As of December 31, 2009 and 2010, the Corporation had $2.9 million and $4.0 million, respectively, recognized as a long-term liability related to the deferred compensation plans in the accompanying consolidated balance sheets.
NOTE 10—INCOME TAXES
The provision for income taxes is based upon the Corporation’s estimate of annual taxable income or loss for each respective accounting period. The following table summarizes our provision for income taxes for the periods presented (dollars in millions):
| 2008 | 2009 | 2010 | ||||||||||
| Current provision: |
||||||||||||
| Federal |
$ | — | $ | 0.2 | $ | — | ||||||
| State |
0.5 | 0.5 | 0.3 | |||||||||
| Total |
0.5 | 0.7 | 0.3 | |||||||||
| Deferred provision (benefit): |
||||||||||||
| Federal |
2.6 | 21.9 | 11.4 | |||||||||
| State |
0.2 | (3.7 | ) | 1.3 | ||||||||
| Total |
2.8 | 18.2 | 12.7 | |||||||||
| Total provision (benefit) for income taxes |
$ | 3.3 | $ | 18.9 | $ | 13.0 | ||||||
A reconciliation of the Corporation’s effective tax rate and the U.S. statutory rate is as follows for the years ended December 31:
| 2008 | 2009 | 2010 | ||||||||||
| U.S. statutory rate applied to pretax income (loss) |
35.0 | % | 35.0 | % | 35.0 | % | ||||||
| Differential arising from: |
||||||||||||
| State taxes |
5.6 | 4.5 | 4.7 | |||||||||
| Valuation Allowance |
— | (7.9 | ) | — | ||||||||
| Other |
(0.9 | ) | (0.7 | ) | 0.5 | |||||||
| Effective tax rate |
39.7 | % | 30.9 | % | 40.2 | % | ||||||
F-36
Table of Contents
Index to Financial Statements
PHARMERICA CORPORATION
NOTES TO CONSOLIDATED FINANCIAL STATEMENTS—(Continued)
NOTE 10—INCOME TAXES (Continued)
The provision for income taxes as a percentage of taxable income for the year ended December 31, 2010 was significantly higher than the year ended December 31, 2009 due to a discrete tax benefit recorded in the third quarter of 2009 related to the adoption of an internal legal entity restructuring plan. Excluding the one-time benefits associated with the Corporation’s legal entity restructuring activities, the provision for income taxes for the year ended December 31, 2009 would have been $24.6 million (40.2% of income). Apart from the discrete tax benefit recorded as a result of the internal restructuring, the effective tax rates in 2010 and 2009 are higher than the federal statutory rate largely as a result of the combined impact of state and local taxes and various non-deductible expenses.
The Corporation derives a current federal and state income tax benefit from the impact of deductions associated with the amortization of tax deductible goodwill acquired through business combinations. As of December 31, 2009 and 2010, the tax basis of the Corporation’s tax deductible goodwill was approximately $113.9 million and $130.9 million, respectively. The future tax benefits of the tax-deductible goodwill are included in the Corporation’s deferred tax assets.
The Corporation recognizes an asset or liability for the deferred tax consequences of temporary differences between the tax basis of assets and liabilities and their reported amounts in the financial statements. These temporary differences will result in taxable or deductible amounts in future years when the reported amounts of the assets are recovered or liabilities are settled. The Corporation also recognizes as deferred tax assets the future tax benefits from net operating and capital loss carryforwards. As of December 31, 2010, the Corporation has tax benefits from federal net operating loss carryforwards of $23.9 million and tax benefits from state net operating loss carryforwards of $11.0 million, net of valuation allowances. The net operating losses have carryforward periods ranging from 1 to 20 years depending on the taxing jurisdiction.
A valuation allowance is provided for the Corporation’s deferred tax assets if it is more likely than not that some portion or all of the net deferred tax assets will not be realized. As of December 31, 2009 and 2010, the Corporation recognized deferred tax assets totaling $60.8 million and $48.4 million, net of valuation allowances of $1.7 million and $1.6 million, respectively.
Current deferred income taxes consisted of (dollars in millions):
| December 31, 2009 | December 31, 2010 | |||||||||||||||
| Assets | Liabilities | Assets | Liabilities | |||||||||||||
| Accrued expenses |
$ | 6.3 | $ | — | $ | 3.2 | $ | — | ||||||||
| Allowance for doubtful accounts |
13.5 | — | 13.0 | — | ||||||||||||
| Net operating losses |
17.6 | — | 5.5 | — | ||||||||||||
| Other |
3.0 | — | 2.3 | — | ||||||||||||
| Valuation allowance |
(0.6 | ) | — | (0.5 | ) | — | ||||||||||
| Total current deferred taxes |
$ | 39.8 | $ | — | $ | 23.5 | $ | — | ||||||||
F-37
Table of Contents
Index to Financial Statements
PHARMERICA CORPORATION
NOTES TO CONSOLIDATED FINANCIAL STATEMENTS—(Continued)
NOTE 10—INCOME TAXES (Continued)
Noncurrent deferred income taxes consisted of (dollars in millions):
| December 31, 2009 | December 31, 2010 | |||||||||||||||
| Assets | Liabilities | Assets | Liabilities | |||||||||||||
| Accelerated depreciation |
$ | — | $ | 5.8 | $ | — | $ | 9.2 | ||||||||
| Stock-based compensation |
2.6 | — | 3.3 | — | ||||||||||||
| Goodwill and intangibles |
13.7 | — | — | 2.9 | ||||||||||||
| Net operating losses |
8.8 | — | 31.0 | — | ||||||||||||
| Other |
3.9 | 1.1 | 4.2 | 0.4 | ||||||||||||
| Valuation allowances |
(1.1 | ) | — | (1.1 | ) | — | ||||||||||
| Total noncurrent deferred taxes |
$ | 27.9 | $ | 6.9 | $ | 37.4 | $ | 12.5 | ||||||||
| Noncurrent deferred taxes, net |
$ | 21.0 | $ | 24.9 | ||||||||||||
As of December 31, 2009 and 2010, the Corporation had $1.6 million and $1.2 million, respectively, recorded as a liability for unrecognized tax benefits for U.S. Federal and State tax jurisdictions. The net decrease of $0.4 million for the year ended December 31, 2010 was primarily due to statute of limitations expirations in certain states. The total amount of unrecognized tax benefits at December 31, 2010 that, if recognized, would affect the tax rate is $1.2 million.
It is the Corporation’s policy to accrue interest and penalties related to liabilities for income tax contingencies in the provision for income taxes. As of December 31, 2010, the Corporation had no accrued interest or penalties related to uncertain tax positions, as it has sufficient net operating losses to offset any liability that potentially could be asserted by a tax authority related to uncertain tax positions.
The federal statute of limitations remains open for tax years 2006 through 2009. The Corporation’s consolidated U.S. income tax returns for 2007 and 2008 are currently under examination by the IRS. State tax jurisdictions generally have statutes of limitations ranging from three to five years. The Corporation is no longer subject to state and local income tax examinations by tax authorities for years before 2005. The state income tax impact of federal income tax changes remains subject to examination by various states for a period of up to one year after formal notification of IRS settlement to the states. Kindred and AmerisourceBergen are responsible for any taxes that relate to periods prior to the 2007 Pharmacy Transaction.
F-38
Table of Contents
Index to Financial Statements
PHARMERICA CORPORATION
NOTES TO CONSOLIDATED FINANCIAL STATEMENTS—(Continued)
NOTE 11—EARNINGS PER SHARE
The following table sets forth the computation of basic and diluted earnings per share (dollars in millions, except per share amounts):
| 2008 | 2009 | 2010 | ||||||||||
| Numerator: |
||||||||||||
| Numerator for basic and earnings per diluted share—net income |
$ | 5.0 | $ | 42.2 | $ | 19.2 | ||||||
| Denominator: |
||||||||||||
| Denominator for basic earnings per share—weighted average shares |
30,095,582 | 30,266,272 | 30,007,268 | |||||||||
| Effective of dilutive securities: |
||||||||||||
| Employee stock options |
45,285 | 47,845 | 14,085 | |||||||||
| Employee restricted shares |
50,026 | 84,173 | 111,678 | |||||||||
| Employee performance share units |
— | 4,478 | — | |||||||||
| Denominator for earnings per diluted share—adjusted weighted average shares |
30,190,893 | 30,402,768 | 30,133,031 | |||||||||
| Basic earnings per share |
$ | 0.17 | $ | 1.39 | $ | 0.64 | ||||||
| Earnings per diluted share |
$ | 0.17 | $ | 1.39 | $ | 0.64 | ||||||
| Unexercised employee stock options and unvested restricted shares excluded from the effect of dilutive securities above (a) |
1,072,446 | 1,497,083 | 2,086,320 | |||||||||
| (a) | These unexercised employee stock options and unvested restricted shares were not included in the computation of diluted earnings per share because to do so would have been anti-dilutive for the periods presented. |
Stock options and restricted shares and units granted by the Corporation are treated as potential common shares outstanding in computing earnings per diluted share. Performance share units are treated as potential common shares outstanding in computing earnings per diluted share only when they are probable to vest.
Common shares repurchased by the Corporation reduced the number of basic shares used in the denominator for basic and diluted earnings per share.
NOTE 12—BUSINESS SEGMENT DATA
The Corporation operates in two reportable business segments: institutional pharmacies and hospital pharmacy management. Institutional pharmacies provide pharmacy services to nursing centers and other healthcare providers and the hospital pharmacy management business provides management services to substantially all of Kindred’s hospitals. For business segment reporting purposes, the Corporation defines segment operating income as earnings before interest, income taxes, depreciation, amortization, integration, merger and acquisition related costs, and other charges, and rent. Segment operating income reported for each of the Corporation’s business segments excludes the allocation of corporate overhead.
F-39
Table of Contents
Index to Financial Statements
PHARMERICA CORPORATION
NOTES TO CONSOLIDATED FINANCIAL STATEMENTS—(Continued)
NOTE 12—BUSINESS SEGMENT DATA (Continued)
The following table sets forth the assets and goodwill amounts by reportable segment (dollars in millions):
| December 31, 2009 |
December 31, 2010 |
|||||||
| Assets: |
||||||||
| Institutional pharmacies |
$ | 716.1 | $ | 750.7 | ||||
| Hospital pharmacy management |
8.2 | 9.2 | ||||||
| $ | 724.3 | $ | 759.9 | |||||
| Goodwill: |
||||||||
| Institutional pharmacies |
$ | 140.1 | $ | 193.9 | ||||
| Hospital pharmacy management |
— | — | ||||||
| $ | 140.1 | $ | 193.9 | |||||
F-40
Table of Contents
Index to Financial Statements
PHARMERICA CORPORATION
NOTES TO CONSOLIDATED FINANCIAL STATEMENTS—(Continued)
NOTE 12—BUSINESS SEGMENT DATA (Continued)
The following table sets forth income statement information by reportable segment (dollars in millions):
| Year Ended December 31, | ||||||||||||
| 2008 | 2009 | 2010 | ||||||||||
| Revenues: |
||||||||||||
| Institutional pharmacies |
$ | 1,888.8 | $ | 1,784.7 | $ | 1,789.4 | ||||||
| Hospital pharmacy management |
58.5 | 56.5 | 57.9 | |||||||||
| $ | 1,947.3 | $ | 1,841.2 | $ | 1,847.3 | |||||||
| Net income: |
||||||||||||
| Segment operating income: |
||||||||||||
| Institutional pharmacies |
$ | 105.6 | $ | 113.3 | $ | 89.0 | ||||||
| Hospital pharmacy management |
9.0 | 6.1 | 5.6 | |||||||||
| Segment operating income |
114.6 | 119.4 | 94.6 | |||||||||
| Rent |
22.1 | 16.7 | 16.1 | |||||||||
| Depreciation and amortization |
28.5 | 27.0 | 28.1 | |||||||||
| Impairment of intangible assets |
14.8 | — | — | |||||||||
| Integration, merger and acquisition related costs and other charges |
26.7 | 5.2 | 14.6 | |||||||||
| Interest expense, net |
14.2 | 9.4 | 3.6 | |||||||||
| Income before income taxes |
8.3 | 61.1 | 32.2 | |||||||||
| Provision for income taxes |
3.3 | 18.9 | 13.0 | |||||||||
| Net income |
$ | 5.0 | $ | 42.2 | $ | 19.2 | ||||||
| Rent: |
||||||||||||
| Institutional pharmacies |
$ | 22.0 | $ | 16.6 | $ | 16.0 | ||||||
| Hospital pharmacy management |
0.1 | 0.1 | 0.1 | |||||||||
| $ | 22.1 | $ | 16.7 | $ | 16.1 | |||||||
| Depreciation and amortization: |
||||||||||||
| Institutional pharmacies |
$ | 28.4 | $ | 27.0 | $ | 28.1 | ||||||
| Hospital pharmacy management |
0.1 | — | — | |||||||||
| $ | 28.5 | $ | 27.0 | $ | 28.1 | |||||||
| Capital expenditures, excluding acquisitions: |
||||||||||||
| Institutional pharmacies |
$ | 22.1 | $ | 21.6 | $ | 12.6 | ||||||
| Hospital pharmacy management |
— | — | — | |||||||||
| $ | 22.1 | $ | 21.6 | $ | 12.6 | |||||||
F-41
Table of Contents
Index to Financial Statements
PHARMERICA CORPORATION
NOTES TO CONSOLIDATED FINANCIAL STATEMENTS—(Continued)
NOTE 13—UNAUDITED QUARTERLY FINANCIAL INFORMATION
The quarterly interim information shown below has been prepared by the Corporation’s management and is unaudited. It should be read in conjunction with the audited consolidated financial statements appearing herein (dollars in millions, except per share amounts).
| 2009 Quarters | 2010 Quarters | |||||||||||||||||||||||||||||||
| First | Second | Third | Fourth | First | Second | Third | Fourth | |||||||||||||||||||||||||
| Net revenues: |
||||||||||||||||||||||||||||||||
| Institutional pharmacy revenues |
$ | 453.4 | $ | 446.5 | $ | 447.1 | $ | 437.7 | $ | 448.3 | $ | 435.9 | $ | 427.7 | $ | 477.5 | ||||||||||||||||
| Hospital management revenues |
14.8 | 14.1 | 13.9 | 13.7 | 13.9 | 14.6 | 15.4 | 14.0 | ||||||||||||||||||||||||
| Total revenues |
468.2 | 460.6 | 461.0 | 451.4 | 462.2 | 450.5 | 443.1 | 491.5 | ||||||||||||||||||||||||
| Cost of goods sold: |
||||||||||||||||||||||||||||||||
| Institutional pharmacy |
384.0 | 379.1 | 381.7 | 372.9 | 386.8 | 380.1 | 372.8 | 416.9 | ||||||||||||||||||||||||
| Hospital management |
12.0 | 11.9 | 12.2 | 11.9 | 12.1 | 12.8 | 13.5 | 12.0 | ||||||||||||||||||||||||
| Total cost of goods sold |
396.0 | 391.0 | 393.9 | 384.8 | 398.9 | 392.9 | 386.3 | 428.9 | ||||||||||||||||||||||||
| Gross profit: |
||||||||||||||||||||||||||||||||
| Institutional pharmacy |
69.4 | 67.4 | 65.4 | 64.8 | 61.5 | 55.8 | 54.9 | 60.6 | ||||||||||||||||||||||||
| Hospital management |
2.8 | 2.2 | 1.7 | 1.8 | 1.8 | 1.8 | 1.9 | 2.0 | ||||||||||||||||||||||||
| Total gross profit |
72.2 | 69.6 | 67.1 | 66.6 | 63.3 | 57.6 | 56.8 | 62.6 | ||||||||||||||||||||||||
| Operating income |
$ | 16.7 | $ | 19.1 | $ | 18.7 | $ | 16.0 | $ | 15.0 | $ | 3.0 | $ | 8.9 | $ | 8.9 | ||||||||||||||||
| Net income |
$ | 8.2 | $ | 9.2 | $ | 14.6 | $ | 10.2 | $ | 8.4 | $ | 1.3 | $ | 4.8 | $ | 4.7 | ||||||||||||||||
| Earnings per common share: |
||||||||||||||||||||||||||||||||
| Basic |
$ | 0.27 | $ | 0.30 | $ | 0.48 | $ | 0.34 | $ | 0.28 | $ | 0.04 | $ | 0.16 | $ | 0.16 | ||||||||||||||||
| Diluted |
$ | 0.27 | $ | 0.30 | $ | 0.48 | $ | 0.33 | $ | 0.27 | $ | 0.04 | $ | 0.16 | $ | 0.16 | ||||||||||||||||
| Shares used in computing earnings per common share: |
||||||||||||||||||||||||||||||||
| Basic |
30.2 | 30.2 | 30.3 | 30.3 | 30.4 | 30.4 | 30.0 | 29.2 | ||||||||||||||||||||||||
| Diluted |
30.3 | 30.4 | 30.5 | 30.5 | 30.6 | 30.6 | 30.1 | 29.3 | ||||||||||||||||||||||||
NOTE 14—SUBSEQUENT EVENT
On January 4, 2011, the Corporation entered into an Amended and Restated Prime Vendor Agreement for Long-Term Care Pharmacies by and between ABDC, the Corporation, Pharmacy Corporation of America and Chem Rx Pharmacy Services, LLC (the “Amended Agreement”). The Amended Agreement is effective on January 1, 2011 and, upon its effectiveness, supersedes in its entirety the Prime Vendor Agreement for Long-Term Care Pharmacies entered into as of August 1, 2007 between the Corporation and ABDC.
The Amended Agreement incorporates ChemRx and is otherwise substantially the same in scope excepting modifications to select sourcing terms. The term of the Amended Agreement was extended until September 30, 2013, with one-year automatic renewal periods unless either party provides prior notice of its intent not to renew.
F-42
Table of Contents
Index to Financial Statements
Item 9. Changes in and Disagreements with Accountants on Accounting and Financial Disclosure
As disclosed in the Corporation’s current reports on Form 8-K filed on March 5, 2010, the Corporation changed its independent registered public accountants effective for the fiscal year ended December 31, 2010. There were no disagreements or reportable events related to the change in accountants.
Item 9A. Controls and Procedures
Evaluation of Disclosure Controls and Procedures
The Corporation has carried out an evaluation under the supervision and with the participation of management, including the Corporation’s Chief Executive Officer and Chief Financial Officer, of the effectiveness of the design and operation of the Corporation’s “disclosure controls and procedures” as defined in Rule 13a-15(e) under the Securities Exchange Act of 1934, as amended (the “Exchange Act”) as of the end of the period covered by this report. The Corporation’s disclosure controls and procedures are designed so that information required to be disclosed in the Corporation’s reports filed under the Exchange Act, such as this Annual Report on Form 10-K, is recorded, processed, summarized and reported within the time periods specified in the Commission’s rules and forms. The Corporation’s disclosure controls and procedures are also intended to ensure that such information is accumulated and communicated to the Corporation’s management, including the Chief Executive Officer and Chief Financial Officer, as appropriate to allow timely decisions regarding required disclosure. There are inherent limitations to the effectiveness of any system of disclosure controls and procedures, including the possibility of human error and the circumvention or overriding of the controls and procedures. Accordingly, even effective disclosure controls and procedures can only provide reasonable assurance of achieving their control objectives, and management necessarily is required to use its judgment in evaluating the cost-benefit relationship of possible disclosure controls and procedures. Based upon this evaluation, the Chief Executive Officer and Chief Financial Officer have concluded that, as of December 31, 2010, the Corporation’s disclosure controls and procedures are effective to provide reasonable assurance that information required to be disclosed in the reports that the Corporation files and submits under the Exchange Act is recorded, processed, summarized and reported as and when required.
Changes in Internal Control Over Financial Reporting
There have been no changes in the Corporation’s internal control over financial reporting during the quarter ended December 31, 2010, that have materially affected, or are reasonably likely to materially affect, the Corporation’s internal control over financial reporting.
Management’s Annual Report on Internal Control over Financial Reporting
Our management is responsible for establishing and maintaining adequate internal control over financial reporting as defined in Rules 13a-15(f) and 15d-15(f) under the Exchange Act. Our internal control over financial reporting is a process designed to provide reasonable assurance regarding the reliability of financial reporting and the preparation of financial statements for external purposes in accordance with generally accepted accounting principles. Our internal control over financial reporting includes those policies and procedures that:
| (i) | pertain to the maintenance of records that, in reasonable detail, accurately and fairly reflect the transactions and dispositions of the assets of the Corporation; |
| (ii) | provide reasonable assurance that transactions are recorded as necessary to permit preparation of financial statements in accordance with generally accepted accounting principles, and that receipts and expenditures of the Corporation are being made only in accordance with authorizations of management and directors of the Corporation; and |
| (iii) | provide reasonable assurance regarding prevention or timely detection of unauthorized acquisition, use or disposition of the Corporation’s assets that could have a material effect on the financial statements. |
84
Table of Contents
Index to Financial Statements
Because of its inherent limitations, internal control over financial reporting may not prevent or detect misstatements. Also, projections of any evaluation of effectiveness to future periods are subject to the risk that controls may become inadequate because of changes in conditions, or that the degree of compliance with the policies or procedures may deteriorate.
Our management assessed the effectiveness of the Corporation’s internal control over financial reporting as of December 31, 2010. In making this assessment, management used the criteria set forth by the Committee of Sponsoring Organizations of the Treadway Commission (COSO) in Internal Control-Integrated Framework.
Based upon our assessment and those criteria, management has concluded that the Corporation maintained effective internal control over financial reporting as of December 31, 2010.
The Corporation has excluded the Chem Rx and Lone Star Pharmacy Services acquisitions from its assessment of internal control over financial reporting as of December 31, 2010 because they were acquired by the Corporation in separate purchase business combinations during 2010. The total combined assets and total combined revenues of Chem Rx and Lone Star Pharmacy Services represent 20.0% and 3.0%, respectively, of the related consolidated financial statement amounts as of and for the year ended December 31, 2010. The Corporation continues to integrate new acquisitions into corporate processes. No potential internal control changes due to new acquisitions would be considered material to, or are reasonably likely to materially affect, our internal control over financial reporting.
The effectiveness of the Corporation’s internal control over financial reporting as of December 31, 2010 has been audited by KPMG LLP, our independent registered public accounting firm, who also audited our consolidated financial statements as of and for the year ended December 31, 2010 included in this Annual Report on Form 10-K, as stated in their report which appears with our accompanying consolidated financial statements.
None.
85
Table of Contents
Index to Financial Statements
PART III
| Item 10. | Directors, Executive Officers and Corporate Governance |
The information required by this Item is incorporated herein by reference from the Corporation’s definitive proxy statement to be filed no later than 120 days after December 31, 2010. We refer to this proxy statement as the 2011 Proxy Statement.
| Item 11. | Executive Compensation |
Incorporated herein by reference from the Corporation’s 2011 Proxy Statement.
| Item 12. | Security Ownership of Certain Beneficial Owners and Management and Related Stockholder Matters |
Incorporated herein by reference from the Corporation’s 2011 Proxy Statement.
| Item 13. | Certain Relationships and Related Transactions, and Director Independence. |
Incorporated herein by reference from the Corporation’s 2011 Proxy Statement.
| Item 14. | Principal Accounting Fees and Services. |
Incorporated herein by reference from the Corporation’s 2011 Proxy Statement.
86
Table of Contents
Index to Financial Statements
PART IV
(a)
(1) All Financial Statements
Consolidated financial statements filed as part of this report are listed under Part II, Item 8 of this Form 10-K.
(2) Financial Statement Schedules
No schedules are required because either the required information is not present or is not present in amounts sufficient to require submission of the schedule, or because the information required is included in the accompanying consolidated financial statements or the notes thereto.
(3) Exhibits
| Exhibit No. |
Description | |
| 2.1 | Master Transaction Agreement, dated as of October 25, 2006, by and among AmerisourceBergen Corporation, PharMerica, Inc., Kindred Healthcare, Inc., Kindred Pharmacy Services, Inc., Kindred Healthcare Operating, Inc., Safari Holding Corporation, Hippo Merger Corporation and Rhino Merger Corporation (1) | |
| 2.2 | Amendment No. 1 to Master Transaction Agreement, dated as of June 4, 2007, by and among AmerisourceBergen Corporation, PharMerica, Inc., Kindred Healthcare, Inc., Kindred Pharmacy Services, Inc., Kindred Healthcare Operating, Inc., Safari Holding Corporation, Hippo Merger Corporation and Rhino Merger Corporation (2) | |
| 2.3 | Asset Purchase Agreement, dated as of September 26, 2010, by and between Chem Rx Corporation, and certain of its subsidiaries, as Seller, Chem Rx Acquisition Sub, LLC, as Buyer, and PharMerica Corporation, as Buyer’s Guarantor (17) | |
| 3.1 | Certificate of Incorporation of the Registrant, as amended (3) | |
| 3.2 | Amended and Restated By-Laws of the Registrant (3) | |
| 4.1 | Specimen Common Stock Certificate of the Registrant (2) | |
| 10.1 | Master Pharmacy Provider Agreement dated as of July 1, 2004 by and among Kindred Healthcare Operating, Inc., Kindred Hospitals East L.L.C., Kindred Hospitals West, L.L.C., Kindred Hospitals Limited Partnership, THC – Seattle, Inc., THC – Chicago, Inc., and Kindred Pharmacy Services, Inc. (5) | |
| 10.2 | Amended and Restated PharMerica Corporation 2007 Omnibus Incentive Plan (12) † | |
| 10.3 | Commitment Letter dated as of May 31, 2007 among JPMorgan Chase Bank, N.A., J.P. Morgan Securities Inc., PharMerica, Inc., Kindred Pharmacy Services, Inc. and Safari Holding Corporation (5) | |
| 10.4 | Employment Agreement dated July 11, 2007 between Michael Culotta and Safari Holding Corporation (5) † | |
| 10.5 | Employment Agreement dated July 11, 2007 between Anthony Hernandez and Safari Holding Corporation (5) † | |
| 10.6 | Form CEO Performance Share Award Agreement (6) † | |
| 10.7 | Form CEO Stock Option Award Agreement (6) † | |
| 10.8 | Form Non-Qualified Stock Option Award Agreement (6) † | |
87
Table of Contents
Index to Financial Statements
| Exhibit No. |
Description | |
| 10.9 | Employment Agreement dated July 31, 2007 between Robert McKay and PharMerica Corporation (3) † | |
| 10.10 | Credit Agreement dated July 31, 2007 between PharMerica Corporation, the Lenders named therein, and JPMorgan Chase Bank, N.A., as Administrative Agent (3) | |
| 10.11 | Guarantee and Collateral Agreement dated July 31, 2007 between PharMerica Corporation, Its Subsidiaries Party thereto, and JPMorgan Chase Bank, N.A., as Collateral Agent (3) | |
| 10.12 | Patent and Trademark Security Agreement dated July 31, 2007 between PharMerica Corporation, the Subsidiaries party hereto, and JPMorgan Chase Bank, N.A., as Collateral Agent (3) | |
| 10.13 | Employment Agreement dated August 7, 2007 between Thomas Caneris and PharMerica Corporation (3) † | |
| 10.14 | Form Performance Share Award Agreement (3) † | |
| 10.15 | Form Long-Term Cash Award Agreement (3) † | |
| 10.16 | Form Director Restricted Share Award Agreement (3) † | |
| 10.17 | Form Director Non-Qualified Stock Option Award Agreement † (10) | |
| 10.18 | Form of Substitution NQSO Agreement for AmerisourceBergen 2001 Grants (3) † | |
| 10.19 | Form of Substitution NQSO Agreement for AmerisourceBergen 2002 Grants (3) † | |
| 10.20 | Form of Substitution NQSO Agreement for Kindred Grants (3) † | |
| 10.21 | Form of Substitution ISO Agreement for Kindred Grants (3) † | |
| 10.22 | IT Services Agreement (4) | |
| 10.23 | Trademark License Agreement (4) | |
| 10.24 | Summary of 2007 Short Term Incentive Program (4) † | |
| 10.25 | Summary of Director Compensation Program (4) † | |
| 10.26 | Summary of 2008 Long Term Incentive Program (8) † | |
| 10.27 | Summary of 2008 Short Term Incentive Program (8) † | |
| 10.28 | Form of Non-Qualified Stock Option Award Agreement (8) † | |
| 10.29 | Employment Agreement dated March 31, 2008 between John Kernaghan and PharMerica Corporation (9) † | |
| 10.30 | Form of Performance Share Award Agreement (adjusted EBITDA and adjusted ROIC) (11) † | |
| 10.31 | Summary of 2009 Long-Term Incentive Program (13) † | |
| 10.32 | Summary of 2009 Short-Term Incentive Program (13) † | |
| 10.33 | Employment Agreement dated April 20, 2009 between William Monast and PharMerica Corporation (12) † | |
| 10.34 | Form of Restricted Stock Unit Award Agreement (14) † | |
| 10.35 | Summary of 2010 CEO Short-Term Incentive Program and 2010 Short-Term Incentive Program (15) † | |
| 10.36 | Summary of 2010 Long-Term Incentive Program (15) † | |
| 10.37 | Amended and Restated PharMerica Corporation 2007 Omnibus Incentive Plan Adopted May 26, 2010 (16) † | |
88
Table of Contents
Index to Financial Statements
| Exhibit No. |
Description | |
| 10.38 | Form of Director Restricted Stock Unit Award Agreement (16) † | |
| 10.39 | New Employment Agreement dated September 30, 2010 between Gregory S. Weishar and PharMerica Corporation (17) † | |
| 10.40# | Amended and Restated Prime Vendor Agreement for Long-Term Care Pharmacies dated January 4, 2011 by and between AmerisourceBergen Drug Corporation, PharMerica Corporation, Pharmacy Corporation of America and Chem Rx Pharmacy Services, LLC | |
| 21.1 | Subsidiaries of the Registrant | |
| 23.1 | Consent of KPMG LLP | |
| 23.2 | Consent of PricewaterhouseCoopers LLP | |
| 31.1 | Certification of Chief Executive Officer required by Rule 13a-14(a) or Rule 15d-14(a) of the Securities Exchange Act of 1934, as adopted pursuant to Section 302 of the Sarbanes-Oxley Act of 2002 | |
| 31.2 | Certification of Chief Financial Officer required by Rule 13a-14(a) or Rule 15d-14(a) of the Securities Exchange Act of 1934, as adopted pursuant to Section 302 of the Sarbanes-Oxley Act of 2002 | |
| 32.1 | Certification of Chief Executive Officer, pursuant to 18 U.S.C. 1350, as adopted pursuant to Section 906 of the Sarbanes-Oxley Act of 2002 | |
| 32.2 | Certification of Chief Financial Officer pursuant to 18 U.S.C. 1350, as adopted pursuant to Section 906 of the Sarbanes-Oxley Act of 2002 | |
| (1) | Filed with Amendment No. 1 to the Corporation’s Registration Statement on Form S-4/S-1 (Reg. No. 333-142940) filed with the Securities and Exchange Commission on May 24, 2007, and incorporated herein by reference. |
| (2) | Filed with Amendment No. 2 to the Corporation’s Registration Statement on Form S-4/S-1 (Reg. No. 333-142940) filed with the Securities and Exchange Commission on June 27, 2007, and incorporated herein by reference. |
| (3) | Filed with the Corporation’s Quarterly Report on Form 10-Q filed with the Securities and Exchange Commission on August 31, 2007, and incorporated herein by reference. |
| (4) | Filed with the Corporation’s Quarterly Report on Form 10-Q filed with the Securities and Exchange Commission on November 9, 2007, and incorporated herein by reference. |
| (5) | Filed with Amendment No. 3 to the Corporation’s Registration Statement on Form S-4/S-1 (Reg. No. 333-142940) filed with the Securities and Exchange Commission on July 13, 2007, and incorporated herein by reference. |
| (6) | Filed with the Corporation’s Current Report on Form 8-K filed with the Securities and Exchange Commission on August 13, 2007, and incorporated herein by reference. |
| (7) | Filed with Amendment No. 1 to the Corporation’s Annual Report on Form 10-K/A filed with the Securities and Exchange Commission on April 29, 2008, and incorporated herein by reference. |
| (8) | Filed with the Corporation’s Quarterly Report on Form 10-Q filed with the Securities and Exchange Commission on May 8, 2008, and incorporated herein by reference. |
| (9) | Filed with the Corporation’s Quarterly Report on Form 10-Q filed with the Securities and Exchange Commission on October 30, 2008, and incorporated herein by reference. |
| (10) | Filed with the Corporation’s Annual Report on Form 10-K filed with the Securities and Exchange Commission on February 5, 2009, and incorporated herein by reference. |
| (11) | Filed with the Corporation’s Current Report on Form 8-K filed with the Securities and Exchange Commission on March 9, 2009, and incorporated herein by reference. |
89
Table of Contents
Index to Financial Statements
| (12) | Filed with the Corporation’s Quarterly Report on Form 10-Q filed with the Securities and Exchange Commission on August 3, 2009, and incorporated herein by reference. |
| (13) | Filed with the Corporation’s Quarterly Report on Form 10-Q filed with the Securities and Exchange Commission on April 30, 2009, and incorporated herein by reference. |
| (14) | Filed with the Corporation’s Annual Report on Form 10-K filed with the Securities and Exchange Commission on February 4, 2010, and incorporated herein by reference. |
| (15) | Filed with the Corporation’s Quarterly Report on Form 10-Q filed with the Securities and Exchange Commission on May 7, 2010, and incorporated herein by reference. |
| (16) | Filed with the Corporation’s Quarterly Report on Form 10-Q filed with the Securities and Exchange Commission on August 5, 2010, and incorporated herein by reference. |
| (17) | Filed with the Corporation’s Quarterly Report on Form 10-Q filed with the Securities and Exchange Commission on November 4, 2010, and incorporated herein by reference. |
| # | Application has been made to the Securities and Exchange Commission to seek confidential treatment of certain provisions. Omitted material for which confidential treatment has been requested has been filed separately with the Securities and Exchange Commission. |
| † | Management contract or compensatory plan or arrangement. |
90
Table of Contents
Index to Financial Statements
SIGNATURES
Pursuant to the requirements of Section 13 or 15(d) of the Securities Exchange Act of 1934, the registrant has duly caused this report to be signed on its behalf by the undersigned, thereunto duly authorized.
| PHARMERICA CORPORATION | ||||
| Date: February 24, 2011 | By: | /S/ GREGORY S. WEISHAR | ||
| Gregory S. Weishar Chief Executive Officer and Director | ||||
Pursuant to the requirements of the Securities Exchange Act of 1934, this report has been signed below by the following persons on behalf of the registrant and in the capacities and on the dates indicated.
| Signature |
Title |
Date | ||
| /S/ GREGORY S. WEISHAR (Gregory S. Weishar) |
Chief Executive Officer and Director | February 24, 2011 | ||
| /S/ MICHAEL J. CULOTTA (Michael J. Culotta) |
Executive Vice President and Chief Financial Officer | February 24, 2011 | ||
| /S/ BERARD E. TOMASSETTI (Berard E. Tomassetti) |
Senior Vice President and Chief Accounting Officer | February 24, 2011 | ||
| /S/ FRANK E. COLLINS (Frank E. Collins) |
Director | February 24, 2011 | ||
| /S/ W. ROBERT DAHL JR. (W. Robert Dahl Jr.) |
Director | February 24, 2011 | ||
| /S/ DR. THOMAS P. GERRITY (Dr. Thomas P. Gerrity) |
Director | February 24, 2011 | ||
| /S/ THOMAS P. MAC MAHON (Thomas P. Mac Mahon) |
Director | February 24, 2011 | ||
| /S/ DANIEL N. MENDELSON (Daniel N. Mendelson) |
Director | February 24, 2011 | ||
| /S/ DR. ROBERT A. OAKLEY (Dr. Robert A. Oakley) |
Director | February 24, 2011 | ||
| /S/ MARJORIE W. DORR (Marjorie W. Dorr) |
Director | February 24, 2011 | ||
| /S/ GEOFFREY G. MEYERS (Geoffrey G. Meyers) |
Director | February 24, 2011 | ||
91
Table of Contents
Index to Financial Statements
EXHIBIT INDEX
| Exhibit No. |
Description | |
| 10.40# | Amended and Restated Prime Vendor Agreement for Long-Term Care Pharmacies dated January 4, 2011 by and between AmerisourceBergen Drug Corporation, PharMerica Corporation, Pharmacy Corporation of America and Chem Rx Pharmacy Services, LLC | |
| 21.1 | Subsidiaries of the Registrant | |
| 23.1 | Consent of KPMG LLP | |
| 23.2 | Consent of PricewaterhouseCoopers LLP | |
| 31.1 | Certification of Chief Executive Officer required by Rule 13a-14(a) or Rule 15d-14(a) of the Securities Exchange Act of 1934, as adopted pursuant to Section 302 of the Sarbanes-Oxley Act of 2002 | |
| 31.2 | Certification of Chief Financial Officer required by Rule 13a-14(a) or Rule 15d-14(a) of the Securities Exchange Act of 1934, as adopted pursuant to Section 302 of the Sarbanes-Oxley Act of 2002 | |
| 32.1 | Certification of Chief Executive Officer, pursuant to 18 U.S.C. 1350, as adopted pursuant to Section 906 of the Sarbanes-Oxley Act of 2002 | |
| 32.2 | Certification of Chief Financial Officer pursuant to 18 U.S.C. 1350, as adopted pursuant to Section 906 of the Sarbanes-Oxley Act of 2002 | |
| # | Application has been made to the Securities and Exchange Commission to seek confidential treatment of certain provisions. Omitted material for which confidential treatment has been requested has been filed separately with the Securities and Exchange Commission. |
92