Attached files
| file | filename |
|---|---|
| 8-K - KAI FORM 8-K 2-24-2011 - KADANT INC | kaiform8k2242011.htm |
Fourth Quarter 2010 Business Review
Jonathan W. Painter, President & CEO
Thomas M. O’Brien, Executive Vice President & CFO

© 2011 Kadant Inc. KAI 4Q10 Business Review - February 24, 2011 *
Forward-Looking Statements
The following constitutes a "Safe Harbor" statement under the Private Securities Litigation
Reform Act of 1995: This presentation contains forward-looking statements that involve a
number of risks and uncertainties, including forward-looking statements about our expected
future financial and operating performance. Important factors that could cause actual results
to differ materially from those indicated by such statements include risks and uncertainties
set forth under the heading "Risk Factors" in Kadant's quarterly report on Form 10-Q for the
period ended October 2, 2010 and risks and uncertainties relating to our dependence on the
pulp and paper industry; poor relations with a major paper producer in China; significance of
sales and operation of manufacturing facilities in China; our ability to expand capacity in
China to meet demand; international sales and operations; competition; soundness of
suppliers and customers; our debt obligations; restrictions in our credit agreement;
soundness of financial institutions; litigation and warranty costs related to our discontinued
operation; our acquisition strategy; future restructurings; factors influencing our fiber-based
products business; protection of patents and proprietary rights; fluctuations in our share
price; and anti-takeover provisions. We undertake no obligation to publicly update any
forward-looking statement, whether as a result of new information, future events, or
otherwise.
2

© 2011 Kadant Inc. KAI 4Q10 Business Review - February 24, 2011 *
Use of Non-GAAP Financial Measures
In addition to the financial measures prepared in accordance with generally accepted
accounting principles (GAAP), we use certain non-GAAP financial measures, including
increases or decreases in revenues excluding the effect of foreign currency translation,
adjusted operating income, earnings before interest, taxes, depreciation, and amortization
(EBITDA), and adjusted EBITDA.
accounting principles (GAAP), we use certain non-GAAP financial measures, including
increases or decreases in revenues excluding the effect of foreign currency translation,
adjusted operating income, earnings before interest, taxes, depreciation, and amortization
(EBITDA), and adjusted EBITDA.
A reconciliation of those numbers to the most directly comparable U.S. GAAP financial
measures is shown in our 2010 fourth quarter earnings press release issued February 23,
2011, which is available in the Investors section of the company’s website at
www.kadant.com under the heading Investors News.
measures is shown in our 2010 fourth quarter earnings press release issued February 23,
2011, which is available in the Investors section of the company’s website at
www.kadant.com under the heading Investors News.
All geographic revenues and bookings data are attributed to regions based on selling
locations. For North America and China, this also approximates revenues and bookings
based on where the equipment is shipped to and installed. Our European geographic data,
however, includes revenues and bookings that may be shipped to and installed outside
Europe, including South America, Africa, the Middle East, and certain countries in
Southeast Asia (excluding China).
3

© 2011 Kadant Inc. KAI 4Q10 Business Review - February 24, 2011 *
Business Review
Jonathan W. Painter
President & CEO
4

© 2011 Kadant Inc. KAI 4Q10 Business Review - February 24, 2011 *
Q4 2010 Financial Highlights: Revenues
• $73.3 million, up 29% compared to Q4 2009
• All product lines saw solid increases compared to Q4 2009
– Stock-Preparation up 42%
– Fluid-Handling up 25%
– Water Management up 20%
– Accessories up 19%
• Q4 2010 revenues were up 10% sequentially
5

© 2011 Kadant Inc. KAI 4Q10 Business Review - February 24, 2011 *
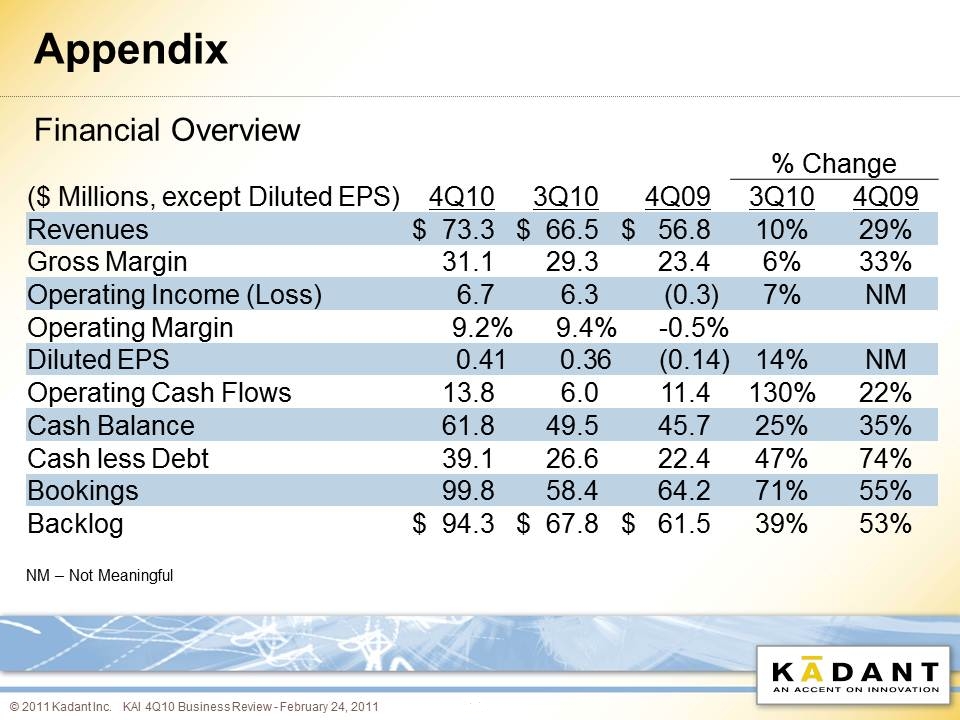
Financial Highlights
Q4 2010 Q4 2009
Revenues $73.3 million $56.8 million
Gross margins 42% 41%
Adjusted EBITDA $8.7 million $3.7 million
Diluted EPS $0.41 $(0.14)
Cash flows $13.8 million $11.4 million
6

© 2011 Kadant Inc. KAI 4Q10 Business Review - February 24, 2011 *
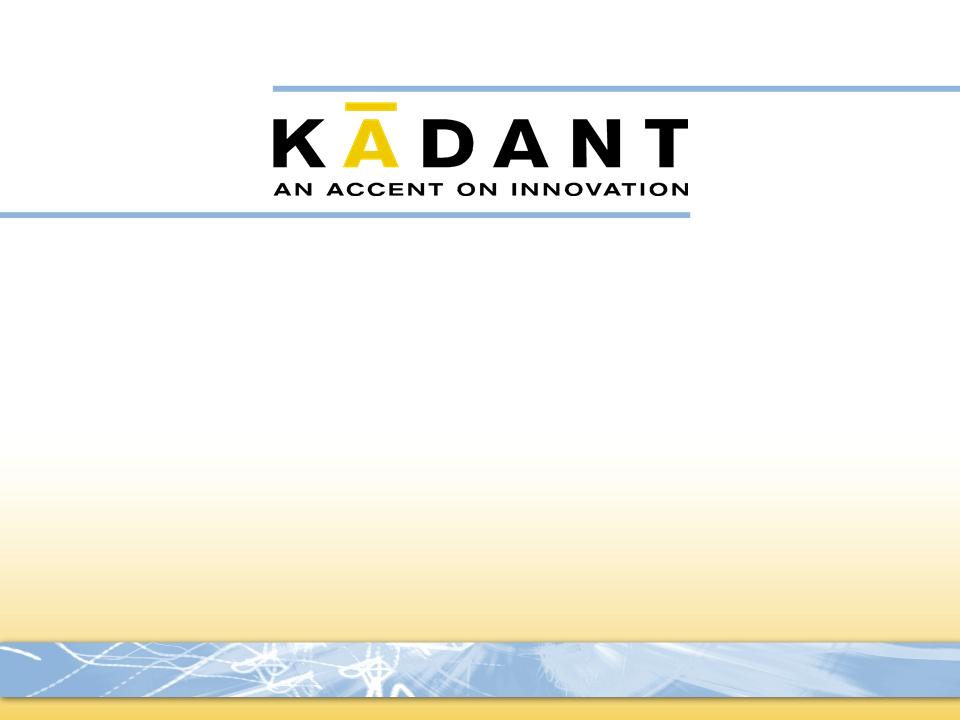
Q4 2010 Financial Highlights: Bookings
• $99.8 million, up 55% compared to Q4 2009
• Strong Q4 booking performance
– Stock-Preparation up 127%
– Fluid-Handling up 19%
– Accessories up 15%
– Water Management flat compared to Q4 2009
• Q4 2010 bookings were up sequentially by 71%
• The highest quarterly bookings level since 2007
7
© 2011 Kadant Inc. KAI 4Q10 Business Review - February 24, 2011 *
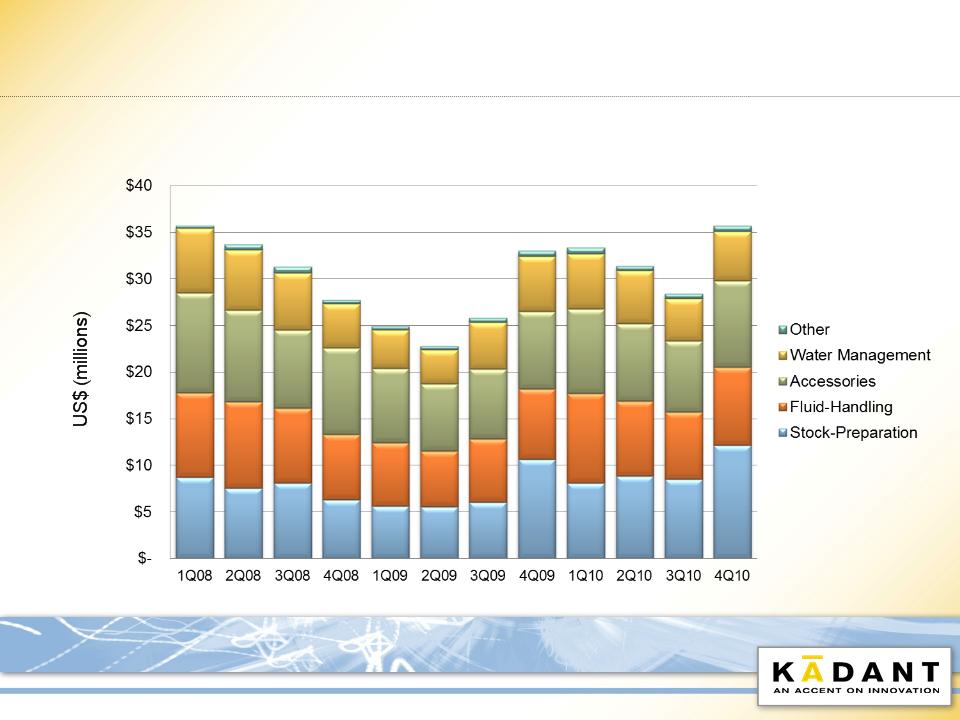
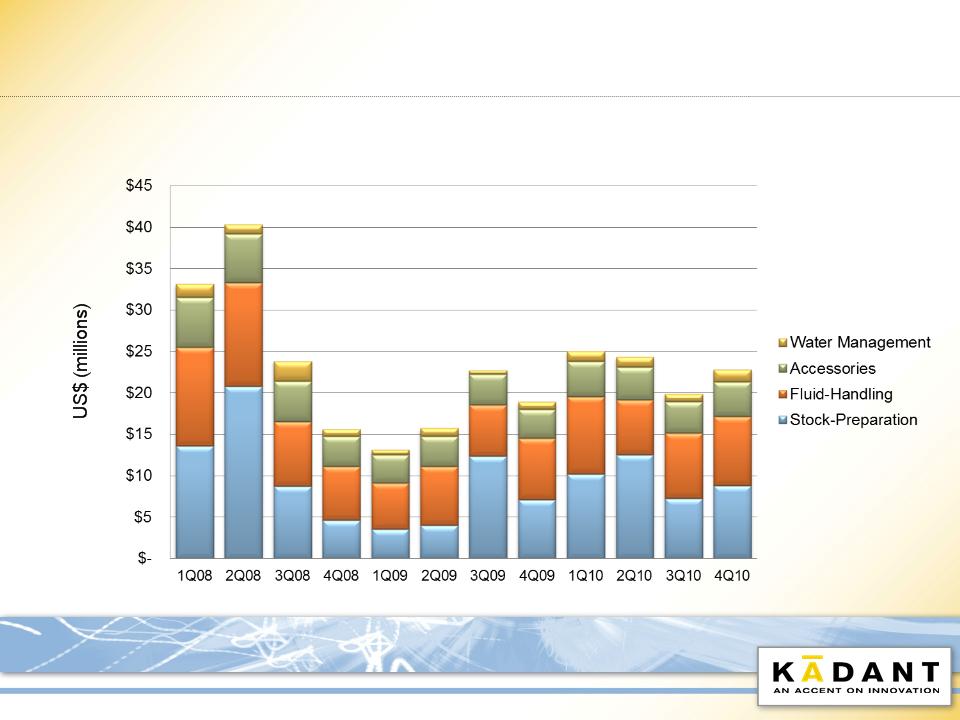
2008-2010 Quarterly Bookings
8
© 2011 Kadant Inc. KAI 4Q10 Business Review - February 24, 2011 *
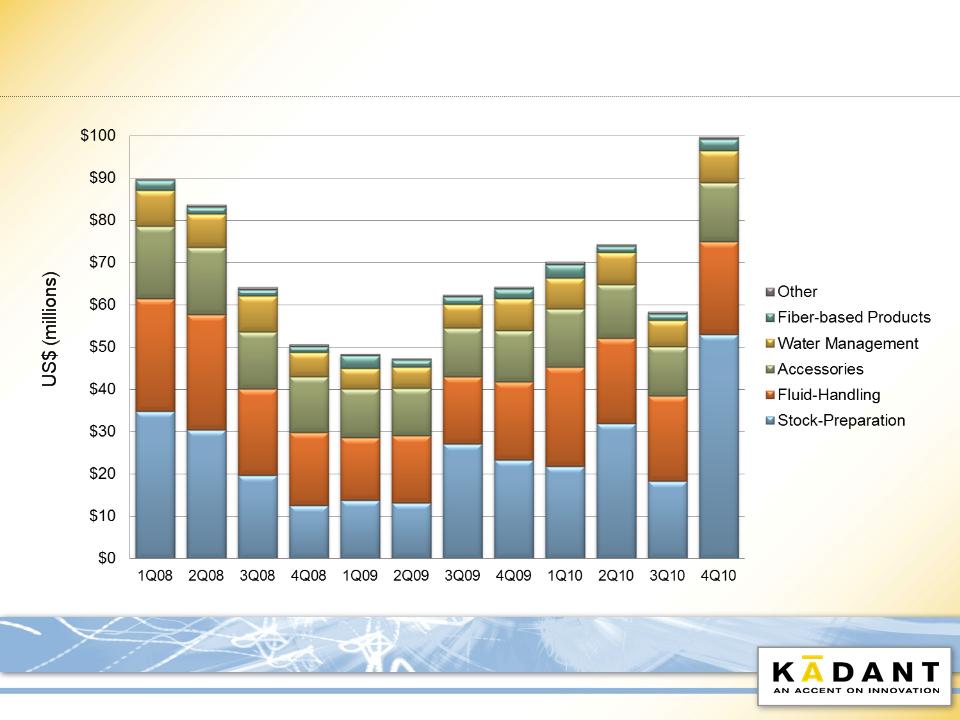
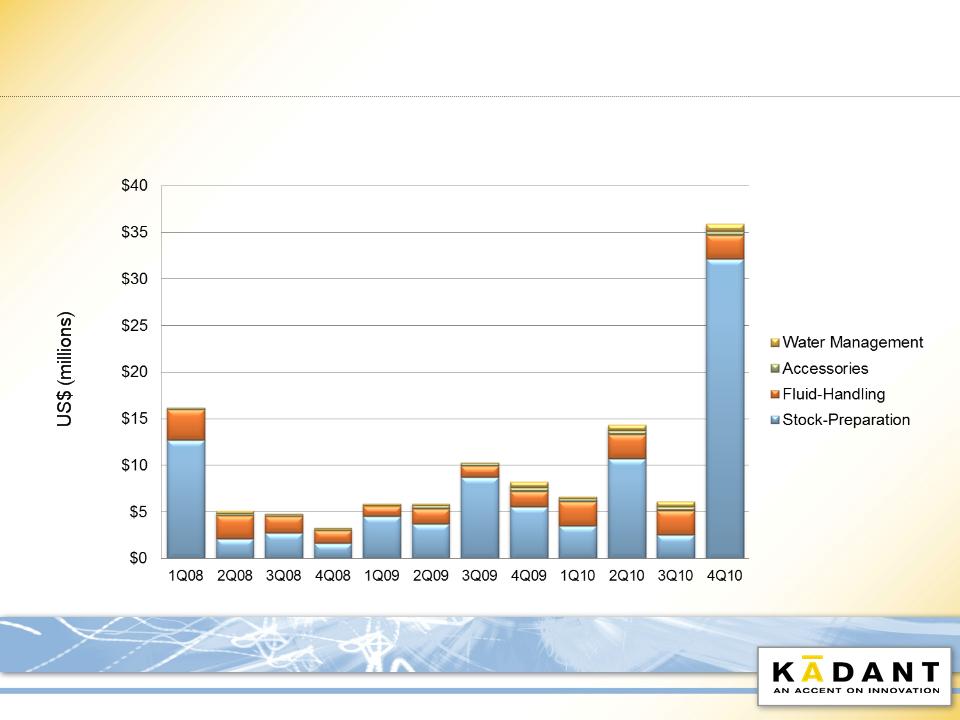
Capital Bookings
(Papermaking Systems Segment Only)
(Papermaking Systems Segment Only)
9
© 2011 Kadant Inc. KAI 4Q10 Business Review - February 24, 2011 *
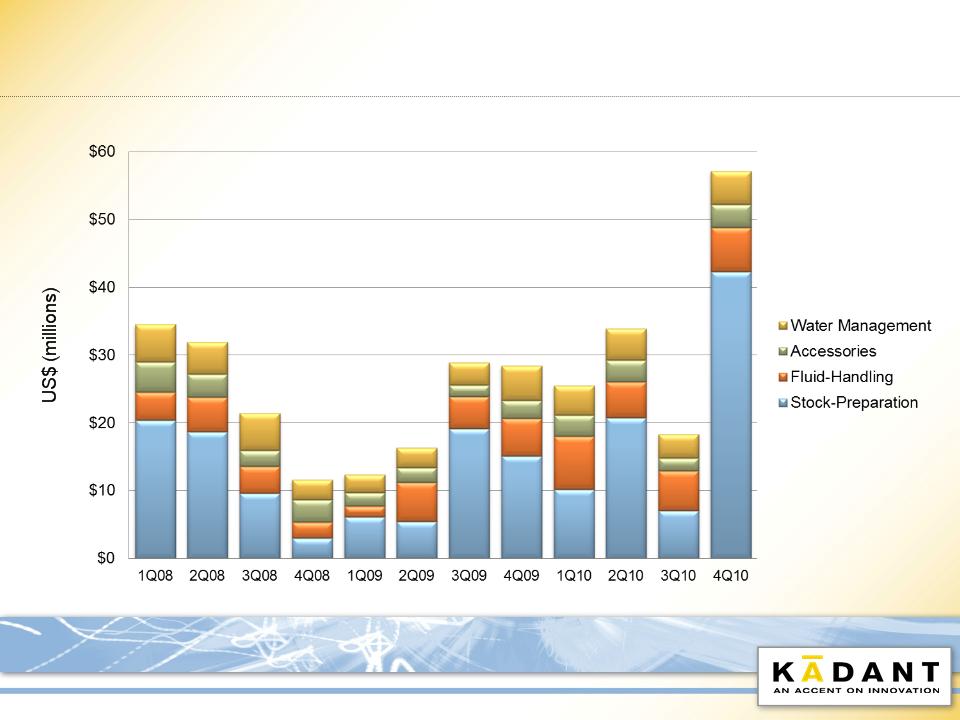
Parts & Consumables Bookings
(Papermaking Systems Segment Only)
(Papermaking Systems Segment Only)
10

© 2011 Kadant Inc. KAI 4Q10 Business Review - February 24, 2011 *
Market Review
11

© 2011 Kadant Inc. KAI 4Q10 Business Review - February 24, 2011 *
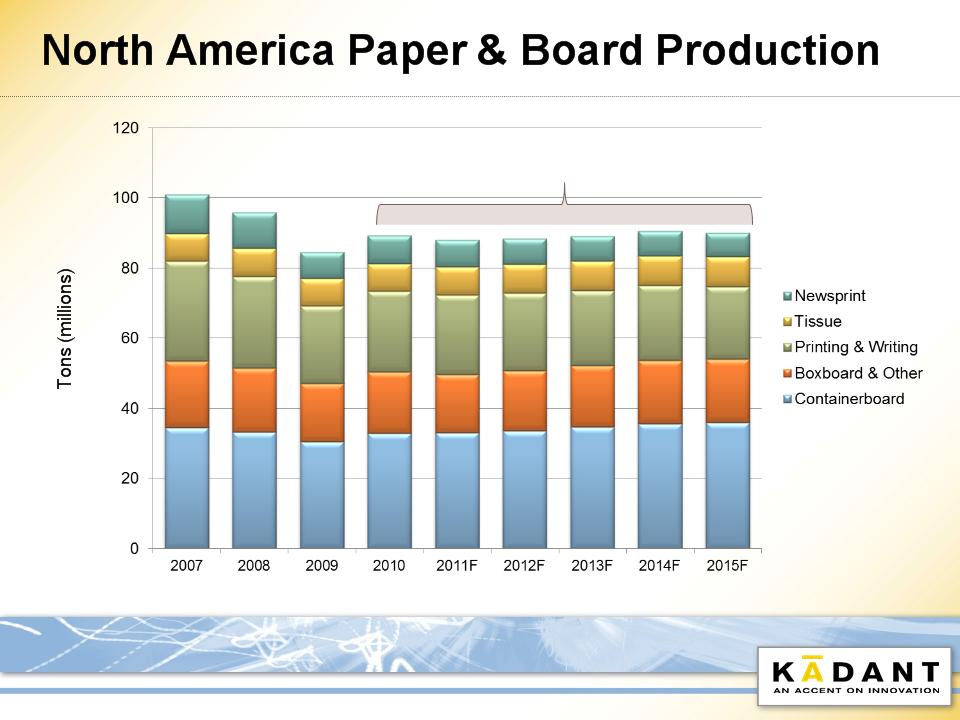
North America Paper Industry Trends
• U.S. economy stronger in 2010 than most anticipated
– 3.2% GDP growth in Q4 2010
• 2010 operating rates were 90% or higher
• In 2010, U.S. mills recovered half of the production lost in 2009
• Inventory levels have stabilized across all major grades
• Increased capital spending expected in 2011
• Higher fiber cost
• Weakness in U.S. consumer sector and high unemployment
• Structural weakness in printing and writing and newsprint continues
• Rock-Tenn acquisition of Smurfit-Stone may lead to capacity
rationalization
rationalization
12
© 2011 Kadant Inc. KAI 4Q10 Business Review - February 24, 2011 *
CAGR = 0.2%
Source: RISI World Pulp & Recovered Paper Forecast, 2011
13
© 2011 Kadant Inc. KAI 4Q10 Business Review - February 24, 2011 *
Highlighted North America Bookings
• OCC system for U.S. containerboard
producer in the Southwest
producer in the Southwest
• Center-press doctor system for
Midwest U.S. packaging producer
Midwest U.S. packaging producer
• 1,000 high-precision rotary unions
sold to a U.S. machine tool OEM
booked in Q1 2011
sold to a U.S. machine tool OEM
booked in Q1 2011
14
© 2011 Kadant Inc. KAI 4Q10 Business Review - February 24, 2011 *
North America Bookings
$35.7 million, up 8% compared to Q4 2009
15

© 2011 Kadant Inc. KAI 4Q10 Business Review - February 24, 2011 *
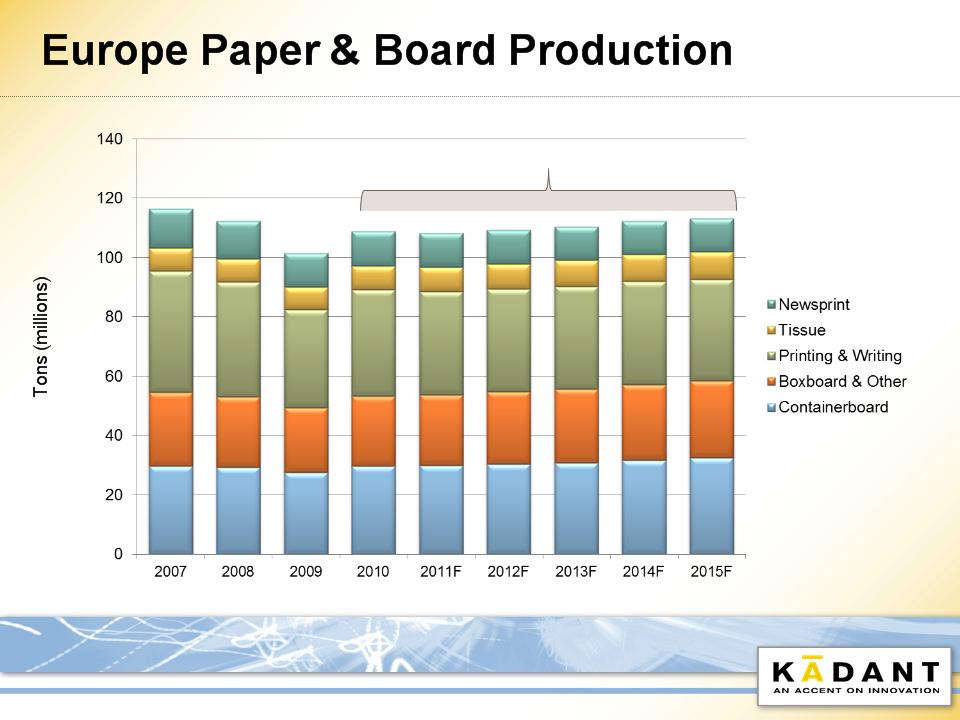
Europe Paper Industry Trends
• Containerboard prices remain steady, demand solid through
Q4 and into Q1 2011
Q4 and into Q1 2011
• Demand for graphic paper grades increased 4.5% in 2010
• Exports may soften if the Euro strengthens
• Operating rates in 2010 were highest for containerboard
(93%) and lowest for tissue (88%)
(93%) and lowest for tissue (88%)
16
© 2011 Kadant Inc. KAI 4Q10 Business Review - February 24, 2011 *
CAGR = 0.8%
Source: RISI World Pulp & Recovered Paper Forecast, 2011
17
© 2011 Kadant Inc. KAI 4Q10 Business Review - February 24, 2011 *
Highlighted Q4 European Bookings
• Deinking line for tissue producer in Russia
• Two stock preparation systems
for packaging lines from Turkey
and Northern Africa
for packaging lines from Turkey
and Northern Africa
• Dryer system surveys and engineering
for four customers in India
for four customers in India
• Two Petax™ fine filtration systems for a
Kraft packaging mill in Thailand
Kraft packaging mill in Thailand
18
© 2011 Kadant Inc. KAI 4Q10 Business Review - February 24, 2011 *
European Bookings
$22.8 million, up 20% compared to Q4 2009
19

© 2011 Kadant Inc. KAI 4Q10 Business Review - February 24, 2011 *
China Paper Industry Trends
• China expected to add more than 15 million tons from the
end of 2010 through 2012
end of 2010 through 2012
• China closed 3.8 million tons from inefficient mills in 2010
• China’s rapid economic growth expected to continue, but at a
slower pace relative to previous five years
slower pace relative to previous five years
• Inflation concerns in China may temper government stimulus
and create volatility in the Chinese economy
and create volatility in the Chinese economy
20
© 2011 Kadant Inc. KAI 4Q10 Business Review - February 24, 2011 *
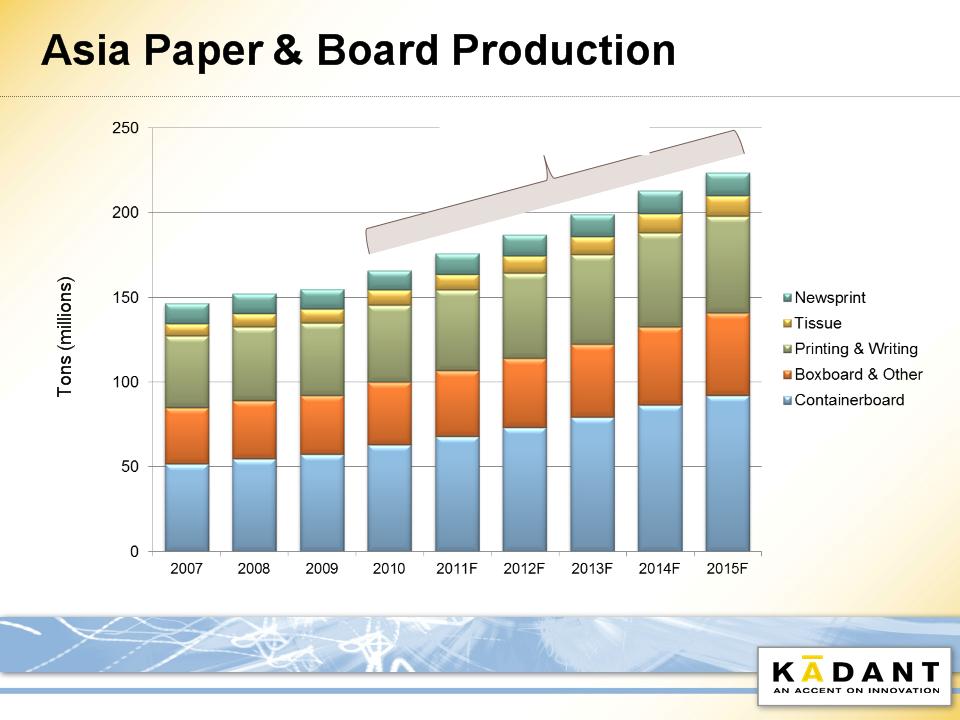
CAGR = 6.1%
Source: RISI World Pulp & Recovered Paper Forecast, 2011
21
© 2011 Kadant Inc. KAI 4Q10 Business Review - February 24, 2011 *
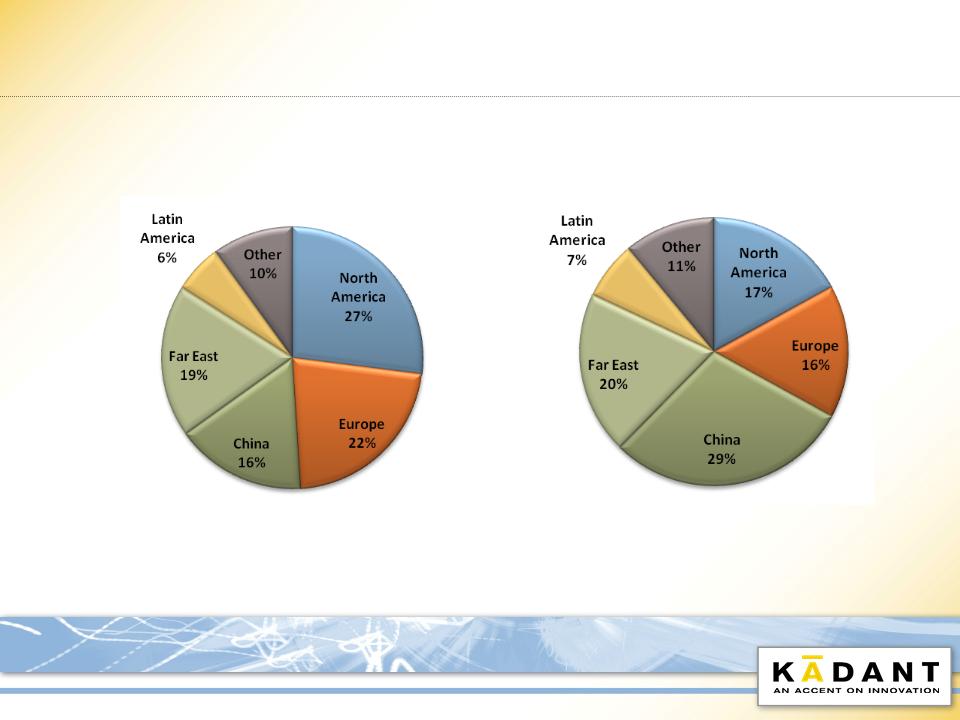
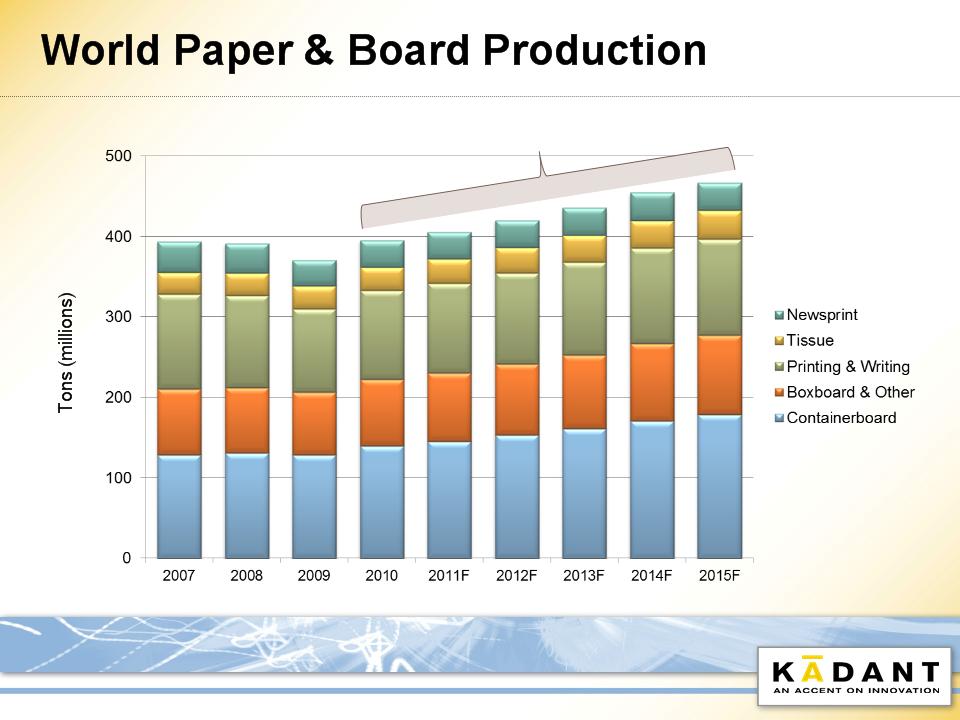
World Demand for Paper & Paperboard
2005
2015
Global Demand: 369 million tons
Global Demand: 468 million tons
Source: RISI World Pulp & Recovered Paper Forecast, 2011
Asia
35%
Asia
49%
22
© 2011 Kadant Inc. KAI 4Q10 Business Review - February 24, 2011 *
Source: RISI World Pulp & Recovered Paper Forecast, 2011
CAGR = 3.4%
23
© 2011 Kadant Inc. KAI 4Q10 Business Review - February 24, 2011 *
Highlighted Q4 China Bookings
• 14 stock prep systems orders from
China with a combined value of $31 million
for OCC, approach flow, and deinked systems
China with a combined value of $31 million
for OCC, approach flow, and deinked systems
• Steam and condensate systems and drying
equipment for four containerboard machines
and four tissue machines in China
equipment for four containerboard machines
and four tissue machines in China
• Water filtration equipment for four tissue
machines from a major tissue producer in
Southern China
machines from a major tissue producer in
Southern China
24
© 2011 Kadant Inc. KAI 4Q10 Business Review - February 24, 2011 *
China Bookings
$35.9 million, up 340% compared to Q4 2009
25
© 2011 Kadant Inc. KAI 4Q10 Business Review - February 24, 2011 *
China Manufacturing Expansion
• Significant bookings increase from
China for stock preparation systems
China for stock preparation systems
• Limited outsourcing flexibility in China
• Initiatives taken to increase capacity
– Expanding workforce
– Investing in capital equipment
– Increasing support from other Kadant
manufacturing sites
manufacturing sites
26

© 2011 Kadant Inc. KAI 4Q10 Business Review - February 24, 2011 *
Guidance for Continuing Operations
• FY 2011 revenues of $300 to $310 million
• FY 2011 GAAP diluted EPS of $1.65 to $1.75
• Q1 2011 revenues of $71 to $73 million
• Q1 2011 GAAP diluted EPS of $0.35 to $0.37
27

© 2011 Kadant Inc. KAI 4Q10 Business Review - February 24, 2011 *
Financial Review
Thomas M. O’Brien
Executive Vice President and
Chief Financial Officer
Chief Financial Officer
28

© 2011 Kadant Inc. KAI 4Q10 Business Review - February 24, 2011 *
4Q10 Revenues Summary
• Consolidated Revenues = $73.3 million
– 29% increase vs. 4Q09
– Includes 2% unfavorable foreign currency translation
• Revenue Guidance = $64 to $66 million
– Higher Stock-Preparation
– Smaller increases in Fluid-Handling and Accessories
29
© 2011 Kadant Inc. KAI 4Q10 Business Review - February 24, 2011 *
4Q10 and 4Q09 Revenues by Product Line
* Percent change excluding the effect of currency translation
|
|
|
|
% Change
|
|
|
|
|
|
Qtr to
|
Excl.
|
|
($ Millions)
|
4Q10
|
4Q09
|
Qtr
|
FX*
|
|
Stock-Preparation
|
$ 28.9
|
$ 20.4
|
42%
|
45%
|
|
Fluid-Handling
|
21.6
|
17.3
|
25%
|
26%
|
|
Accessories
|
13.8
|
11.6
|
19%
|
21%
|
|
Water-Management
|
6.6
|
5.5
|
20%
|
20%
|
|
Other
|
0.6
|
0.5
|
32%
|
26%
|
|
Fiber-Based Products
|
1.8
|
1.5
|
18%
|
18%
|
|
Total
|
$ 73.3
|
$ 56.8
|
29%
|
31%
|
30
© 2011 Kadant Inc. KAI 4Q10 Business Review - February 24, 2011 *
4Q10 and 3Q10 Revenues by Product Line
* Percent change excluding the effect of currency translation
|
|
|
|
% Change
|
|
|
|
|
|
Qtr to
|
Excl.
|
|
($ Millions)
|
4Q10
|
3Q10
|
Qtr
|
FX*
|
|
Stock-Preparation
|
$ 28.9
|
$ 23.9
|
21%
|
19%
|
|
Fluid-Handling
|
21.6
|
21.6
|
0%
|
1%
|
|
Accessories
|
13.8
|
12.3
|
13%
|
10%
|
|
Water-Management
|
6.6
|
6.9
|
-5%
|
-6%
|
|
Other
|
0.6
|
0.6
|
-4%
|
-7%
|
|
Fiber-Based Products
|
1.8
|
1.2
|
41%
|
41%
|
|
Total
|
$ 73.3
|
$ 66.5
|
10%
|
9%
|
31
© 2011 Kadant Inc. KAI 4Q10 Business Review - February 24, 2011 *
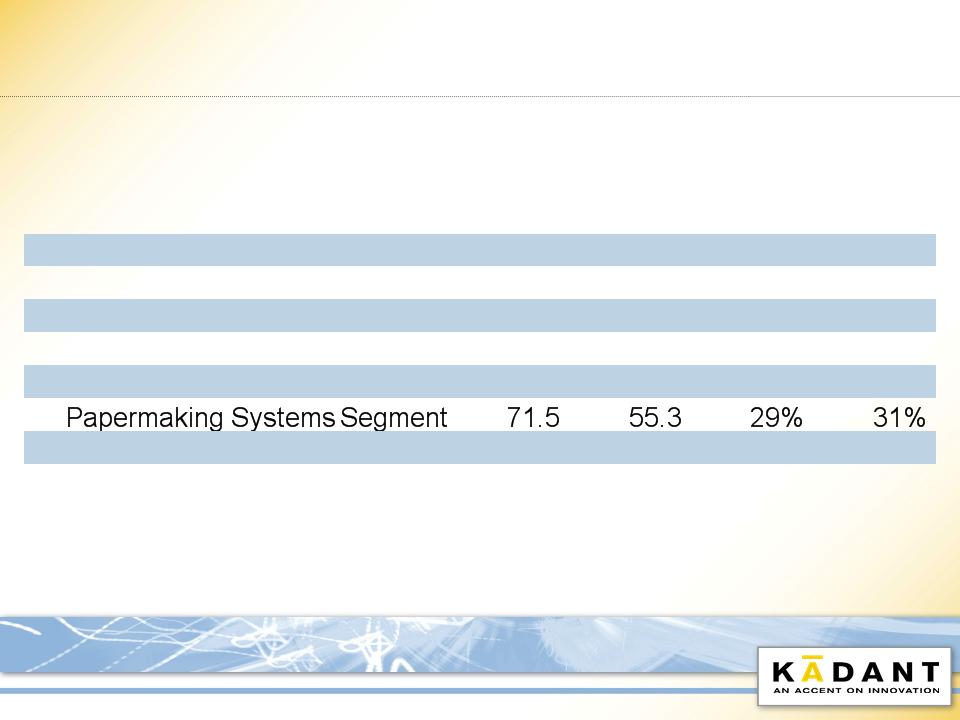
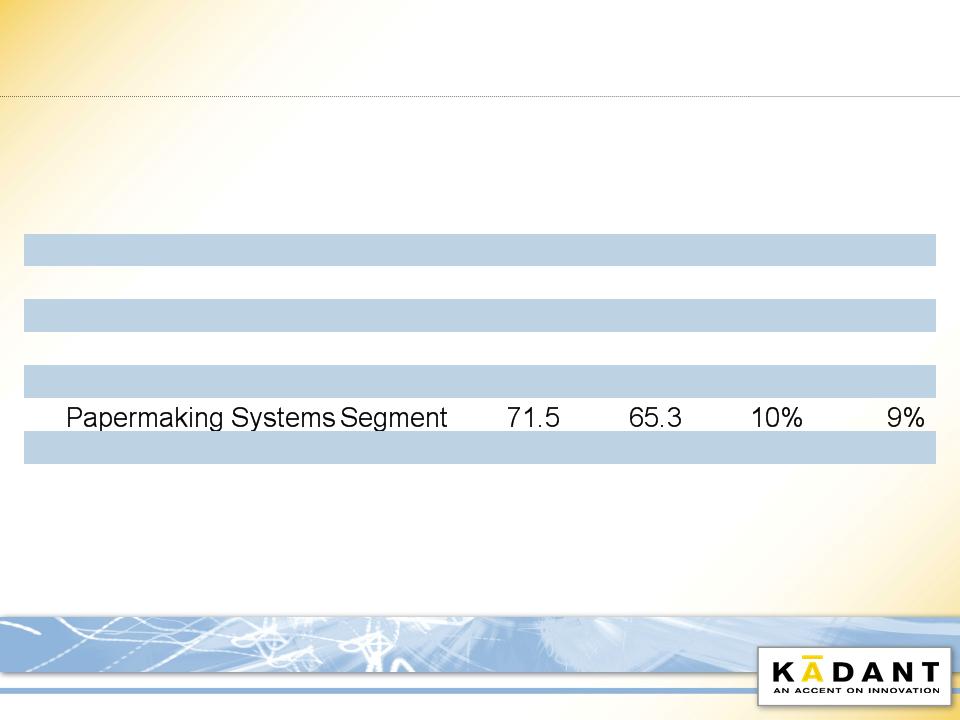
Revenues by Geography
(Papermaking Systems Segment Only)
(Papermaking Systems Segment Only)
* Percent change excluding the effect of currency translation
|
|
|
|
|
|
% Change
|
||
|
|
|
|
|
|
|
|
Excl.
|
|
|
|
|
|
|
|
|
FX*
|
|
North America
|
$ 33.4
|
$ 30.5
|
$ 26.9
|
|
10%
|
24%
|
23%
|
|
Europe
|
23.0
|
21.1
|
20.1
|
|
9%
|
14%
|
23%
|
|
China
|
12.3
|
10.9
|
6.2
|
|
13%
|
98%
|
93%
|
|
South America
|
2.3
|
2.1
|
1.7
|
|
9%
|
40%
|
37%
|
|
Australia
|
0.5
|
0.7
|
0.4
|
-32%
|
17%
|
8%
|
|
|
Total
|
$ 71.5
|
$ 65.3
|
$ 55.3
|
|
10%
|
29%
|
31%
|
32
© 2011 Kadant Inc. KAI 4Q10 Business Review - February 24, 2011 *
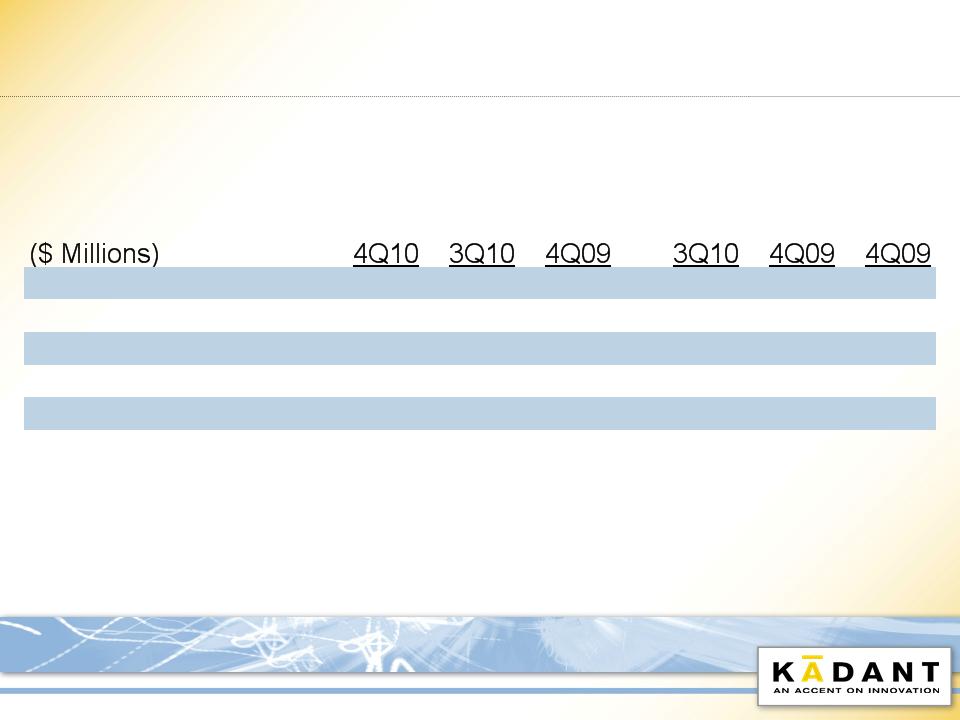
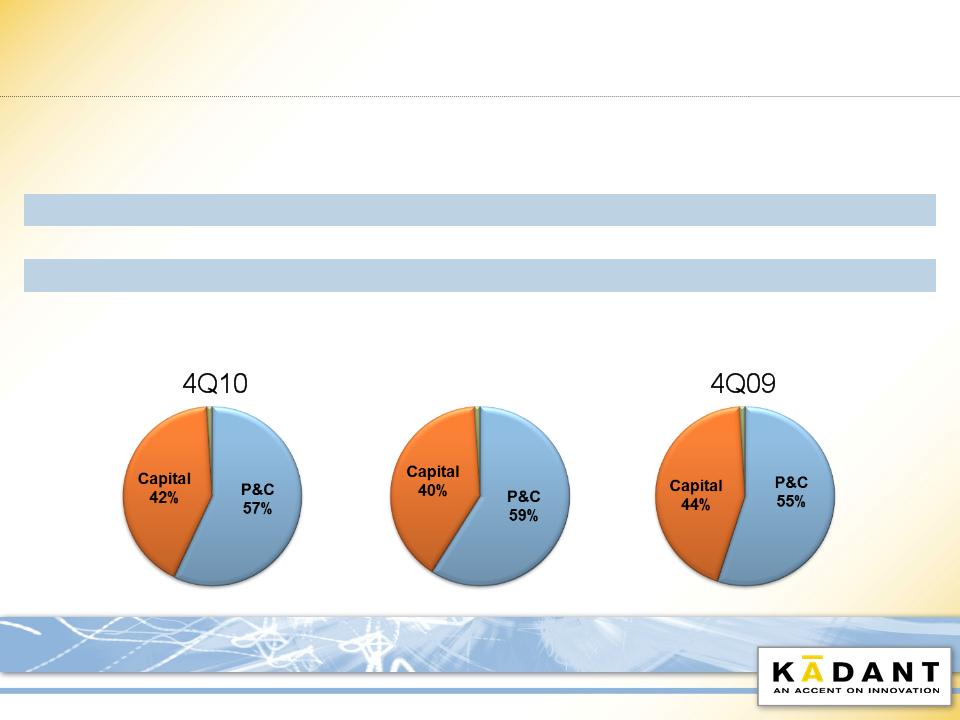
Revenue Detail
(Papermaking Systems Segment Only)
(Papermaking Systems Segment Only)
3Q10
|
|
|
|
|
% Change
|
|
|
($ Millions)
|
4Q10
|
3Q10
|
4Q09
|
3Q10
|
4Q09
|
|
Parts & Consumables
|
$ 40.6
|
$ 38.8
|
$ 30.6
|
5%
|
33%
|
|
Capital
|
30.3
|
25.9
|
24.2
|
17%
|
25%
|
|
Other
|
0.6
|
0.6
|
0.5
|
-4%
|
32%
|
|
Total
|
$ 71.5
|
$ 65.3
|
$ 55.3
|
10%
|
29%
|
33
© 2011 Kadant Inc. KAI 4Q10 Business Review - February 24, 2011 *
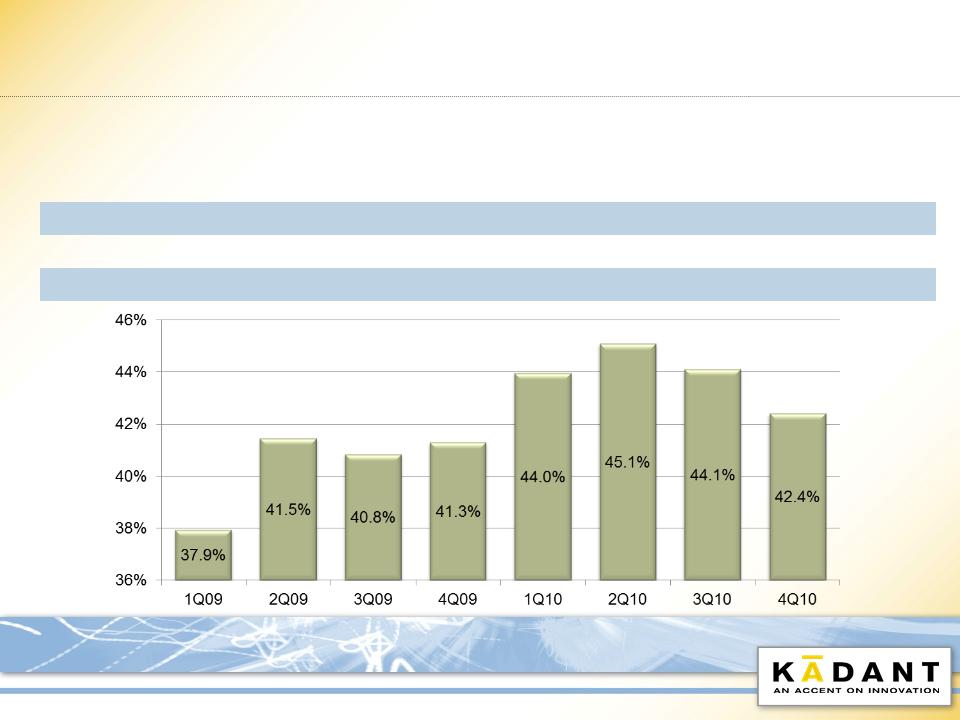
Gross Margin Percentages
|
|
|
|
|
|
% Point
|
|
|
|
|
|
|
|
Change
|
|
|
Quarter
|
4Q10
|
3Q10
|
4Q09
|
3Q10
|
4Q09
|
|
|
|
Papermaking Systems Segment
|
42.4
|
44.4
|
41.6
|
-2.0%
|
0.8%
|
|
|
Other
|
41.8
|
28.3
|
31.4
|
13.5%
|
10.4%
|
|
|
Total
|
42.4
|
44.1
|
41.3
|
-1.7%
|
1.1%
|
34
© 2011 Kadant Inc. KAI 4Q10 Business Review - February 24, 2011 *
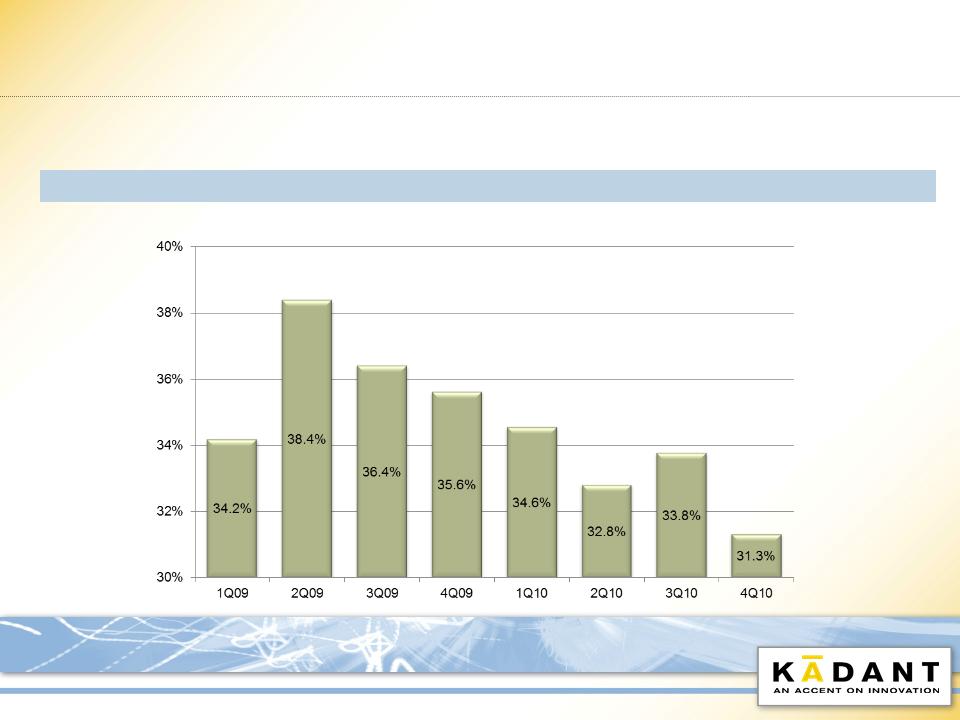
SG&A
|
Quarter
|
|
|
|
Change
|
||
|
|
($ Millions)
|
4Q10
|
3Q10
|
4Q09
|
3Q10
|
4Q09
|
|
|
SG&A
|
$ 22.9
|
$ 22.5
|
$ 20.2
|
$ 0.4
|
$ 2.7
|
|
|
% Revenues
|
31.3%
|
33.8%
|
35.6%
|
-2.5%
|
-4.3%
|
35
© 2011 Kadant Inc. KAI 4Q10 Business Review - February 24, 2011 *
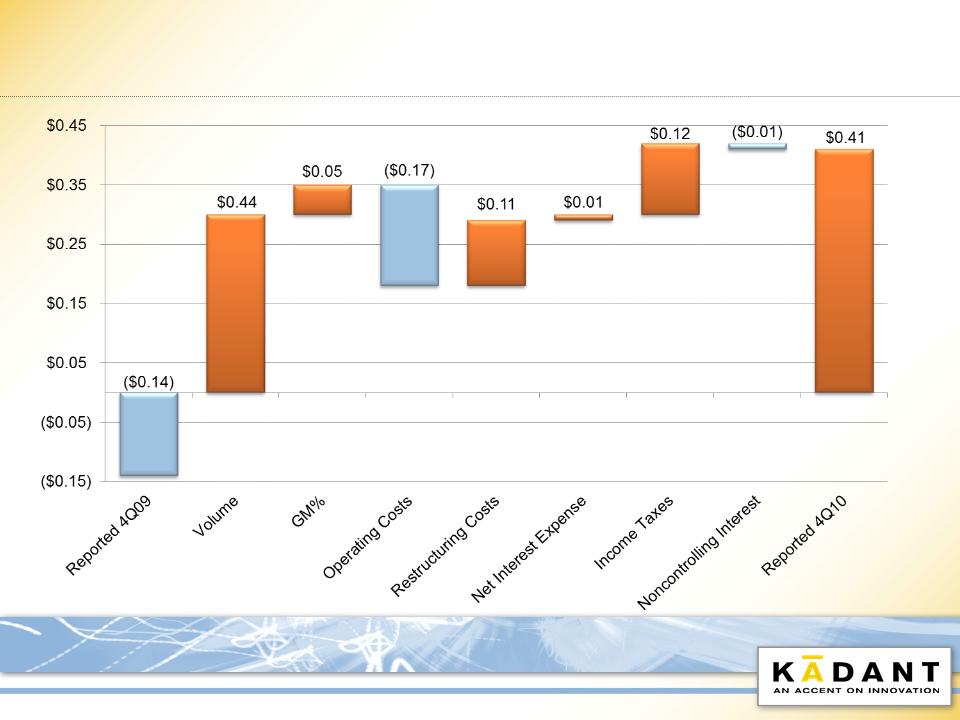
4Q09 to 4Q10 Diluted EPS
36
© 2011 Kadant Inc. KAI 4Q10 Business Review - February 24, 2011 *
Cash Flow
|
($ Millions)
|
4Q10
|
4Q09
|
2010
|
2009
|
|
Income (Loss) from Continuing
Operations |
$ 5.2
|
$ (1.7)
|
$ 18.7
|
$ (6.0)
|
|
Stock-Based Compensation
|
0.7
|
0.7
|
2.8
|
2.7
|
|
Other Items
|
1.3
|
0.3
|
(0.4)
|
(2.6)
|
|
|
|
|
|
|
|
Liabilities, Excluding Acquisitions
|
4.7
|
10.2
|
0.0
|
41.6
|
|
Cash from Continuing Operations
|
$ 13.8
|
$ 11.4
|
$ 28.3
|
$ 43.1
|
37
© 2011 Kadant Inc. KAI 4Q10 Business Review - February 24, 2011 *
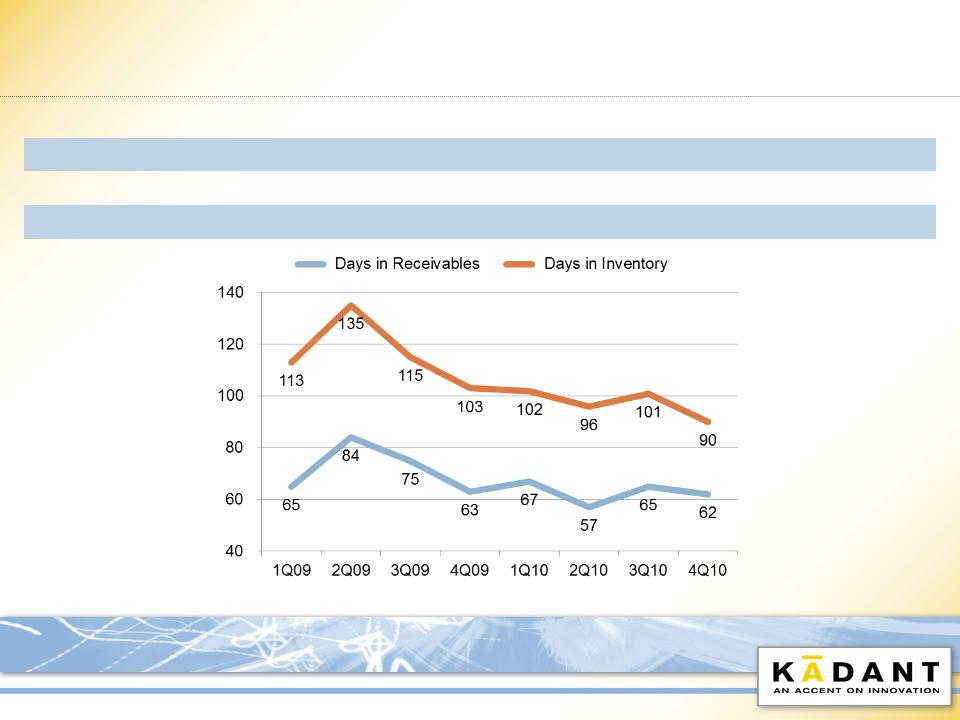
Key Working Capital Statistics
|
($ Millions)
|
4Q10
|
3Q10
|
4Q09
|
|
Days in Receivables
|
62
|
65
|
63
|
|
Days in Inventory
|
90
|
101
|
103
|
|
Working Capital % LTM Revenues *
|
9.1%
|
11.5%
|
10.5%
|
* Working Capital is defined as current assets less current liabilities, excluding cash, debt, and the discontinued operation.
38
© 2011 Kadant Inc. KAI 4Q10 Business Review - February 24, 2011 *
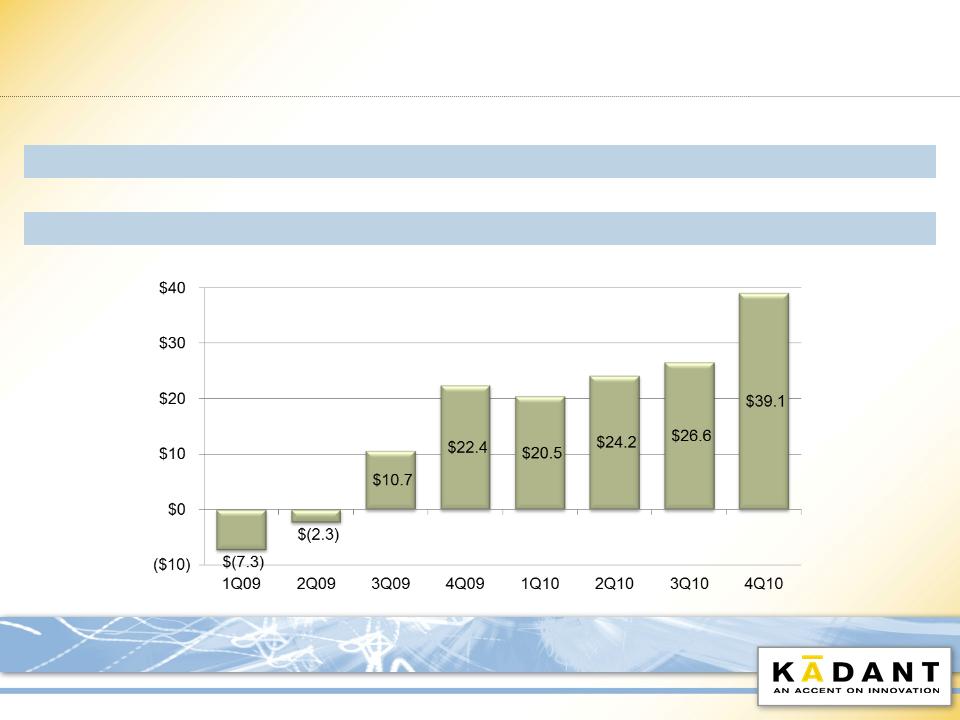
Cash and Debt
|
($ Millions)
|
4Q10
|
3Q10
|
4Q09
|
|
Cash and Cash Equivalents
|
$ 61.8
|
$ 49.5
|
$ 45.7
|
|
Debt
|
(22.7)
|
(22.9)
|
(23.3)
|
|
Net Cash
|
$ 39.1
|
$ 26.6
|
$ 22.4
|
39
© 2011 Kadant Inc. KAI 4Q10 Business Review - February 24, 2011 *
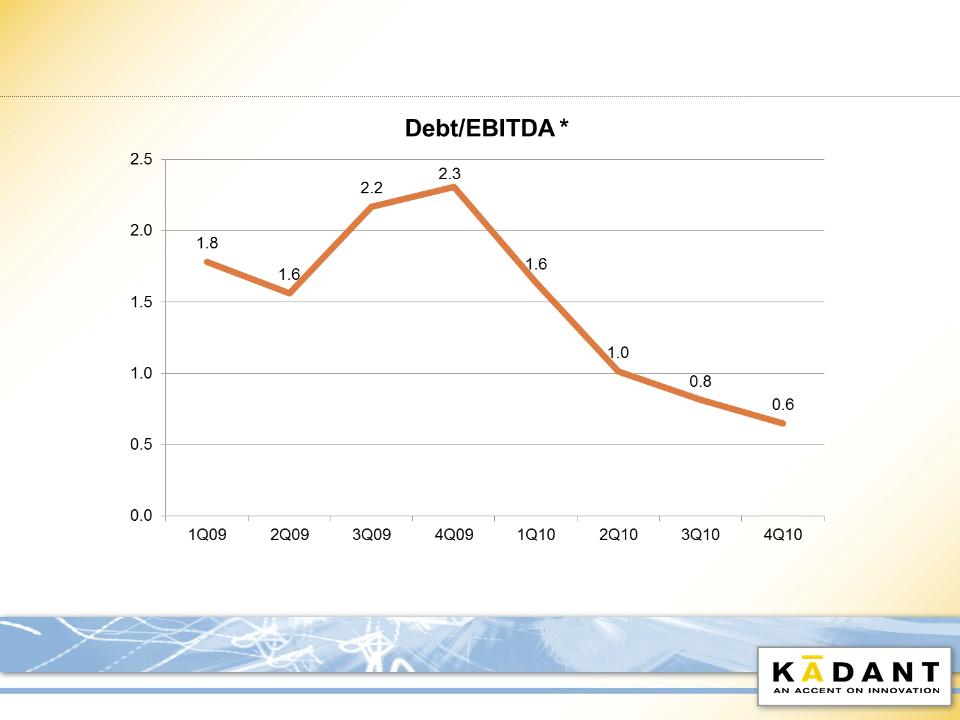
Leverage Ratio
* Calculated by adding or subtracting certain items, as defined in our Credit Facility, from Adjusted EBITDA reported externally.
40

© 2011 Kadant Inc. KAI 4Q10 Business Review - February 24, 2011 *
2011 Guidance
• Stronger second half
• Effective tax rate approximately 28%
• CAPEX: $7 to $8 million
• Non-cash equity expense: $0.19 per diluted share
• Depreciation and amortization expense: $8 million
41

© 2011 Kadant Inc. KAI 4Q10 Business Review - February 24, 2011 *
Questions & Answers
To ask a question, please call 866-510-0708 within the U.S. or
+1-617-597-5377 outside the U.S. and reference 83375884.
+1-617-597-5377 outside the U.S. and reference 83375884.
Please mute the audio on your computer.
42

Fourth Quarter 2010 Business Review
Jonathan W. Painter, President & CEO
Thomas M. O’Brien, Executive Vice President & CFO
43

© 2011 Kadant Inc. KAI 4Q10 Business Review - February 24, 2011 *
APPENDIX
Investor Contact: Thomas M. O’Brien, 978-776-2000
Media Contact: Wes Martz, 269-278-1715
44
45
© 2011 Kadant Inc. KAI 4Q10 Business Review - February 24, 2011 *
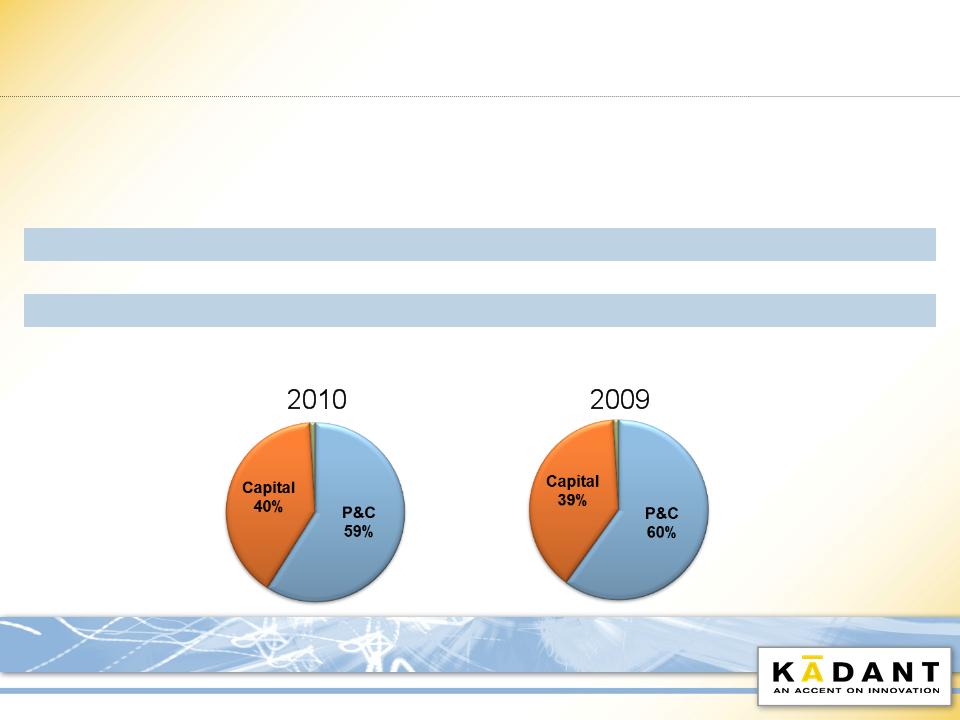
Appendix
Revenue
(Papermaking Systems Segment Only)
(Papermaking Systems Segment Only)
|
($ Millions)
|
2010
|
2009
|
% Change
|
|
Parts & Consumables
|
$ 153.9
|
$ 130.3
|
18%
|
|
Capital
|
104.8
|
85.5
|
23%
|
|
Other
|
2.5
|
1.8
|
40%
|
|
Total
|
$ 261.2
|
$ 217.6
|
20%
|
46
© 2011 Kadant Inc. KAI 4Q10 Business Review - February 24, 2011 *
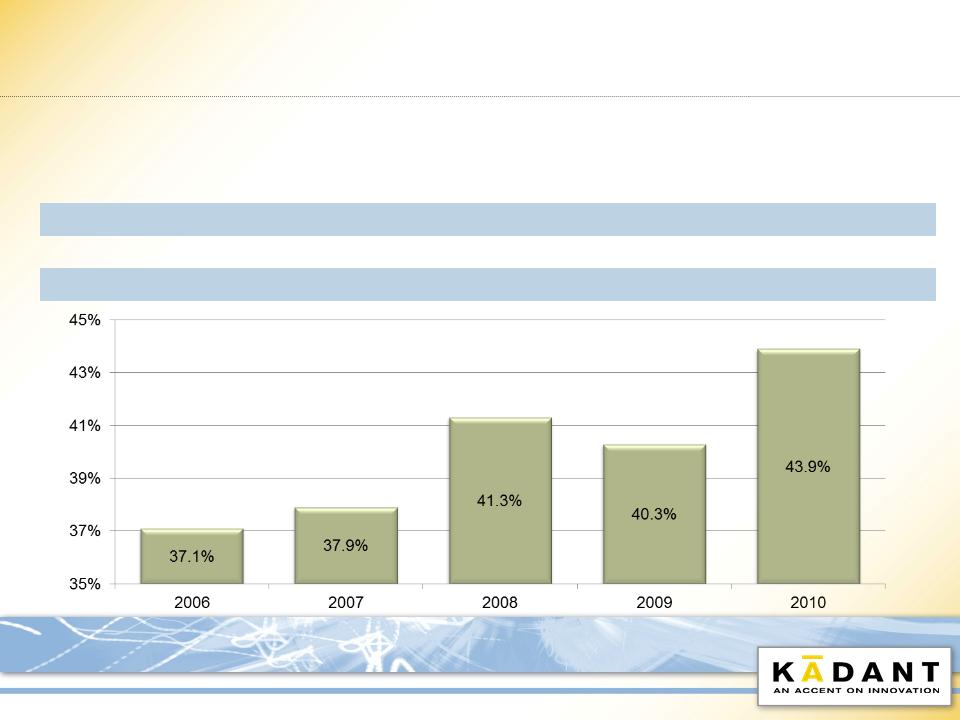
Appendix
Gross Margin Percentages - Year
|
|
|
|
|
|
% Point
|
|
|
|
|
|
|
|
Change
|
|
|
Year
|
2010
|
2009
|
2008
|
2009
|
2008
|
|
|
|
Papermaking Systems Segment
|
43.8
|
40.4
|
41.6
|
3.4%
|
2.2%
|
|
|
Other
|
45.8
|
35.0
|
27.0
|
10.8%
|
18.8%
|
|
|
Total
|
43.9
|
40.3
|
41.3
|
3.6%
|
2.6%
|
47
© 2011 Kadant Inc. KAI 4Q10 Business Review - February 24, 2011 *
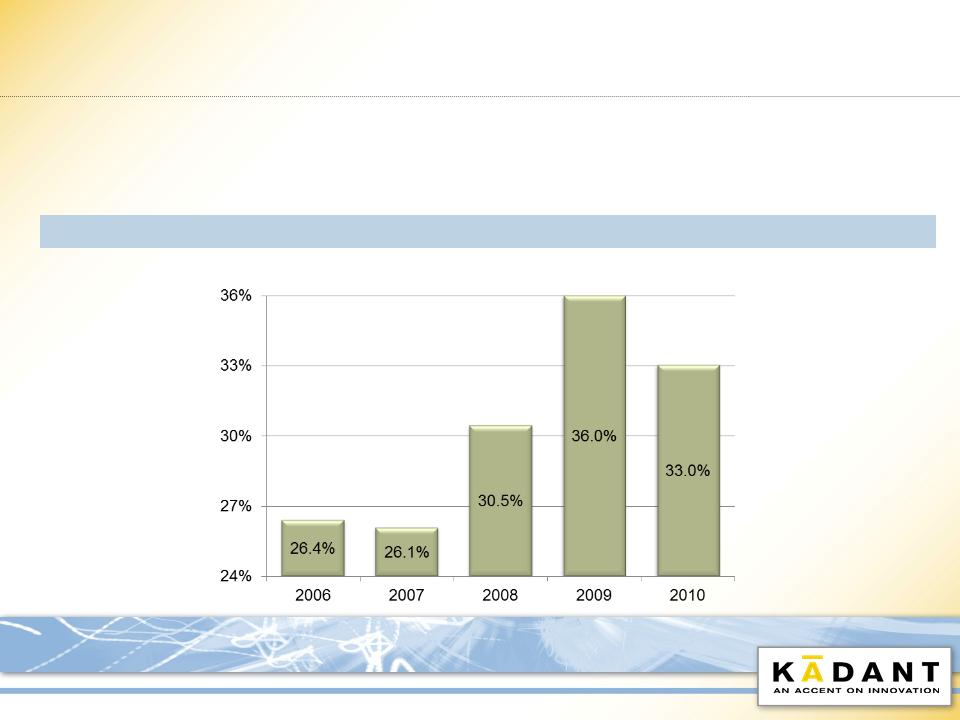
Appendix
SG&A
|
Year
|
|
|
|
Change
|
||
|
|
($ Millions)
|
2010
|
2009
|
2008
|
2009
|
2008
|
|
|
SG&A
|
$ 89.2
|
$ 81.2
|
$ 100.3
|
$ 8.0
|
$ (11.1)
|
|
|
% Revenues
|
33.0%
|
36.0%
|
30.5%
|
-3.0%
|
2.5%
|
48
© 2011 Kadant Inc. KAI 4Q10 Business Review - February 24, 2011 *
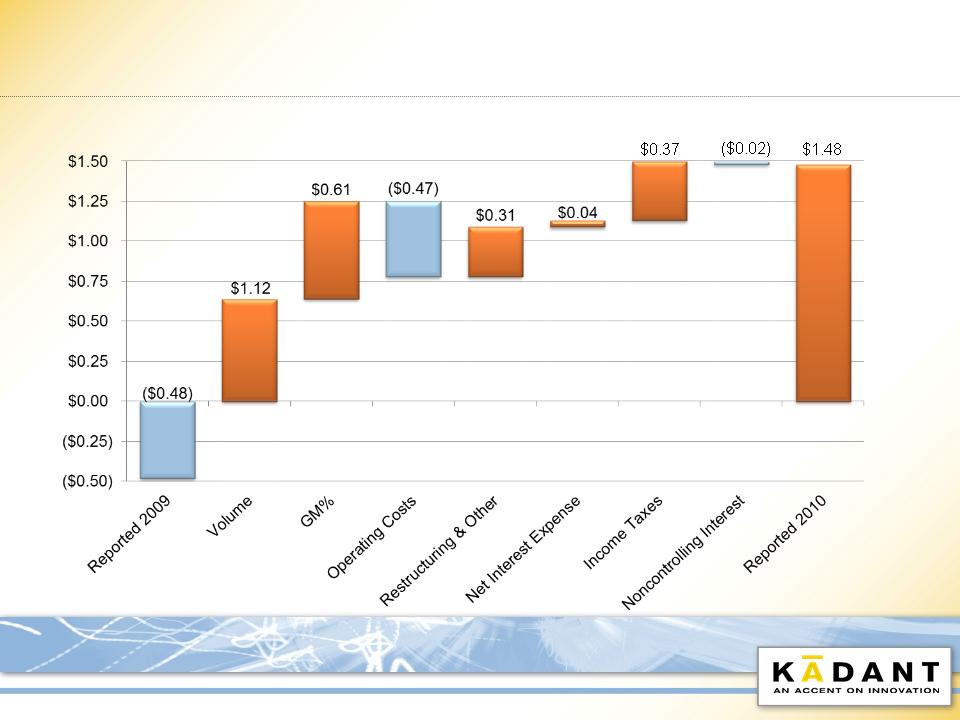
Appendix
2009 to 2010 Diluted EPS
49