Attached files
| file | filename |
|---|---|
| EX-99.2 - EXHIBIT 99.2 - APAC CUSTOMER SERVICE INC | c13091exv99w2.htm |
| 8-K - FORM 8-K - APAC CUSTOMER SERVICE INC | c13091e8vk.htm |
| EX-99.1 - EXHIBIT 99.1 - APAC CUSTOMER SERVICE INC | c13091exv99w1.htm |
Exhibit 99.3

| Investor PresentationFebruary 23, 2010 |

| Forward-Looking Statements 2 Certain statements, including discussions of the Company's expectations for 2011 and beyond, constitute forward-looking statements within the meaning of the Private Securities Litigation Reform Act of 1995. Such forward-looking statements are inherently uncertain as they are based on various expectations and assumptions about future events, and they are subject to known and unknown risks, uncertainties and other factors, which may cause actual events and results to differ materially from historical results or the future results expressed or implied by the forward-looking statements. Please refer to the Company's Annual Report on Form 10-K for the year ended January 2, 2011 for a description of the factors that could cause such results to differ. The Company intends its forward-looking statements to speak only as of the date made and undertakes no obligation to update or revise any forward-looking statements as a result of changed assumptions, new information, future events or otherwise. Our filings are available under the investor relations section of our website at http://www.apaccustomerservices.com and on a website maintained by the SEC at http://www.sec.gov. To supplement the Company's condensed consolidated financial statements presented in accordance with GAAP, the Company uses certain measures defined as non-GAAP financial measures by the SEC. Information regarding the reconciliation of the non-GAAP information used in this presentation to our GAAP results is contained in the appendix and is also available on our website and through the SEC. |
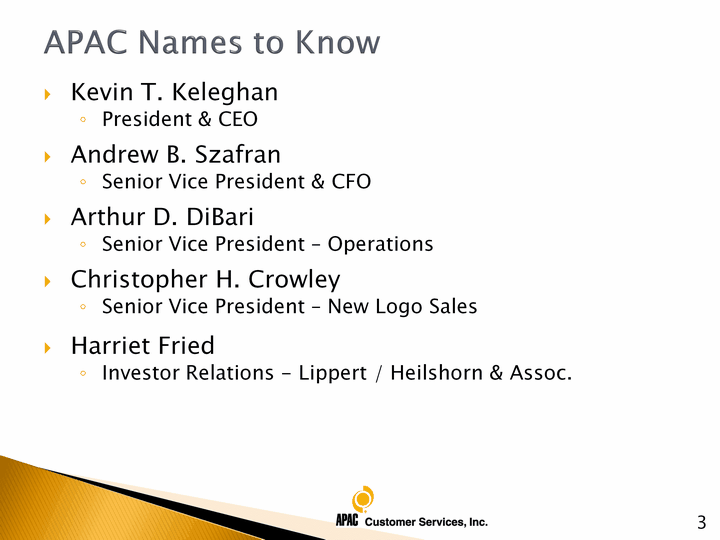
| APAC Names to Know Kevin T. KeleghanPresident & CEO Andrew B. SzafranSenior Vice President & CFOArthur D. DiBariSenior Vice President - OperationsChristopher H. CrowleySenior Vice President - New Logo SalesHarriet FriedInvestor Relations - Lippert / Heilshorn & Assoc. 3 |
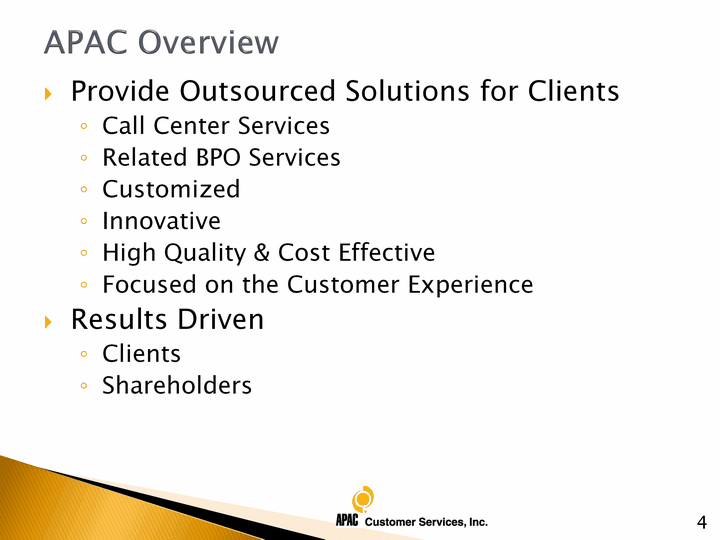
| APAC Overview Provide Outsourced Solutions for ClientsCall Center Services Related BPO ServicesCustomized Innovative High Quality & Cost EffectiveFocused on the Customer ExperienceResults DrivenClientsShareholders 4 |
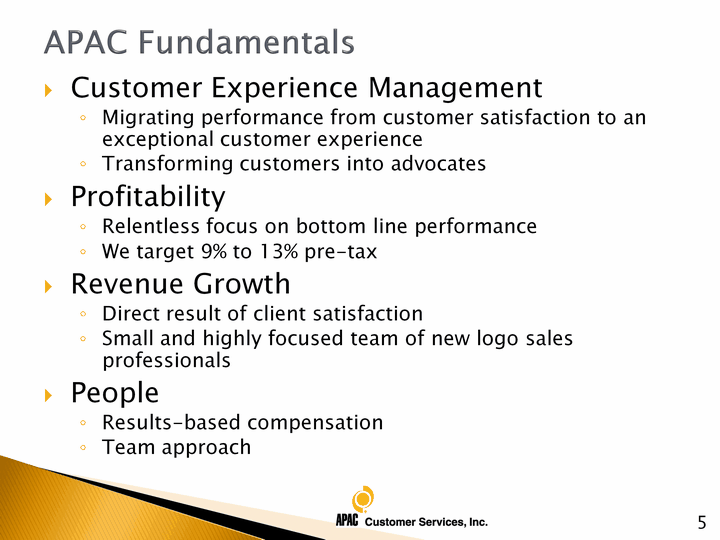
| APAC Fundamentals Customer Experience ManagementMigrating performance from customer satisfaction to an exceptional customer experienceTransforming customers into advocatesProfitabilityRelentless focus on bottom line performanceWe target 9% to 13% pre-taxRevenue GrowthDirect result of client satisfactionSmall and highly focused team of new logo sales professionalsPeopleResults-based compensation Team approach 5 |
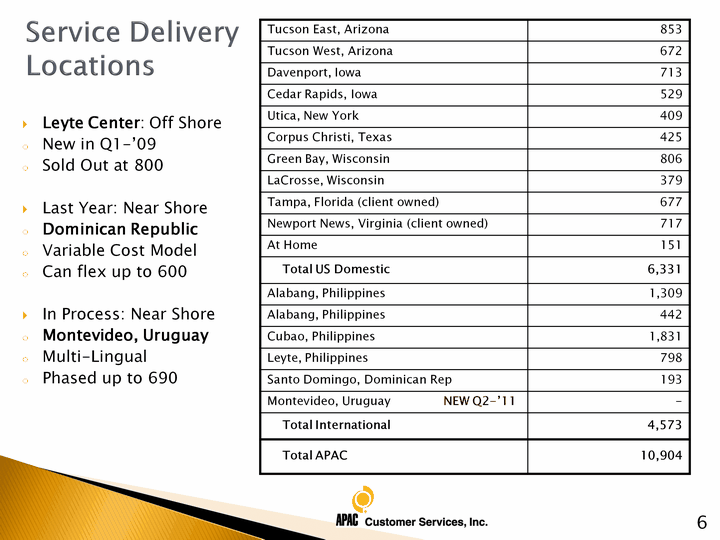
| Service Delivery Locations Locations Locations Leyte Center: Off ShoreNew in Q1-'09Sold Out at 800Last Year: Near Shore Dominican RepublicVariable Cost ModelCan flex up to 600In Process: Near Shore Montevideo, UruguayMulti-LingualPhased up to 690 6 |

| Who We Serve - a sampling... Three of the largest, U.S. based wireless communications companiesLargest worldwide logistics companyA Number of top healthcare insurance and pharmacy services companiesInnovative media & entertainment providerSeveral leading publishers of print mediaLeading online travel companyPremier worldwide financial and travel services companyMajor cable television providerLeader in social networking space Major utility companyInnovative technology and digital media company 7 |
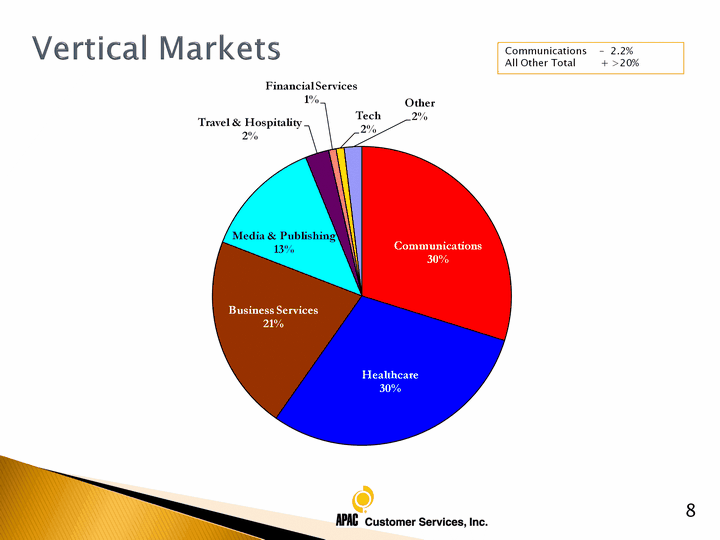
| Vertical Markets 8 (CHART) Communications - 2.2%All Other Total + >20% |
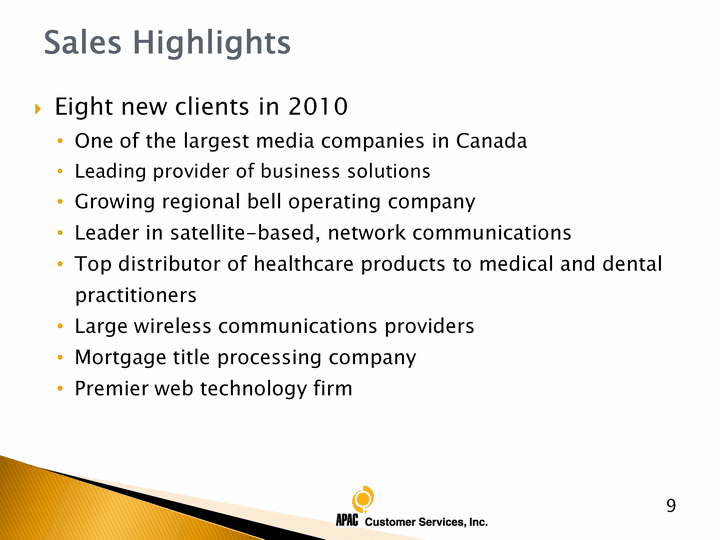
| 9 Sales Highlights Eight new clients in 2010One of the largest media companies in CanadaLeading provider of business solutionsGrowing regional bell operating companyLeader in satellite-based, network communicationsTop distributor of healthcare products to medical and dental practitionersLarge wireless communications providersMortgage title processing companyPremier web technology firm |
| 10 Operational Highlights Continued Focus on Quality ExecutionAdded depth to best in class operations teamExpanded sales team and investment in sales training Increased investment in training and ongoing skills certificationExpanded use of six sigma and lean management toolkits |

| 1. Percentage change is not meaningful2. See appendix Year-over-Year Comparison ($ in millions) 11 2010 (52 weeks) 2009 (53 weeks) Change Revenue $ 326.0 $ 293.2 ? 11.2% Gross Margin 21.0% 22.3% ? 130 bp Income Tax Expense (Benefit) $ 11.2 $ (23.3) NM1 Net Income $ 22.9 $ 58.1 ? 60.6% Adjusted EBITDA2 $ 49.4 $ 46.5 ? 6.2 % Cash $ 41.4 $ 20.6 ? $20.8 |
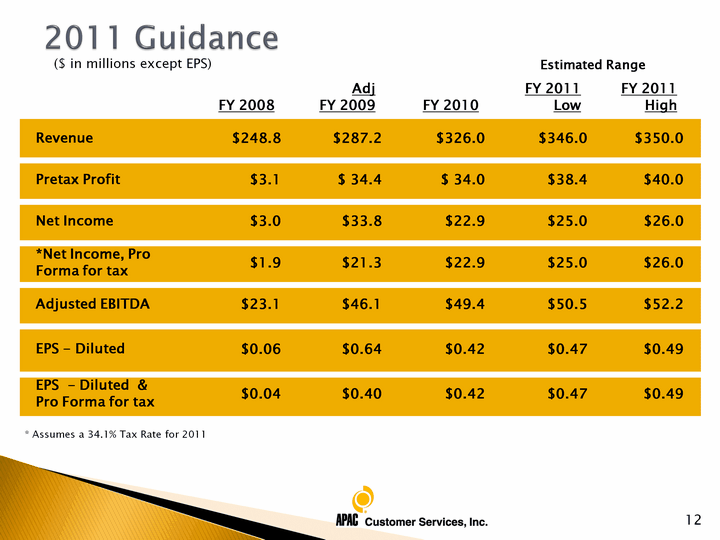
| 2011 Guidance FY 2008 Adj FY 2009 FY 2010 FY 2011 Low FY 2011 High Revenue $248.8 $287.2 $326.0 $346.0 $350.0 Pretax Profit $3.1 $ 34.4 $ 34.0 $38.4 $40.0 Net Income $3.0 $33.8 $22.9 $25.0 $26.0 *Net Income, ProForma for tax $1.9 $21.3 $22.9 $25.0 $26.0 Adjusted EBITDA $23.1 $46.1 $49.4 $50.5 $52.2 EPS - Diluted $0.06 $0.64 $0.42 $0.47 $0.49 EPS - Diluted &Pro Forma for tax $0.04 $0.40 $0.42 $0.47 $0.49 Estimated Range * Assumes a 34.1% Tax Rate for 2011 12 ($ in millions except EPS) |
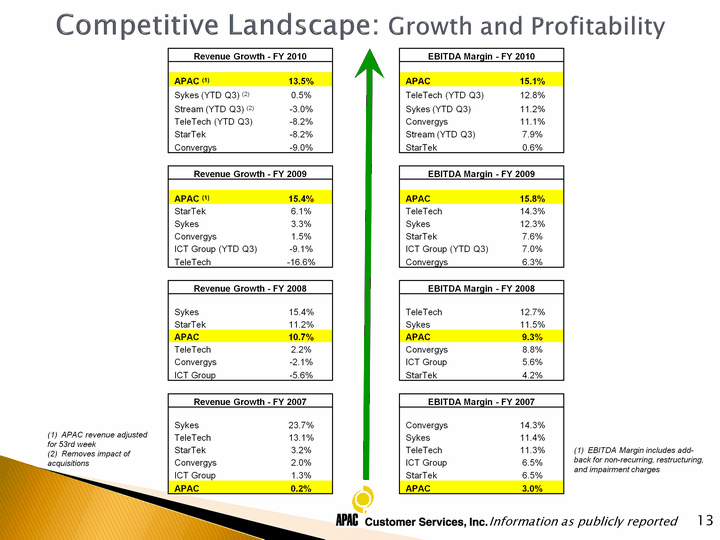
| Competitive Landscape: Growth and Profitability 13 Information as publicly reported Revenue Growth - FY 2010 Revenue Growth - FY 2010 EBITDA Margin - FY 2010 EBITDA Margin - FY 2010 APAC (1) 13.5% APAC 15.1% Sykes (YTD Q3) (2) 0.5% TeleTech (YTD Q3) 12.8% Stream (YTD Q3) (2) -3.0% Sykes (YTD Q3) 11.2% TeleTech (YTD Q3) -8.2% Convergys 11.1% StarTek -8.2% Stream (YTD Q3) 7.9% Convergys -9.0% StarTek 0.6% Revenue Growth - FY 2009 Revenue Growth - FY 2009 EBITDA Margin - FY 2009 EBITDA Margin - FY 2009 APAC (1) 15.4% APAC 15.8% StarTek 6.1% TeleTech 14.3% Sykes 3.3% Sykes 12.3% Convergys 1.5% StarTek 7.6% ICT Group (YTD Q3) -9.1% ICT Group (YTD Q3) 7.0% TeleTech -16.6% Convergys 6.3% Revenue Growth - FY 2008 Revenue Growth - FY 2008 EBITDA Margin - FY 2008 EBITDA Margin - FY 2008 Sykes 15.4% TeleTech 12.7% StarTek 11.2% Sykes 11.5% APAC 10.7% APAC 9.3% TeleTech 2.2% Convergys 8.8% Convergys -2.1% ICT Group 5.6% ICT Group -5.6% StarTek 4.2% Revenue Growth - FY 2007 Revenue Growth - FY 2007 EBITDA Margin - FY 2007 EBITDA Margin - FY 2007 Sykes 23.7% Convergys 14.3% TeleTech 13.1% Sykes 11.4% StarTek 3.2% TeleTech 11.3% Convergys 2.0% ICT Group 6.5% ICT Group 1.3% StarTek 6.5% APAC 0.2% APAC 3.0% (1) APAC revenue adjusted for 53rd week (2) Removes impact of acquisitions (1) EBITDA Margin includes add-back for non-recurring, restructuring, and impairment charges |
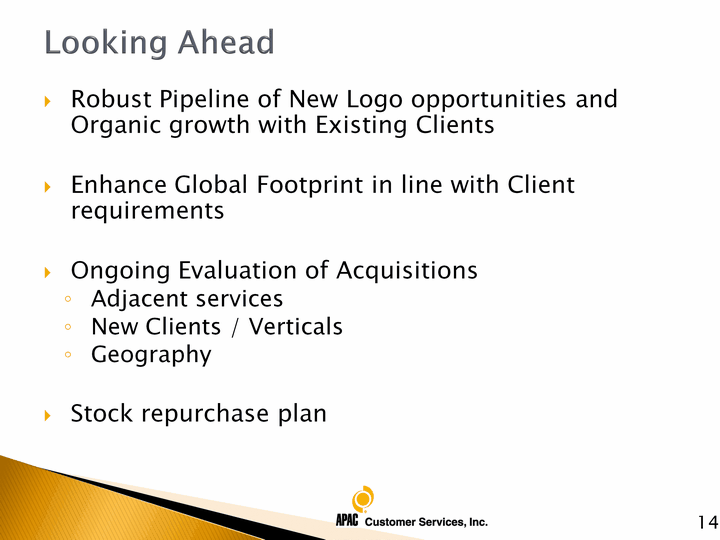
| Looking Ahead Robust Pipeline of New Logo opportunities and Organic growth with Existing ClientsEnhance Global Footprint in line with Client requirementsOngoing Evaluation of AcquisitionsAdjacent servicesNew Clients / VerticalsGeographyStock repurchase plan 14 |
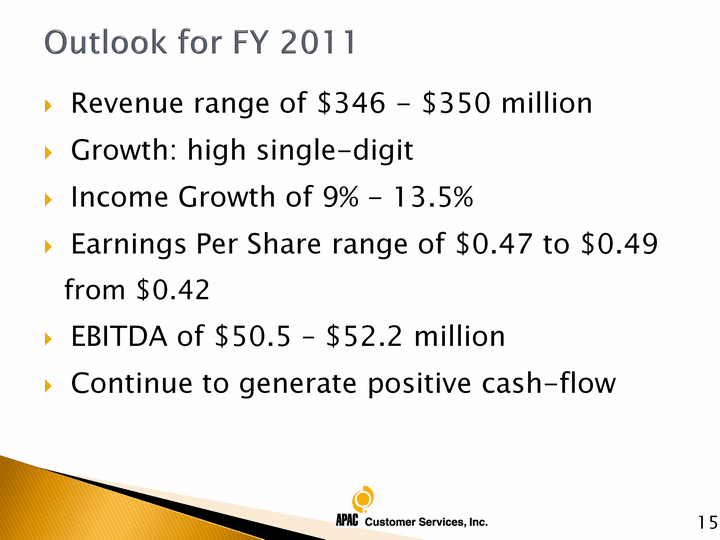
| Outlook for FY 2011 Revenue range of $346 - $350 million Growth: high single-digitIncome Growth of 9% - 13.5%Earnings Per Share range of $0.47 to $0.49 from $0.42EBITDA of $50.5 - $52.2 millionContinue to generate positive cash-flow 15 |
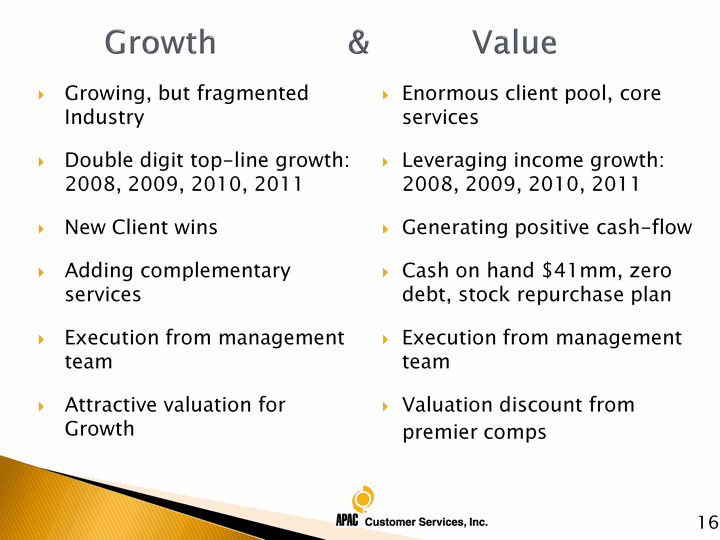
| Growth & Value Growing, but fragmented IndustryDouble digit top-line growth: 2008, 2009, 2010, 2011New Client winsAdding complementary servicesExecution from management teamAttractive valuation for Growth 16 Enormous client pool, core servicesLeveraging income growth: 2008, 2009, 2010, 2011Generating positive cash-flowCash on hand $41mm, zero debt, stock repurchase planExecution from management teamValuation discount from premier comps |

| APPENDIX 17 |
| Appendix - Non-GAAP Financial Information To supplement our consolidated financial statements presented in accordance with accounting principles generally accepted in the United States (GAAP), we use EBITDA, adjusted EBITDA and certain adjusted financial results, which are defined as a non-GAAP financial measures by the SEC. The presentation of this non-GAAP financial information is not intended to be considered in isolation or as a substitute for the financial information presented in accordance with GAAP. The items excluded from this non-GAAP financial information are significant components of our financial statements and must be considered so in performing a comprehensive analysis of our overall financial results.We believe that this non-GAAP financial information provides meaningful supplemental information regarding our performance and liquidity by excluding certain expenses that may not be indicative of our core business operating results. We believe management, investors and lenders benefit from referring to this non-GAAP financial information in assessing our performance and when planning, forecasting and analyzing future periods. This non-GAAP financial information also facilitates internal comparisons to our historical performance and liquidity. We believe that this non-GAAP financial information is useful to investors and analysts in allowing for greater transparency with respect to supplemental information used by us in our financial and operational decision making.Our calculations of this non-GAAP financial information may not be consistent with calculations of similar measures used by other companies. The accompanying tables have more details on the GAAP financial measures that are most directly comparable to this non-GAAP financial information and the related reconciliations between these financial measures.Additional information on this non-GAAP financial information can be found in our Annual Report on Form 10-K for the year ended January 2, 2011. 18 |
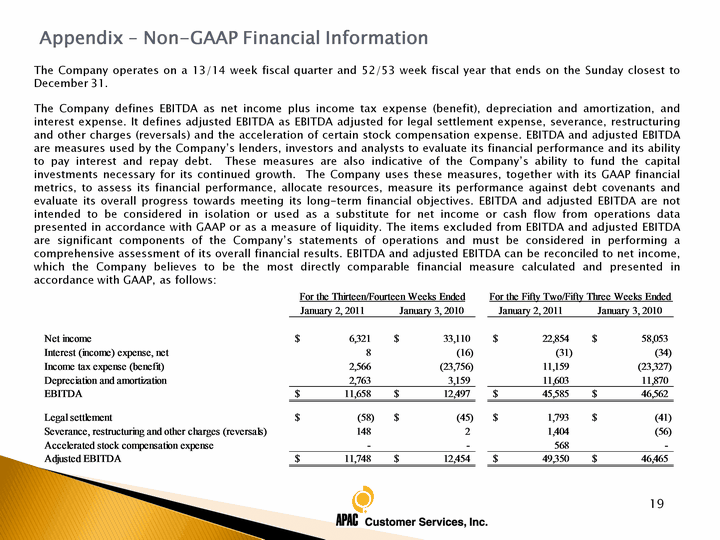
| Appendix - Non-GAAP Financial Information The Company operates on a 13/14 week fiscal quarter and 52/53 week fiscal year that ends on the Sunday closest to December 31. The Company defines EBITDA as net income plus income tax expense (benefit), depreciation and amortization, and interest expense. It defines adjusted EBITDA as EBITDA adjusted for legal settlement expense, severance, restructuring and other charges (reversals) and the acceleration of certain stock compensation expense. EBITDA and adjusted EBITDA are measures used by the Company's lenders, investors and analysts to evaluate its financial performance and its ability to pay interest and repay debt. These measures are also indicative of the Company's ability to fund the capital investments necessary for its continued growth. The Company uses these measures, together with its GAAP financial metrics, to assess its financial performance, allocate resources, measure its performance against debt covenants and evaluate its overall progress towards meeting its long-term financial objectives. EBITDA and adjusted EBITDA are not intended to be considered in isolation or used as a substitute for net income or cash flow from operations data presented in accordance with GAAP or as a measure of liquidity. The items excluded from EBITDA and adjusted EBITDA are significant components of the Company's statements of operations and must be considered in performing a comprehensive assessment of its overall financial results. EBITDA and adjusted EBITDA can be reconciled to net income, which the Company believes to be the most directly comparable financial measure calculated and presented in accordance with GAAP, as follows: 19 |
| Appendix - Non-GAAP Financial Information Adjusted financial results measure revenue, and profit adjusted for the income tax benefit resulting from the reversal of the valuation allowance and the financial impact of the additional week of operating results for fiscal year 2009. The presentation of adjusted financial results is not intended to be considered in isolation or as a substitute for net income presented in accordance with GAAP. The items excluded from adjusted financial results are significant components of the Company's financial statements and must be considered in performing a comprehensive assessment of its overall financial results. The Company believes this information is useful to investors and analysts in order to provide a better understanding of the operating results of the Company on a comparable basis. It believes that this information provides investors and analysts with a more complete understanding of underlying operating results and ongoing operations by excluding the effect of infrequent activities. The Company uses this information, together with our GAAP financial metrics, to assess its financial performance, allocate resources, and evaluate its overall progress towards meeting its long-term financial objectives. The Company recognizes that the computation of adjusted financial results may not be consistent with calculations of similar information used by other companies. The accompanying table has more details on the GAAP financial measures that are most directly comparable to adjusted financial results and the related reconciliations between this financial information. Adjusted financial results for the 53 weeks ended January 3, 2010 can be reconciled to revenue, gross profit, income before taxes, income tax expense (benefit), and net income, which the Company believes to be the most directly comparable financial measures calculated and presented in accordance with GAAP, as follows: 20 |
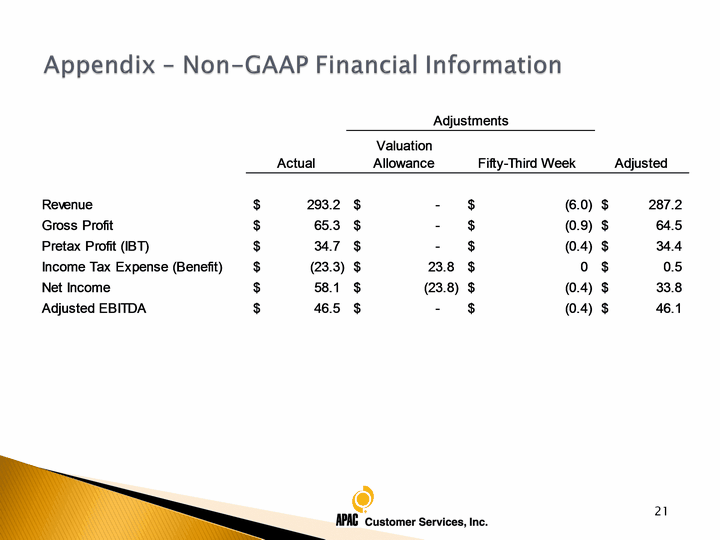
| Appendix - Non-GAAP Financial Information 21 |
