Attached files
| file | filename |
|---|---|
| 8-K - UIL FORM 8-K DATED FEBRUARY 22, 2011 - UIL HOLDINGS CORP | uil_form8kdated2222011.htm |
| EX-99 - UIL EXHIBIT 99 - EARNINGS RELEASE - UIL HOLDINGS CORP | uil_exh99.htm |

1
4Q ’10 Earnings
4Q & FY 2010 Earnings Conference Call
February 23, 2011
EXHIBIT 99.1

2
4Q ’10 Earnings
Important Note to Investors
James P. Torgerson
President and Chief Executive Officer
Richard J. Nicholas
Executive Vice President and Chief Financial Officer
Safe Harbor Provision
Certain statements contained herein, regarding matters that are not historical facts, are forward-looking statements (as defined in the
Private Securities Litigation Reform Act of 1995). These include statements regarding management’s intentions, plans, beliefs,
expectations or forecasts for the future. Such forward-looking statements are based on UIL Holdings’ expectations and involve risks and
uncertainties; consequently, actual results may differ materially from those expressed or implied in the statements. Such risks and
uncertainties include, but are not limited to, general economic conditions, legislative and regulatory changes, changes in demand for
electricity, gas and other products and services, unanticipated weather conditions, changes in accounting principles, policies or guidelines,
and other economic, competitive, governmental, and technological factors affecting the operations, markets, products and services of UIL
Holdings’ subsidiaries, The United Illuminating Company, The Southern Connecticut Gas Company, Connecticut Natural Gas
Corporation and The Berkshire Gas Company. Such risks and uncertainties with respect to UIL Holdings’ recent acquisition of The
Southern Connecticut Gas Company, Connecticut Natural Gas Corporation and The Berkshire Gas Company include, but are not limited
to, the possibility that the expected benefits will not be realized, or will not be realized within the expected time period. The foregoing and
other factors are discussed and should be reviewed in UIL Holdings’ most recent Annual Report on Form 10-K and other subsequent
periodic filings with the Securities and Exchange Commission. Forward-looking statements included herein speak only as of the date hereof
and UIL Holdings undertakes no obligation to revise or update such statements to reflect events or circumstances after the date hereof or to
reflect the occurrence of unanticipated events or circumstances.

3
4Q ’10 Earnings
2010 Accomplishments/Milestones
ü 13% increase in 2010 net income, excluding acquisition & transition related
expenses, compared to 2009
expenses, compared to 2009
ü Transformative gas companies acquisition completed within six months of
announcement
announcement
ü GenConn Devon became operational
ü GenConn Middletown - 92.4% complete as of year-end
ü Investing in Connecticut portion of New England East West Solution
projects
projects
ü Executing on 10-year capital expenditure plan - driving long-term earnings
growth
growth

4
4Q ’10 Earnings
Gas Company Integration
Working diligently internalizing the Transition Services Agreement (TSA)
› Support services such as IT, Finance and Human Resources provided by
Iberdrola, USA (IUSA) with the ability to terminate any service given 90 days
notice
Iberdrola, USA (IUSA) with the ability to terminate any service given 90 days
notice
Integration activities are well underway
› Implementation of these initiatives is expected to continue through this year with
most completed before 2012
most completed before 2012
2012 savings opportunities - identified & quantified
› IUSA 2009 allocated corporate overheads, support costs and shared services
totaled $23M
totaled $23M
» $11.6M of expected savings to be in place in 2012
5
4Q ’10 Earnings
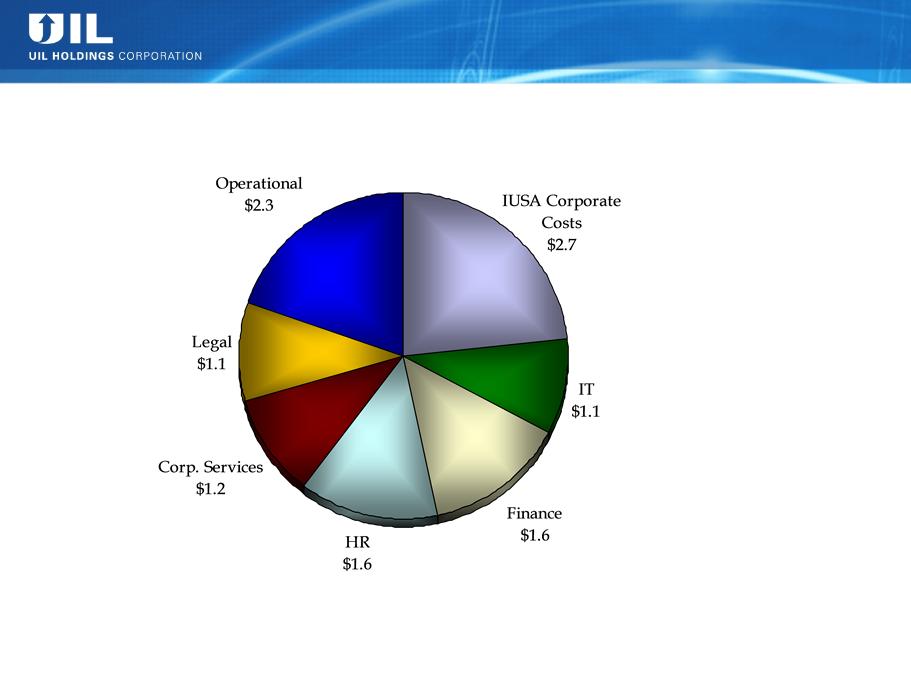
Expected $11.6M of Identified Savings
net
2012 Shared Services Identified Savings

6
4Q ’10 Earnings
› Scheduled: draft - 3/21/11, final - 4/13/11
› Continued until final decision on pilot to be
made as part of UI’s ’10 rate year decoupling
filing due by 4/4/11
made as part of UI’s ’10 rate year decoupling
filing due by 4/4/11
› As of 12/31/10 - approximately $1.9M owed to
customers
customers
|
|
|
|
|
|
SCG Potential Overearnings
Generic ROE Proceeding
UI Electric Decoupling
SCG/CNG Rate Case Appeals
› Potential for UI to file distribution rate case for rates in effect in 2012 to reflect
significant investments in distribution infrastructure
significant investments in distribution infrastructure
› DPUC docket opened 12/28/10
› Scheduled: draft - 3/25/11, final - 4/13/11
› Pending at the CT Supreme Court
› Previous allowed returns in effect pending
appeals - SCG 10%, CNG 10.1%
appeals - SCG 10%, CNG 10.1%
7
4Q ’10 Earnings
Cash*
EPS*
2010A
2011P
$97 million
(0.05)
$
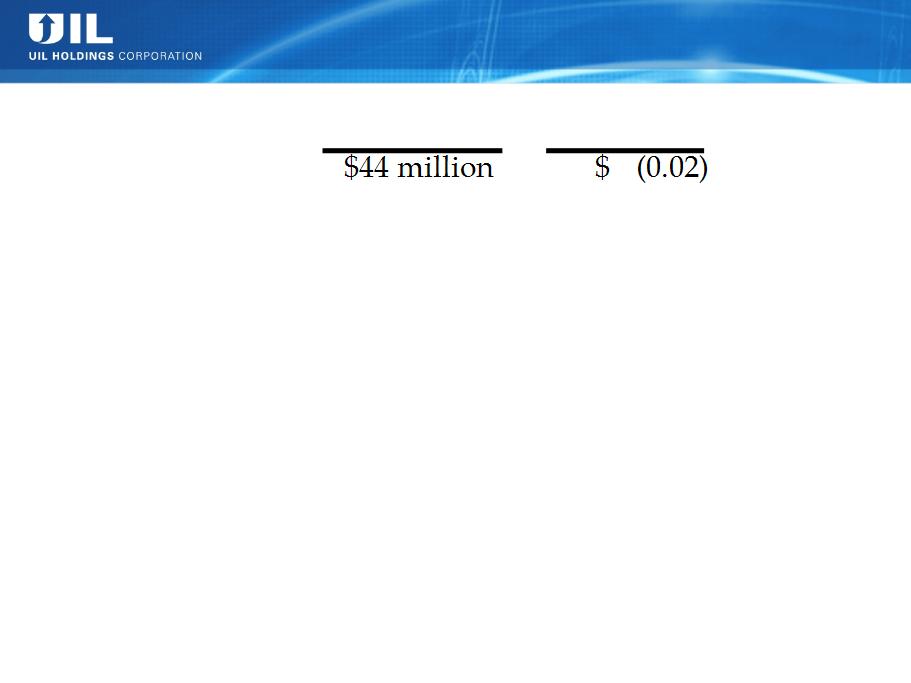
Bonus Depreciation 2010 & 2011
* Based on current expectations
Efficient use of cash benefits from bonus depreciation
› Expected pension contributions of $65-$75M to the electric and gas pension
plans in 2011
plans in 2011
› Reduces pension costs and increases rate base
Expect no need for external equity for at least the next 3 years
8
4Q ’10 Earnings

9
4Q ’10 Earnings
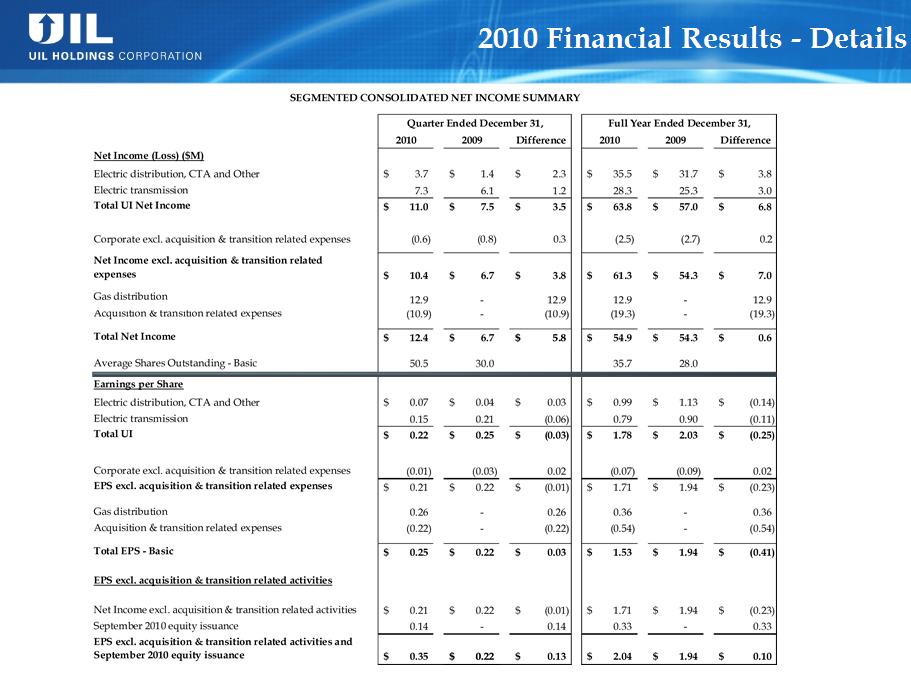
2010 Financial Results - Details
Electric distribution, CTA & other
› 12% increase in net income compared to ’09
» Increased operating income due to rate increase effective 1/1/10, partially offset by lower CTA rate
base
base
» Earnings of $1.2M from UI’s equity investment in GenConn
» Average earned ROE of 9.18% after sharing
Electric transmission
› 12% increase in net income compared to ’09
» Increase in AFUDC coupled with higher rate base
» Weighted average ROE of 12.5%
Gas distribution
› Net income of $12.9M from acquisition close (11/17/10 - 12/31/10)
› Expected final average ROEs; SCG 10.60% - 10.80%, CNG 8.95% - 9.05%
› 1.3% increase in customers in ‘10
Acquisition & transition related expenses - $19.3M after-tax
Bonus depreciation effect on ’10 results based on current expectations - ($0.6M)
EPS dilution from Sept. ’10 equity issuance - $0.33 per share

10
4Q ’10 Earnings
UI Equity Bridge Loan
UIL Debt retired 2/15/11
Liquidity Overview (12/31/10)
Near-Term Debt Maturities
($M)
*
* To be remarketed
Amounts may not add due to rounding.
No
Expect no need for external equity for at least the next 3 years
($M)
Debt Maturity and Liquidity Profile

11
4Q ’10 Earnings
($ millions)
The annual long-term capital spending update will be presented at the Fall EEI
Financial conference
Financial conference
Central Facility
New business main & services,
system improvements, fleet, IT
system improvements, fleet, IT
Capital costs relating to the
integration of the gas companies,
mainly IT-related
integration of the gas companies,
mainly IT-related
Major Variance Explanations
Note: *2010 Gas distribution capex reflects the full year amount; UIL ownership was for 6 weeks effective with the closing on the acquisition.
2011 Capex Update
12
4Q ’10 Earnings
12
Updated Near-Term Average Rate Base Profile
28%
23%
7%
30%
22%
5%
35%
3%
40%
1%
23%
38%
37%
39%
43%
22%
38%
24%
36%
40%
24%
Electric distribution
CTA
Gas distribution*
Electric transmission
UI’s 50% Share ($M): 2010A 2011P 2012P 2013P 2014P 2015P
Avg. GenConn RB Equivalent: $ 51 $ 140 $ 164 $ 156 $ 149 $ 142
Avg. Gen Conn Equity “Rate Base” $ 25 $ 70 $ 82 $ 78 $ 75 $ 71
Rate Base (Excluding GenConn Equity Investments):
GenConn Equity Investments:
Notes: *2010 Gas distribution average rate base reflects the full year; UIL ownership was for 6 weeks effective with the closing on the acquisition. For comparability purposes, Gas distribution excludes the impacts
of 338(h)(10) election.
of 338(h)(10) election.
Amounts may not add due to rounding.
42%
13
4Q ’10 Earnings
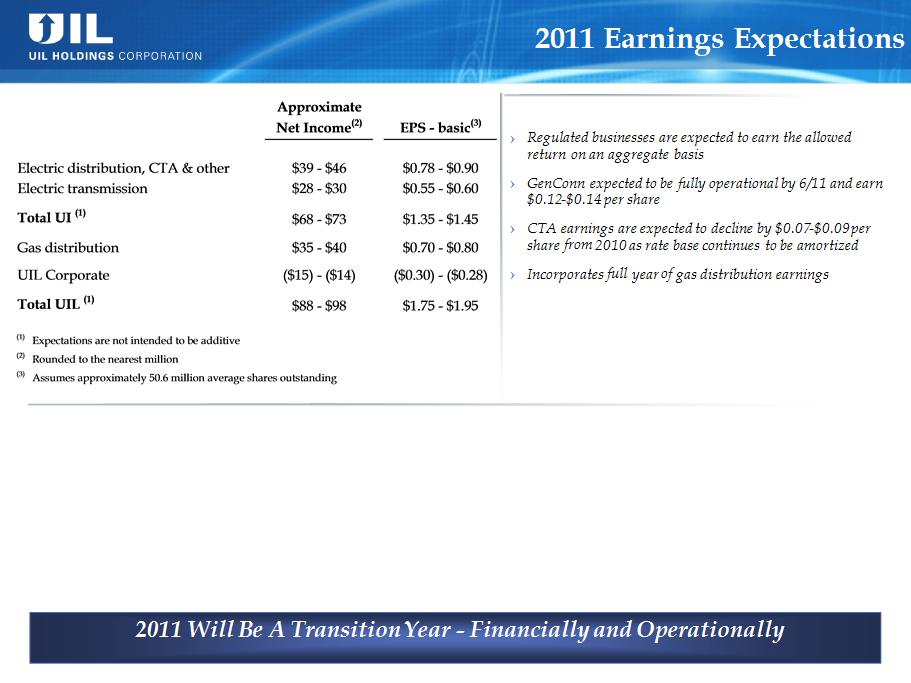
Assumptions
› Bonus depreciation is expected to have a net impact of
($0.05) per share
($0.05) per share
› Includes one-time costs for the transition of the gas
distribution business support services from IUSA, as well
as the on-going integration costs
distribution business support services from IUSA, as well
as the on-going integration costs
,
2011 Operational Snapshot
› Integration of all of the regulated businesses with an emphasis on process integration initiatives and best practices
› Exiting the TSA by year-end for vast majority of services
› Positioning to realize half of IUSA’s ‘09 allocated corporate charges of $23M à expected savings of $11.6M in 2012
› Continued focus on management of O&M expenses at each of our regulated businesses
› Execution of capital expenditure plan at each of our regulated businesses
14
4Q ’10 Earnings
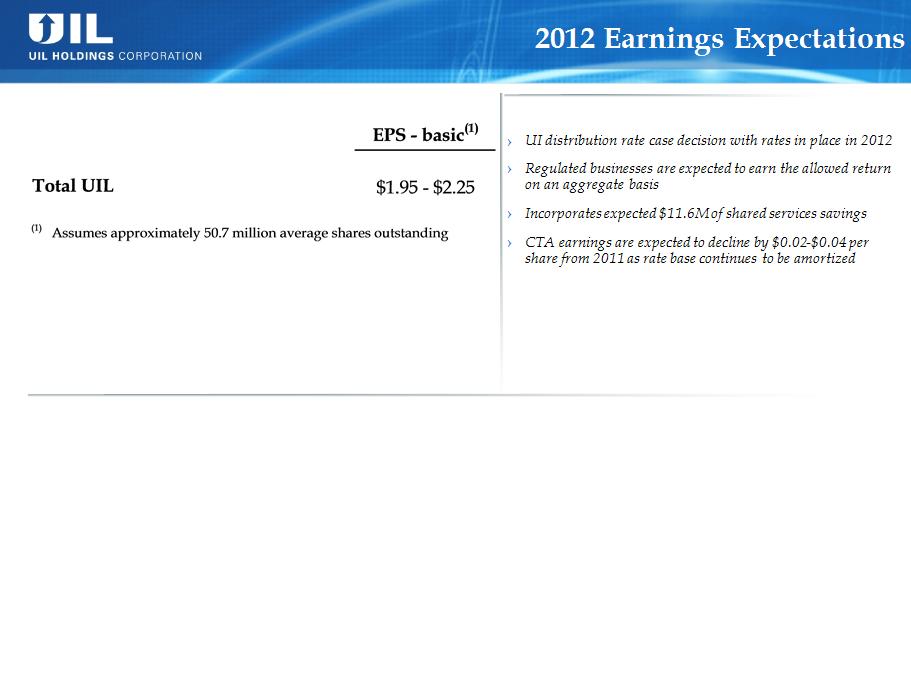
Assumptions
› Bonus depreciation is expected to have a net impact of ($0.10)
per share
per share
2012 Operational Snapshot
› Integration of all of the regulated businesses with an emphasis on process integration initiatives and best practices
› Completely exiting the TSA
› Continued focus on management of O&M expenses at each of our regulated businesses
› Execution of capital expenditure plan at each of our regulated businesses

15
4Q ’10 Earnings
Closing Remarks
Ø Closed on gas company acquisitions & moving forward with integration
activities with 2011 being a transition year
activities with 2011 being a transition year
Ø GenConn Devon operational - Middletown expected to be fully operational by
June 2011
June 2011
Ø Expecting to earn allowed returns on all regulated businesses on an aggregate
basis
basis
Ø Continued management of O&M expenses
Ø Executing on capital expenditure plan - realizing rate base growth
Ø Continue to seek out Transmission opportunities in our service territory and
beyond
beyond
Ø Expect no need for external equity for at least the next 3 years

16
Q&A

17
Appendix

18
Expected Impacts of Bonus Depreciation - 2010 & 2011
19
$494
$492
$535
$564
$681
$735
$798
$851
$853
$906
$906
$958
$405
$405
$401
$407
$422
$435
$496
$511
$514
$538
$529
$561
$766
$857
$777
$863
$788
$869
$799
$882
$811
$885
$751
$-
$500
$1,000
$1,500
$2,000
$2,500
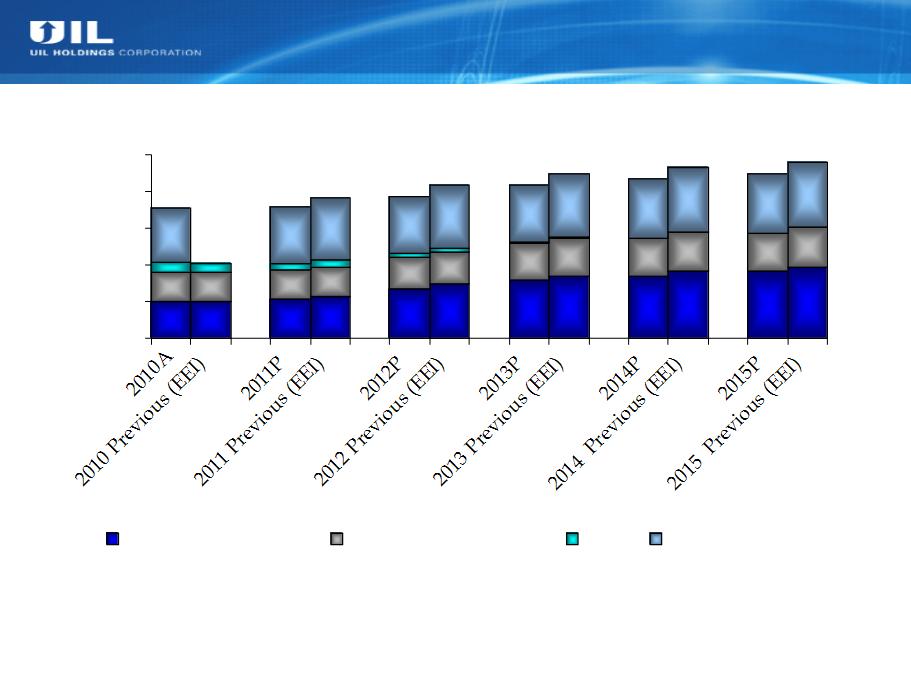
Electric distribution
Electric transmission
CTA
Gas distribution
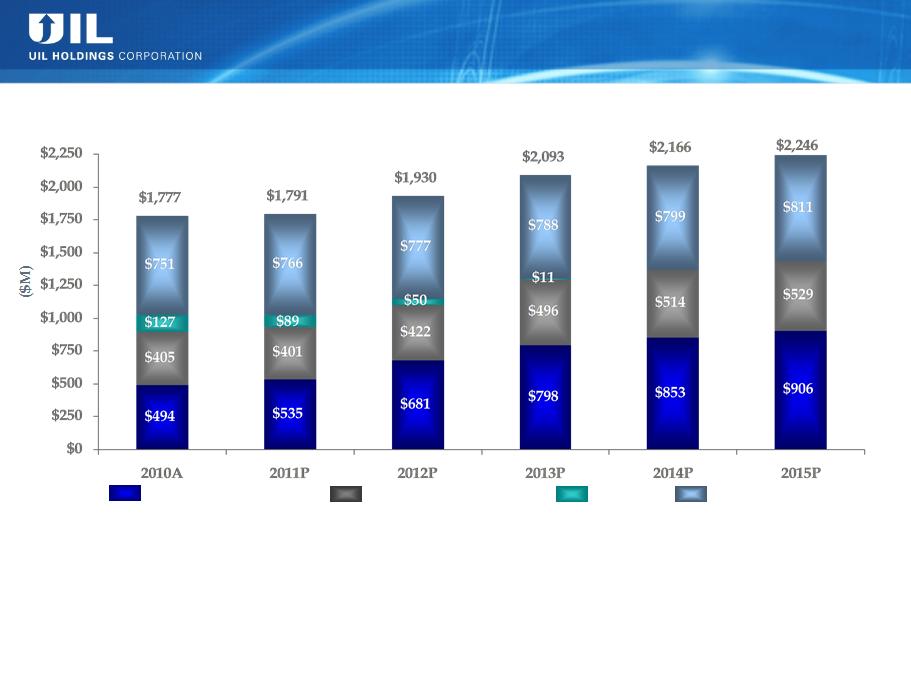
(1) CTA Avg Rate Base figures in current forecast are $127M ’10, $89 ’11, $50M ’12 and $11M ’13
(2) 2010 Gas distribution average rate base reflects the full year; UIL ownership was for 6 weeks effective with the closing on the acquisition. For comparability
purposes, Gas distribution excludes the impacts of 338(h)(10) election.
purposes, Gas distribution excludes the impacts of 338(h)(10) election.
Amounts may not add due to rounding.
(2)
(1)
($M)
$1,025
$1,791
$1,920
$1,930
$1,777
$2,087
$2,093
$2,246
$2,166
$2,326
$2,246
$2,404
Average Rate Base 2010 - 2015
Current Forecast vs. EEI Forecast
Current Forecast vs. EEI Forecast
20
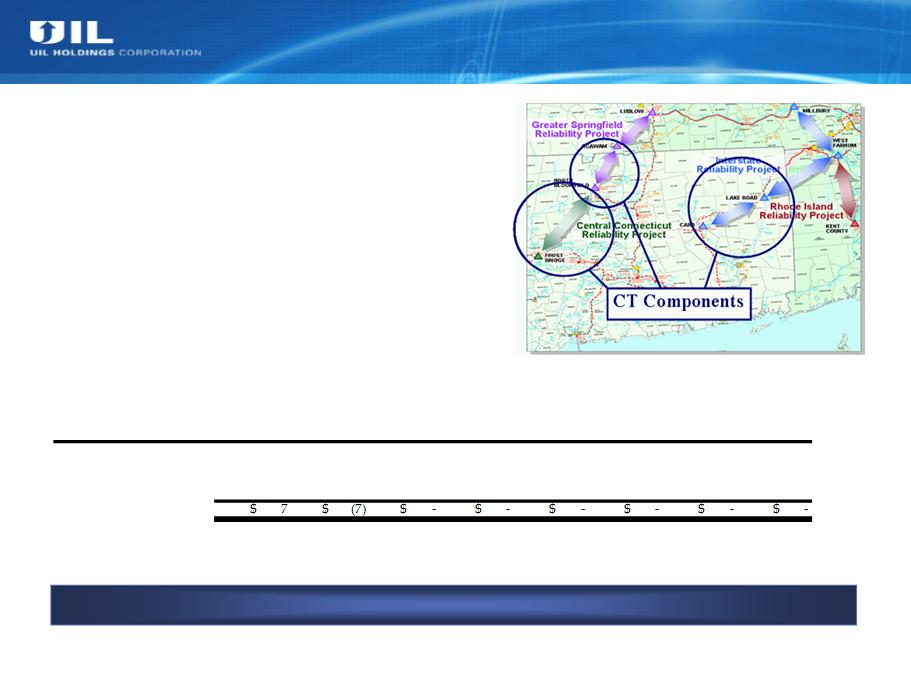
UI Transmission - NEEWS Investment
UI Participation in CL&P Project:
› UI’s portion of investment: greater of
$60M or 8.4% of CL&P’s costs for the
CT portions …
$60M or 8.4% of CL&P’s costs for the
CT portions …
› 8.4% currently estimated at
approximately $69M (increased from
original estimate of $60M)
approximately $69M (increased from
original estimate of $60M)
› First deposit made in December 2010
UI’s anticipated investment increased from $60M to $69M
Refreshed UI Investment Amounts and Timeline:
($ millions)
Potential UI Investment*
2010A
2011P
2012P
2013P
2014P
2015P
2016P
Total
Current Projection
7
$
3
$
9
$
8
$
12
$
23
$
7
$
69
$
Previous Projection
-
$
10
$
9
$
8
$
12
$
23
$
7
$
69
$
Difference
* Based on NU's latest projection of UI's Investment in CL&P's portion of the NEEWS Projects.
21
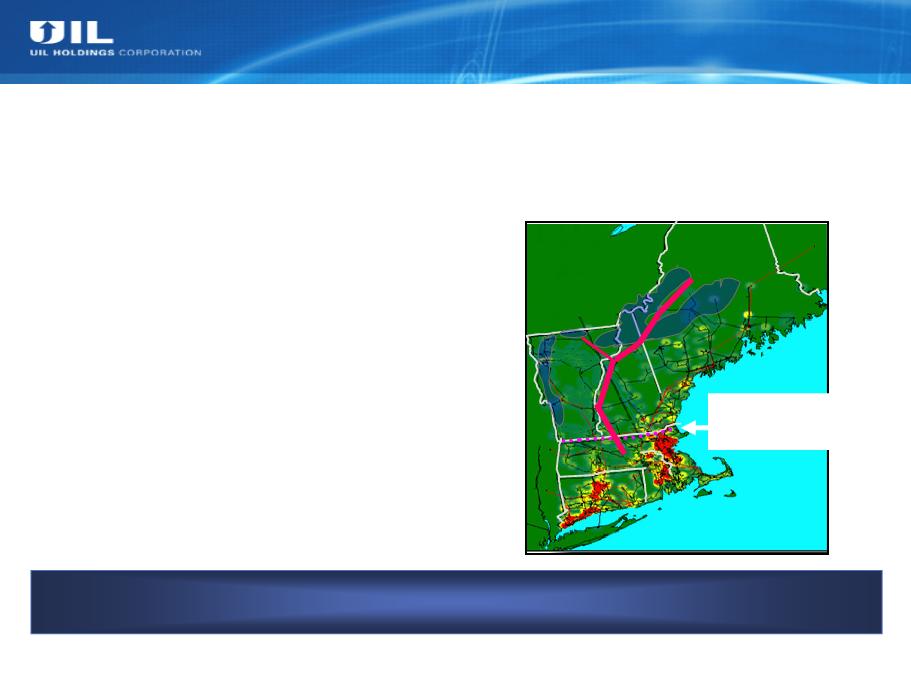
Renewable-Enabling Transmission
21
Collaborative effort: UI, NU, NSTAR, and NGrid …
to research / identify the most economical means of satisfying future RPS obligations
Significant Region-Wide Need:
› RPS requirement > 3x current
available renewables*
available renewables*
› CT requirement is > UI’s entire load
› Gap will be filled by renewables
remote from load
remote from load
N.E. Governors’ Blueprint:
› Significant transmission build-out
indicated
indicated
› Potential $7 to $10B range - could be
higher or lower to satisfy a 4,000 to
12,000 MW need
higher or lower to satisfy a 4,000 to
12,000 MW need
› Cost to New England likely much less
than Midwestern wind
than Midwestern wind
Potential Solutions Under Study
› Need will likely be satisfied by a portfolio
of projects
of projects
› One promising example is shown below
Notes: *From ISO-NE presentation dated 5/15/09 - driven by 2008 data.
Vast majority of
potential onshore
renewables (wind)
potential onshore
renewables (wind)
are in northern NE
North-South Interface:
80% of NE electric
load is below this line
load is below this line

22
22
UIL - Corporate Structure, Service Areas
› Service territory: 335 sq
miles
miles
› ~325,000 customers
› 1,095 employees
› Allowed Distribution ROE
of 8.75%
of 8.75%
› Earned ’10 Transmission
ROE (composite) of 12.5%
ROE (composite) of 12.5%
› 50% interest in GenConn
Energy LLC
Energy LLC
The United Illuminating
Company (UI)
Company (UI)
Note: (1) Includes 10 basis point penalty reduction. Previously authorized 10.0% & 10.1% at SCG & CNG respectively, in effect pending resolution of rate case appeals.
UIL Holdings
Corporation
Corporation
Service Area Key
SCG
CNG
UI
Berkshire
Overlapping Territory
› Service territory: 716 sq
miles - Greater Hartford-
New Britain & Greenwich
miles - Greater Hartford-
New Britain & Greenwich
› ~160,000 customers
› 319 employees
› 2,011 miles of mains with
~124,000 services
~124,000 services
Connecticut Natural Gas
(CNG)
(CNG)
› Service territory: 738 sq
miles in Western MA
including Pittsfield and
North Adams
miles in Western MA
including Pittsfield and
North Adams
› ~36,000 customers
› 120 employees
› 738 miles of mains
› Allowed ROE of 10.50%
Berkshire Gas Company
(Berkshire)
(Berkshire)
› Service territory: 512 sq
miles from Westport, CT to
Old Saybrook, CT
miles from Westport, CT to
Old Saybrook, CT
› ~178,000 customers
› 290 employees
› 2,269 miles of mains with
~131,000 services
~131,000 services
Southern Connecticut Gas
(SCG)
(SCG)

23
|
|
||||||
|
|
|
› Connecticut Department of Public Utility Control (DPUC)
› Currently operating under rates established in 2009*
› Allowed ROE of 8.75%, based on a capital structure of 50.0% equity
|
||||
|
|
|
› Federal Energy Regulatory Commission (FERC)
› Transmission trued up on an annual basis to allowed composite ROE based on FERC approved formula rate
› 2010 composite ROE of 12.5%, based on a capital structure of 50.0% equity
|
||||
|
› DPUC approved Contracts for Differences with CL&P (subsidiary of Northeast Utilities) and cost sharing agreement
(80% CL&P / 20% UI) › Allowed ROE has a lifetime floor of 9.75% based on a capital structure of 50.0% equity
|
||||||
|
|
|
› Connecticut Department of Public Utility Control (DPUC)
› 2009 rate case decision is under appeal and has been stayed pending determination of the appeal
› Currently operating under old rates with embedded overearnings credit - new rates per rate case virtually the same as old
rates currently in place › Allowed ROE of 9.26% (previously allowed return of 10.0% in effect pending appeal), based on a capital structure of 52.0%
equity |
||||
|
|
› Massachusetts Department of Public Utilities (DPU)
› 10 year constructive rate plan expiring 1/31/12
› Rates adjusted annually based on inflation and other factors
|
|||||
Regulatory Overview
Distribution
Transmission
* The revenue decoupling mechanism will be reviewed by the DPUC in 2011.
› Connecticut Department of Public Utility Control (DPUC)
› 2009 Rate Case decision is under appeal and has been stayed pending determination of the appeal
› Currently operating under old rates with embedded overearnings credit - new rates per rate case virtually the same as old
rates currently in place
rates currently in place
› Allowed ROE of 9.31% (previously allowed return of 10.1% in effect pending appeal), based on a capital structure of 52.5%
equity
equity