Attached files
| file | filename |
|---|---|
| 8-K - SKT YEAR END 12.31.2010 EARNINGS RELEASE 8-K - TANGER FACTORY OUTLET CENTERS, INC | a8kpressrelease.htm |
| EX-99.1 - SKT YEAR END 12.31.2010 EARNINGS RELEASE - TANGER FACTORY OUTLET CENTERS, INC | skt8kex991.htm |

Tanger Factory Outlet Centers, Inc.
Supplemental Operating and Financial Data
December 31, 2010
1
Supplemental Operating and Financial Data for the
Year Ended 12/31/10

Notice
For a more detailed discussion of the factors that affect our operating results, interested parties should review the Tanger Factory Outlet Centers, Inc. Annual Report on Form 10-K for the fiscal year ended December 31, 2010.
This Supplemental Operating and Financial Data is not an offer to sell or a solicitation to buy any securities of the Company. Any offers to sell or solicitations to buy any securities of the Company shall be made only by means of a prospectus.
2
Supplemental Operating and Financial Data for the
Year Ended 12/31/10
Table of Contents
Section | ||
Portfolio Data: | ||
Geographic Diversification | 4 | |
Property Summary - Occupancy at End of Each Period Shown | 5 | |
Portfolio Occupancy at the End of Each Period | 7 | |
Major Tenants | 8 | |
Lease Expirations as of December 31, 2010 | 9 | |
Leasing Activity | 10 | |
Financial Data: | ||
Consolidated Balance Sheets | 11 | |
Consolidated Statements of Operations | 12 | |
FFO and FAD Analysis | 14 | |
Unconsolidated Joint Venture Information | 15 | |
Debt Outstanding Summary | 18 | |
Future Scheduled Principal Payments | 19 | |
Senior Unsecured Notes Financial Covenants | 19 | |
Investor Information | 20 | |
3
Supplemental Operating and Financial Data for the
Year Ended 12/31/10
Geographic Diversification
As of December 31, 2010 | ||||||||
State | # of Centers | GLA | % of GLA | |||||
South Carolina | 4 | 1,388,479 | 15 | % | ||||
New York | 1 | 729,475 | 8 | % | ||||
Georgia | 2 | 664,380 | 7 | % | ||||
Pennsylvania | 2 | 628,124 | 7 | % | ||||
Texas | 2 | 619,729 | 7 | % | ||||
Delaware | 1 | 568,900 | 6 | % | ||||
Alabama | 1 | 557,299 | 6 | % | ||||
North Carolina | 3 | 505,323 | 5 | % | ||||
Michigan | 2 | 436,751 | 5 | % | ||||
Tennessee | 1 | 419,038 | 5 | % | ||||
Missouri | 1 | 302,922 | 3 | % | ||||
Utah | 1 | 298,379 | 3 | % | ||||
Connecticut | 1 | 291,051 | 3 | % | ||||
Louisiana | 1 | 282,403 | 3 | % | ||||
Iowa | 1 | 277,230 | 3 | % | ||||
Oregon | 1 | 270,212 | 3 | % | ||||
Illinois | 1 | 250,439 | 3 | % | ||||
New Hampshire | 1 | 245,698 | 3 | % | ||||
Florida | 1 | 198,950 | 2 | % | ||||
California | 1 | 171,300 | 2 | % | ||||
Maine | 2 | 84,313 | 1 | % | ||||
Total (1) | 31 | 9,190,395 | 100 | % | ||||
(1) | Excludes one 265,061 square foot center in Wisconsin Dells, WI, of which Tanger owns a 50% interest through a joint venture arrangement. Also, excludes one 653,780 square foot shopping center and one 29,253 square foot warehouse in Deer Park, NY of which Tanger owns a 33.3% interest through a joint venture arrangement. |
4
Supplemental Operating and Financial Data for the
Year Ended 12/31/10
Property Summary - Occupancy at End of Each Period Shown
Wholly-owned properties
Location | Total GLA 12/31/10 | % Occupied 12/31/10 | % Occupied 9/30/10 | % Occupied 6/30/10 | % Occupied 3/31/10 | % Occupied 12/31/09 | |||||||||||
Riverhead, NY | 729,475 | 100 | % | 100 | % | 99 | % | 99 | % | 99 | % | ||||||
Rehoboth, DE | 568,900 | 99 | % | 99 | % | 98 | % | 99 | % | 99 | % | ||||||
Foley, AL | 557,299 | 99 | % | 97 | % | 97 | % | 92 | % | 91 | % | ||||||
San Marcos, TX | 441,929 | 100 | % | 100 | % | 97 | % | 97 | % | 100 | % | ||||||
Myrtle Beach Hwy 501, SC | 426,417 | 94 | % | 93 | % | 92 | % | 88 | % | 90 | % | ||||||
Sevierville, TN | 419,038 | 100 | % | 99 | % | 99 | % | 99 | % | 100 | % | ||||||
Myrtle Beach Hwy 17, SC | 403,161 | 100 | % | 99 | % | 100 | % | 99 | % | 100 | % | ||||||
Washington, PA | 372,972 | 99 | % | 99 | % | 95 | % | 94 | % | 88 | % | ||||||
Commerce II, GA | 370,512 | 100 | % | 100 | % | 97 | % | 96 | % | 97 | % | ||||||
Charleston, SC | 352,315 | 100 | % | 99 | % | 97 | % | 92 | % | 98 | % | ||||||
Howell, MI | 324,631 | 98 | % | 99 | % | 95 | % | 94 | % | 95 | % | ||||||
Mebane, NC | 318,910 | 100 | % | N/A | N/A | N/A | N/A | ||||||||||
Branson, MO | 302,922 | 100 | % | 100 | % | 100 | % | 97 | % | 100 | % | ||||||
Park City, UT | 298,379 | 100 | % | 98 | % | 99 | % | 100 | % | 100 | % | ||||||
Locust Grove, GA | 293,868 | 99 | % | 100 | % | 99 | % | 97 | % | 100 | % | ||||||
Westbrook, CT | 291,051 | 99 | % | 99 | % | 95 | % | 97 | % | 95 | % | ||||||
Gonzales, LA | 282,403 | 100 | % | 100 | % | 99 | % | 98 | % | 100 | % | ||||||
Williamsburg, IA | 277,230 | 93 | % | 92 | % | 89 | % | 91 | % | 95 | % | ||||||
Lincoln City, OR | 270,212 | 100 | % | 99 | % | 99 | % | 98 | % | 99 | % | ||||||
Lancaster, PA | 255,152 | 95 | % | 100 | % | 98 | % | 97 | % | 100 | % | ||||||
Tuscola, IL | 250,439 | 85 | % | 85 | % | 83 | % | 82 | % | 82 | % | ||||||
Tilton, NH | 245,698 | 100 | % | 100 | % | 100 | % | 100 | % | 100 | % | ||||||
Hilton Head, SC (3) | 206,586 | 98 | % | 98 | % | 100 | % | 100 | % | 89 | % | ||||||
Fort Myers, FL | 198,950 | 93 | % | 88 | % | 88 | % | 90 | % | 92 | % | ||||||
Terrell, TX | 177,800 | 96 | % | 96 | % | 94 | % | 93 | % | 98 | % | ||||||
Barstow, CA | 171,300 | 100 | % | 100 | % | 100 | % | 100 | % | 100 | % | ||||||
West Branch, MI | 112,120 | 98 | % | 98 | % | 98 | % | 98 | % | 96 | % | ||||||
Blowing Rock, NC | 104,235 | 100 | % | 100 | % | 100 | % | 100 | % | 100 | % | ||||||
Nags Head, NC | 82,178 | 97 | % | 100 | % | 100 | % | 94 | % | 97 | % | ||||||
Kittery I, ME | 59,694 | 100 | % | 100 | % | 100 | % | 100 | % | 100 | % | ||||||
Kittery II, ME | 24,619 | 1 | 1 | 1 | 1 | 1 | |||||||||||
Commerce I, GA (4) | N/A | N/A | N/A | 46 | % | 44 | % | 61 | % | ||||||||
Total | 9,190,395 | 98 | % | 98 | % | 97% (1) | 95 | % | 96% (2) | ||||||||
Unconsolidated joint ventures | |||||||||||||||||
Deer Park, NY (5) | 683,033 | 86 | % | 86 | % | 84 | % | 81 | % | 81 | % | ||||||
Wisconsin Dells, WI | 265,061 | 99 | % | 99 | % | 99 | % | 97 | % | 97 | % | ||||||
5
Supplemental Operating and Financial Data for the
Year Ended 12/31/10
(1) | Excludes the occupancy rate at our Commerce I, Georgia center which was held for sale as of June 30, 2010 and subsequently sold on July 7, 2010. |
(2) | Excludes the occupancy rate at our Washington, Pennsylvania center which opened during the third quarter of 2008 and had not yet stabilized. |
(3) | Occupancy rates in 2009 are based on a total of 368,626 square feet and include both the Hilton Head I and Hilton Head II properties. The Hilton Head I property was demolished in 2010 and is currently under redevelopment, and accordingly, 162,040 square feet is excluded from the 2010 amounts. |
(4) | Center sold in July 2010. |
(5) | Includes a 29,253 square foot warehouse adjacent to the shopping center. |
6
Supplemental Operating and Financial Data for the
Year Ended 12/31/10
Portfolio Occupancy at the End of Each Period (1)
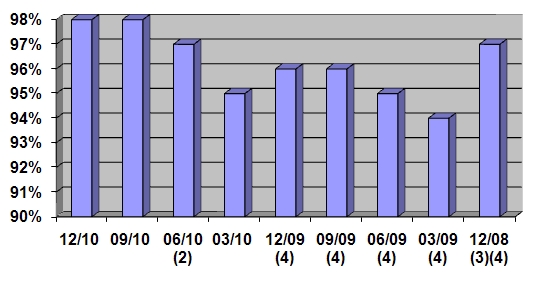
(1) | Excludes one 265,061 square foot center in Wisconsin Dells, WI, of which Tanger owns a 50% interest through a joint venture arrangement. Also, excludes one 653,780 square foot shopping center and one 29,253 square foot warehouse in Deer Park, NY of which Tanger owns a 33.3% interest through a joint venture arrangement. |
(2) | Excludes the occupancy rate at our Commerce I, Georgia center which was held for sale as of June 30, 2010. |
(3) | Excludes the occupancy rate at our Myrtle Beach Hwy 17, South Carolina center which was owned by an unconsolidated joint venture during those periods. On January 5, 2009, we acquired the remaining 50% interest in the joint venture and the property became wholly-owned. |
(4) | Excludes the occupancy rate at our Washington, Pennsylvania center which opened during the third quarter of 2008 and had not yet stabilized. |
7
Supplemental Operating and Financial Data for the
Year Ended 12/31/10
Major Tenants (1)
Ten Largest Tenants As of December 31, 2010 | ||||||||
Tenant | # of Stores | GLA | % of Total GLA | |||||
The Gap, Inc. | 73 | 770,916 | 8.4 | % | ||||
Phillips-Van Heusen | 115 | 592,299 | 6.4 | % | ||||
Dress Barn, Inc. | 56 | 336,620 | 3.7 | % | ||||
Nike | 30 | 331,017 | 3.6 | % | ||||
VF Outlet, Inc. | 29 | 293,657 | 3.2 | % | ||||
Adidas | 34 | 289,374 | 3.1 | % | ||||
Carter's | 52 | 246,730 | 2.7 | % | ||||
Liz Claiborne | 33 | 234,074 | 2.6 | % | ||||
Polo Ralph Lauren | 25 | 222,064 | 2.4 | % | ||||
Hanesbrands Direct, LLC | 39 | 214,713 | 2.3 | % | ||||
Total of All Listed Above | 486 | 3,531,464 | 38.4 | % | ||||
(1) | Excludes one 265,061 square foot center in Wisconsin Dells, WI, of which Tanger owns a 50% interest through a joint venture arrangement. Also, excludes one 653,780 square foot shopping center and one 29,253 square foot warehouse in Deer Park, NY of which Tanger owns a 33.3% interest through a joint venture arrangement. |
8
Supplemental Operating and Financial Data for the
Year Ended 12/31/10
Lease Expirations as of December 31, 2010
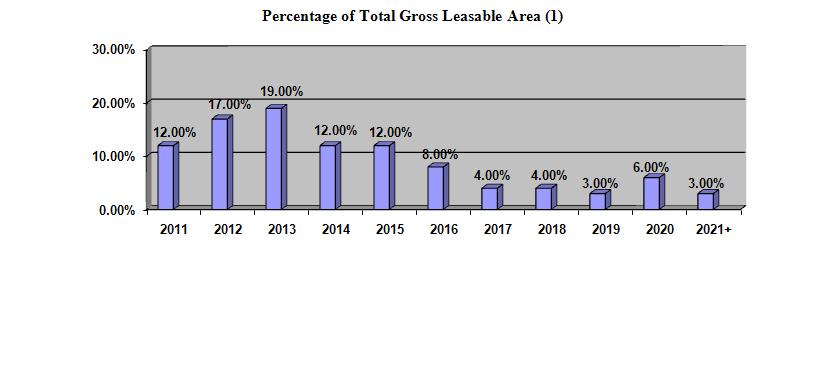
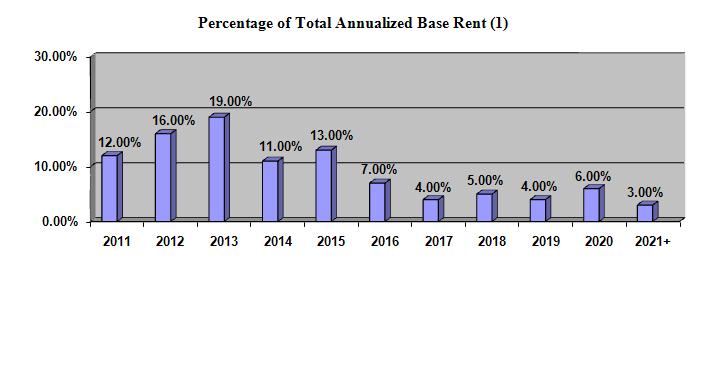
(1) | Excludes one 265,061 square foot center in Wisconsin Dells, WI, of which Tanger owns a 50% interest through a joint venture arrangement. Also, excludes one 653,780 square foot shopping center and one 29,253 square foot warehouse in Deer Park, NY of which Tanger owns a 33.3% interest through a joint venture arrangement. |
9
Supplemental Operating and Financial Data for the
Year Ended 12/31/10
Leasing Activity (1)
3/31/2010 | 6/30/2010 | 9/30/2010 | 12/31/2010 | Year to Date | Prior Year to Date | ||||||||||||||||||
Re-tenanted Space: | |||||||||||||||||||||||
Number of leases | 59 | 26 | 34 | 7 | 126 | 88 | |||||||||||||||||
Gross leasable area | 210,068 | 95,734 | 104,277 | 21,531 | 431,610 | 305,234 | |||||||||||||||||
New initial base rent per square foot | $ | 22.68 | $ | 22.31 | $ | 23.32 | $ | 19.82 | $ | 22.61 | $ | 23.31 | |||||||||||
Prior expiring base rent per square foot | $ | 19.70 | $ | 19.71 | $ | 19.40 | $ | 21.18 | $ | 19.70 | $ | 19.23 | |||||||||||
Percent increase | 15.1 | % | 13.2 | % | 20.2 | % | (6.4 | )% | 14.8 | % | 21.2 | % | |||||||||||
New straight line base rent per square foot | $ | 24.45 | $ | 23.45 | $ | 24.77 | $ | 21.97 | $ | 24.18 | $ | 24.66 | |||||||||||
Prior straight line base rent per square foot | $ | 19.33 | $ | 19.21 | $ | 18.62 | $ | 20.86 | $ | 19.21 | $ | 18.83 | |||||||||||
Percent increase | 26.5 | % | 22.0 | % | 33.0 | % | 5.4 | % | 25.9 | % | 30.9 | % | |||||||||||
Renewed Space: | |||||||||||||||||||||||
Number of leases | 150 | 58 | 30 | 52 | 290 | 271 | |||||||||||||||||
Gross leasable area | 646,422 | 252,301 | 115,518 | 202,783 | 1,217,024 | 1,218,219 | |||||||||||||||||
New initial base rent per square foot | $ | 19.80 | $ | 18.62 | $ | 19.79 | $ | 17.50 | $ | 19.17 | $ | 18.07 | |||||||||||
Prior expiring base rent per square foot | $ | 18.86 | $ | 17.80 | $ | 16.73 | $ | 17.45 | $ | 18.21 | $ | 16.96 | |||||||||||
Percent increase | 4.9 | % | 4.6 | % | 18.3 | % | 0.3 | % | 5.3 | % | 6.6 | % | |||||||||||
New straight line base rent per square foot | $ | 20.37 | $ | 18.97 | $ | 20.21 | $ | 17.87 | $ | 19.65 | $ | 18.43 | |||||||||||
Prior straight line base rent per square foot | $ | 18.72 | $ | 17.47 | $ | 16.57 | $ | 17.16 | $ | 18.00 | $ | 16.8 | |||||||||||
Percent increase | 8.8 | % | 8.6 | % | 22.0 | % | 4.1 | % | 9.2 | % | 9.7 | % | |||||||||||
Total Re-tenanted and Renewed Space: | |||||||||||||||||||||||
Number of leases | 209 | 84 | 64 | 59 | 416 | 359 | |||||||||||||||||
Gross leasable area | 856,490 | 348,035 | 219,795 | 224,314 | 1,648,634 | 1,523,453 | |||||||||||||||||
New initial base rent per square foot | $ | 20.5 | $ | 19.63 | $ | 21.46 | $ | 17.73 | $ | 20.07 | $ | 19.12 | |||||||||||
Prior expiring base rent per square foot | $ | 19.07 | $ | 18.33 | $ | 18.00 | $ | 17.81 | $ | 18.6 | $ | 17.41 | |||||||||||
Percent increase | 7.5 | % | 7.1 | % | 19.3 | % | (0.4 | )% | 7.9 | % | 9.8 | % | |||||||||||
New straight line base rent per square foot | $ | 21.37 | $ | 20.20 | $ | 22.38 | $ | 18.26 | $ | 20.84 | $ | 19.68 | |||||||||||
Prior straight line base rent per square foot | $ | 18.87 | $ | 17.95 | $ | 17.54 | $ | 17.51 | $ | 18.31 | $ | 17.21 | |||||||||||
Percent increase | 13.2 | % | 12.5 | % | 27.6 | % | 4.3 | % | 13.8 | % | 14.3 | % | |||||||||||
(1) | Excludes one 265,061 square foot center in Wisconsin Dells, WI, of which Tanger owns a 50% interest through a joint venture arrangement. Also, excludes one 653,780 square foot shopping center and one 29,253 square foot warehouse in Deer Park, NY of which Tanger owns a 33.3% interest through a joint venture arrangement. |
10
Supplemental Operating and Financial Data for the
Year Ended 12/31/10
Consolidated Balance Sheets (dollars in thousands)
12/31/2010 | 9/30/2010 | 6/30/2010 | 3/31/2010 | 12/31/2009 | |||||||||||||||
Assets | |||||||||||||||||||
Rental property | |||||||||||||||||||
Land | $ | 141,577 | $ | 141,576 | $ | 141,575 | $ | 142,822 | $ | 143,933 | |||||||||
Buildings | 1,411,404 | 1,353,171 | 1,343,155 | 1,360,010 | 1,352,568 | ||||||||||||||
Construction in progress | 23,233 | 58,952 | 39,883 | 19,557 | 11,369 | ||||||||||||||
Total rental property | 1,576,214 | 1,553,699 | 1,524,613 | 1,522,389 | 1,507,870 | ||||||||||||||
Accumulated depreciation | (453,145 | ) | (438,955 | ) | (425,168 | ) | (432,276 | ) | (412,530 | ) | |||||||||
Total rental property - net | 1,123,069 | 1,114,744 | 1,099,445 | 1,090,113 | 1,095,340 | ||||||||||||||
Cash & cash equivalents | 5,758 | 2,835 | 3,453 | 3,197 | 3,267 | ||||||||||||||
Rental property held for sale | 723 | 424 | 1,921 | — | — | ||||||||||||||
Investments in unconsolidated joint ventures | 6,386 | 7,064 | 7,570 | 8,151 | 9,054 | ||||||||||||||
Deferred charges - net | 36,910 | 33,365 | 35,124 | 35,555 | 38,867 | ||||||||||||||
Other assets | 44,088 | 39,127 | 31,627 | 31,889 | 32,333 | ||||||||||||||
Total assets | $ | 1,216,934 | $ | 1,197,559 | $ | 1,179,140 | $ | 1,168,905 | $ | 1,178,861 | |||||||||
Liabilities & equity | |||||||||||||||||||
Liabilities | |||||||||||||||||||
Debt | |||||||||||||||||||
Senior, unsecured notes, net of discount | $ | 554,616 | $ | 554,515 | $ | 554,415 | $ | 256,412 | $ | 256,352 | |||||||||
Unsecured term loan | — | — | — | 235,000 | 235,000 | ||||||||||||||
Mortgages payable, net of discount | — | — | — | — | 35,559 | ||||||||||||||
Unsecured lines of credit | 160,000 | 54,800 | 50,800 | 93,400 | 57,700 | ||||||||||||||
Total debt | 714,616 | 609,315 | 605,215 | 584,812 | 584,611 | ||||||||||||||
Construction trade payables | 31,831 | 31,051 | 30,829 | 22,381 | 14,194 | ||||||||||||||
Accounts payable & accruals | 31,594 | 40,060 | 22,747 | 28,544 | 31,916 | ||||||||||||||
Other liabilities | 16,998 | 17,084 | 17,286 | 25,657 | 27,077 | ||||||||||||||
Total liabilities | 795,039 | 697,510 | 676,077 | 661,394 | 657,798 | ||||||||||||||
Equity | |||||||||||||||||||
Tanger Factory Outlet Centers, Inc. equity | |||||||||||||||||||
Preferred shares | — | 75,000 | 75,000 | 75,000 | 75,000 | ||||||||||||||
Common shares | 810 | 810 | 810 | 810 | 806 | ||||||||||||||
Paid in capital | 604,359 | 600,408 | 598,865 | 597,563 | 595,671 | ||||||||||||||
Distributions in excess of net income | (240,024 | ) | (233,387 | ) | (229,298 | ) | (217,076 | ) | (202,997 | ) | |||||||||
Accum. other comprehensive income (loss) | 1,784 | 1,828 | 1,884 | (5,169 | ) | (5,809 | ) | ||||||||||||
Total Tanger Factory Outlet Centers, Inc. equity | 366,929 | 444,659 | 447,261 | 451,128 | 462,671 | ||||||||||||||
Noncontrolling interest | 54,966 | 55,390 | 55,802 | 56,383 | 58,392 | ||||||||||||||
Total equity | 421,895 | 500,049 | 503,063 | 507,511 | 521,063 | ||||||||||||||
Total liabilities and equity | $ | 1,216,934 | $ | 1,197,559 | $ | 1,179,140 | $ | 1,168,905 | $ | 1,178,861 | |||||||||
11
Supplemental Operating and Financial Data for the
Year Ended 12/31/10
Consolidated Statements of Operations (dollars and shares in thousands)
Three Months Ended | YTD | ||||||||||||||||||||||||||
12/31/10 | 9/30/10 | 6/30/10 | 3/31/10 | 12/31/09 | 12/31/10 | 12/31/09 | |||||||||||||||||||||
Revenues | |||||||||||||||||||||||||||
Base rentals | $ | 46,654 | $ | 44,857 | $ | 43,968 | $ | 43,497 | $ | 44,204 | $ | 178,976 | $ | 174,046 | |||||||||||||
Percentage rentals | 3,651 | 1,910 | 1,048 | 1,305 | 3,111 | 7,914 | 6,801 | ||||||||||||||||||||
Expense reimbursements | 22,540 | 20,139 | 18,429 | 19,519 | 21,989 | 80,627 | 78,500 | ||||||||||||||||||||
Other income | 2,648 | 2,567 | 1,850 | 1,721 | 1,992 | 8,786 | 11,248 | ||||||||||||||||||||
Total revenues | 75,493 | 69,473 | 65,295 | 66,042 | 71,296 | 276,303 | 270,595 | ||||||||||||||||||||
Expenses | |||||||||||||||||||||||||||
Property operating | 26,306 | 22,567 | 22,123 | 22,349 | 24,647 | 93,345 | 88,135 | ||||||||||||||||||||
General & administrative | 6,721 | 6,403 | 5,963 | 5,466 | 5,066 | 24,553 | 22,285 | ||||||||||||||||||||
Executive severance | — | — | — | — | — | — | 10,296 | ||||||||||||||||||||
Depreciation & amortization | 17,651 | 16,805 | 17,109 | 26,474 | 20,187 | 78,039 | 79,939 | ||||||||||||||||||||
Impairment charge | — | — | — | 735 | — | 735 | — | ||||||||||||||||||||
Total expenses | 50,678 | 45,775 | 45,195 | 55,024 | 49,900 | 196,672 | 200,655 | ||||||||||||||||||||
Operating income | 24,815 | 23,698 | 20,100 | 11,018 | 21,396 | 79,631 | 69,940 | ||||||||||||||||||||
Interest expense | (9,454 | ) | (8,767 | ) | (7,951 | ) | (7,948 | ) | (8,217 | ) | (34,120 | ) | (37,683 | ) | |||||||||||||
Gain (loss) on early extinguishment of debt | — | — | (563 | ) | — | — | (563 | ) | 10,467 | ||||||||||||||||||
Loss on termination of derivatives | — | — | (6,142 | ) | — | — | (6,142 | ) | — | ||||||||||||||||||
Gain on fair value measurement of previously held interest in acquired joint venture | — | — | — | — | — | — | 31,497 | ||||||||||||||||||||
Income before equity in earnings (losses) of unconsolidated joint ventures | 15,361 | 14,931 | 5,444 | 3,070 | 13,179 | 38,806 | 74,221 | ||||||||||||||||||||
Equity in earnings (losses) of unconsolidated joint ventures | (270 | ) | (75 | ) | (51 | ) | (68 | ) | (166 | ) | (464 | ) | (1,512 | ) | |||||||||||||
Income from continuing operations | 15,091 | 14,856 | 5,393 | 3,002 | 13,013 | 38,342 | 72,709 | ||||||||||||||||||||
Discontinued operations | 5 | (103 | ) | (1 | ) | 1 | 63 | (98 | ) | (5,214 | ) | ||||||||||||||||
Net income | 15,096 | 14,753 | 5,392 | 3,003 | 13,076 | 38,244 | 67,495 | ||||||||||||||||||||
Noncontrolling interest | (1,507 | ) | (1,754 | ) | (524 | ) | (210 | ) | (1,538 | ) | (3,995 | ) | (9,476 | ) | |||||||||||||
Net income attributable to the Company | 13,589 | 12,999 | 4,868 | 2,793 | 11,538 | 34,249 | 58,019 | ||||||||||||||||||||
Less applicable preferred share dividends | (1,078 | ) | (1,406 | ) | (1,407 | ) | (1,406 | ) | (1,406 | ) | (5,297 | ) | (5,625 | ) | |||||||||||||
Less original issuance costs related to redeemed preferred shares | (2,539 | ) | — | — | — | — | (2,539 | ) | — | ||||||||||||||||||
Allocation to participating securities | (144 | ) | (142 | ) | (143 | ) | (169 | ) | (121 | ) | (598 | ) | (701 | ) | |||||||||||||
Net income available to common shareholders | $ | 9,828 | $ | 11,451 | $ | 3,318 | $ | 1,218 | $ | 10,011 | $ | 25,815 | $ | 51,693 | |||||||||||||
12
Supplemental Operating and Financial Data for the
Year Ended 12/31/10
Three Months Ended | YTD | ||||||||||||||||||||||||||
12/31/10 | 9/30/10 | 6/30/10 | 3/31/10 | 12/31/09 | 12/31/10 | 12/31/09 | |||||||||||||||||||||
Basic earnings per common share: | |||||||||||||||||||||||||||
Income from continuing operations | $ | 0.12 | $ | 0.14 | $ | 0.04 | $ | 0.02 | $ | 0.12 | $ | 0.32 | $ | 0.78 | |||||||||||||
Discontinued operations | — | — | — | — | — | — | (0.06 | ) | |||||||||||||||||||
Net income | $ | 0.12 | $ | 0.14 | $ | 0.04 | $ | 0.02 | $ | 0.12 | $ | 0.32 | $ | 0.72 | |||||||||||||
Diluted earnings per common share: | |||||||||||||||||||||||||||
Income from continuing operations | $ | 0.12 | $ | 0.14 | $ | 0.04 | $ | 0.02 | $ | 0.12 | $ | 0.32 | $ | 0.78 | |||||||||||||
Discontinued operations | — | — | — | — | — | — | (0.06 | ) | |||||||||||||||||||
Net income | $ | 0.12 | $ | 0.14 | $ | 0.04 | $ | 0.02 | $ | 0.12 | $ | 0.32 | $ | 0.72 | |||||||||||||
Weighted average common shares: | |||||||||||||||||||||||||||
Basic | 80,256 | 80,225 | 80,206 | 80,060 | 79,916 | 80,187 | 71,832 | ||||||||||||||||||||
Diluted | 80,445 | 80,402 | 80,343 | 80,236 | 80,086 | 80,389 | 72,024 | ||||||||||||||||||||
13
Supplemental Operating and Financial Data for the
Year Ended 12/31/10
FFO and FAD Analysis (dollars and shares in thousands)
Three Months Ended | YTD | ||||||||||||||||||||||||||
12/31/10 | 9/30/10 | 6/30/10 | 3/31/10 | 12/31/09 | 12/31/10 | 12/31/09 | |||||||||||||||||||||
Funds from operations: | |||||||||||||||||||||||||||
Net income | $ | 15,096 | $ | 14,753 | $ | 5,392 | $ | 3,003 | $ | 13,076 | $ | 38,244 | $ | 67,495 | |||||||||||||
Adjusted for - | |||||||||||||||||||||||||||
Depreciation and amortization uniquely significant to real estate - wholly-owned discontinued operations | — | — | 34 | 53 | 52 | 87 | 562 | ||||||||||||||||||||
Depreciation and amortization uniquely significant to real estate - wholly-owned | 17,508 | 16,675 | 16,984 | 26,359 | 20,060 | 77,526 | 79,446 | ||||||||||||||||||||
Depreciation and amortization uniquely significant to real estate - joint ventures | 1,312 | 1,289 | 1,280 | 1,265 | 1,231 | 5,146 | 4,859 | ||||||||||||||||||||
(Gain) on fair value measurement of previously held interest in acquired joint venture | — | — | — | — | — | — | (31,497 | ) | |||||||||||||||||||
Funds from operations | 33,916 | 32,717 | 23,690 | 30,680 | 34,419 | 121,003 | 120,865 | ||||||||||||||||||||
Preferred share dividends | (1,078 | ) | (1,406 | ) | (1,407 | ) | (1,406 | ) | (1,406 | ) | (5,297 | ) | (5,625 | ) | |||||||||||||
Original issuance costs related to redeemed preferred shares | (2,539 | ) | — | — | — | — | (2,539 | ) | — | ||||||||||||||||||
Allocation to participating securities | (242 | ) | (247 | ) | (177 | ) | (268 | ) | (225 | ) | (932 | ) | (1,282 | ) | |||||||||||||
Funds from operations available to common shareholders | $ | 30,057 | $ | 31,064 | $ | 22,106 | $ | 29,006 | $ | 32,788 | $ | 112,235 | $ | 113,958 | |||||||||||||
Funds from operations per share | $ | 0.32 | $ | 0.34 | $ | 0.24 | $ | 0.31 | $ | 0.36 | $ | 1.21 | $ | 1.35 | |||||||||||||
Funds available for distribution to common shareholders: | |||||||||||||||||||||||||||
Funds from operations | $ | 30,057 | $ | 31,064 | $ | 22,106 | $ | 29,006 | $ | 32,788 | $ | 112,235 | $ | 113,958 | |||||||||||||
Adjusted for - | |||||||||||||||||||||||||||
Original issuance costs related to redeemed preferred shares | 2,539 | — | — | — | — | 2,539 | — | ||||||||||||||||||||
Corporate depreciation excluded above | 143 | 130 | 125 | 115 | 127 | 513 | 493 | ||||||||||||||||||||
Amortization of finance costs | 370 | 259 | 315 | 342 | 341 | 1,286 | 1,511 | ||||||||||||||||||||
Amortization of net debt (discount) premium | (372 | ) | (21 | ) | 4 | 214 | (79 | ) | (175 | ) | 894 | ||||||||||||||||
Gain (loss) on early extinguishment of debt | — | — | 563 | — | — | 563 | (10,467 | ) | |||||||||||||||||||
Loss on termination of derivatives | — | — | 6,142 | — | — | 6,142 | — | ||||||||||||||||||||
Impairment charge | — | — | 111 | 735 | — | 846 | 5,200 | ||||||||||||||||||||
Amortization of share-based compensation | 1,515 | 1,437 | 1,363 | 1,140 | 829 | 5,455 | 11,798 | ||||||||||||||||||||
Straight line rent adjustment | (506 | ) | (767 | ) | (669 | ) | (734 | ) | (287 | ) | (2,676 | ) | (2,242 | ) | |||||||||||||
Market rent adjustment | (374 | ) | (195 | ) | (216 | ) | (165 | ) | (226 | ) | (950 | ) | (492 | ) | |||||||||||||
2nd generation tenant allowances | (5,145 | ) | (4,797 | ) | (1,328 | ) | (1,721 | ) | (1,652 | ) | (12,991 | ) | (7,664 | ) | |||||||||||||
Capital improvements | (2,480 | ) | (2,531 | ) | (1,309 | ) | (1,600 | ) | (1,011 | ) | (7,920 | ) | (8,887 | ) | |||||||||||||
Funds available for distribution | $ | 25,747 | $ | 24,579 | $ | 27,207 | $ | 27,332 | $ | 30,830 | $ | 104,867 | $ | 104,102 | |||||||||||||
Funds available for distribution per share | $ | 0.28 | $ | 0.27 | $ | 0.29 | $ | 0.3 | $ | 0.33 | $ | 1.13 | $ | 1.24 | |||||||||||||
Dividends paid per share | $ | 0.1938 | $ | 0.1938 | $ | 0.1938 | $ | 0.1913 | $ | 0.1913 | $ | 0.7725 | $ | 0.7638 | |||||||||||||
FFO payout ratio | 61 | % | 58 | % | 81 | % | 61 | % | 54 | % | 64 | % | 57 | % | |||||||||||||
FAD payout ratio | 69 | % | 72 | % | 67 | % | 64 | % | 58 | % | 68 | % | 62 | % | |||||||||||||
Diluted weighted average common shs. | 92,578 | 92,535 | 92,476 | 92,369 | 92,219 | 92,523 | 84,157 | ||||||||||||||||||||
14
Supplemental Operating and Financial Data for the
Year Ended 12/31/10
Unconsolidated Joint Venture Information - All
Summary Balance Sheets (dollars in thousands)
12/31/2010 | 9/30/2010 | 6/30/2010 | 3/31/2010 | 12/31/2009 | Tanger's Share as of 12/31/10 | ||||||||||||||||||
Assets | |||||||||||||||||||||||
Investment properties at cost - net | $ | 283,902 | $ | 287,365 | $ | 289,587 | $ | 292,105 | $ | 294,857 | $ | 99,629 | |||||||||||
Cash and cash equivalents | 13,838 | 10,966 | 9,020 | 6,937 | 8,070 | 5,322 | |||||||||||||||||
Deferred charges - net | 3,990 | 4,388 | 4,799 | 5,197 | 5,450 | 1,391 | |||||||||||||||||
Other assets | 6,291 | 6,511 | 6,697 | 5,878 | 5,610 | 2,218 | |||||||||||||||||
Total assets | $ | 308,021 | $ | 309,230 | $ | 310,103 | $ | 310,117 | $ | 313,987 | $ | 108,560 | |||||||||||
Liabilities & Owners' Equity | |||||||||||||||||||||||
Mortgage payable | $ | 294,034 | $ | 294,034 | $ | 294,034 | $ | 292,468 | $ | 292,468 | $ | 102,136 | |||||||||||
Construction trade payables | 341 | 1,213 | 878 | 1,845 | 3,647 | 131 | |||||||||||||||||
Accounts payable & other liabilities | 4,810 | 3,729 | 3,991 | 3,568 | 3,826 | 1,777 | |||||||||||||||||
Total liabilities | 299,185 | 298,976 | 298,903 | 297,881 | 299,941 | 104,044 | |||||||||||||||||
Owners' equity | 8,836 | 10,254 | 11,200 | 12,236 | 14,046 | 4,516 | |||||||||||||||||
Total liabilities & owners' equity | $ | 308,021 | $ | 309,230 | $ | 310,103 | $ | 310,117 | $ | 313,987 | $ | 108,560 | |||||||||||
Summary Statements of Operations (dollars in thousands)
Three Months Ended | YTD | ||||||||||||||||||||||||||
12/31/10 | 9/30/10 | 6/30/10 | 3/31/10 | 12/31/09 | 12/31/10 | 12/31/09 | |||||||||||||||||||||
Revenues | $ | 9,691 | $ | 9,632 | $ | 9,261 | $ | 9,274 | $ | 9,374 | $ | 37,858 | $ | 35,481 | |||||||||||||
Expenses | |||||||||||||||||||||||||||
Property operating | 5,187 | 4,575 | 4,200 | 4,210 | 4,682 | 18,172 | 16,643 | ||||||||||||||||||||
General & administrative | (11 | ) | 107 | 72 | 287 | 444 | 455 | 861 | |||||||||||||||||||
Depreciation & amortization | 3,635 | 3,567 | 3,546 | 3,497 | 3,460 | 14,245 | 13,419 | ||||||||||||||||||||
Total expenses | 8,811 | 8,249 | 7,818 | 7,994 | 8,586 | 32,872 | 30,923 | ||||||||||||||||||||
Operating income | 880 | 1,383 | 1,443 | 1,280 | 788 | 4,986 | 4,558 | ||||||||||||||||||||
Interest expense | 1,785 | 1,771 | 1,717 | 1,674 | 1,550 | 6,947 | 9,913 | ||||||||||||||||||||
Net loss | $ | (905 | ) | $ | (388 | ) | $ | (274 | ) | $ | (394 | ) | $ | (762 | ) | $ | (1,961 | ) | $ | (5,355 | ) | ||||||
Tanger's share of: | |||||||||||||||||||||||||||
Total revenues less property operating and general & administrative expenses ("NOI") | $ | 1,676 | $ | 1,842 | $ | 1,842 | $ | 1,791 | $ | 1,603 | $ | 7,151 | $ | 6,733 | |||||||||||||
Net income (loss) | $ | (270 | ) | $ | (75 | ) | $ | (51 | ) | $ | (68 | ) | $ | (166 | ) | $ | (464 | ) | $ | (1,512 | ) | ||||||
Depreciation (real estate related) | $ | 1,312 | $ | 1,289 | $ | 1,280 | $ | 1,265 | $ | 1,231 | $ | 5,146 | $ | 4,859 | |||||||||||||
15
Supplemental Operating and Financial Data for the
Year Ended 12/31/10
Unconsolidated Joint Venture Information - Wisconsin Dells
Summary Balance Sheets (dollars in thousands)
12/31/2010 | 9/30/2010 | 6/30/2010 | 3/31/2010 | 12/31/2009 | Tanger's Share as of 12/31/10 | ||||||||||||||||||
Assets | |||||||||||||||||||||||
Investment properties at cost - net | $ | 29,968 | $ | 30,430 | $ | 31,004 | $ | 31,541 | $ | 32,108 | $ | 14,984 | |||||||||||
Cash and cash equivalents | 4,253 | 3,901 | 3,702 | 4,050 | 4,549 | 2,127 | |||||||||||||||||
Deferred charges - net | 363 | 411 | 477 | 515 | 529 | 182 | |||||||||||||||||
Other assets | 723 | 594 | 602 | 626 | 514 | 362 | |||||||||||||||||
Total assets | $ | 35,307 | $ | 35,336 | $ | 35,785 | $ | 36,732 | $ | 37,700 | $ | 17,655 | |||||||||||
Liabilities & Owners' Equity | |||||||||||||||||||||||
Mortgage payable | $ | 24,750 | $ | 24,750 | $ | 24,750 | $ | 25,250 | $ | 25,250 | $ | 12,375 | |||||||||||
Construction trade payables | 106 | — | 46 | 58 | 116 | 53 | |||||||||||||||||
Accounts payable & other liabilities | 1,030 | 734 | 844 | 906 | 876 | 516 | |||||||||||||||||
Total liabilities | 25,886 | 25,484 | 25,640 | 26,214 | 26,242 | 12,944 | |||||||||||||||||
Owners' equity | 9,421 | 9,852 | 10,145 | 10,518 | 11,458 | 4,711 | |||||||||||||||||
Total liabilities & owners' equity | $ | 35,307 | $ | 35,336 | $ | 35,785 | $ | 36,732 | $ | 37,700 | $ | 17,655 | |||||||||||
Summary Statements of Operations (dollars in thousands)
Three Months Ended | YTD | ||||||||||||||||||||||||||
12/31/10 | 9/30/10 | 6/30/10 | 3/31/10 | 12/31/09 | 12/31/10 | 12/31/09 | |||||||||||||||||||||
Revenues | $ | 1,793 | $ | 1,822 | $ | 1,715 | $ | 1,923 | $ | 1,757 | $ | 7,253 | $ | 7,093 | |||||||||||||
Expenses | |||||||||||||||||||||||||||
Property operating | 770 | 665 | 643 | 716 | 629 | 2,794 | 2,565 | ||||||||||||||||||||
General & administrative | 5 | 2 | 3 | 9 | 1 | 19 | 21 | ||||||||||||||||||||
Depreciation & amortization | 619 | 618 | 615 | 613 | 612 | 2,465 | 2,453 | ||||||||||||||||||||
Total expenses | 1,394 | 1,285 | 1,261 | 1,338 | 1,242 | 5,278 | 5,039 | ||||||||||||||||||||
Operating income | 399 | 537 | 454 | 585 | 515 | 1,975 | 2,054 | ||||||||||||||||||||
Interest expense | 229 | 230 | 227 | 225 | 128 | 911 | 492 | ||||||||||||||||||||
Net income | $ | 170 | $ | 307 | $ | 227 | $ | 360 | $ | 387 | $ | 1,064 | $ | 1,562 | |||||||||||||
Tanger's share of: | |||||||||||||||||||||||||||
Total revenues less property operating and general & administrative expenses ("NOI") | $ | 509 | $ | 578 | $ | 534 | $ | 599 | $ | 563 | $ | 2,220 | $ | 2,253 | |||||||||||||
Net income | $ | 92 | $ | 163 | $ | 124 | $ | 188 | $ | 203 | $ | 567 | $ | 819 | |||||||||||||
Depreciation (real estate related) | $ | 302 | $ | 300 | $ | 297 | $ | 298 | $ | 296 | $ | 1,197 | $ | 1,188 | |||||||||||||
16
Supplemental Operating and Financial Data for the
Year Ended 12/31/10
Unconsolidated Joint Venture Information - Deer Park
Summary Balance Sheets (dollars in thousands)
12/31/2010 | 9/30/2010 | 6/30/2010 | 3/31/2010 | 12/31/2009 | Tanger's Share as of 12/31/10 | ||||||||||||||||||
Assets | |||||||||||||||||||||||
Investment properties at cost - net | $ | 253,934 | $ | 256,935 | $ | 258,583 | $ | 260,413 | $ | 262,601 | $ | 84,645 | |||||||||||
Cash and cash equivalents | 9,585 | 7,065 | 5,318 | 2,865 | 3,498 | 3,195 | |||||||||||||||||
Deferred charges - net | 3,627 | 3,977 | 4,322 | 4,682 | 4,921 | 1,209 | |||||||||||||||||
Other assets | 5,568 | 5,917 | 6,095 | 5,252 | 5,096 | 1,856 | |||||||||||||||||
Total assets | $ | 272,714 | $ | 273,894 | $ | 274,318 | $ | 273,212 | $ | 276,116 | $ | 90,905 | |||||||||||
Liabilities & Owners' Equity | |||||||||||||||||||||||
Mortgage payable | $ | 269,284 | $ | 269,284 | $ | 269,284 | $ | 267,218 | $ | 267,218 | $ | 89,761 | |||||||||||
Construction trade payables | 235 | 1,213 | 832 | 1,785 | 3,531 | 78 | |||||||||||||||||
Accounts payable & other liabilities | 3,780 | 2,995 | 3,147 | 2,662 | 2,950 | 1,261 | |||||||||||||||||
Total liabilities | 273,299 | 273,492 | 273,263 | 271,665 | 273,699 | 91,100 | |||||||||||||||||
Owners' equity | (585 | ) | 402 | 1,055 | 1,547 | 2,417 | (195 | ) | |||||||||||||||
Total liabilities & owners' equity | $ | 272,714 | $ | 273,894 | $ | 274,318 | $ | 273,212 | $ | 276,116 | $ | 90,905 | |||||||||||
Summary Statements of Operations (dollars in thousands)
Three Months Ended | YTD | ||||||||||||||||||||||||||
12/31/10 | 9/30/10 | 6/30/10 | 3/31/10 | 12/31/09 | 12/31/10 | 12/31/09 | |||||||||||||||||||||
Revenues | $ | 7,898 | $ | 7,810 | $ | 7,546 | $ | 7,351 | $ | 7,617 | $ | 30,605 | $ | 28,388 | |||||||||||||
Expenses | |||||||||||||||||||||||||||
Property operating | 4,417 | 3,910 | 3,557 | 3,494 | 4,053 | 15,378 | 14,078 | ||||||||||||||||||||
General & administrative | (16 | ) | 105 | 69 | 278 | 443 | 436 | 840 | |||||||||||||||||||
Depreciation & amortization | 3,016 | 2,949 | 2,931 | 2,884 | 2,868 | 11,780 | 10,941 | ||||||||||||||||||||
Total expenses | 7,417 | 6,964 | 6,557 | 6,656 | 7,364 | 27,594 | 25,859 | ||||||||||||||||||||
Operating income | 481 | 846 | 989 | 695 | 253 | 3,011 | 2,529 | ||||||||||||||||||||
Interest expense | 1,556 | 1,541 | 1,490 | 1,449 | 1,422 | 6,036 | 9,421 | ||||||||||||||||||||
Net loss | $ | (1,075 | ) | $ | (695 | ) | $ | (501 | ) | $ | (754 | ) | $ | (1,169 | ) | $ | (3,025 | ) | $ | (6,892 | ) | ||||||
Tanger's share of: | |||||||||||||||||||||||||||
Total revenues less property operating and general & administrative expenses ("NOI") | $ | 1,167 | $ | 1,264 | $ | 1,308 | $ | 1,192 | $ | 1,040 | $ | 4,931 | $ | 4,490 | |||||||||||||
Net loss | $ | (364 | ) | $ | (238 | ) | $ | (172 | ) | $ | (258 | ) | $ | (370 | ) | $ | (1,032 | ) | $ | (2,322 | ) | ||||||
Depreciation (real estate related) | $ | 1,012 | $ | 989 | $ | 983 | $ | 967 | $ | 936 | $ | 3,951 | $ | 3,672 | |||||||||||||
17
Supplemental Operating and Financial Data for the
Year Ended 12/31/10
Debt Outstanding Summary (dollars in thousands)
As of December 31, 2010 | ||||||||
Principal Balance | Interest Rate | Maturity Date | ||||||
Unsecured debt: | ||||||||
Unsecured lines of credit (1) | $ | 160,000 | Libor + 1.90% | 11/29/2013 | ||||
2015 Senior unsecured notes | 250,000 | 6.15 | % | 11/15/2015 | ||||
2026 Senior unsecured exchangeable notes (2) | 7,210 | 3.75 | % | 8/18/2011 | ||||
2020 Senior unsecured notes | 300,000 | 6.125 | % | 6/1/2020 | ||||
Net debt discounts | (2,594 | ) | ||||||
Total consolidated debt | $ | 714,616 | ||||||
Tanger's share of unconsolidated JV debt: | ||||||||
Wisconsin Dells (3) | 12,375 | Libor + 3.00% | 12/18/2012 | |||||
Deer Park (4) | 89,761 | Libor + 1.375 - 3.50% | 5/17/2011 | |||||
Total Tanger's share of unconsolidated JV debt | $ | 102,136 | ||||||
(1) | The Company has an unsecured, syndicated credit line with a borrowing capacity totaling $385.0 million and a separate cash management line of credit with a borrowing capacity of $15.0 million with one of the participants in the syndication. Both lines expire on November 29, 2013. Facility fees of 40 basis points annually are charged in arrears based on the amount of the commitment. |
(2) | On January 1, 2009, we retrospectively adopted new guidance related to the accounting for convertible debt instruments that may be settled in cash upon conversion (including partial cash settlement). This new guidance required us to bifurcate the notes into debt and equity components based on the fair value of the notes independent of the conversion feature as of the date of issuance in August 2006. As a result of this adoption, the bonds were recorded with a debt discount based on a market interest rate of 6.11%. At December 31, 2010, the unamortized discount on the remaining $7.2 million in exchangeable notes totaled $103,000. Our exchangeable notes issued during 2006 mature in 2026. They are displayed in the above table with a 2011 maturity date as this is the first date that the noteholders can require us to repurchase the notes without the occurrence of specified events. |
(3) | In December 2009, we closed on the refinancing of the Tanger Wisconsin Dells mortgage loan. The new loan has a term of three years with an interest rate of LIBOR plus 300 basis points. |
(4) | In May 2007, the joint venture entered into a four-year, interest-only construction loan facility with a one-year maturity extension option. The facility includes a senior loan, with an interest rate of LIBOR plus 137.5 basis points, and a mezzanine loan, with an interest rate of LIBOR plus 350 basis points. As of December 31, 2010, the outstanding principal balances of the senior and mezzanine loans were $252.0 million and $15.0 million, respectively, and $17.0 million was available for funding of additional construction draw requests under the senior loan facility. In February 2009, the joint venture entered into an interest rate cap agreement on a nominal amount of $240.0 million which became effective June 1, 2009. The derivative contract puts a cap of 4% on the LIBOR index and expires on April 1, 2011. In June 2008, the joint venture entered into an interest-only mortgage loan agreement for a warehouse adjacent to the property with an interest rate of LIBOR plus 185 basis points and a maturity of May 17, 2011. As of December 31, 2010, the outstanding principal balance under the warehouse mortgage was $2.3 million. |
18
Supplemental Operating and Financial Data for the
Year Ended 12/31/10
Future Scheduled Principal Payments (dollars in thousands)
As of December 31, 2010 | |||||||||||
Year | Tanger Consolidated Payments | Tanger's Share of Unconsolidated JV Payments | Total Scheduled Payments | ||||||||
2011 (1) | $ | 7,210 | $ | 89,761 | $ | 96,971 | |||||
2012 | — | 12,375 | 12,375 | ||||||||
2013 | 160,000 | — | 160,000 | ||||||||
2014 | — | — | — | ||||||||
2015 | 250,000 | — | 250,000 | ||||||||
2016 | — | — | — | ||||||||
2017 | — | — | — | ||||||||
2018 | — | — | — | ||||||||
2019 | — | — | — | ||||||||
2020 & thereafter | 300,000 | — | 300,000 | ||||||||
$ | 717,210 | $ | 102,136 | $ | 819,346 | ||||||
Net Discount on Debt | (2,594 | ) | — | (2,594 | ) | ||||||
$ | 714,616 | $ | 102,136 | $ | 816,752 | ||||||
Senior Unsecured Notes Financial Covenants (2)
As of December 31, 2010 | ||||||
Required | Actual | Compliance | ||||
Total Consolidated Debt to Adjusted Total Assets | <60% | 42 | % | Yes | ||
Total Secured Debt to Adjusted Total Assets | <40% | — | % | Yes | ||
Total Unencumbered Assets to Unsecured Debt | >135% | 238 | % | Yes | ||
Consolidated Income Available for Debt Service to Annual Debt Service Charge | >1.5 | 4.9 | Yes | |||
(1) | Included in this amount is $7.2 million which represents our exchangeable, senior unsecured notes issued in August 2006. On and after August 18, 2011, holders may exchange their notes for cash in an amount equal to the lesser of the exchange value and the aggregate principal amount of the notes to be exchanged, and, at our option, Company common shares, cash or a combination thereof for any excess. Note holders may exchange their notes prior to August 18, 2011 only upon the occurrence of specified events. In addition, on August 18, 2011, August 15, 2016 or August 15, 2021, note holders may require us to repurchase the notes for an amount equal to the principal amount of the notes plus any accrued and unpaid interest thereon. The notes are shown with a 2011 maturity as this is the first date that the noteholders can require us to repurchase the notes without the occurrence of specified events. |
(2) | For a complete listing of all Debt Covenants related to the Company's Senior Unsecured Notes, as well as definitions of the above terms, please refer to the Company's filings with the Securities and Exchange Commission. |
19
Supplemental Operating and Financial Data for the
Year Ended 12/31/10
Investor Information
Tanger Outlet Centers welcomes any questions or comments from shareholders, analysts, investment managers, media and prospective investors. Please address all inquiries to our Investor Relations Department.
Tanger Factory Outlet Centers, Inc. | |
Investor Relations | |
Phone: | (336) 856-6021 |
Fax: | (336) 297-0931 |
e-mail: | tangermail@tangeroutlet.com |
Mail: | Tanger Factory Outlet Centers, Inc. |
3200 Northline Avenue | |
Suite 360 | |
Greensboro, NC 27408 | |
20
Supplemental Operating and Financial Data for the
Year Ended 12/31/10