Attached files
| file | filename |
|---|---|
| 8-K - MEADOWBROOK INSURANCE GROUP 8-K 2-22-2011 - MEADOWBROOK INSURANCE GROUP INC | form8k.htm |
| EX-99.2 - EXHIBIT 99.2 - MEADOWBROOK INSURANCE GROUP INC | ex99_2.htm |
Exhibit 99.1

Investor Presentation
February 2011
Bob Cubbin, CEO
Karen Spaun, CFO

2
Forward-Looking Statements
Certain statements made by Meadowbrook Insurance Group, Inc. in this presentation may
constitute forward-looking statements including, but not limited to, those statements that include
the words "believes," "expects," "anticipates," "estimates," or similar expressions. Please refer
to the Company's most recent 10-K, 10-Q, and other Securities and Exchange Commission
filings for more information on risk factors. Actual results could differ materially. These forward-
looking statements involve risks and uncertainties including, but not limited to the following: the
frequency and severity of claims; uncertainties inherent in reserve estimates; catastrophic
events; a change in the demand for, pricing of, availability or collectability of reinsurance;
increased rate pressure on premiums; obtainment of certain rate increases in current market
conditions; investment rate of return; changes in and adherence to insurance regulation;
actions taken by regulators, rating agencies or lenders; obtainment of certain processing
efficiencies; changing rates of inflation; and general economic conditions. Meadowbrook is not
under any obligation to (and expressly disclaims any such obligation to) update or alter its
forward-looking statements whether as a result of new information, future events or otherwise.

3
The Meadowbrook Approach
Our objective is to generate predictable results across the market cycle,
with a target return on average equity of 10% - 17%
with a target return on average equity of 10% - 17%
To achieve these results we seek to leverage the unique characteristics of
our balanced business model to generate:
our balanced business model to generate:
Consistent, profitable underwriting results
Predictable investment income in a low-risk, high-quality, fixed income portfolio
Profitable growth both organically and through acquisitions
Strong cash flow from our insurance company subsidiaries and non-regulated fee-
based services to leverage invested assets to equity and manage debt service
based services to leverage invested assets to equity and manage debt service
Steady fee and commission income
We strive to deliver consistent results with a balanced business model
We are a specialty niche focused commercial insurance underwriter and
insurance administration services company
insurance administration services company

4
Meadowbrook Vitals
Current market cap (at 2/18/11): $559.5 million
Outstanding shares at 12/31/10: 53.2 million
Weighted average shares (At 12/31/10): 54.3 million
Book value (12/31/2010): $547.1 million
Book value per share: $10.28 (TTM Dec -10 ROAE 11.4%)
– Excluding unrealized gain / loss, net of deferred taxes: $9.61 (TTM Dec -10 ROAE 12.1%)
– Tangible book value per share (excluding goodwill and intangibles):$7.36 (TTM Dec -10 ROAE 15.7%)
Debt to equity: 21.7%; 6.9% excluding debentures
Debt to total capital: 17.8%; 5.7% excluding debentures
Current price / book: 1.02 (at $10.51/share market price - as of 2/18/11)
Dividend yield (at 2/18/11): 1.60%
Statutory premium leverage Actual Target
– GWP to Statutory surplus 2.2 to 1 2.75 to 1
– NWP to Statutory surplus 1.9 to 1 2.25 to 1
Insider ownership (at 12/31/10): 7.1%

5
What Makes Us Different:
We are Flexible and are Able to Adapt to Changing Market Conditions
Diverse Revenue
Sources
Sources
Positioned to Manage
Insurance Cycles
Insurance Cycles
Conservative
Investment
Philosophy
Investment
Philosophy
Ability to Attract and
Retain Talented
Professionals
Retain Talented
Professionals
Our model allows us to deliver more predictable results
Strong Capital and
Liquidity Position
Liquidity Position
Earned premium from insurance operations Fee revenue from risk management services Flexibility to utilize multiple distribution channels Product, program and geographic diversification Admitted market capabilities contribute to stability and higher renewal retention Non-admitted capabilities enable opportunistic response in volatile pricing environment High-quality fixed income approach to our $1.3 billion portfolio Investment approach reinforces our focus on underwriting profitability Team of talented insurance professionals with a wide range of expertise across all functions and lines of business Regional structure enables associates to deliver strong and responsive local service to clients Insurance subsidiaries rated A- (Excellent) by A.M. Best Insurance subsidiary surplus levels can support meaningful premium growth Generate cash flows from both regulated and non-regulated sources, which provides flexibility Manageable debt levels, with access to $35 million line of credit (no outstanding balance)
6
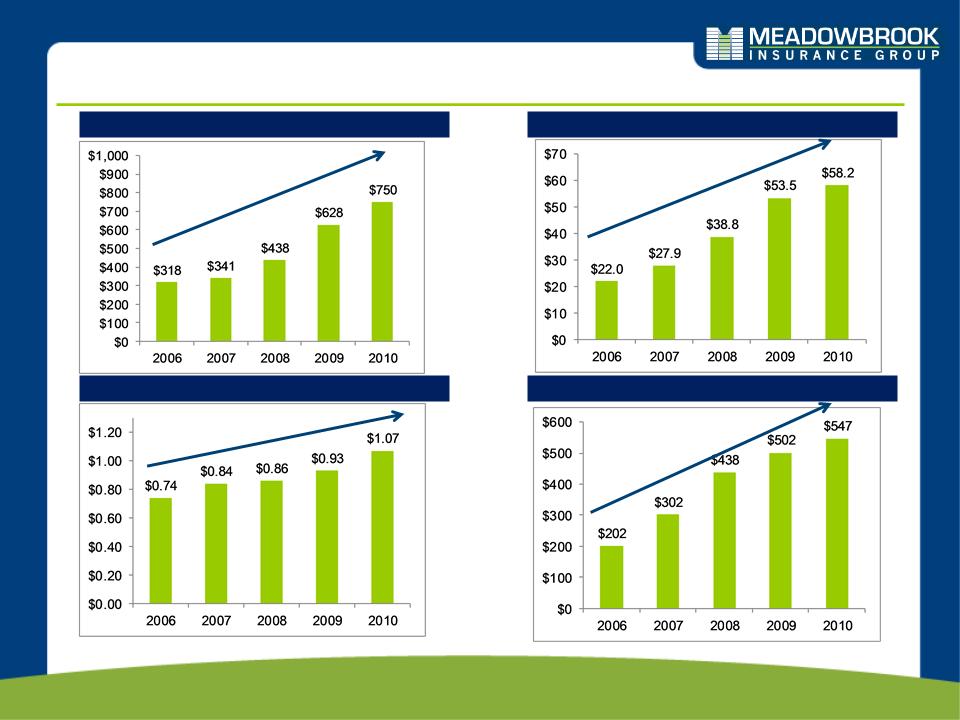
Our Approach Has Delivered Results Over Time
Total Revenue ($M)
Net Operating Income ($M)
Shareholders’ Equity ($M)
Net Operating Income per Share
CAGR (2006 to 2010) = 24%
CAGR (2006 to 2010) = 28%
CAGR (2006 to 2010) = 28%
CAGR (2006 to 2010) = 10%

7
Capability Building Through Successful Acquisitions
Retail Agency Only
1955: Founded as a retail insurance agency
Core Capability Build Out
1985: Star Insurance Company
1990: Savers Property & Casualty Insurance Company
1994: American Indemnity Insurance Company
1996: Association Self Insurance Services
1997: Williamsburg National Insurance Company
Crest Financial Services
1998: Ameritrust Insurance Corporation
Florida Preferred Administrators, Inc.
1999: TPA Insurance Agency
Continued Synergistic Expansion
2007: USSU
2008: Procentury
Strategic Staging of Acquisitions
• Opportunity to leverage our diverse revenue
platform, by expanding current distribution,
servicing capabilities, and complementary
product lines and classes
platform, by expanding current distribution,
servicing capabilities, and complementary
product lines and classes
• Ability to attract talented insurance
professionals that are a good fit with
Meadowbrook culture
professionals that are a good fit with
Meadowbrook culture
• Opportunity to create “win-win” situation by
mitigation our downside risk and providing seller
with opportunity to obtain fair value through deal
structure
mitigation our downside risk and providing seller
with opportunity to obtain fair value through deal
structure
Meadowbrook actively reviews acquisition prospects on a strategic basis and enters into transactions that will increase long-term shareholder value We consider a range of strategic factors when looking at acquisitions including:

8
Diverse Revenue Sources
Insurance Operations
Commission Revenue
Fee Revenue
Our most prominent source of revenue and income comes from our insurance operation;
commission revenue and fee-for-service revenue generate unregulated free cash flow
commission revenue and fee-for-service revenue generate unregulated free cash flow
Admitted and non-admitted products and
programs
programs
Risk sharing vehicles
Managed program revenue
Municipality and Association clients
Agency commission from non-affiliated carriers
TTM Dec -10 Earned Premium: $659.8 M
TTM Dec -10 Net Investment Income: $54.2M
TTM Dec -10 Fee Revenue: $23.0 M
TTM Dec -10 Commission Revenue: $11.2 M

9
Insurance Operations
Diversified Commercial Positions Built to Manage Across Cycles
Main Street Excess
and Surplus Lines
and Surplus Lines
Admitted Programs
Non-Admitted
Programs
Programs
Specialty Markets
Homogeneous specialized programs
Heterogeneous geographic centers
Product focused
Promotes specialty agents
Broad classes of “Main Street”
commercial risks
commercial risks
Promotes General Agent
distribution
distribution
Specialized programs ignored or
underserved by the standard market
underserved by the standard market
Promotes wholesalers with specialty
underwriting authority
underwriting authority
Solutions designed for very specific
products and market segments
products and market segments
TTM Dec-10 GWP:$532 M
TTM Dec-10 GWP: $147 M
TTM Dec-10 GWP: $47 M
TTM Dec-10 GWP: $76 M
Picture framers
Music equipment stores
Christian booksellers
Chemical distributors
Description
Examples
Restaurants, bars and taverns
Apartments, hotels and motels
Mercantile
Contractors liability
Pet-sitters
Oil and gas contractors
Assisted care facilities
Package delivery
Excess workers’ comp
Transportation
Agriculture
Marine

10
National Scope with Regional Perspective
Bermuda
Talented associates are located throughout the country to serve the needs of
regional clients
regional clients
Support from headquarters enables efficient resource deployment and cross-unit
coordination
coordination
Balance of effective local touch, with efficient national coordination
Meadowbrook locations
Top 10 production states (As of 12/31/2010)
1
2
4
6
3
1
2
7
5
10
8
9
11
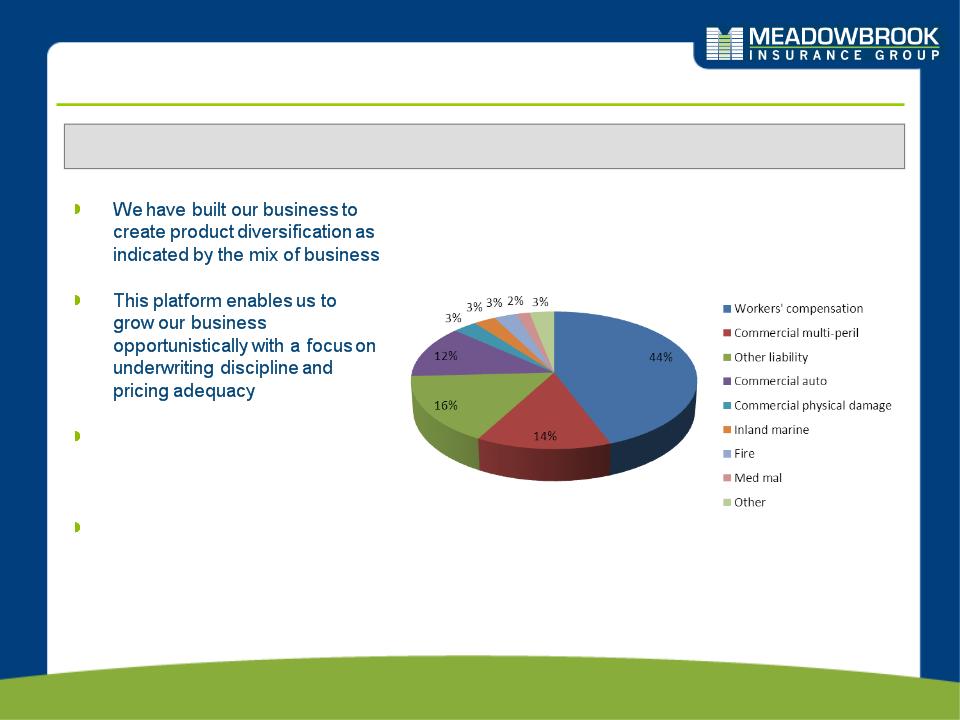
Diverse Mix of Business
Full Year 2010 Gross Written Premium Business Mix
Year Ended December 31, 2010
Our wide range of product
expertise positions us well to
support future growth
expertise positions us well to
support future growth
Our new business is primarily
rollover books of business with
a proven track record of
profitability
rollover books of business with
a proven track record of
profitability

Loss and Expense Ratios
12
Loss ratio
2006 - 2010 GAAP and Accident Year Combined Ratios
96.8%
Our GAAP combined ratio has improved over time and our accident year combined ratio
has remained profitable
has remained profitable
2006
2007
2008
2009#
2010
97.9%
95.4%
98.0%
93.3%
97.8%
93.2%
98.5%
95.0%
99.7%
Re-estimated AY Combined Ratio†
(as of 12/31/2010)
94.7%*
94.7%*
93.2%*
98.3%
†The re-estimated AY combined ratio reflects reserve adjustments made following the accident year, for example, the 94.7% re-estimated 2006 AY
combined ratio reflects new loss development information gathered over the 4 years from 12/31/2006 to 12/31/2010; the 94.7% re-estimated 2007 AY
combined ratio reflects new loss development gathered over the 3 years from 12/31/2007 to 12/31/2010; etc.
combined ratio reflects new loss development information gathered over the 4 years from 12/31/2006 to 12/31/2010; the 94.7% re-estimated 2007 AY
combined ratio reflects new loss development gathered over the 3 years from 12/31/2007 to 12/31/2010; etc.
* The 2006 - 2007 initial and re-estimated AY combined ratios excludes Century. The 2008 re-estimated AY combined ratio includes a pro-rata portion of
the Century AY 2008 development for the 5 post-merger months.
the Century AY 2008 development for the 5 post-merger months.
# 2009 AY and CY expense ratio reflects expense reclassification as disclosed in our May 3, 2010 8-k filing with the SEC.
99.7%

Expense Ratio Analysis
13
Twelve Month Ended GAAP Expense Ratio Comparison
Net earned premium $539.6M $659.8M
Policy acquisition $175.1M $227.0M
and other u/w expenses
and other u/w expenses
Expense ratio 32.5% 34.4%
*As a result of our internal cost allocation study,1.0% of internal claims administration is included in the 2010 expense
ratio instead of ULAE
ratio instead of ULAE
14
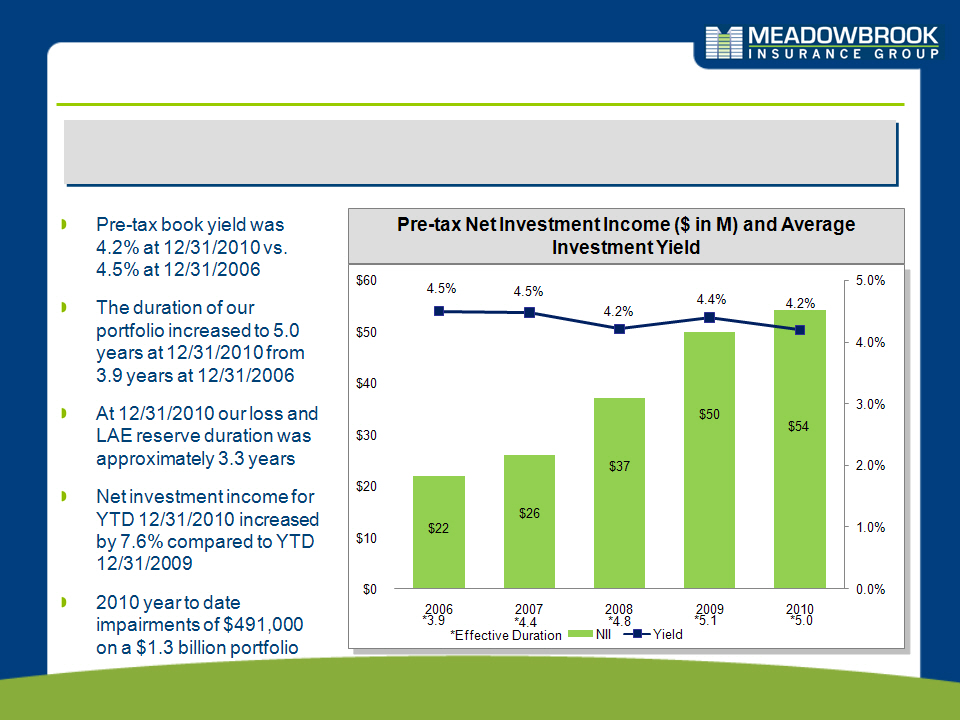
Focus on Generating Consistent Investment
Income
Income
Robust top line growth has led to a larger investment base and a meaningful
increase in full year NII
increase in full year NII
Pre-tax book yield was 4.2% at 12/31/2010 vs. 4.5% at 12/31/2006 The duration of our portfolio increased to 5.0 years at 12/31/2010 from 3.9 years at 12/31/2006 At 12/31/2010 our loss and LAE reserve duration was approximately 3.3 years Net investment income for YTD 12/31/2010 increased by 7.6% compared to YTD 12/31/2009 2010 year to date impairments of $491,000 on a $1.3 billion portfolio

15
We Maintain a High Quality, Low Risk Investment Portfolio
We maintain a conservative investment portfolio
Portfolio Allocation and Quality
Allocation based on market value
Low equity risk exposure
– 98% fixed income and cash
– 2% equity
High credit quality
– 98% of bonds are investment grade
– Average S&P rating of AA / Moody’s
of Aa2
of Aa2
The effective duration of our $1.3 billion
portfolio is 5.0 years
portfolio is 5.0 years
The duration on net reserves of $784
million is approximately 3.3 years
million is approximately 3.3 years
NOTE: Data above as of December 31, 2010

16
Fee-Based and Agency Operations Give Us
Flexibility with Unregulated Cash Flow
Flexibility with Unregulated Cash Flow
We serve the self-insurance market for municipalities and associations
– Sample clients include the Michigan Municipal League, the Minnesota County
Insurance Trust and the Alabama Forest Fund
Insurance Trust and the Alabama Forest Fund
We provides clients administrative and back office services
In many cases, programs have been built on long-standing
relationships
relationships
A source of non-regulated liquidity that has low capital requirements
Agency
Operations
Operations
Managed
Programs
Programs
Original foundation of the company in 1955
We operate five retail / wholesale agencies and generate commission
income from more than 50 unaffiliated carriers
income from more than 50 unaffiliated carriers
Our fee-based and commission businesses are relatively small but continue to
provide a valuable source of unregulated cash flow
provide a valuable source of unregulated cash flow

17
Capital Management
Our goal is to be efficient managers of capital; we initiated a dividend during
2008 and since this time we have returned $54.4M to shareholders through
dividends and share repurchases
2008 and since this time we have returned $54.4M to shareholders through
dividends and share repurchases
18
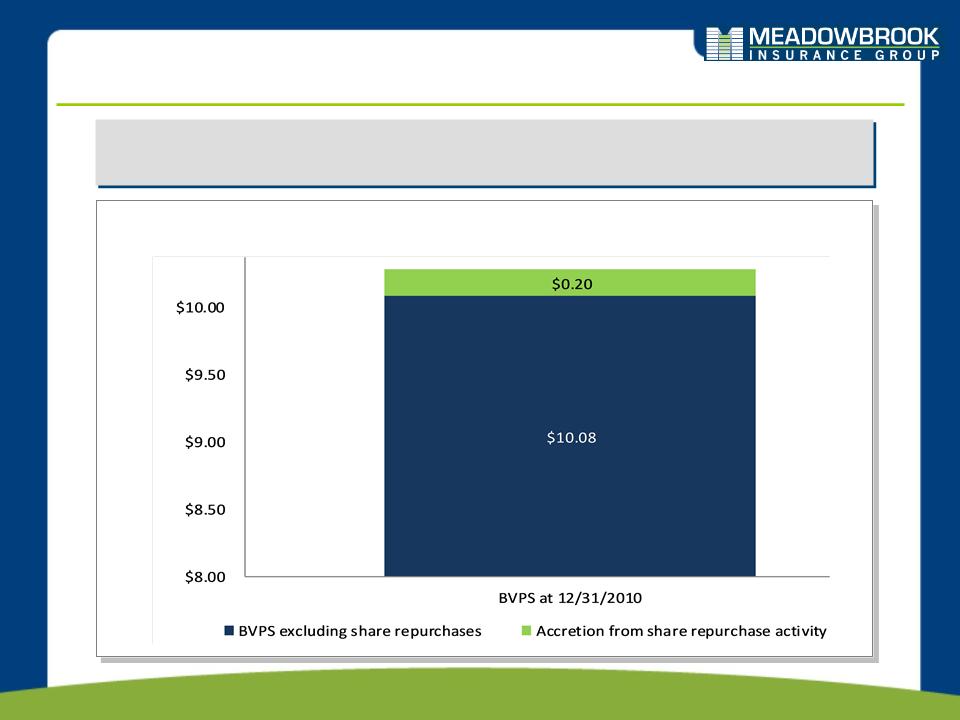
Capital Management
Since 2008 our share repurchase activity has been accretive, increasing
BVPS by $0.20
BVPS by $0.20
12/31/2010 BVPS: $10.28

19
Recent Financial Highlights:
Highlights ($ in M)

20
Full Year 2011 Guidance and Long Term Value Creation
Looking ahead to 2011, we expect a market similar to that which we have
experienced during 2010
experienced during 2010
Gross Written Premium
$802M
Combined Ratio
95.0%
Net income from operations
$58.2M
Net operating income per share
$1.07
2010 Results
Leverage multiple revenue
sources and diverse insurance
offering to maximize
opportunities across market
cycles
sources and diverse insurance
offering to maximize
opportunities across market
cycles
Increase underwriting leverage
through selective growth
opportunities, while sustaining
appropriate diversification
through selective growth
opportunities, while sustaining
appropriate diversification
Increase investment leverage
through cash from operations
through cash from operations
Leverage fixed costs over a
larger revenue base
larger revenue base
Increase fee-for service
income through new
opportunities and margin
expansion
income through new
opportunities and margin
expansion
Driving Long-term
Enterprise Value
Enterprise Value
2011 Guidance*
Gross Written Premium
Range of $830M - $850M
Combined Ratio
Range of 96.0% - 97.0%
Net income from operations
$53.0M - $58.5M
Net operating income per share
$1.00 to $1.10 per share
*Our guidance range does not
include any favorable or
unfavorable development on
prior year reserves
include any favorable or
unfavorable development on
prior year reserves
