Attached files
UNITED STATES
SECURITIES AND EXCHANGE COMMISSION
Washington, DC 20549
FORM 10-Q
(Mark One)
x | QUARTERLY REPORT UNDER SECTION 13 OR 15(d) OF THE SECURITIES EXCHANGE OF 1934 |
For the quarterly period ended December 31, 2010
or
o | TRANSITION REPORT UNDER SECTION 13 OR 15(d) OF THE SECURITIES EXCHANGE OF 1934 |
For the transition period from _______ to _______
Commission file number: 000-30311
GOLD HORSE INTERNATIONAL, INC.
(Exact name of registrant as specified in its charter)
Florida | 22-3719165 |
(State or other jurisdiction of incorporation or organization) | (I.R.S. Employer Identification No.) |
No. 31 Tongdao South Road, Hohhot, Inner Mongolia, China | 010030 |
(Address of principal executive offices) | (Zip Code) |
86 (471) 339 7999
(Registrant's telephone number, including area code)
N/A
(Former name, former address and former fiscal year, if changed since last report)
Indicate by check mark whether the registrant (1) has filed all reports required to be filed by Section 13 or 15(d) of the Securities Exchange Act of 1934 during the preceding 12 months (or for such shorter period that the registrant was required to file such reports), and (2) has been subject to such filing requirements for the past 90 days. Yes x No o
Indicate by check mark whether the registrant has submitted electronically and posted on its corporate Web site, if any, every Interactive Data File required to be submitted and posted pursuant to Rule 405 of Regulation S-T (§ 232.405 of this chapter) during the preceding 12 (or for such shorter period that the registrant was required to submit and post such files). Yes o No o
Indicate by check mark whether the registrant is a large accelerated filer, an accelerated filer, a non-accelerated filer, or a smaller reporting company:
Large accelerated filer | o | Accelerated filer | o |
Non-accelerated filer | o | Smaller reporting company | x |
Indicate by check mark whether the registrant is a shell company (as defined in Rule 12b-2 of the Exchange Act). Yes o No x
Indicate the number of shares outstanding of each of the issuer's classes of common equity, as of the latest practicable date: 1,989,459 shares at February 14, 2011.
GOLD HORSE INTERNATIONAL, INC. AND SUBSIDIARIES
FORM 10-Q
QUARTERLY PERIOD ENDED DECEMBER 31, 2010
TABLE OF CONTENTS
|
| Page |
PART I - FINANCIAL INFORMATION |
| |
Item 1. | Financial Statements. |
|
| Condensed Consolidated Balance Sheets As of December 31, 2010 and June 30, 2010 | 4 |
| Condensed Consolidated Statements of Income and Comprehensive Income For the Three and Six Months Ended December 31, 2010 and 2009 | 5 |
| Condensed Consolidated Statements of Cash Flows For the Six Months Ended December 31, 2010 and 2009 | 6 |
| Notes to Unaudited Condensed Consolidated Financial Statements | 7 |
Item 2. | Management's Discussion and Analysis of Financial Condition and Results of Operations | 27 |
Item 3. | Quantitative and Qualitative Disclosures About Market Risk | 42 |
Item 4T. | Controls and Procedures | 42 |
|
|
|
PART II - OTHER INFORMATION |
| |
Item 1 | Legal Proceedings | 44 |
Item 1A. | Risk Factors | 44 |
Item 2. | Unregistered Sales of Equity Securities and Use of Proceeds | 44 |
Item 3. | Defaults Upon Senior Securities | 44 |
Item 4. | (Removed and Reserved) | 44 |
Item 5. | Other Information | 44 |
Item 6. | Exhibits | 44 |
CAUTIONARY STATEMENT REGARDING FORWARD-LOOKING INFORMATION
This report contains forward-looking statements. These forward-looking statements are subject to known and unknown risks, uncertainties and other factors which may cause actual results, performance or achievements to be materially different from any future results, performance or achievements expressed or implied by such forward-looking statements. These forward-looking statements were based on various factors and were derived utilizing numerous assumptions and other factors that could cause our actual results to differ materially from those in the forward-looking statements. These factors include, but are not limited to, the amount of funds owed us by the Jin Ma Companies, the enforceability of our contractual arrangements with the Jin Ma Companies, the risk of doing business in the People’s Republic of China (“PRC”), our ability to implement our strategic initiatives, our access to sufficient capital, our ability to satisfy our obligations as they become due, economic, political and market conditions and fluctuations, PRC government regulations and economic policies, industry regulation, competition, and other factors. Most of these factors are difficult to predict accurately and are generally beyond our control.
You should consider the areas of risk described in connection with any forward-looking statements that may be made in our report as filed with the SEC. Readers are cautioned not to place undue reliance on these forward-looking statements and readers should carefully review this quarterly report and our annual report on Form 10-K for the year ended June 30, 2010, including the risks described in Item 1A. - Risk Factors, in their entirety. Except for our ongoing obligations to disclose material information under the Federal securities laws, we undertake no obligation to release publicly any revisions to any forward-looking statements, to report events or to report the occurrence of unanticipated events. These forward-looking statements speak only as of the date of this quarterly report, and you should not rely on these statements without also considering the risks and uncertainties associated with these statements and our business.
2
OTHER PERTINENT INFORMATION
Our web site is www.goldhorseinternational.com. The information which appears on our web site is not part of this report.
All share and per share information in this report gives effect to the 40:1 reverse stock split of our common stock which was effective on September 8, 2010.
Our business is conducted in China, using Renminbi (“RMB”), the currency of China, and our financial statements are presented in United States dollars. In this report, we refer to assets, obligations, commitments and liabilities in our financial statements in United States dollars. These dollar references are based on the exchange rate of RMB to United States dollars, determined as of a specific date. Changes in the exchange rate will affect the amount of our obligations and the value of our assets in terms of United States dollars which may result in an increase or decrease in the amount of our obligations (expressed in dollars) and the value of our assets, including accounts receivable (expressed in dollars).
Unless specifically set forth to the contrary, when used in this prospectus the terms:
| • | “Gold Horse International,” the “Company, “we,” “us,” “ours,” and similar terms refers to Gold Horse International, Inc., a Florida corporation, |
|
|
|
| • | “Gold Horse Nevada” refers to Gold Horse International, Inc., a Nevada corporation and wholly-owned subsidiary of Gold Horse International, |
|
|
|
| • | “Global Rise” refers to Global Rise International, Limited, a Cayman Islands corporation and wholly-owned subsidiary of Gold Horse Nevada, |
|
|
|
| • | “IMTD” refers to Inner Mongolia (Cayman) Technology & Development Ltd., a Chinese company and wholly-owned subsidiary of Global Rise, |
|
|
|
| • | “Jin Ma Real Estate” refers to Inner Mongolia Jin Ma Real Estate Development Co., Ltd., a Chinese company, |
|
|
|
| • | “Jin Ma Construction” refers to Inner Mongolia Jin Ma Construction Co., Ltd., a Chinese company, |
|
|
|
| • | “Jin Ma Hotel” refers to Inner Mongolia Jin Ma Hotel Co., Ltd., a Chinese company, |
|
|
|
| • | “Jin Ma Companies” collectively refers to Jin Ma Real Estate, Jin Ma Construction and Jin Ma Hotel, which are variable interest entities under contractual arrangements with us and whose financial statements are consolidated with ours, unless the context specifically states or implies otherwise; and |
|
|
|
| • | “first quarter of 2011” refers to the three months ended September 30, 2010 and, “first quarter of 2010” refers to the three months ended September 30, 2009, unless the context otherwise defines. |
|
|
|
| • | “second quarter of 2011” refers to the three months ended December 31, 2010 and, “second quarter of 2010” refers to the three months ended December 31, 2009, unless the context otherwise defines. |
3
GOLD HORSE INTERNATIONAL, INC. AND SUBSIDIARIES
CONDENSED CONSOLIDATED BALANCE SHEETS
|
| As of |
| ||||
|
|
| December 31, |
|
| June 30, |
|
|
| 2010 |
| 2010 |
| ||
|
| (Unaudited) |
|
|
|
| |
ASSETS |
|
|
|
|
|
|
|
|
|
|
|
|
|
|
|
Cash and cash equivalents |
| $ | 594,349 |
| $ | 309,996 |
|
Accounts receivable, net |
|
| 11,996,798 |
|
| 7,912,119 |
|
Notes receivable on sales type lease - current portion |
|
| 1,696,005 |
|
| 1,150,333 |
|
Inventories, net |
|
| 61,718 |
|
| 64,007 |
|
Prepaid expenses |
|
| 42,173 |
|
| 210,000 |
|
Other receivables, net |
|
| 111,845 |
|
| 24,969 |
|
Cost and estimated earnings in excess of billings |
|
| 53,251 |
|
| 93,879 |
|
Real estate held for sale |
|
| 200,606 |
|
| 367,009 |
|
Deferred tax assets |
|
| 225,905 |
|
| 267,668 |
|
Construction in progress - current portion |
|
| 14,246,384 |
|
| — |
|
|
|
|
|
|
|
|
|
Total Current Assets |
|
| 29,229,034 |
|
| 10,399,980 |
|
|
|
|
|
|
|
|
|
Property and equipment, net |
|
| 8,630,228 |
|
| 8,727,796 |
|
Construction in progress - non-current portion |
|
| 13,243,443 |
|
| 12,860,646 |
|
Notes receivable on sales type lease - non-current portion |
|
| 15,490,077 |
|
| 15,853,319 |
|
|
|
|
|
|
|
|
|
Total Assets |
| $ | 66,592,782 |
| $ | 47,841,741 |
|
|
|
|
|
|
|
|
|
LIABILITIES AND STOCKHOLDERS' EQUITY |
|
|
|
|
|
|
|
|
|
|
|
|
|
|
|
Current Liabilities: |
|
|
|
|
|
|
|
Loans payable - current portion |
| $ | 3,183,702 |
| $ | 3,091,678 |
|
Accounts payable |
|
| 18,463,337 |
|
| 3,522,030 |
|
Due to related parties |
|
| 506,723 |
|
| 230,453 |
|
Accrued expenses |
|
| 755,245 |
|
| 832,597 |
|
Taxes payable |
|
| 1,936,493 |
|
| 2,374,059 |
|
Advances from customers |
|
| 191,152 |
|
| 144,670 |
|
Derivative liability |
|
| 496,538 |
|
| 653,630 |
|
Billings in excess of costs and estimated earnings |
|
| 730 |
|
| 90,205 |
|
|
|
|
|
|
|
|
|
Total Current Liabilities |
|
| 25,533,920 |
|
| 10,939,322 |
|
|
|
|
|
|
|
|
|
Loans payable - net of current portion |
|
| 317,614 |
|
| 345,152 |
|
|
|
|
|
|
|
|
|
Total Liabilities |
|
| 25,851,534 |
|
| 11,284,474 |
|
|
|
|
|
|
|
|
|
Commitments (Note 18) |
|
| — |
|
| — |
|
|
|
|
|
|
|
|
|
Stockholders' Equity: |
|
|
|
|
|
|
|
Preferred stock ($0.0001 par value; 20,000,000 shares authorized; none issued and outstanding) |
|
| — |
|
| — |
|
Common stock ($0.0001 par value; 300,000,000 shares authorized; 1,989,459 and 1,934,878 shares issued and outstanding at December 31, 2010 and June 30, 2010) |
|
| 199 |
|
| 193 |
|
Non-controlling interest in variable interest entities |
|
| 6,095,314 |
|
| 6,095,314 |
|
Additional paid-in capital |
|
| 7,346,784 |
|
| 7,127,577 |
|
Statutory reserve |
|
| 2,491,844 |
|
| 2,470,154 |
|
Retained earnings |
|
| 21,001,871 |
|
| 18,213,466 |
|
Accumulated other comprehensive income |
|
| 3,805,236 |
|
| 2,650,563 |
|
|
|
|
|
|
|
|
|
Total Stockholders' Equity |
|
| 40,741,248 |
|
| 36,557,267 |
|
|
|
|
|
|
|
|
|
Total Liabilities and Stockholders' Equity |
| $ | 66,592,782 |
| $ | 47,841,741 |
|
See accompanying notes to unaudited consolidated financial statements
4
GOLD HORSE INTERNATIONAL, INC. AND SUBSIDIARIES
CONDENSED CONSOLIDATED STATEMENTS OF INCOME AND COMPREHENSIVE INCOME
|
| For the Three Months Ended |
| For the Six Months Ended |
| ||||||||
|
| 2010 |
| 2009 |
| 2010 |
| 2009 |
| ||||
|
| (Unaudited) |
| (Unaudited) |
| (Unaudited) |
| (Unaudited) |
| ||||
NET REVENUES |
|
|
|
|
|
|
|
|
|
|
|
|
|
Construction |
| $ | 15,400,661 |
| $ | 4,405,892 |
| $ | 24,991,149 |
| $ | 9,596,012 |
|
Hotel |
|
| 724,213 |
|
| 734,809 |
|
| 1,565,475 |
|
| 1,512,829 |
|
Real estate |
|
| 302,400 |
|
| 158,981 |
|
| 713,369 |
|
| 158,981 |
|
|
|
|
|
|
|
|
|
|
|
|
|
|
|
Total Revenues |
|
| 16,427,274 |
|
| 5,299,682 |
|
| 27,269,993 |
|
| 11,267,822 |
|
|
|
|
|
|
|
|
|
|
|
|
|
|
|
COST OF REVENUES |
|
|
|
|
|
|
|
|
|
|
|
|
|
Construction |
|
| 13,280,141 |
|
| 3,878,214 |
|
| 21,437,820 |
|
| 8,329,680 |
|
Hotel |
|
| 393,607 |
|
| 494,312 |
|
| 909,055 |
|
| 1,008,859 |
|
Real estate |
|
| 241,712 |
|
| 167,050 |
|
| 540,214 |
|
| 167,050 |
|
|
|
|
|
|
|
|
|
|
|
|
|
|
|
Total Cost of Revenues |
|
| 13,915,460 |
|
| 4,539,576 |
|
| 22,887,089 |
|
| 9,505,589 |
|
|
|
|
|
|
|
|
|
|
|
|
|
|
|
GROSS PROFIT |
|
| 2,511,814 |
|
| 760,106 |
|
| 4,382,904 |
|
| 1,762,233 |
|
|
|
|
|
|
|
|
|
|
|
|
|
|
|
OPERATING EXPENSES: |
|
|
|
|
|
|
|
|
|
|
|
|
|
Other hotel operating expenses |
|
| 12,255 |
|
| 76,586 |
|
| 31,960 |
|
| 103,359 |
|
Bad debt recovery |
|
| (188,120 | ) |
| (97,564 | ) |
| (195,612 | ) |
| (105,555 | ) |
Salaries and employee benefits |
|
| 207,251 |
|
| 198,349 |
|
| 418,610 |
|
| 392,435 |
|
Depreciation |
|
| 197,965 |
|
| 191,532 |
|
| 392,437 |
|
| 385,121 |
|
Selling, general and administrative |
|
| 165,044 |
|
| 102,611 |
|
| 467,734 |
|
| 252,563 |
|
|
|
|
|
|
|
|
|
|
|
|
|
|
|
Total Operating Expenses |
|
| 394,395 |
|
| 471,514 |
|
| 1,115,129 |
|
| 1,027,923 |
|
|
|
|
|
|
|
|
|
|
|
|
|
|
|
INCOME FROM OPERATIONS |
|
| 2,117,419 |
|
| 288,592 |
|
| 3,267,775 |
|
| 734,310 |
|
|
|
|
|
|
|
|
|
|
|
|
|
|
|
OTHER INCOME (EXPENSES): |
|
|
|
|
|
|
|
|
|
|
|
|
|
Other income (expense) |
|
| 58 |
|
| (27 | ) |
| 6,842 |
|
| 46 |
|
Gain on extinguishment of derivative liabilities |
|
| — |
|
| 561,602 |
|
| — |
|
| 1,623,209 |
|
Gain on change in fair value of derivative liabilities |
|
| 121,612 |
|
| 1,314,381 |
|
| 157,092 |
|
| 2,002,937 |
|
Gain on sale of land use rights and property |
|
| — |
|
| 167 |
|
| — |
|
| 449,473 |
|
Interest income |
|
| 431,248 |
|
| 543,092 |
|
| 650,860 |
|
| 543,149 |
|
Interest expense |
|
| (125,960 | ) |
| (745,695 | ) |
| (252,006 | ) |
| (2,317,076 | ) |
|
|
|
|
|
|
|
|
|
|
|
|
|
|
Total Other Income |
|
| 426,958 |
|
| 1,673,520 |
|
| 562,788 |
|
| 2,301,738 |
|
|
|
|
|
|
|
|
|
|
|
|
|
|
|
INCOME BEFORE PROVISION FOR INCOME TAX |
|
| 2,544,377 |
|
| 1,962,112 |
|
| 3,830,563 |
|
| 3,036,048 |
|
|
|
|
|
|
|
|
|
|
|
|
|
|
|
PROVISION FOR INCOME TAXES |
|
| 648,547 |
|
| 79,632 |
|
| 1,020,468 |
|
| 314,778 |
|
|
|
|
|
|
|
|
|
|
|
|
|
|
|
NET INCOME |
| $ | 1,895,830 |
| $ | 1,882,480 |
| $ | 2,810,095 |
| $ | 2,721,270 |
|
|
|
|
|
|
|
|
|
|
|
|
|
|
|
COMPREHENSIVE INCOME: |
|
|
|
|
|
|
|
|
|
|
|
|
|
Net income |
| $ | 1,895,830 |
| $ | 1,882,480 |
| $ | 2,810,095 |
| $ | 2,721,270 |
|
|
|
|
|
|
|
|
|
|
|
|
|
|
|
OTHER COMPREHENSIVE INCOME: |
|
|
|
|
|
|
|
|
|
|
|
|
|
Unrealized foreign currency translation gain |
|
| 529,724 |
|
| 1,716 |
|
| 1,154,673 |
|
| 33,861 |
|
|
|
|
|
|
|
|
|
|
|
|
|
|
|
COMPREHENSIVE INCOME |
| $ | 2,425,554 |
| $ | 1,884,196 |
| $ | 3,964,768 |
| $ | 2,755,131 |
|
|
|
|
|
|
|
|
|
|
|
|
|
|
|
NET INCOME PER COMMON SHARE: |
|
|
|
|
|
|
|
|
|
|
|
|
|
Basic |
| $ | 0.97 |
| $ | 1.22 |
| $ | 1.45 |
| $ | 1.88 |
|
Diluted |
| $ | 0.96 |
| $ | 1.22 |
| $ | 1.42 |
| $ | 1.85 |
|
|
|
|
|
|
|
|
|
|
|
|
|
|
|
WEIGHTED AVERAGE COMMON SHARES OUTSTANDING: |
|
|
|
|
|
|
|
|
|
|
|
|
|
Basic |
|
| 1,947,992 |
|
| 1,544,003 |
|
| 1,941,476 |
|
| 1,447,276 |
|
Diluted |
|
| 1,981,696 |
|
| 1,544,003 |
|
| 1,972,611 |
|
| 1,469,458 |
|
See accompanying notes to unaudited consolidated financial statements
5
GOLD HORSE INTERNATIONAL, INC. AND SUBSIDIARIES
CONDENSED CONSOLIDATED STATEMENTS OF CASH FLOWS
|
| For the Six Months Ended |
| ||||
|
| December 31, |
| ||||
|
| 2010 |
| 2009 |
| ||
|
| (Unaudited) |
| (Unaudited) |
| ||
|
|
|
|
| (As Restated) |
| |
CASH FLOWS FROM OPERATING ACTIVITIES: |
|
|
|
|
|
|
|
Net income |
| $ | 2,810,095 |
| $ | 2,721,270 |
|
Adjustments to reconcile net income to net cash provided by operating activities: |
|
|
|
|
|
|
|
Depreciation |
|
| 392,437 |
|
| 385,121 |
|
Stock-based compensation and fees |
|
| 116,094 |
|
| 57,500 |
|
Common stock issued for interest |
|
| — |
|
| 19,085 |
|
Bad debt recovery |
|
| (195,612 | ) |
| (105,555 | ) |
Interest expense from amortization of debt discount |
|
| — |
|
| 1,931,611 |
|
Warrants issued for service |
|
| 31,188 |
|
| — |
|
Gain on sale of land use right |
|
| — |
|
| (449,472 | ) |
Gain from debt extinguishment |
|
| — |
|
| (1,623,209 | ) |
Gain on change in fair value of derivative liabilities |
|
| (157,092 | ) |
| (2,002,937 | ) |
Changes in assets and liabilities: |
|
|
|
|
|
|
|
Accounts receivable |
|
| (3,597,076 | ) |
| (409,136 | ) |
Notes receivable |
|
| 318,298 |
|
| 158,067 |
|
Inventories |
|
| 4,124 |
|
| (49,770 | ) |
Other receivables |
|
| (77,145 | ) |
| 1,176,271 |
|
Advance to suppliers |
|
| — |
|
| (74,053 | ) |
Prepaid expenses |
|
| 169,253 |
|
| — |
|
Costs and estimated earnings in excess of billings |
|
| 42,700 |
|
| 6,466 |
|
Real estate held for sale |
|
| 174,377 |
|
| — |
|
Construction in progress |
|
| (14,009,349 | ) |
| (2,746,228 | ) |
Accounts payable and accrued expenses |
|
| 14,562,314 |
|
| (2,310,257 | ) |
Taxes payable |
|
| (450,871 | ) |
| (1,452,604 | ) |
Advances from customers |
|
| 41,475 |
|
| 2,621,660 |
|
Billings in excess of costs and estimated earnings |
|
| (90,626 | ) |
| 20,428 |
|
NET CASH PROVIDED BY (USED IN) OPERATING ACTIVITIES |
|
| 84,584 |
|
| (2,125,742 | ) |
|
|
|
|
|
|
|
|
CASH FLOWS FROM INVESTING ACTIVITIES: |
|
|
|
|
|
|
|
Proceeds from sale of land use right |
|
| — |
|
| 2,193,441 |
|
Purchase of property and equipment |
|
| (41,033 | ) |
| (31,820 | ) |
NET CASH (USED IN) PROVIDED BY INVESTING ACTIVITIES |
|
| (41,033 | ) |
| 2,161,621 |
|
|
|
|
|
|
|
|
|
CASH FLOWS FROM FINANCING ACTIVITIES: |
|
|
|
|
|
|
|
Repayment of loans payable |
|
| (37,182 | ) |
| (146,229 | ) |
Proceeds from advances from related party |
|
| 264,928 |
|
| 1,203,780 |
|
Repayment of convertible debt |
|
| — |
|
| (764,050 | ) |
NET CASH PROVIDED BY FINANCING ACTIVITIES |
|
| 227,746 |
|
| 293,501 |
|
|
|
|
|
|
|
|
|
EFFECT OF EXCHANGE RATE ON CASH |
|
| 13,056 |
|
| (459 | ) |
|
|
|
|
|
|
|
|
NET INCREASE IN CASH & CASH EQUIVALENTS |
|
| 284,353 |
|
| 328,921 |
|
|
|
|
|
|
|
|
|
CASH & CASH EQUIVALENTS - beginning of period |
|
| 309,996 |
|
| 112,134 |
|
|
|
|
|
|
|
|
|
CASH & CASH EQUIVALENTS - end of period |
| $ | 594,349 |
| $ | 441,055 |
|
|
|
|
|
|
|
|
|
SUPPLEMENTAL DISCLOSURE OF CASH FLOW INFORMATION: |
|
|
|
|
|
|
|
Cash paid for: |
|
|
|
|
|
|
|
Interest |
| $ | 219,620 |
| $ | 391,669 |
|
Income taxes |
| $ | 1,105,666 |
| $ | 1,389,002 |
|
|
|
|
|
|
|
|
|
Non-cash activities: |
|
|
|
|
|
|
|
Common stock issued for prior and future service |
| $ | 71,931 |
| $ | 248,000 |
|
Common stock issued for conversion of convertible debt |
| $ | — |
| $ | 664,784 |
|
Common stock issued for accrued interest |
| $ | — |
| $ | 21,830 |
|
Reclassification of warrants and conversion options to derivative liabilities |
| $ | — |
| $ | 4,680,179 |
|
See accompanying notes to unaudited consolidated financial statements
6
GOLD HORSE INTERNATIONAL, INC. AND SUBSIDIARIES
NOTES TO UNAUDITED CONDENSED CONSOLIDATED FINANCIAL STATEMENTS
December 31, 2010
NOTE 1 – ORGANIZATION AND SUMMARY OF SIGNIFICANT ACCOUNTING POLICIES
Organization
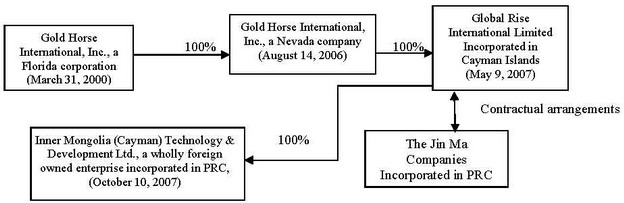
Gold Horse International, Inc. (the “Company”, “we”, “us”, “our”) was incorporated on March 21, 2000 under the laws of the State of New Jersey under its former name “Segway III”. Prior to June 29, 2007, the Company was a development stage company attempting to implement its business plan to become a fully integrated online provider that links the supply and demand sides of the ground trucking industry. In November 2007, the Company filed a Certificate of Domestication in the State of Florida whereby the Company domesticated as a Florida corporation under the name Gold Horse International, Inc.
On June 29, 2007, the Company executed a Share Exchange Agreement (“Share Exchange Agreement”) with Gold Horse International, Inc. (“Gold Horse Nevada”), a Nevada corporation, whereby the Company acquired all of the outstanding common stock of Gold Horse Nevada from its stockholders in exchange for newly-issued stock of the Company. Gold Horse Nevada was incorporated on August 14, 2006 in the State of Nevada.
Under the Share Exchange Agreement, on June 29, 2007, the Company issued 1,212,500 shares of its common stock to the Gold Horse Nevada Stockholders and their assignees in exchange for 100% of the common stock of Gold Horse Nevada. Additionally, the Company’s prior President, CEO and sole director, cancelled 241,376 of the Company’s common stock he owned immediately prior to the closing. After giving effect to the cancellation of shares, the Company had a total of 37,500 shares of common stock outstanding immediately prior to Closing. After the Closing, the Company had a total of 1,250,000 shares of common stock outstanding, with the Gold Horse Nevada Stockholders and their assignees owning 97% of the total issued and outstanding shares of the Company’s common stock.
Gold Horse Nevada became a wholly-owned subsidiary of the Company and Gold Horse Nevada’s former shareholders own the majority of the Company’s voting stock.
Gold Horse Nevada owns 100% of Global Rise International, Limited (“Global Rise”), a Cayman Islands corporation incorporated on May 9, 2007. Through Global Rise, Gold Horse Nevada operates, controls and beneficially owns the construction, hotel and real estate development businesses in China under a series of contractual arrangements (the “Contractual Arrangements”) with Inner Mongolia Jin Ma Real Estate Development Co., Ltd. (“Jin Ma Real Estate”), Inner Mongolia Jin Ma Construction Co., Ltd. (“Jin Ma Construction”) and Inner Mongolia Jin Ma Hotel Co., Ltd. (“Jin Ma Hotel”), (collectively referred to as the “Jin Ma Companies”). Other than the Contractual Arrangements with the Jin Ma Companies, the Company, Gold Horse Nevada nor Global Rise are engaged in any business or operations. The Contractual Arrangements are discussed below.
On October 10, 2007, the Company established Inner Mongolia (Cayman) Technology & Development Ltd. (“IMTD”), a wholly-foreign owned enterprise incorporated in the PRC and wholly-owned subsidiary of Global Rise,
The relationship among the above companies as follows:
7
GOLD HORSE INTERNATIONAL, INC. AND SUBSIDIARIES
NOTES TO UNAUDITED CONDENSED CONSOLIDATED FINANCIAL STATEMENTS
December 31, 2010
NOTE 1 – ORGANIZATION AND SUMMARY OF SIGNIFICANT ACCOUNTING POLICIES (continued)
As a result of these Contractual Arrangements, the acquisition of Gold Horse Nevada and the Jin Ma Companies by the Company was accounted for as a reverse merger because on a post-merger basis, the former shareholders of Gold Horse Nevada held a majority of the outstanding common stock of the Company on a voting and fully-diluted basis. As a result, Gold Horse Nevada is deemed to be the acquirer for accounting purposes. Accordingly, the consolidated financial statement data presented are those of the Jin Ma Companies for all periods prior to the Company’s acquisition of Gold Horse Nevada on June 29, 2007, and the financial statements of the consolidated companies from the acquisition date forward.
PRC law currently places certain limitations on foreign ownership of Chinese companies. To comply with these foreign ownership restrictions, the Company, through its wholly-owned subsidiary, Global Rise, operates its business in China through the Jin Ma Companies, each of which is a limited liability company headquartered in Hohhot, the capital city of the Autonomous Region of Inner Mongolia in China, and organized under PRC laws. Each of the Jin Ma Companies has the relevant licenses and approvals necessary to operate its business in China and none of them is exposed to liabilities incurred by the other party. Global Rise has Contractual Arrangements with each of the Jin Ma Companies and their shareholders (collectively, the “Jin Ma Companies Shareholders”) pursuant to which Global Rise provides business consulting and other general business operation services to the Jin Ma Companies. Through these Contractual Arrangements, Global Rise also has the ability to control the daily operations and financial affairs of the Jin Ma Companies, appoint each of their senior executives and approve all matters requiring shareholder approval. As a result of these Contractual Arrangements, which enable Global Rise to control the Jin Ma Companies, the Company is considered the primary beneficiary of the Jin Ma Companies. Accordingly, the Company consolidates the Jin Ma Companies’ results, assets and liabilities in its financial statements.
The Contractual Arrangements are comprised of a series of agreements, including a Consulting Services Agreement and an Operating Agreement, through which Global Rise has the right to advise, consult, manage and operate each of the Jin Ma Companies, and collect and own all of their respective net profits. Additionally, under a Shareholders’ Voting Rights Proxy Agreement, the Jin Ma Companies Shareholders have vested their voting control over the Jin Ma Companies to Global Rise. In order to further reinforce the Company’s rights to control and operate the Jin Ma Companies, these companies and their shareholders have granted Global Rise, under an Option Agreement, the exclusive right and option to acquire all of their equity interests in the Jin Ma Companies or, alternatively, all of the assets of the Jin Ma Companies. Further the Jin Ma Companies Shareholders have pledged all of their rights, titles and interests in the Jin Ma Companies to Global Rise under an Equity Pledge Agreement.
Gold Horse Nevada entered into the Contractual Arrangements with each of the Jin Ma Companies and their respective shareholders on August 31, 2006. On June 29, 2007, concurrently with the closing of the Share Exchange Transaction, the Contractual Arrangements were amended and restated by and among Gold Horse Nevada and Global Rise, the Company’s wholly-owned subsidiary, and the Company on the one hand, and each of the Jin Ma Companies and their respective shareholders on the other hand, pursuant to which the Company was made a party to the Contractual Arrangements.
Inner Mongolia Jin Ma Construction Company Ltd.
Jin Ma Construction is an engineering and construction company that offers general contracting, construction management and building design services primarily in Hohhot City, the Autonomous Region of Inner Mongolia in China. In operation since 1980, Jin Ma Construction was formally registered as a limited liability company in Hohhot City in March 2002.
Inner Mongolia Jin Ma Real Estate Development Co. Ltd.
Jin Ma Real Estate, established in 1999, was formally registered as a limited liability company in Hohhot City in February 2004. Jin Ma Real Estate develops residential and commercial properties in the competitive and growing real estate market in Hohhot.
Inner Mongolia Jin Ma Hotel Co. Ltd.
Jin Ma Hotel was founded in 1999 and formally registered in April 2004 as a limited liability company in Hohhot City. Jin Ma Hotel presently owns, operates and manages the Inner Mongolia Jin Ma Hotel (the “Hotel”), a 22-room full service hotel with a restaurant and banquet facilities situated in Hohhot City approximately 15 kilometers from the Hohhot Baita Airport.
8
GOLD HORSE INTERNATIONAL, INC. AND SUBSIDIARIES
NOTES TO UNAUDITED CONDENSED CONSOLIDATED FINANCIAL STATEMENTS
December 31, 2010
NOTE 1 – ORGANIZATION AND SUMMARY OF SIGNIFICANT ACCOUNTING POLICIES (continued)
Inner Mongolia (Cayman) Technology & Development Ltd.
IMTD, a wholly foreign owned enterprise incorporated in PRC, provides administrative support services to the Jin Ma Companies.
Principle of consolidation
These condensed consolidated financial statements include the financial statements of Gold Horse, its subsidiaries and variable interest entities. All significant inter-company balances or transactions have been eliminated on consolidation.
Basis of preparation
These interim condensed consolidated financial statements are unaudited. In the opinion of management, all adjustments and disclosures necessary for a fair presentation of these interim condensed consolidated financial statements have been included. The results reported in the condensed consolidated financial statements for any interim periods are not necessarily indicative of the results that may be reported for the entire year. The (a) condensed consolidated balance sheet as of June 30, 2010, which was derived from audited financial statements, and (b) the unaudited interim condensed consolidated financial statements have been prepared pursuant to the rules and regulations of the Securities and Exchange Commission. Certain information and note disclosures normally included in annual financial statements prepared in accordance with accounting principles generally accepted in the United States have been condensed or omitted pursuant to those rules and regulations, although the Company believes that the disclosures made are adequate to make the information not misleading. These unaudited condensed consolidated financial statements should be read in conjunction with the consolidated financial statements and accompanying footnotes of the Company for the year ended June 30, 2010.
Financial instruments
The accounting standard governing financial instruments adopted by the Company on July 1, 2009, defines financial instruments and requires fair value disclosures about those instruments. It defines fair value, establishes a three-level valuation hierarchy for disclosures of fair value measurement and enhances disclosure requirements for fair value measures. Cash, investments, receivables, payables, short term loans and convertible debt all qualify as financial instruments. Management concluded cash, receivables, payables and short term loans approximate their fair values because of the short period of time between the origination of such instruments and their expected realization and, if applicable, their stated rates of interest are equivalent to rates currently available.
The three levels of valuation hierarchy are defined as follows:
| • | Level 1 inputs to the valuation methodology are quoted prices (unadjusted) for identical assets or liabilities in active markets. |
|
|
|
| • | Level 2 inputs to the valuation methodology include quoted prices for similar assets and liabilities in active markets, and inputs that are observable for the asset or liability, either directly or indirectly, for substantially the full term of the financial instrument. |
|
|
|
| • | Level 3 inputs to the valuation methodology are unobservable and significant to the fair value measurement. |
The Company analyzes all financial instruments with features of both liabilities and equity under the FASB’s accounting standard for such instruments. Under this standard, financial assets and liabilities are classified in their entirety based on the lowest level of input that is significant to the fair value measurement. Depending on the product and the terms of the transaction, the fair value of notes payable and derivative liabilities were modeled using a series of techniques, including closed-form analytic formula, such as the Black-Scholes option-pricing model.
9
GOLD HORSE INTERNATIONAL, INC. AND SUBSIDIARIES
NOTES TO UNAUDITED CONDENSED CONSOLIDATED FINANCIAL STATEMENTS
December 31, 2010
NOTE 1 – ORGANIZATION AND SUMMARY OF SIGNIFICANT ACCOUNTING POLICIES (continued)
The following table presents a reconciliation of the derivative liability measured at fair value on a recurring basis using significant unobservable input (Level 3) for the six months ended December 31, 2010:
| Warrant liability |
| |
Balance at June 30, 2010 | $ | 653,630 |
|
Exercise of warrants |
| — |
|
Change in fair value included in earnings |
| (157,092 | ) |
Balance at December 31, 2010 | $ | 496,538 |
|
The Company did not identify any other non-recurring assets and liabilities that are required to be presented on the consolidated balance sheets at fair value in accordance with the relevant accounting standards.
See Note 10 for more information on these financial instruments.
Concentrations of credit risk
The Company’s operations through the Jin Ma Companies are carried out in the PRC. Accordingly, the Company’s business, financial condition and results of operations may be influenced by the political, economic and legal environment in the PRC, and by the general state of the PRC’s economy. The Company’s operations in the PRC are subject to specific considerations and significant risks not typically associated with companies in North America. The Company’s results may be adversely affected by changes in governmental policies with respect to laws and regulations, anti-inflationary measures, currency conversion and remittance abroad, and rates and methods of taxation, among other things.
Financial instruments which potentially subject the Company to concentrations of credit risk consist principally of cash and trade accounts receivable. Substantially all of the Company’s cash is maintained with state-owned banks within the PRC, and no deposits are covered by insurance. The Company has not experienced any losses in such accounts and believes it is not exposed to any risks on its cash in bank accounts. A significant portion of the Company’s sales are credit sales which are primarily to customers whose ability to pay is dependent upon the industry economics prevailing in these areas; however, concentrations of credit risk with respect to trade accounts receivables is limited due to generally short payment terms. The Company also performs ongoing credit evaluations of its customers to help further reduce credit risk.
At December 31, 2010 and June 30, 2010, the Company’s bank deposits by geographic area were as follows:
|
|
|
|
|
|
|
|
|
|
|
|
| December 31, 2010 |
| June 30, 2010 | ||||||
|
| (Unaudited) |
|
| ||||||
Country: |
|
|
|
|
|
|
|
|
|
|
United States |
| $ | 945 |
| 0.2% |
| $ | 1,043 |
| 0.3% |
China |
|
| 593,404 |
| 99.8% |
|
| 308,953 |
| 99.7% |
Total cash and cash equivalents |
| $ | 594,349 |
| 100.0% |
| $ | 309,996 |
| 100.0% |
Accounts receivable, notes receivable and other receivables
The Company has a policy of reserving for uncollectible accounts based on its best estimate of the amount of probable credit losses in its existing receivables. The Company periodically reviews its receivables to determine whether an allowance is necessary based on an analysis of past due accounts and other factors that may indicate that the realization of an account may be in doubt. Account balances deemed to be uncollectible are charged to the allowance after all means of collection have been exhausted and the potential for recovery is considered remote. At December 31, 2010 and June 30, 2010, the Company has established, based on a review of its outstanding accounts receivable balances, an allowance for doubtful accounts in the amount of $816,341 and $978,455, respectively, on its total accounts receivable. Management believes that the notes receivable are fully collectable. Therefore, no allowance for doubtful accounts is deemed to be required at December 31, 2010 and June 30, 2010.
10
GOLD HORSE INTERNATIONAL, INC. AND SUBSIDIARIES
NOTES TO UNAUDITED CONDENSED CONSOLIDATED FINANCIAL STATEMENTS
December 31, 2010
NOTE 1 – ORGANIZATION AND SUMMARY OF SIGNIFICANT ACCOUNTING POLICIES (continued)
Other receivables are primarily related to advances made to various vendors and other parties in the normal course of business and an allowance was established when those parties are deemed to be unlikely to repay the amounts. At December 31, 2010 and June 30, 2010, the Company has established, based on a review of its outstanding other receivable balances, an allowance for doubtful accounts in the amount of $63,547 and $69,171, respectively. At such time as management exhausts all collection efforts, the other receivable balance will be netted against the allowance account. The activities in the allowance for doubtful accounts for accounts receivable and other receivables for the six months ended December 31, 2010 were as follows:
|
| Allowance for |
| Allowance for |
| Total |
| |||
Balance – June 30, 2010 |
| $ | 978,455 |
| $ | 69,171 |
| $ | 1,047,626 |
|
Reduction in allowance |
|
| (191,238 | ) |
| (7,683 | ) |
| (198,921 | ) |
Foreign currency translation adjustments |
|
| 29,124 |
|
| 2,059 |
|
| 31,183 |
|
|
|
|
|
|
|
|
|
|
|
|
Balance – December 31, 2010 (Unaudited) |
| $ | 816,341 |
| $ | 63,547 |
| $ | 879,888 |
|
Net income per common share
The following table presents a reconciliation of basic and diluted net income per common share:
|
| Three Months Ended |
| Six Months Ended |
| ||||||||
|
| 2010 |
| 2009 |
| 2010 |
| 2009 |
| ||||
Net income used for basic and diluted net income per common share |
| $ | 1,895,830 |
| $ | 1,882,480 |
| $ | 2,810,095 |
| $ | 2,721,270 |
|
Weighted average common shares outstanding - basic |
|
| 1,947,992 |
|
| 1,544,003 |
|
| 1,941,476 |
|
| 1,447,276 |
|
Effect of dilutive securities: |
|
|
|
|
|
|
|
|
|
|
|
|
|
Unexercised warrants |
|
| 33,704 |
|
| — |
|
| 31,135 |
|
| 22,182 |
|
Convertible debentures |
|
| — |
|
| — |
|
| — |
|
| — |
|
Weighted average common shares outstanding - diluted |
|
| 1,981,696 |
|
| 1,544,003 |
|
| 1,972,611 |
|
| 1,469,458 |
|
Net income per common share - basic |
| $ | 0.97 |
| $ | 1.22 |
| $ | 1.45 |
| $ | 1.88 |
|
Net income per common share - diluted |
| $ | 0.96 |
| $ | 1.22 |
| $ | 1.42 |
| $ | 1.85 |
|
For the three and six months ended December 31, 2009, the effect of interest expense and amortization of debt discount on net income used for diluted net income per common share and the effect on the number of weighted average common shares outstanding were deemed anti-dilutive.
The Company's aggregate common stock equivalents at December 31, 2010 and June 30, 2010 include the following:
|
| December 31, 2010 (Unaudited) |
| June 30, 2010 |
Warrants | $ | 204,945 | $ | 196,195 |
Total | $ | 204,945 | $ | 196,195 |
11
GOLD HORSE INTERNATIONAL, INC. AND SUBSIDIARIES
NOTES TO UNAUDITED CONDENSED CONSOLIDATED FINANCIAL STATEMENTS
December 31, 2010
NOTE 1 – ORGANIZATION AND SUMMARY OF SIGNIFICANT ACCOUNTING POLICIES (continued)
Foreign currency translation and comprehensive income
The reporting currency of the Company is the U.S. dollar. The functional currency of the parent company is the U.S. dollar and the functional currency of the Company’s operating subsidiaries and variable interest entities is the RMB. For the subsidiaries and variable interest entities whose functional currencies are the RMB, results of operations and cash flows are translated at average exchange rates during the period, assets and liabilities are translated at the unified exchange rate at the end of the period, and equity is translated at historical exchange rates. Translation adjustments resulting from the process of translating the local currency financial statements into U.S. dollars are included in determining comprehensive income. Transaction gains and losses that arise from exchange rate fluctuations on transactions denominated in a currency other than the functional currency are included in the results of operations as incurred. All of the Company’s revenue transactions are transacted in the functional currency. The Company does not enter any material transactions in foreign currencies and accordingly, transaction gains or losses have not had, and are not expected to have, a material effect on the results of operations of the Company. Asset and liability accounts at December 31, 2010 and June 30, 2010 were translated at 6.6118 RMB to $1.00 USD and at 6.8086 RMB to $1.00 USD, respectively. Equity accounts were stated at their historical rate. The average translation rates applied to income statements for the six months ended December 31, 2010 and 2009 were 6.72367 RMB and 6.83857 RMB to $1.00 USD, respectively. In accordance with ASC Topic 230, cash flows from the Company’s operations are calculated based upon the local currencies using the average translation rate. As a result, amounts related to assets and liabilities reported on the statement of cash flows will not necessarily agree with changes in the corresponding balances on the balance sheets.
Advertising
Advertising is expensed as incurred. Advertising expenses for the six months ended December 31, 2010 and 2009 were deemed not material.
Recent accounting pronouncements
In July 2010, the FASB issued ASU 2010-20, “Receivables (Topic 310): Disclosures about the Credit Quality of Financing Receivables and the Allowance for Credit Losses”. This ASU amends Topic 310 to improve the disclosures that an entity provides about the credit quality of its financing receivables and the related allowance for credit losses. As a result of these amendments, an entity is required to disaggregate by portfolio segment or class certain existing disclosures and provide certain new disclosures about its financing receivables and related allowance for credit losses. For public entities, the disclosures as of the end of a reporting period are effective for interim and annual reporting periods ending on or after December 15, 2010. The disclosures about activity that occurs during a reporting period are effective for interim and annual reporting periods beginning on or after December 15, 2010. Except for the expanded disclosure requirements, the adoption of this ASU did not have a material impact on the Company’s consolidated financial statements.
Other accounting standards that have been issued or proposed by the FASB or other standards-setting bodies that do not require adoption until a future date are not expected to have a material impact on the Company’s consolidated financial statements upon adoption.
NOTE 2 – NOTES RECEIVABLE, NET
Notes receivable, which was attributable to the leasing of the Vocational School and Chemistry School pursuant to a sales-type capital lease, is accounted for using the installment method of accounting as well as original note value. In accordance with ASC Topic 360, a gain was deferred on notes not meeting the minimum initial 20% investment by the buyer expressed as a percentage of the sales value. Management believes that the notes receivable are fully collectable. Therefore, no allowance for doubtful accounts is deemed to be required. At December 31, 2010 and June 30, 2010, notes receivable, net consisted of the following:
12
GOLD HORSE INTERNATIONAL, INC. AND SUBSIDIARIES
NOTES TO UNAUDITED CONDENSED CONSOLIDATED FINANCIAL STATEMENTS
December 31, 2010
NOTE 2 – NOTES RECEIVABLE, NET (continued)
|
| December 31, 2010 |
| June 30, 2010 |
| ||
Due in 12-month periods ending December 31 and June 30, respectively, |
|
|
|
|
|
|
|
2011 |
| $ | 4,222,718 |
| $ | 2,861,153 |
|
2012 |
|
| 2,332,194 |
|
| 2,264,783 |
|
2013 |
|
| 2,332,194 |
|
| 2,264,783 |
|
2014 |
|
| 1,545,721 |
|
| 2,264,783 |
|
2015 |
|
| 1,545,721 |
|
| 1,501,043 |
|
Thereafter |
|
| 23,724,251 |
|
| 24,539,553 |
|
Notes receivable – gross |
|
| 35,702,799 |
|
| 35,696,098 |
|
Less: discount on notes receivable |
|
| (14,587,223 | ) |
| (14,808,215 | ) |
Less: deferred gain on sale |
|
| (3,929,494 | ) |
| (3,884,231 | ) |
|
|
| 17,186,082 |
|
| 17,003,652 |
|
Notes receivable – current portion, net |
|
| (1,696,005 | ) |
| (1,150,333 | ) |
Notes receivable – long-term, net |
| $ | 15,490,077 |
| $ | 15,853,319 |
|
NOTE 3 – INVENTORIES
At December 31, 2010 and June 30, 2010, inventories consisted of the following:
| December 31, 2010 (Unaudited) |
| June 30, 2010 | ||
|
|
|
| ||
Consumable goods | $ | 61,718 |
| $ | 64,007 |
|
|
|
|
|
|
| $ | 61,718 |
| $ | 64,007 |
NOTE 4 – COSTS AND ESTIMATED EARNINGS IN EXCESS OF BILLINGS
Costs and estimated earnings in excess of billings at December 31, 2010 and June 30, 2010 consisted of:
| December 31, 2010 (Unaudited) |
| June 30, 2010 |
| ||
Costs incurred on uncompleted contracts | $ | 32,701,987 |
| $ | 23,231,942 |
|
Estimated earnings |
| 7,490,284 |
|
| 5,325,326 |
|
|
| 40,192,271 |
|
| 28,557,268 |
|
Less: billings to date |
| (40,139,750 | ) |
| (28,553,594 | ) |
| $ | 52,521 |
| $ | 3,674 |
|
Amounts are included in the accompanying consolidated balance sheets under the following captions:
|
|
| December 31, 2010 (Unaudited) |
|
| June 30, 2010 |
|
Costs and estimated earnings in excess of billings |
| $ | 53,251 |
| $ | 93,879 |
|
Billings in excess of costs and estimated earnings |
|
| (730 | ) |
| (90,205 | ) |
|
|
|
|
|
|
|
|
|
| $ | 52,521 |
| $ | 3,674 |
|
13
GOLD HORSE INTERNATIONAL, INC. AND SUBSIDIARIES
NOTES TO UNAUDITED CONDENSED CONSOLIDATED FINANCIAL STATEMENTS
December 31, 2010
NOTE 5 – PROPERTY AND EQUIPMENT
At December 31, 2010 and June 30, 2010, property and equipment consist of the following:
| Useful Life |
| December 31, 2010 (Unaudited) |
| June 30, 2010 |
| ||
|
|
|
|
|
|
|
|
|
Office equipment | 5 – 8 Years |
| $ | 598,325 |
| $ | 580,827 |
|
Machinery and equipment | 5 – 15 Years |
|
| 7,395,067 |
|
| 7,181,316 |
|
Vehicles | 10 Years |
|
| 535,865 |
|
| 480,057 |
|
Building and building improvements | 20 – 40 Years |
|
| 4,022,421 |
|
| 3,906,155 |
|
|
|
|
| 12,551,678 |
|
| 12,148,355 |
|
Less: accumulated depreciation |
|
|
| (3,921,450 | ) |
| (3,420,559 | ) |
|
|
| $ | 8,630,228 |
| $ | 8,727,796 |
|
Depreciation of property and equipment is provided using the straight-line method. For the six months ended December 31, 2010 and 2009, depreciation expense amounted to $392,437 and $385,121, respectively.
NOTE 6 – CONSTRUCTION IN PROGRESS
At December 31, 2010 and June 30, 2010, construction in progress consists of the following:
| December 31, 2010 |
| June 30, 2010 |
| ||
Prepaid land use rights and buildings built for Procuratorate Housing Estates | $ | 912,034 |
| $ | 885,672 |
|
Prepaid land use rights and buildings built for Shuian Renjia project |
| 14,246,384 |
|
| — |
|
Prepaid land use rights for Wusutu Village land – JinWu project |
| 2,500,501 |
|
| 2,428,224 |
|
Prepaid land use rights for Fu Xing Ying land – Beiyuan project |
| 9,830,908 |
|
| 9,546,750 |
|
Total construction in progress |
| 27,489,827 |
|
| 12,860,646 |
|
Less: current portion |
| (14,246,384 | ) |
| — |
|
Long term construction in progress | $ | 13,243,443 |
| $ | 12,860,646 |
|
NOTE 7 – ACCRUED EXPENSES
At December 31, 2010 and June 30, 2010, accrued expenses consist of the following:
|
| December 31, 2010 (Unaudited) |
| June 30, 2010 | ||
Accrued interest payable |
| $ | 274,119 |
| $ | 234,214 |
Accrued payroll and employees benefit |
|
| 97,195 |
|
| 152,332 |
Refundable construction performance deposit |
|
| 378,112 |
|
| 440,619 |
Other |
|
| 5,819 |
|
| 5,432 |
|
| $ | 755,245 |
| $ | 832,597 |
14
GOLD HORSE INTERNATIONAL, INC. AND SUBSIDIARIES
NOTES TO UNAUDITED CONDENSED CONSOLIDATED FINANCIAL STATEMENTS
December 31, 2010
NOTE 8 – LOANS PAYABLE
Loans payable consisted of the following at December 31, 2010 and June 30, 2010:
|
| December 31, 2010 |
| June 30, 2010 |
| ||
Loans from various credit unions, due on May 10, 2011 with annual |
| $ | 2,994,646 |
| $ | 2,908,087 |
|
|
|
|
|
|
|
|
|
Loans from various unrelated parties, due in September 2010 with |
|
| — |
|
| 36,718 |
|
|
|
|
|
|
|
|
|
Loans from various unrelated parties, due in April 2012 with annual |
|
| 196,618 |
|
| 190,936 |
|
|
|
|
|
|
|
|
|
Loans from various unrelated parties, due in August 2011 with annual |
|
| 37,811 |
|
| 36,718 |
|
|
|
|
|
|
|
|
|
Loans from various unrelated parties, due in September 2012 with |
|
| 120,996 |
|
| 117,498 |
|
|
|
|
|
|
|
|
|
Loan from one unrelated individual, due in March 2011 with annual |
|
| 151,245 |
|
| 146,873 |
|
Total loans payable |
|
| 3,501,316 |
|
| 3,436,830 |
|
Less: current portion |
|
| (3,183,702 | ) |
| (3,091,678 | ) |
Long term liability |
| $ | 317,614 |
| $ | 345,152 |
|
For the six months ended December 31, 2010 and 2009, interest expense related to these loans amounted to $252,006 and $339,937, respectively. At December 31, 2010, future maturities of debt are as follows:
2011 (current liability) | $ | 3,183,702 |
2012 | $ | 317,614 |
NOTE 9 – RELATED PARTY TRANSACTIONS
Due to related parties
From time to time, companies related through common ownership advanced funds to the Company for working capital purposes. These advances are non interest bearing, unsecured and payable on demand. At December 31, 2010 and June 30, 2010, due to related parties consisted of the following:
Name |
| Relationship |
| December 31, 2010 |
| June 30, 2010 | ||
Inner Mongolia Jin Ma Group Ltd and its subsidiaries |
| Owned by Yang Liankuan |
| $ | 506,723 |
| $ | 230,453 |
Other
During the six months ended December 31, 2010 and 2009, the Company paid rent of $25,992 and $25,555 to Inner Mongolia Jin Ma Group Ltd., respectively.
15
GOLD HORSE INTERNATIONAL, INC. AND SUBSIDIARIES
NOTES TO UNAUDITED CONDENSED CONSOLIDATED FINANCIAL STATEMENTS
December 31, 2010
NOTE 10 – CONVERTIBLE DEBT AND DERIVATIVE LIABILITIES
Under the terms of a Securities Purchase Agreement, on the closing date which occurred on November 30, 2007, the Company issued $2,183,000 principal amount 10% Secured Convertible Debentures to the purchasers together with the common stock purchase warrants to purchase an aggregate of 238,009 shares of the Company’s common stock. The Company paid Next Generation Equity Research, LLC (“Next”), a broker dealer and member of FINRA, a commission of $174,640 and issued Next common stock purchase warrants to purchase an aggregate of 12,692 shares of the Company’s common stock at $20.00 per share. Additionally, the Company reimbursed one of the investors $30,000 to defer its legal fees in connection with the financing. The Company used the balance of the proceeds for general working capital.
The debentures, aggregating $2,183,000, which prior to March 31, 2009 accrued interest at 10% per annum, were originally due on March 31, 2009. The Company failed to repay the debentures on the due date. During May 2009, the Company entered into negotiations with the debenture holders to restructure the payment terms and reached an understanding, subject to the execution of definitive documents, to extend the due date of the debentures and cure the default. On May 18, 2009, the Company and the debenture holders signed a Debenture and Warrant Amendment Agreement (the “Amendment Agreement”) and an Amended and Restated 14% Secured Convertible Debenture (the “Exchanged Debentures”). The Jin Ma Companies, however, had been unable to consummate this restructure due to delays caused by China’s State Administration of Foreign Exchange (“SAFE”), the agency that the Jin Ma Companies must get approval from to wire the funds to the debenture holders. On June 30, 2009, the Company and the debenture holders executed an Amendment to the Amendment Agreement effectively consummating the Amendment Agreement and issuing the Exchanged Debentures thereby ceasing any written or non-written declarations of an event of default under its Securities Purchase Agreement and the related 10% secured convertible debentures and any process to foreclose upon the pledged shares in accordance with the terms of the pledge agreement executed in connection Securities Purchase Agreement. The exercise price per share of common stock for the original 250,701 warrants issued pursuant to the Securities Purchase Agreement was lowered from $20.00 to $4.00.
On May 14, 2010, the Company entered into a further Debenture and Warrant Amendment Agreement with the remaining debenture holders which:
| • | waived all existing defaults under the June 2009 Amendment and the debentures, |
|
|
|
| • | reduced the conversion price of the 14% secured convertible debentures and the exercise price of 238,009 warrants to $3.20 per share, |
|
|
|
| • | converted all remaining principal amount of $409,667, all accrued interest due under the 14% secured convertible debentures of $48,074 together with the penalties owed the debenture holders of $168,333 into 195,648 shares of our common stock, |
|
|
|
| • | contained an agreement by the debenture holder that individually they would not sell any shares of our common stock acquired upon the conversion of the 14% debentures or the exercise of the warrants in an amount which was more than 7% of the daily trading volume of our common stock on any given day for a one year period, |
|
|
|
| • | The Company agreed not to issue shares of Common Stock at a price, or options, warrants or convertible securities with an exercise or conversion price that is less than the conversion price of the then outstanding convertible debt or the exercise price of the then outstanding warrants, as the case may be, with the intent of eliminating the provisions for a reduction in the exercise price of the warrants in the event that the Company issues stock at a price which is less than the exercise price of the warrants. |
During the year ended June 30, 2010, Company repaid all of its convertible debt by issuing 325,467 shares of its common stock for the principal balance of $1,199,450 and repaid the remaining principal balance of $983,550 using cash.
In accordance with the FASB authoritative guidance, the conversion feature of the convertible debt was separated from the host contract and recognized as a derivative instrument. Both the conversion feature of the debt and the related warrants have been characterized as derivative liabilities to be re-measured at the end of every reporting period with the change in value reported in the consolidated statement of income. The common stock purchase warrants do not trade in an active securities market, and as such, the Company estimates the fair value of the warrants as of December 31, 2010 and June 30, 2010 using a probability-weighted Black-Scholes-Merton option-pricing model using the following assumptions:
16
GOLD HORSE INTERNATIONAL, INC. AND SUBSIDIARIES
NOTES TO UNAUDITED CONDENSED CONSOLIDATED FINANCIAL STATEMENTS
December 31, 2010
NOTE 10 – CONVERTIBLE DEBT AND DERIVATIVE LIABILITIES (continued)
|
| December 31, 2010 |
| June 30, 2010 |
Warrants: |
|
|
|
|
Risk-free interest rate |
| 0.61% |
| 1.00% |
Expected volatility |
| 153.66% |
| 179.74% |
Expected life (in years) |
| 1.92 years |
| 2.42 years |
Expected dividend yield |
| — |
| — |
|
|
|
|
|
Fair Value: | $ | 496,538 | $ | 653,630 |
Expected volatility is based primarily on historical volatility. Historical volatility was computed using weekly pricing observations for recent periods that correspond to the term of the warrants. The Company’s management believes this method produces an estimate that is representative of the expectations of future volatility over the expected term of these warrants. The Company has no reason to believe future volatility over the expected remaining life of these warrants will likely differ materially from historical volatility. The expected life is based on the remaining term of the warrants. The risk-free interest rate is based on U.S. Treasury securities according to the remaining term of the financial instruments.
As of December 31, 2010 and June 30, 2010, the outstanding numbers of warrant related to the convertible debentures were 196,195. At December 31, 2010 and June 30, 2010, the Company recorded a derivative liability of $496,538 and $653,630, respectively, related to the warrants. When the debentures converted or repaid, the derivative liability was extinguished and a gain on extinguishment of the derivative was recorded. For the six months ended December 31, 2010 and 2009, gains from the change in fair value of derivative liabilities were $157,092 and $2,002,937, respectively. For the six months ended December 31, 2010 and 2009, gains from the extinguishment of derivative liabilities were $0 and $1,623,209, respectively.
NOTE 11 – INCOME TAXES
The Company accounts for income taxes under ASC Topic 740. ASC Topic 740 requires the recognition of deferred tax assets and liabilities for both the expected impact of differences between the financial statements and the tax basis of assets and liabilities, and for the expected future tax benefit to be derived from tax losses and tax credit carryforwards. ASC Topic 740 additionally requires the establishment of a valuation allowance to reflect the likelihood of realization of deferred tax assets. Realization of deferred tax assets, including those related to the U.S. net operating loss carryforwards, are dependent upon future earnings, if any, of which the timing and amount are uncertain. Accordingly, the net deferred tax asset related to the U.S. net operating loss carryforward has been fully offset by a valuation allowance. The Company is governed by the Income Tax Law of the PRC and the United States.
The operations of the Company are in China and are governed by the Income Tax Law of the People's Republic of China and local income tax laws (the "PRC Income Tax Law"). The Company is subject to income tax at a rate of 25%.
At December 31, 2010 and June 30, 2010, taxes payable are as follows:
|
| December 31, 2010 |
| June 30, 2010 |
Income taxes payable | $ | 491,965 | $ | 610,173 |
Other taxes payable: |
|
|
|
|
- land appreciation tax |
| 1,123,012 |
| 1,273,698 |
- business tax |
| 217,682 |
| 395,426 |
- others |
| 103,834 |
| 94,762 |
Total | $ | 1,936,493 | $ | 2,374,059 |
17
GOLD HORSE INTERNATIONAL, INC. AND SUBSIDIARIES
NOTES TO UNAUDITED CONDENSED CONSOLIDATED FINANCIAL STATEMENTS
December 31, 2010
NOTE 12 – STOCKHOLDERS’ EQUITY
Common stock
On December 10, 2010, the Company issued an aggregate of 50,000 shares of its common stock to its chief executive officer and its chief financial officer for services rendered by them. The shares were valued at $3.45 per share based on the fair value on the date of grant. In connection with the issuance of these shares, the Company recorded compensation expenses of $115,000 and reduced accrued expenses of $57,500.
On December 10, 2010, the Company issued 3,750 shares of its common stock to its five directors for services rendered by them. The shares were valued at $3.45 per share based on the fair value on the date of grant. In connection with the issuance of these shares, the Company reduced accrued expenses of $12,938.
On December 10, 2010, the Company issued 750 shares of its common stock to a director for services rendered and to be rendered by him. The shares were valued at $3.45 per share based on the fair value on the date of grant. In connection with the issuance of these shares, the Company recorded compensation expenses of $1,094, reduced accrued expenses of $250 and recorded prepaid expenses of $1,244 which will be amortized over the remaining service period.
Warrants
On August 18, 2010, the Company entered into a six-month consulting agreement with Rodman & Renshaw, LLC (“Rodman”) for financial advisor services. In connection with the consulting agreement, the Company issued to Rodman warrants to purchase 8,750 shares on the Company’s common stock at a price per share of $6.00. The warrants are exercisable at any time in whole or in part during the four year period commencing one year from the date of this agreement. The Company valued these warrants utilizing the Black-Scholes options pricing model using the following assumptions at approximately $3.56 per warrant or $31,188 in total and recorded as stock-based professional fees.
Warrants: |
| At grant date |
Risk-free interest rate |
| 0.18% |
Expected volatility |
| 175.4% |
Expected life (in years) |
| 5 years |
Expected dividend yield |
| — |
Fair Value: |
| $ 31,188 |
Warrant activities for the six months ended December 31, 2010 was summarized as follows:
| Number of |
| Weighted Average | |
Balance at June 30, 2010 | 196,195 |
| $ | 3.25 |
Granted | 8,750 |
|
| 6.00 |
Exercised | — |
|
| — |
Forfeited | — |
|
| — |
Balance at December 31, 2010 (Unaudited) | 204,945 |
| $ | 3.37 |
|
|
|
|
|
Warrants exercisable at December 31, 2010 | 196,195 |
| $ | 3.25 |
18
GOLD HORSE INTERNATIONAL, INC. AND SUBSIDIARIES
NOTES TO UNAUDITED CONDENSED CONSOLIDATED FINANCIAL STATEMENTS
December 31, 2010
NOTE 12 – STOCKHOLDERS’ EQUITY (CONTINUED)
The following table summarizes the Company's stock warrants outstanding at December 31, 2010:
Warrants Outstanding |
| Warrants Exercisable | |||||||||||
Range of |
| Number |
| Weighted Average |
| Aggregate |
| Weighted Average |
| Number |
| Weighted Average | |
$ 3.20 |
| 183,503 |
| $ 3.20 |
| $ | 20,185 |
| 1.92 Years |
| 183,503 |
| $ 3.20 |
$ 4.00 |
| 12,692 |
| $ 4.00 |
| $ | — |
| 1.92 Years |
| 12,692 |
| $ 4.00 |
$ 6.00 |
| 8,750 |
| $ 6.00 |
| $ | — |
| 4.63 Years |
| — |
| $ — |
Total |
| 204,945 |
| $ 3.37 |
| $ | 20,185 |
| 1.88 Years |
| 196,195 |
| $ 3.22 |
(1) | The intrinsic value of warrants at December 31, 2010 is the amount by which the market value of the Company’s common stock of $3.31 as of December 31, 2010 exceeds the exercise price of the warrants. |
NOTE 13 – SEGMENT INFORMATION
ASC Topic 280 requires use of the “management approach” model for segment reporting. The management approach model is based on the way a company’s management organizes segments within the company for making operating decisions and assessing performance. Reportable segments are based on products and services, geography, legal structure, management structure, or any other manner in which management disaggregates a company. During the six months ended December 31, 2010 and 2009, the Company operated in three reportable business segments - (1) the Construction segment (2) Hotel segment and (3) Real estate development segment. The Company's reportable segments are strategic business units that offer different products. The Company's reportable segments, although integral to the success of the others, offer distinctly different products and services and require different types of management focus. As such, these segments are managed separately.
Condensed information with respect to these reportable business segments for the three and six months ended December 31, 2010 and 2009 is as follows:
|
| For the three months ended December 31, |
| For the six months ended December 31, |
| ||||||||
|
| 2010 |
| 2009 |
| 2010 |
| 2009 |
| ||||
Revenues: |
|
|
|
|
|
|
|
|
|
|
|
|
|
Construction |
| $ | 15,400,661 |
| $ | 4,405,892 |
| $ | 24,991,149 |
| $ | 9,596,012 |
|
Real Estate |
|
| 302,400 |
|
| 158,981 |
|
| 713,369 |
|
| 158,981 |
|
Hotel |
|
| 724,213 |
|
| 734,809 |
|
| 1,565,475 |
|
| 1,512,829 |
|
|
|
| 16,427,274 |
|
| 5,299,682 |
|
| 27,269,993 |
|
| 11,267,822 |
|
Depreciation: |
|
|
|
|
|
|
|
|
|
|
|
|
|
Construction |
|
| 116,507 |
|
| 112,937 |
|
| 230,870 |
|
| 227,990 |
|
Real Estate |
|
| 11,095 |
|
| 10,029 |
|
| 22,007 |
|
| 20,051 |
|
Hotel |
|
| 70,363 |
|
| 68,566 |
|
| 139,560 |
|
| 137,080 |
|
|
|
| 197,965 |
|
| 191,532 |
|
| 392,437 |
|
| 385,121 |
|
Interest expense: |
|
|
|
|
|
|
|
|
|
|
|
|
|
Construction |
|
| 125,960 |
|
| 167,740 |
|
| 252,006 |
|
| 339,937 |
|
Other |
|
| — |
|
| 577,955 |
|
| — |
|
| 1,977,139 |
|
|
|
| 125,960 |
|
| 745,695 |
|
| 252,006 |
|
| 2,317,076 |
|
Net income (loss): |
|
|
|
|
|
|
|
|
|
|
|
|
|
Construction |
|
| 1,516,549 |
|
| 186,776 |
|
| 2,352,925 |
|
| 789,606 |
|
Real Estate |
|
| 317,091 |
|
| 428,590 |
|
| 482,595 |
|
| 324,800 |
|
Hotel |
|
| 108,021 |
|
| 54,204 |
|
| 216,898 |
|
| 121,200 |
|
Other (a) |
|
| (45,831 | ) |
| 1,212,910 |
|
| (242,323 | ) |
| 1,485,664 |
|
|
| $ | 1,895,830 |
| $ | 1,882,480 |
| $ | 2,810,095 |
| $ | 2,721,270 |
|
19
GOLD HORSE INTERNATIONAL, INC. AND SUBSIDIARIES
NOTES TO UNAUDITED CONDENSED CONSOLIDATED FINANCIAL STATEMENTS
December 31, 2010
NOTE 13 – SEGMENT INFORMATION (CONTINUED)
| December 31, 2010 (Unaudited) |
| June 30, 2010 |
| ||
Identifiable long-lived tangible assets at |
|
|
|
|
|
|
Construction | $ | 6,277,583 |
| $ | 6,283,804 |
|
Real Estate |
| 334,570 |
|
| 346,430 |
|
Hotel |
| 2,018,075 |
|
| 2,097,562 |
|
| $ | 8,630,228 |
| $ | 8,727,796 |
|
| (a) | The Company does not allocate its general and administrative expenses of its U.S. activities and the fair value changes of its derivative liabilities to its reportable segments, because these activities are managed at a corporate level. |
NOTE 14 – STATUTORY RESERVES
The Company is required to make appropriations to reserve funds, comprising the statutory surplus reserve, statutory public welfare fund and discretionary surplus reserve, based on after-tax net income determined in accordance with generally accepted accounting principles of the PRC (“PRC GAAP”). Appropriation to the statutory surplus reserve should be at least 10% of the after tax net income determined in accordance with the PRC GAAP until the reserve is equal to 50% of the entities’ registered capital or members’ equity. Appropriations to the statutory public welfare fund are at a minimum of 5% of the after tax net income determined in accordance with PRC GAAP. Commencing on January 1, 2006, the new PRC regulations waived the requirement for appropriating retained earnings to a welfare fund. In accordance with the Chinese Company Law, the Company allocated 10% of income after taxes to the statutory surplus reserve for the six months ended December 31, 2010. For the six months ended December 31, 2010, statutory reserve activity is as follows:
| Statutory Reserve | |
Balance – June 30, 2010 | $ | 2,470,154 |
Addition to statutory reserves |
| 21,690 |
Balance – December 31, 2010 (Unaudited) | $ | 2,491,844 |
NOTE 15 – MAJOR CUSTOMERS AND VENDORS
The nature of the Company’s construction segment is that at any given time, the Company will have a concentration of significant customer depending upon the number and scope of construction projects. These significant customers may not be the same from period to period depending upon the percentage of completion of the specific projects. For the six months ended December 31, 2010, three construction projects accounted for 91.6% of the Company’s total revenues. For the six months ended December 31, 2009, three construction projects accounted for 78.3% of the Company’s total revenues. Major customers are summarized as follows:
Project Name |
| For the Six Months Ended December 31, 2010 |
| % |
| For the Six Months Ended December 31, 2009 |
| % | ||
Lanyu Garden No. 3 residential apartment project |
| $ | — |
| 0.0 |
| $ | 3,439,335 |
| 30.5 |
Fu Xing Bath Center project |
|
| — |
| 0.0 |
|
| 3,054,560 |
| 27.1 |
Fuhengyuan residential project |
|
| 2,795,513 |
| 10.2 |
|
| — |
| 0.0 |
Tiantixingyuan No. 1 – No. 7 project |
|
| 6,329,129 |
| 23.2 |
|
| — |
| 0.0 |
Jianhe Garden residential project |
| $ | 15,869,011 |
| 58.2 |
| $ | 2,333,235 |
| 20.7 |
At December 31, 2010, the Company had $9,497,565 of accounts receivable due from its major customers. Any disruption in the relationships between the Company’s construction segment and one or more of these customers, or any significant variance in the magnitude or the timing of construction projects from any one of these customers, may result in decreases in our results of operations, liquidity and cash flows.
20
GOLD HORSE INTERNATIONAL, INC. AND SUBSIDIARIES
NOTES TO UNAUDITED CONDENSED CONSOLIDATED FINANCIAL STATEMENTS
December 31, 2010
NOTE 15 – MAJOR CUSTOMERS AND VENDORS (continued)
The Company uses five to seven subcontractors to perform its construction services and to develop its real estate projects. Management is aware of similar subcontractors that are available to perform construction services if required and management has plans to engage their services.
NOTE 16 – RESTRICTED NET ASSETS
Schedule I of Article 5-04 of Regulation S-X requires the condensed financial information of registrant shall be filed when the restricted net assets of consolidated subsidiaries exceed 25 percent of consolidated net assets as of the end of the most recently completed fiscal year. For purposes of the above test, restricted net assets of consolidated subsidiaries shall mean that amount of the registrant's proportionate share of net assets of consolidated subsidiaries (after intercompany eliminations) which as of the end of the most recent fiscal year may not be transferred to the parent company by subsidiaries in the form of loans, advances or cash dividends without the consent of a third party (i.e., lender, regulatory agency, foreign government, etc.).
The parent company financial statements have been prepared in accordance with Rule 12-04, Schedule I of Regulation S-X as the restricted net assets of the subsidiaries of Gold Horse International, Inc. exceed 25% of the consolidated net assets of Gold Horse International, Inc. The ability of our Chinese operating affiliates to pay dividends may be restricted due to the foreign exchange control policies and availability of cash balances of the Chinese operating subsidiaries. Because a significant portion all of our operations and revenues are conducted and generated in China through the Jin Ma Companies, all of our revenues being earned and currency received are denominated in Renminbi (RMB). RMB is subject to the exchange control regulation in China, and, as a result, we may be unable to distribute any dividends outside of China due to PRC exchange control regulations that restrict our ability to convert RMB into US Dollars.
The following condensed parent company financial statements have been prepared using the same accounting principles and policies described in the notes to the consolidated financial statements, with the only exception being that the parent company accounts for its subsidiaries using the equity method. Refer to the consolidated financial statements and notes presented above for additional information and disclosures with respect to these financial statements.
21
GOLD HORSE INTERNATIONAL, INC. AND SUBSIDIARIES
NOTES TO UNAUDITED CONDENSED CONSOLIDATED FINANCIAL STATEMENTS
December 31, 2010
NOTE 16 – RESTRICTED NET ASSETS (continued)
GOLD HORSE INTERNATIONAL, INC.
CONDENSED PARENT COMPANY BALANCE SHEETS
|
| As of December 31, |
| As of June 30, | ||
|
| (Unaudited) |
| (As Restated) | ||
ASSETS |
|
|
|
| ||
Cash and cash equivalents |
| $ | 945 |
| $ | 1,043 |
Prepaid expenses |
|
| 31,243 |
|
| 210,000 |
Total Current Assets |
|
| 32,188 |
|
| 211,043 |
Investments in subsidiaries at equity |
|
| 40,468,349 |
|
| 36,261,257 |
Due from subsidiaries |
|
| 799,638 |
|
| 849,638 |
Total Assets |
| $ | 41,300,175 |
| $ | 37,321,938 |
|
|
|
|
|
|
|
LIABILITIES AND STOCKHOLDERS' EQUITY |
|
|
|
|
|
|
Current liabilities: |
|
|
|
|
|
|
Accounts payable |
| $ | 29,333 |
| $ | 48,916 |
Derivative liabilities |
|
| 496,538 |
|
| 653,630 |
Accrued expenses |
|
| 33,056 |
|
| 62,125 |
Total Current Liabilities |
|
| 558,927 |
|
| 764,671 |
Stockholders' equity: |
|
|
|
|
|
|
Common stock ($0.0001 par value; 300,000,000 shares authorized; |
|
| 199 |
|
| 193 |
Non-controlling interest in variable interest entities |
|
| 6,095,314 |
|
| 6,095,314 |
Additional paid-in capital |
|
| 7,346,784 |
|
| 7,127,577 |
Statutory reserve |
|
| 2,491,844 |
|
| 2,470,154 |
Retained earnings |
|
| 21,001,871 |
|
| 18,213,466 |
Other comprehensive income |
|
| 3,805,236 |
|
| 2,650,563 |
Total Stockholders' Equity |
|
| 40,741,248 |
|
| 36,557,267 |
Total Liabilities and Stockholders' Equity |
| $ | 41,300,175 |
| $ | 37,321,938 |
22
GOLD HORSE INTERNATIONAL, INC. AND SUBSIDIARIES
NOTES TO UNAUDITED CONDENSED CONSOLIDATED FINANCIAL STATEMENTS
December 31, 2010
NOTE 16 – RESTRICTED NET ASSETS (continued)
GOLD HORSE INTERNATIONAL, INC.
CONDENSED PARENT COMPANY STATEMENTS OF OPERATIONS
|
| For the Six Months Ended December 31, |
| ||||
|
| 2010 |
| 2009 |
| ||
|
| (Unaudited) |
| (Unaudited) |
| ||
|
|
|
|
| (As Restated) |
| |
REVENUES |
| $ | — |
| $ | — |
|
OPERATING EXPENSES: |
|
|
|
|
|
|
|
Salaries and employee benefits |
|
| 145,211 |
|
| 140,374 |
|
General and administrative |
|
| 254,204 |
|
| 22,969 |
|
Total Operating Expenses |
|
| 399,415 |
|
| 163,343 |
|
LOSS FROM OPERATIONS |
|
| (399,415 | ) |
| (163,343 | ) |
|
|
|
|
|
|
|
|
OTHER INCOME (EXPENSES): |
|
|
|
|
|
|
|
Gain on extinguishment of derivative liabilities |
|
| — |
|
| 1,623,209 |
|
Gain on change in fair value of derivative liabilities |
|
| 157,092 |
|
| 2,002,937 |
|
Interest expense |
|
| — |
|
| (1,977,139 | ) |
Total Other Income |
|
| 157,092 |
|
| 1,649,007 |
|
GAIN ATTRIBUTABLE TO PARENT ONLY |
|
| (242,323 | ) |
| 1,485,664 |
|
EQUITY INCOME EARNINGS OF SUBSIDIARIES |
|
| 3,052,418 |
|
| 1,235,606 |
|
|
|
|
|
|
|
|
|
NET INCOME |
| $ | 2,810,095 |
| $ | 2,721,270 |
|
23
GOLD HORSE INTERNATIONAL, INC. AND SUBSIDIARIES
NOTES TO UNAUDITED CONDENSED CONSOLIDATED FINANCIAL STATEMENTS
December 31, 2010
NOTE 16 – RESTRICTED NET ASSETS (continued)
GOLD HORSE INTERNATIONAL, INC.
CONDENSED PARENT COMPANY STATEMENTS OF CASH FLOWS
|
| For the Six Months Ended December 31, |
| ||||
|
| 2010 |
| 2009 |
| ||
|
| (Unaudited) |
| (Unaudited) |
| ||
|
|
|
|
| (As Restated) |
| |
CASH FLOWS FROM OPERATING ACTIVITIES: |
|
|
|
|
|
|
|
Net income |
| $ | 2,810,095 |
| $ | 2,721,270 |
|
Adjustments to reconcile net income to net cash used in operating activities: |
|
|
|
|
|
|
|
Equity in earnings of subsidiary |
|
| (3,052,418 | ) |
| (1,235,606 | ) |
Common stock issued for services |
|
| 116,094 |
|
| 57,500 |
|
Common stock issued for interest |
|
| — |
|
| 19,085 |
|
Interest expense from amortization of debt discount |
|
| — |
|
| 1,931,611 |
|
Warrants issued for services |
|
| 31,188 |
|
| — |
|
Gain on extinguishment of derivative liabilities |
|
| — |
|
| (1,623,209 | ) |
Gain on change in fair value of derivative liabilities |
|
| (157,092 | ) |
| (2,002,937 | ) |
Changes in assets and liabilities: |
|
|
|
|
|
|
|
Prepaid expenses |
|
| 180,001 |
|
| — |
|
Accounts payable |
|
| (19,583 | ) |
| (59,783 | ) |
Accrued expenses |
|
| 41,617 |
|
| (4,592 | ) |
NET CASH USED IN OPERATING ACTIVITIES |
|
| (50,098 | ) |
| (196,661 | ) |
|
|
|
|
|
|
|
|
CASH FLOWS FROM INVESTING ACTIVITIES: |
|
|
|
|
|
|
|
Proceeds from subsidiaries |
|
| 50,000 |
|
| 922,504 |
|
NET CASH PROVIDED BY INVESTING ACTIVITIES |
|
| 50,000 |
|
| 922,504 |
|
|
|
|
|
|
|
|
|
CASH FLOWS FROM FINANCING ACTIVITIES: |
|
|
|
|
|
|
|
Repayment for convertible debt |
|
| — |
|
| (764,050 | ) |
NET CASH USED IN FINANCING ACTIVITIES |
|
| — |
|
| (764,050 | ) |
|
|
|
|
|
|
|
|
NET DECREASE IN CASH |
|
| (98 | ) |
| (38,207 | ) |
|
|
|
|
|
|
|
|
CASH - beginning of period |
|
| 1,043 |
|
| 39,956 |
|
|
|
|
|
|
|
|
|
CASH - end of period |
| $ | 945 |
| $ | 1,749 |
|
NOTE 17 – COMMITMENTS
Other than in the normal course of business, the Company did not have significant capital and other commitments, or significant guarantees as of December 31, 2010.
24
GOLD HORSE INTERNATIONAL, INC. AND SUBSIDIARIES
NOTES TO UNAUDITED CONDENSED CONSOLIDATED FINANCIAL STATEMENTS
December 31, 2010
NOTE 18 – RESTATEMENT OF INTERIM FINANCIAL RESULTS
The Company’s consolidated financial statements have been restated for the three and six months ended December 31, 2009 to properly record certain common stock purchase warrants and conversion options related to convertible debt as derivative liabilities in accordance with Derivative and Hedging Topic of the FASB Accounting Standards Codification Topic 815 (“ASC 815”), which has been effective for the Company since July 1, 2009, and to record the subsequent accounting for the changes in the fair value of the associated liabilities at December 31, 2009. Accordingly, the Company’s unaudited interim consolidated balance sheets, statements of income, and statements of cash flows at December 31, 2009 have been restated herein. All the respective restatement adjustments are non-cash in nature and not related to the operations of the Jin Ma Companies. The Company has discussed the restatement adjustments with its independent registered public accounting firm, Crowe Horwath (HK) CPA Limited. The effect of correcting these errors in the Company’s (a) unaudited consolidated balance sheets at December 31, 2009; (b) unaudited consolidated statements of income for the three and six months ended December 31, 2009; and (c) unaudited consolidated statements of cash flows for the six months ended December 31, 2009 are shown in the tables as follows:
Consolidated Balance Sheet data |
| December 31, 2009 (Unaudited) |
| ||||||||
|
| As Filed |
| Adjustments to Restate |
|
| Restated |
| |||
Total Assets |
| $ | 46,623,117 |
| $ | — |
|
| $ | 46,623,117 |
|
|
|
|
|
|
|
|
|
|
|
|
|
Derivative liabilities |
|
| — |
|
| 1,054,034 |
| (a) |
| 1,054,034 |
|
Total Current Liabilities |
|
| 15,789,984 |
|
| 1,054,034 |
|
|
| 16,844,018 |
|
Total Liabilities |
|
| 16,133,692 |
|
| 1,054,034 |
|
|
| 17,187,726 |
|
|
|
|
|
|
|
|
|
|
|
|
|
Stockholders’ Equity |
|
|
|
|
|
|
|
|
|
|
|
Preferred stock ($0.0001 par value; 20,000,000 shares authorized; none issued and outstanding) |
|
| — |
|
| — |
|
|
| — |
|
Common stock ($0.0001 par value; 300,000,000 shares authorized; 1,569,515 shares issued and outstanding) |
|
| 157 |
|
| — |
|
|
| 157 |
|
Non-controlling interest in variable interest entities |
|
| 6,095,314 |
|
| — |
|
|
| 6,095,314 |
|
Additional paid-in capital |
|
| 7,894,474 |
|
| (2,183,000 | ) | (b) |
| 5,711,474 |
|
Statutory reserve |
|
| 2,165,210 |
|
| — |
|
|
| 2,165,210 |
|
Retained earnings |
|
| 11,837,655 |
|
| 1,128,966 |
| (c) |
| 12,966,621 |
|
Accumulated other comprehensive income |
|
| 2,496,615 |
|
| — |
|
|
| 2,496,615 |
|
Total Stockholders’ Equity |
|
| 30,489,425 |
|
| (1,054,034 | ) |
|
| 29,435,391 |
|
Total Liabilities and Stockholders’ Equity |
| $ | 46,623,117 |
| $ | — |
|
| $ | 46,623,117 |
|
|
|
(a) | To record conversion feature and warrant derivative liability |
(b) | To reverse effect on additional paid-in capital as a result of the reclassification of warrants as derivative liability |
(c) | To adjust retained earnings for the adoption of ASC 815 accounting in (a) and (b) |
25
GOLD HORSE INTERNATIONAL, INC. AND SUBSIDIARIES
NOTES TO UNAUDITED CONDENSED CONSOLIDATED FINANCIAL STATEMENTS
December 31, 2010
NOTE 18 – RESTATEMENT OF INTERIM FINANCIAL RESULTS (continued)
Consolidated Statement of Income Data |
| For the Three Months Ended |
|
| For the Six Months Ended |
|
| ||||||||||||||
|
| As Filed |
| Adjustments |
| Restated |
|
| As Filed |
| Adjustments |
| Restated |
|
| ||||||
Income from Operations |
| $ | 288,592 |
|
| — |
| $ | 288,592 |
|
| $ | 734,310 |
|
| — |
| $ | 734,310 |
|
|
|
|
|
|
|
|
|
|
|
|
|
|
|
|
|
|
|
|
|
|
|
|
Other Income (Expenses): |
|
|
|
|
|
|
|
|
|
|
|
|
|
|
|
|
|
|
|
|
|
Change in fair value of derivative liabilities |
|
| — |
|
| 1,314,381 |
|
| 1,314,381 |
| (d) |
| — |
|
| 2,002,937 |
|
| 2,002,937 |
| (d) |
Gain from debt extinguishment |
|
| — |
|
| 561,602 |
|
| 561,602 |
| (e) |
| — |
|
| 1,623,209 |
|
| 1,623,209 |
| (e) |
Gain from s ale of land use rights and property |
|
| 167 |
|
| — |
|
| 167 |
| * |
| 449,473 |
|
| — |
|
| 449,473 |
| * |
Other income |
|
| (27 | ) |
| — |
|
| (27 | ) |
|
| 46 |
|
| — |
|
| 46 |
|
|
Interest income |
|
| 543,092 |
|
| — |
|
| 543,092 |
|
|
| 543,149 |
|
| — |
|
| 543,149 |
|
|
Interest expense |
|
| (745,695 | ) |
| — |
|
| (745,695 | ) |
|
| (2,317,076 | ) |
| — |
|
| (2,317,076 | ) |
|
Total Other Income (Expenses) |
|
| (202,463 | ) |
| 1,875,983 |
|
| 1,673,520 |
|
|
| (1,324,408 | ) |
| 3,626,146 |
|
| 2,301,738 |
|
|
|
|
|
|
|
|
|
|
|
|
|
|
|
|
|
|
|
|
|
|
|
|
Income (Loss) before Provision for Income Taxes |
|
| 86,129 |
|
| 1,875,983 |
|
| 1,962,112 |
|
|
| (590,098 | ) |
| 3,626,146 |
|
| 3,036,048 |
|
|
Provision for Income Taxes |
|
| 79,632 |
|
| — |
|
| 79,632 |
|
|
| 314,778 |
|
| — |
|
| 314,778 |
|
|
Net Income (Loss) |
| $ | 6,497 |
| $ | 1,875,983 |
| $ | 1,882,480 |
|
| $ | (904,876 | ) | $ | 3,626,146 |
| $ | 2,721,270 |
|
|
|
|
|
|
|
|
|
|
|
|
|
|
|
|
|
|
|
|
|
|
|
|
Comprehensive Income (Loss) |
| $ | 8,213 |
| $ | 1,875,983 |
| $ | 1,884,196 |
|
| $ | (871,016 | ) | $ | 3,626,146 |
| $ | 2,755,131 |
|
|
|
|
|
|
|
|
|
|
|
|
|
|
|
|
|
|
|
|
|
|
|
|
Net Income (Loss) per Common Share: |
|
|
|
|
|
|
|
|
|
|
|
|
|
|
|
|
|
|
|
|
|
Basic |
| $ | — |
| $ | 1.22 |
| $ | 1.22 |
|
| $ | (0.63 | ) | $ | 2.51 |
| $ | 1.88 |
|
|
Diluted |
| $ | — |
| $ | 1.22 |
| $ | 1.22 |
|
| $ | (0.63 | ) | $ | 2.48 |
| $ | 1.85 |
|
|
Weighted Average Common Shares Outstanding: |
|
|
|
|
|
|
|
|
|
|
|
|
|
|
|
|
|
|
|
|
|
Basic |
|
| 1,544,003 |
|
|
|
|
| 1,544,003 |
|
|
| 1,447,276 |
|
|
|
|
| 1,447,276 |
|
|
Diluted |
|
| 1,758,044 |
|
|
|
|
| 1,544,003 |
|
|
| 1,447,276 |
|
|
|
|
| 1,469,458 |
|
|
|
|
(d) | To reflect change in fair value of derivative liabilities |
(e) | To reflect extinguishment of conversion feature derivative liability upon conversion of debt to equity |
(*) | Gain on sale of land use rights and property has been reclassified from income from operations to other income to conform to the current periods presentation. |
Consolidated Statement of Cash Flows |
| For the Six Months Ended |
| ||||||||
|
| As Filed |
| Adjustments to Restate |
|
| Restated |
| |||
Net Income (Loss) |
| $ | (904,876 | ) | $ | 3,626,146 |
|
| $ | 2,721,270 |
|
Adjustments to reconcile net income (loss) to net cash used in operating activities: |
|
|
|
|
|
|
|
|
|
|
|
Gain on change in fair value of derivative liabilities |
|
| — |
|
| (2,002,937 | ) | (d) |
| (2,002,937 | ) |
Gain from debt extinguishment |
|
| — |
|
| (1,623,209 | ) | (e) |
| (1,623,209 | ) |
Cash Used in Operating Activities |
|
| (2,125,742 | ) |
| — |
|
|
| (2,125,742 | ) |
26
ITEM 2. | MANAGEMENT'S DISCUSSION AND ANALYSIS OF FINANCIAL CONDITION AND RESULTS OF OPERATIONS. |
The following discussion of our financial condition and results of operation should be read in conjunction with the financial statements and the notes to those statements that are included elsewhere in this report. Our discussion includes forward-looking statements based upon current expectations that involve risks and uncertainties, such as our plans, objectives, expectations and intentions. Actual results and the timing of events could differ materially from those anticipated in these forward-looking statements as a result of a number of factors, We use words such as “anticipate,” “estimate,” “plan,” “project,” “continuing,” “ongoing,” “expect,” “believe,” “intend,” “may,” “will,” “should,” “could,” and similar expressions to identify forward-looking statements.
Overview
We are not engaged in any business or operations other than pursuant to the terms of the various Contractual Arrangements with the Jin Ma Companies as described elsewhere in this report. As such, we are completely dependent on the Contractual Arrangements. We do not generate any revenues. Pursuant to the requirements of ASC Topic 810, under generally accepted accounting principles the Jin Ma Companies which are deemed to be variable interest entities (“VIEs”) and we are required to consolidate the financial statements of the Jin Ma Companies with our financial statements. Accordingly, and as described elsewhere in this report, the assets and liabilities at December 31, 2010 and June 30, 2010 and the results of operations for the three and six months ended December 31, 2010 and 2009 are primarily those of the Jin Ma Companies. All of those assets and operations are located in the PRC and the Contractual Arrangements are subject to enforcement under the laws of the PRC. There are no assurances we will be able to enforce these agreements if necessary. If we are unable to enforce any legal rights we may have under these contracts or otherwise, our ability to continue as a going concern is in jeopardy. In addition, the terms of these contracts expire in August 2016 and there are no assurances these agreements will be renewed. If the Contractual Arrangements are not renewed or are significantly modified, unless we have developed business and operations which are independent of the Jin Ma Companies, of which there are no assurances, we will in all likelihood be forced to cease our operations.
Critical Accounting Policies and Estimates
Our discussion and analysis of our financial condition and results of operations are based upon our consolidated financial statements, which have been prepared in accordance with U.S. GAAP. The preparation of these financial statements requires us to make estimates and judgments that affect the reported amounts of assets, liabilities, net revenues and expenses, and related disclosure of contingent assets and liabilities. We continually evaluate our estimates, including the allowance for doubtful accounts, the useful life of property and equipment and intangible assets, assumptions used in assessing impairment of long-term assets and valuation of deferred tax assets, the calculation of costs and estimated earnings in excess of billings and billings in excess of costs and estimated earnings, provisions for estimated losses on uncompleted contracts, the fair value of conversion options embedded in convertible debt, and the fair values of warrants granted in connection with the issuance of the convertible debt. We base our estimates on historical experience and on various other assumptions that we believe to be reasonable under the circumstances, the results of which form the basis for making judgments about the carrying values of assets and liabilities that are not readily apparent from other sources. Any future changes to these estimates and assumptions could cause a material change to our reported amounts of net revenues, expenses, assets and liabilities. Actual results may differ from these estimates under different assumptions or conditions. We believe the following critical accounting policies affect our more significant judgments and estimates used in the preparation of the financial statements.
Principles of consolidation
Pursuant to ASC Topic 810, we are required to include in our consolidated financial statements the financial statements of VIEs. ASC Topic 810 requires a VIE to be consolidated by a company if that company is subject to a majority of the risk of loss for the VIE or is entitled to receive a majority of the VIE’s residual returns. VIEs are those entities in which we, through contractual arrangements, bear the risk of, and enjoy the rewards normally associated with ownership of the entity, and therefore we are the primary beneficiary of the entity.
The Jin Ma Companies are considered VIEs, and we are the primary beneficiary. On June 29, 2007, we entered into the Contractual Arrangements with the Jin Ma Companies pursuant to which we are to receive 100% of the Jin Ma Companies net income. In accordance with these agreements, the Jin Ma Companies are to pay consulting fees equal to 100% of their net income to our wholly-owned subsidiary, Global Rise, and Global Rise shall supply the technology and administrative services needed to service the Jin Ma Companies.
27
The accounts of the Jin Ma Companies are consolidated in the accompanying financial statements pursuant to ASC Topic 810. As a VIE, the Jin Ma Companies net revenues are included in our total net revenues, their income from operations is consolidated with ours, and our net income includes all of the Jin Ma Companies net income. There is no non-controlling interest in net income and accordingly, no net income is subtracted in calculating the net income attributable to us. Because of the contractual arrangements, we have pecuniary interest in the Jin Ma Companies that requires consolidation of the Jin Ma Companies financial statements with our financial statements.
Accounts receivable, notes receivable and other receivables
We have a policy of reserving for uncollectible accounts based on our best estimate of the amount of probable credit losses in our existing receivables. We periodically review our receivables to determine whether an allowance is necessary based on an analysis of past due accounts and other factors that may indicate that the realization of an account may be in doubt. Account balances deemed to be uncollectible are charged to the allowance after all means of collection have been exhausted and the potential for recovery is considered remote.
Prior to the time when the Jin Ma Companies financial statements were prepared in accordance with U.S. GAAP, the Jin Ma Companies did not record reserves for uncollectable accounts. Following the Contractual Arrangements, in accordance with U.S. GAAP we initially estimated reserves based solely upon the age of the receivables as a historical basis by which the collectability could be reasonably estimated did not exist. As a basis for accurately estimating the likelihood of collection has been established, the Jin Ma Companies consider a number of factors when determining reserves for uncollectable accounts. We believe that we use a reasonably reliable methodology to estimate the collectability of the Jin Ma Companies receivables. We review our allowances for doubtful accounts on at least a quarterly basis. We also consider whether the historical economic conditions are comparable to current economic conditions. If the financial condition of our customers or other parties that we have business relations with were to deteriorate, resulting in an impairment of their ability to make payments, additional allowances may be required. If we should become unable to reasonably estimate the collectability of our receivables, our results of operations could be negatively impacted. At December 31, 2010 and June 30, 2010, we have established, based on a review of our outstanding accounts receivable balances, an allowance for doubtful accounts in the amount of $816,341 and $978,455, respectively, on our total accounts receivable. We believe that our notes receivable are fully collectable. Therefore, no allowance for doubtful accounts is deemed to be required at December 31, 2010 and June 30, 2010.
Other receivables are primarily related to advances made to various vendors, subcontractors, and other parties in the normal course of business and an allowance was established when those parties were deemed to be unlikely to repay the amounts. At December 31, 2010 and June 30, 2010, we have established, based on a review of our outstanding other receivable balances, an allowance for doubtful accounts in the amount of $63,547 and $69,171, respectively.
Inventories
Inventories, consisting of consumable goods related to our hotel operations are stated at the lower of cost or market utilizing the first-in, first-out method.
Real estate held for sale
We capitalize as real estate held for sale the direct construction and development costs, property taxes, interest incurred on costs related to land under development and other related costs (i.e. engineering, surveying, landscaping, etc.) until the property reaches its intended use. At December 31, 2010 and June 30, 2010, real estate held for sale amounted to $200,606 and $367,009, respectively.
Advances from customers
Advances from customers at December 31, 2010 and June 30, 2010 of $191,152 and $144,670, respectively, consist of prepayments from third party customers to us for construction and real estate transactions to ensure sufficient funds are available to complete the real estate and construction projects. We will recognize the deposits as revenue upon transfer of title to the buyer, in compliance with our revenue recognition policy.
28
Construction in progress
Properties currently under development are accounted for as construction-in-progress. Construction-in-progress is recorded at acquisition cost, including land use rights cost, development expenditure, professional fees and the interest expenses capitalized during the course of construction for the purpose of financing the project. Upon completion and readiness for use of the project, the cost of construction-in-progress is to be transferred to an appropriate asset such as real estate held for sale. Construction in progress is valued at the lower of cost or market. Management evaluates the market value of its properties on a periodic basis for impairment. As of December 31, 2010 and June 30, 2010, construction in progress amounted to $27,489,827 and $12,860,646, respectively, of which $14,246,384 and $0, respectively, were included in current portion.
Derivative financial instruments
We evaluate all of our financial instruments to determine if such instruments are derivatives or contain features that qualify as embedded derivatives. For derivative financial instruments that are accounted for as liabilities, the derivative instrument is initially recorded at its fair value and is then re-valued at each reporting date, with changes in the fair value reported in the consolidated statements of income. For stock-based derivative financial instruments, we use the Black-Scholes-Merton option-pricing model to value the derivative instruments at inception and on subsequent valuation dates. The classification of derivative instruments, including whether such instruments should be recorded as liabilities or as equity, is evaluated at the end of each reporting period. Derivative instrument liabilities are classified in the balance sheets as current or non-current based on whether or not net-cash settlement of the derivative instrument could be required within 12 months of the balance sheet date. As of December 31, 2010 and June 30, 2010, we had $496,538 and $653,630, respectively, of warrants liability on the balance sheet.
Revenue recognition
We follow the guidance of ASC Topic 605 and Topic 360 for revenue recognition. In general, we record revenue when persuasive evidence of an arrangement exists, services have been rendered or product delivery has occurred, the sales price to the customer is fixed or determinable, and collectability is reasonably assured. The following policies reflect specific criteria for the various revenue streams:
Real estate sales which primarily involve the sale of multi-family units and community environments are reported in accordance with the provisions of ASC Topic 360. Generally, profits from the sale of development properties, less 5% business tax, are recognized by the full accrual method when the sale is consummated. A sale is not considered consummated until (1) the parties are bound by the terms of a contract, (2) all consideration has been exchanged, (3) any permanent financing of which the seller is responsible has been arranged, (4) all conditions precedent to closing have been performed, (5) the seller does not have substantial continuing involvement with the property, and (6) the usual risks and rewards of ownership have been transferred to the buyer.
In 2007 and 2008, Jin Ma Real Estate entered into agreements to construct new dormitories as follows:
a) In November 2007, Jin Ma Real Estate entered into an agreement to construct new dormitories for the Inner Mongolia Electrical Vocational Technical School (the “Vocational School”). Pursuant to the terms of the agreement, Jin Ma Real Estate constructed the buildings and, upon completion, pursuant to a sales-type capital lease, leased the buildings to the Vocational School and will receive payments for a period of 26 years at an amount of 4,800,000 RMB or approximately $700,000 per annum. In November 2008, Jin Ma Real Estate completed the construction. Since the agreement did not have a stated interest rate, we used an imputed interest rate of 6.12% and are reflecting payments due under the agreement as a note receivable on the accompanying balance sheets. The property sold had an imputed sales value of 61,691,138 RMB (approximately $9,000,000). The deferred gain on the sale of the property was approximately $52,000 of which $986 and $914 was recognized in the six months ended December 31, 2010 and 2009, respectively, pursuant to the installment method and was reflected in the accompanying statements of income.
b) In 2008, Jin Ma Real Estate and Inner Mongolia Chemistry School entered an oral agreement and on September 29, 2009, formalized a written agreement for the construction of student apartments for the Inner Mongolia Chemistry College (the “Chemistry School”) situated in Inner Mongolia University City, a compound where many higher education institutions are located. Jin Ma Construction began developing the 51,037 square-meter project in July 2008 and completed the construction in October 2009. Jin Ma Real Estate leased the buildings to the Chemistry School for a period of 20 years. The annual lease payments are RMB 10.62 million (approximately $1.55 million) for five years (from fiscal 2010 to fiscal 2014), and the annual lease payment is RMB 5.42 million (approximately $0.79 million) for 15 years (from fiscal 2015 to fiscal 2029). Since the agreement did not have a stated interest rate, we used an imputed interest rate of 5.94% and are reflecting payments due under the agreement as a note receivable on the accompanying balance sheets. The property sold had an imputed sales value of 84,196,104 RMB (approximately $12 million). The deferred gain on the sale of the property was approximately $3,900,000 of which $68,194 and $0, respectively, was recognized in the six months ended December 31, 2010 and 2009 pursuant to the installment method and was reflected in the accompanying statements of income.
29
In accordance with ASC Topic 360, the initial gains from the sales of the Vocational School and Chemistry School were deferred because the minimum initial investment by the buyer was less than the required 20% initial investment expressed as a percentage of the sales value (ASC Topic 360). Therefore the gains are being recognized into income as payments are received using the installment method. The installment method apportions each cash receipt and principal payment by the buyer between cost recovered and profit. The apportionment is in the same ratio as total cost and total profit bear to the sales value. Accordingly, revenues and cost of sales are recognized based on the apportionments, and we recognized imputed interest income on the accompanying consolidated statements of income as summarized below.
As of December 31, 2010, the remaining deferred gains for Vocational School and Chemistry School leases of $50,784 and $3,878,710, respectively, is reflected as a discount of notes receivable in the accompanying balance sheet. As of June 30, 2010, the remaining deferred gains for Vocational School and Chemistry School leases of $50,291 and $3,833,940, respectively, is reflected as a discount of notes receivable in the accompanying balance sheet. The recorded imputed interest discount will be realized as the balances due are collected. In the event of early liquidation, interest is recognized on the simple interest method.
The deferred gains were recognized pursuant to the installment method and are reflected in the accompanying consolidated statements of income follows:
|
| For the Three Months Ended |
| For the Six Months Ended |
| ||||||||
|
| 2010 |
| 2009 |
| 2010 |
| 2009 |
| ||||
Net revenues |
| $ | 137,948 |
| $ | 158,981 |
| $ | 387,478 |
| $ | 158,981 |
|
Cost of sales |
|
| 136,596 |
|
| 158,067 |
|
| 318,298 |
|
| 158,067 |
|
Gross profit recognized |
| $ | 1,352 |
| $ | 914 |
| $ | 69,180 |
| $ | 914 |
|
Jin Ma Real Estate receives annual payments of principal and the related imputed interest from the Vocational School and Chemistry School. During the six months ended December 31, 2010 and 2009, we allocated the payments received as follows:
|
| For the Three Months Ended |
| For the Six Months Ended |
| ||||||||
|
| 2010 |
| 2009 |
| 2010 |
| 2009 |
| ||||
Amount applied to principal balance of notes receivable |
| $ | 137,948 |
| $ | 158,981 |
| $ | 387,478 |
| $ | 158,981 |
|
|
|
|
|
|
|
|
|
|
|
|
|
|
|
Interest income recognized on consolidated statement of income |
|
| 431,173 |
|
| 542,920 |
|
| 650,748 |
|
| 542,9200 |
|
Total payment received |
| $ | 569,121 |
| $ | 701,901 |
| $ | 1,038,226 |
| $ | 701,901 |
|
Revenue from the performance of general contracting, construction management and design-building services is recognized upon completion of the service.
Revenue primarily derived from hotel operations, including the rental of rooms and food and beverage sales, is recognized when rooms are occupied and services have been rendered.
In accounting for long-term engineering and construction-type contracts, we follow the provisions of ASC Topic 605. We recognize revenues using the percentage of completion method of accounting by relating contract costs incurred to date to the total estimated costs at completion. Contract price and cost estimates are reviewed periodically as work progresses and adjustments proportionate to the percentage of completion are reflected in contract revenues and gross profit in the reporting period when such estimates are revised. This method of revenue recognition requires us to prepare estimates of costs to complete contracts in progress. In making such estimates, judgments are required to evaluate contingencies such as potential variances in schedule, the cost of materials and labor, and productivity, and the impact of change orders, liability claims, contract disputes, and achievement of contractual performance standards which may result in revisions to costs and income and are recognized in the period in which the revisions are determined. Provisions for estimated losses on uncompleted contracts are made in the period in which such losses are determined. The asset, costs and estimated earnings in excess of billings,” represents revenues recognized in excess of amounts billed. The liability, billings in excess of costs and estimated earnings,” represents billings in excess of revenues recognized.
30
Foreign currency translation
Our reporting currency is the U.S. dollar. Our functional currency is the U.S. dollar and the functional currency of our China subsidiaries and the VIEs is RMB. For the subsidiaries and VIEs whose functional currencies are the RMB, results of operations and cash flows are translated at average exchange rates during the year, assets and liabilities are translated at the unified exchange rate at the end of the year, and equity is translated at historical exchange rates. Translation adjustments resulting from the process of translating the local currency financial statements into U.S. dollars are included in determining comprehensive income. Transactions denominated in foreign currencies are translated into the functional currency at the exchange rates prevailing on the transaction dates. Assets and liabilities denominated in foreign currencies are translated into the functional currency at the exchange rates prevailing at the balance sheet date with any transaction gains and losses that arise from exchange rate fluctuations on transactions denominated in a currency other than the functional currency are included in the results of operations as incurred. All of the Jin Ma Companies revenue transactions are transacted in the functional currency. We do not enter any material transactions in foreign currencies and accordingly, transaction gains or losses have not had, and are not expected to have, a material effect on our results of operations.
Asset and liability accounts at December 31, 2010 and June 30, 2010 were translated at 6.6118 RMB to $1.00 and at 6.8086 RMB to $1.00, respectively. Equity accounts were stated at their historical rate. The average translation rates applied to the statements of income for the six months ended December 31, 2010 and 2009 were 6.72367 RMB and 6.83857 RMB to $1.00, respectively. Cash flows from the Jin Ma Companies operations are calculated based upon the local currencies using the average translation rate. As a result, amounts related to assets and liabilities reported on the statement of cash flows will not necessarily agree with changes in the corresponding balances on the balance sheets.
Warranty policy
In accordance with ASC Topic 450, we estimate liabilities for construction defect, product liability and related warranty claims based on the possible claim amounts resulting from injury or damage caused by construction defects and expected material and labor costs to provide warranty replacement products. The methodology used in determining the liability is based upon historical information and experience. Based on historical experience, claims made for construction defects and the warranty service calls and any related labor material costs have been minimal. As such, the warranty provision amounts for the six months ended December 31, 2010 and 2009 were immaterial.
Recent Accounting Pronouncements
In July 2010, the FASB issued ASU 2010-20, “Receivables (Topic 310): Disclosures about the Credit Quality of Financing Receivables and the Allowance for Credit Losses.” This ASU amends Topic 310 to improve the disclosures that an entity provides about the credit quality of its financing receivables and the related allowance for credit losses. As a result of these amendments, an entity is required to disaggregate by portfolio segment or class certain existing disclosures and provide certain new disclosures about its financing receivables and related allowance for credit losses. For public entities, the disclosures as of the end of a reporting period are effective for interim and annual reporting periods ending on or after December 15, 2010. The disclosures about activity that occurs during a reporting period are effective for interim and annual reporting periods beginning on or after December 15, 2010. Except for the expanded disclosure requirements, the adoption of this ASU did not have a material impact on our consolidated financial statements.
Other accounting standards that have been issued or proposed by the FASB or other standards-setting bodies that do not require adoption until a future date are not expected to have a material impact on the Company’s consolidated financial statements upon adoption
31
RESULTS OF OPERATIONS
Comparison of Six Months Ended December 31, 2010 and Six Months Ended December 31, 2009.
|
| For the Six Months Ended December 31, |
| ||||||||||
|
| 2010 |
| % of Total |
| 2009 |
| % of Total |
| ||||
NET REVENUES |
|
|
|
|
|
|
|
|
|
|
|
|
|
Construction |
| $ | 24,991,149 |
|
| 91.6 |
| $ | 9,596,012 |
|
| 85.2 |
|
Hotel |
|
| 1,565,475 |
|
| 5.7 |
|
| 1,512,829 |
|
| 13.4 |
|
Real estate |
|
| 713,369 |
|
| 2.7 |
|
| 158,981 |
|
| 1.4 |
|
Total Revenues |
|
| 27,269,993 |
|
| 100.0 |
|
| 11,267,822 |
|
| 100.0 |
|
COST OF REVENUES |
|
|
|
|
|
|
|
|
|
|
|
|
|
Construction |
|
| 21,437,820 |
|
| 85.8 | * |
| 8,329,680 |
|
| 86.8 | * |
Hotel |
|
| 909,055 |
|
| 58.1 | * |
| 1,008,859 |
|
| 66.7 | * |
Real estate |
|
| 540,214 |
|
| 75.7 | * |
| 167,050 |
|
| 105.1 | * |
Total Cost of Revenues |
|
| 22,887,089 |
|
| 83.9 |
|
| 9,505,589 |
|
| 84.4 |
|
GROSS PROFIT |
|
|
|
|
|
|
|
|
|
|
|
|
|
Construction |
|
| 3,553,329 |
|
| 14.2 | * |
| 1,266,332 |
|
| 13.2 | * |
Hotel |
|
| 656,420 |
|
| 41.9 | * |
| 503,970 |
|
| 33.3 | * |
Real estate |
|
| 173,155 |
|
| 24.3 | * |
| (8,069 | ) |
| (5.1 | )* |
Total Gross Profit |
| $ | 4,382,904 |
|
| 16.1 |
| $ | 1,762,233 |
|
| 15.6 |
|
* Represents percentage of respective segments total net revenues
Net Revenues. For the six months ended December 31, 2010, our overall net revenues increased 142.0% from the six months ended December 31, 2009. The increase in overall net revenues was mainly due to increased activity in our construction and real estate operations caused by an improvement in the real estate market in Hohhot.
For the six months ended December 31, 2010 and 2009, net revenues from construction segment operations are summarized as follows:
Project Name |
| For the Six Months |
|
| % |
| For the Six Months |
|
| % |
| ||
Ai Bo Garden residential apartment project (Phase I and II) |
| $ | — |
|
| 0.0 | * | $ | (117,435 | ) |
| (1.1 | )* |
Lanyu Garden project |
|
| — |
|
| 0.0 | * |
| 3,439,335 |
|
| 35.8 | * |
Fu Xing Committee Bath Center project |
|
| — |
|
| 0.0 | * |
| 3,054,560 |
|
| 31.8 | * |
Jianhe Garden residential project |
|
| 15,869,011 |
|
| 63.5 | * |
| 2,333,235 |
|
| 24.3 | * |
Tuzuoqi Low-rent House project |
|
| (2,504 | ) |
| 0.0 | * |
| 886,317 |
|
| 9.2 | * |
Fuhengyuan residential project |
|
| 2,795,513 |
|
| 11.2 | * |
| — |
|
| 0.0 | * |
Tiantixingyuan No. 1 – No. 7 project |
|
| 6,329,129 |
|
| 25.3 | * |
| — |
|
| 0.0 | * |
Total construction segment net revenues |
| $ | 24,991,149 |
|
| 100.0 |
| $ | 9,596,012 |
|
| 100.0 |
|
* Represents percentage of construction segment net revenues.
At December 31, 2010, the percentage completed for each respective job is as follows:
| % Complete |
Tuzuoqi Low-rent project | 100.0% |
Jianhe Garden residential project | 100.0% |
Fuhengyuan residential project | 17.0% |
Tiantixingyuan No. 1 – No. 7 residential project | 24.1% |
32
As of December 31, 2010, Jin Ma Construction had two uncompleted third party construction projects in progress:
| · | the Fuhengyuan residential project, a project consisting of ten residential buildings with a total construction area of 110,129 square meters began in construction in October 2010 with an expected completion date of December 2011 was 17.0% complete at December 31, 2010, and |
|
|
|
| · | the Tiantixingyuan Housing Project, a project consisting of seven residential buildings with a total construction area of 90,607 square meters began construction at the end of September 2010 and was 24.1% complete at December 31, 2010. |
The increase in Jan Ma Construction’s revenue for the six months ended December 31, 2010 as compared to the six months ended December 31, 2009 was attributable to a turnaround in the real estate market in Hohhot which occurred in the 2010 period. At any given time Jin Ma Construction will have a concentration of significant customers depending upon the number and scope of construction projects. These significant customers may not be the same from period to period depending upon the percentage of completion of the specific projects. Any disruption in the relationships between Jin Ma Construction and one or more of these customers, or any significant variance in the magnitude or the timing of construction projects from any one of these customers, may result in decreases in our results of operations, liquidity and cash flows. In addition, if Jin Ma Construction does not successfully manage its business so that it has new projects ready to start as current projects are completed its revenues will decline which will materially adversely impact our liquidity and operations in future periods. In addition to the third-party construction projects outlined above, Jin Ma Construction has been acting as general contractor for Jin Ma Real Estate to construct residential real estate development projects as discussed below and Jin Ma Construction is now focusing on acting as general contractor for Jin Ma Real Estate in order to vertically integrate all development processes from construction management to the sale of real estate units to customers.
Net revenues for Jin Ma Hotel’s operations increased 3.5% for the six months ended December 31, 2010 from the six months ended December 31, 2009 primarily due to increased sales at the hotel’s banquet and catering facility. In the six months ended December 31, 2010, the Jin Ma Hotel has seen an increase in visitors to its banquet facility as compared to the six months ended December 31, 2009.
For the six months ended December 31, 2010 and 2009, net revenues from real estate development operations are summarized as follows:
|
|
|
|
|
|
|
Project Name |
| For the Six |
| For the Six | ||
Building 1 to 4 of Procuratorate Housing Estates |
| $ | 325,891 |
| $ | — |
Inner Mongolia Electrical Vocational Technical School |
|
| 171,594 |
|
| 158,981 |
Inner Mongolia Chemistry College |
|
| 215,884 |
|
| — |
|
|
|
|
|
|
|
Total real estate segment net revenues |
| $ | 713,369 |
| $ | 158,981 |
As a result of the change in 2010 in the focus of Jin Ma Construction from acting as a general contractor for third party projects to building projects for Jin Ma Real Estate, we expected that both the Jin Ma Companies’ revenues and gross profit would be impacted in fiscal 2011. Jin Ma Construction does not report revenues from work completed for Jin Ma Real Estate. In fiscal 2011, we expected Jin Ma Real Estate’s revenues and gross profits to increase significantly from the sale of real estate units from internally developed projects. Through the six months ended December 31, 2010 our results reflected these expectations, and we expect this trend to continue during the rest of fiscal 2011.
At December 31, 2010, we have acquired land use rights and/or began developing the following residential projects in cooperation with Jin Ma Construction that acts as the general contractor, an example of projects under the Jin Ma Companies new integrated business model. The timing of any revenues from those projects is presently undeterminable and while we expect to fully sell out each project, there are no assurances these expectations are correct. If we sell less than 100% of any project, our estimates of revenues from that project will decline from those set forth below.
33
| Total construction in progress at |
| |
Prepaid land use rights and construction costs for building 6 of the | $ | 912,034 | (a) |
Prepaid land use rights and construction costs for Shuian Renjia project |
| 14,246,384 | (b) |
Prepaid land use rights for the Jinwu residential project |
| 2,500,501 | (c) |
Prepaid land use rights for the Beiyuan residential building project |
| 9,830,908 | (d) |
|
|
|
|
Total construction in progress | $ | 27,489,827 |
|
| (a) | Building 6 of the Procuratorate Housing Estates (Jiari Residential Building) is located in Yuquan District, Hohhot City, Inner Mongolia, has a construction area of 38,000 square meters and is expected to be completed in January 2012. The successful sell out of this project is expected to yield revenues of 180 million RMB or $27.7 million. |
|
|
|
| (b) | The Shuian Renjia residential project is located at the south part of East Xinhua Street in Hohhot, and will consist of two buildings each with 17 floors and a total of 364 apartments. The total development area will be 56,841.2 square meters. The Shuian Renjia project is expected to be completed by May 2011 and requires a total investment of 140 million RMB or about $22 million. The successful completion of this project is expected to yield revenues of 227 million RMB or $32.9 million. |
|
|
|
| (c) | The Jinwu residential project will have a construction area of 53,000 square meters and is expected to be completed in December 2012. The successful sell out of this project is expected to yield revenues of 237.5 million RMB or $36.5 million. |
|
|
|
| (d) | The Beiyuan residential project will have a construction area of 70,000 square meters and is expected to be completed in fiscal 2013. The successful sell out of this project is expected to yield revenues of 250.0 million RMB or $38.5 million. |
Jin Ma Real Estate will continue to record revenues from both the Vocational School and the Chemistry School during fiscal 2011 upon collection of the annual payment due.
Cost of Revenues. Overall, cost of revenues as a percentage of net revenues decreased from 84.4% for six months ended December 31, 2009 to 83.9% for the six months ended December 31, 2010. This overall change included the following segment changes:
| · | Cost of revenues as a percentage of net revenues from Jin Ma Construction’s operation for the six months ended December 31, 2010 decreased to 85.8% from 86.8% for the six months ended December 31, 2009. The slight decrease was mainly attributable to the slight decrease in construction materials and labor costs. We expect our cost of revenues as a percentage of net revenues from Jin Ma Construction will remain at its current level with minimal increase in the rest of fiscal 2011. |
|
|
|
| · | Cost of revenues as a percentage of net revenues for Jin Ma Hotel’s operations for the six months ended December 31, 2010 decreased to 58.1% from 66.7% for the six months ended December 31, 2009. The decrease in cost of revenues as a percentage of net revenues was primarily attributable to the better management of raw material costs. It expects the cost of revenues as a percentage of net revenues for its hotel operation will remain at its current level in the near future. |
|
|
|
| · | Cost of revenues for Jin Ma Real Estate’s operation as a percentage of net real estate revenues for the six months ended December 31, 2010 decreased to 75.7% from 105.1% for the six months ended December 31, 2009. In the 2011 period, 24.1% of revenues from our real estate development operations were attributable to the Vocational School, 30.3% of revenues from our real estate development operation were attributable to the Chemistry School, and 45.6% were attributable to the sale of remaining units of real estate held for sale. In the 2010 period, 100% of revenues for our real estate development operation was attributable to the Vocational School and was recognized on the installment method which apportions each cash receipt and principal payment by the buyer between cost recovered and profit. The different revenue mix in the 2011 period had an effect of lowering cost of sales as a percentage of revenues as compared to the 2010 period. We expect gross margins on Jin Ma Real Estate development projects to range from 30% to 40% in future periods. |
34
Gross Profit. Gross profit increased 148.7% for the six months ended December 31, 2010 from the six months ended December 31, 2009. Gross profit margin increased from 15.6% for the six months ended December 31, 2009 to 16.1% for the six months ended December 31, 2010. The increase in gross profit was attributable to an increase in revenues generated from Jin Ma Construction and Jin Ma Real Estate.
Total Operating Expenses. For the six months ended December 31, 2010, overall operating expenses increased 8.5% from the six months ended December 31, 2009. This increase was mainly due to an increase in salaries and employee benefits and an increase in selling, general and administrative expenses offset by a decrease in other hotel operating expenses and an increase in bad debt recovery. We expect that operating expenses will maintain at their current level with minimal increases in the near future.
Other Hotel Operating Expenses. Other hotel operating expenses represent costs and expenses associated with operating Jin Ma Hotel's restaurant and banquet facilities and hotel operating expenses except for food and beverage costs which have been included in cost of revenues. Other hotel operating expenses decreased 69.1% for the six months ended December 31, 2010 from the six months ended December 31, 2009. Other hotel operating expenses were 2.0% of hotel revenues for the six months ended December 31, 2010 as compared to 6.8% for the six months ended December 31, 2009. The decrease in other hotel operating expenses for the six months ended December 31, 2010 is primarily attributable to a decrease in expenditures related to the purchase of low cost items such as plates, glasses which were expensed in the 2010 period, the period these items were put in use.
Bad Debt (Recovery) Expenses. For the six months ended December 31, 2010, bad debt recovery income amounted to $195,612 as compared to bad debt recovery income of $105,555 for the six months ended December 31, 2009, an increase of 85.3% and relates to the collection of aged receivable balances previously written off. We have a policy of reserving for uncollectible accounts based on our best estimate of the amount of probable credit losses in the Jin Ma Companies existing accounts and other receivables. We periodically review the Jin Ma Companies’ accounts receivable and other receivables to determine whether an allowance is necessary based on an analysis of past due accounts and other factors that may indicate that the realization of an account may be in doubt. Account balances deemed to be uncollectible are charged to the allowance after all means of collection have been exhausted and the potential for recovery is considered remote.
Salaries and Employee Benefits. For the six months ended December 31, 2010, salaries and employee benefits increased 6.7% from the six months ended December 31, 2009. This increase is primarily related to the increase in employee salaries. We expect that salaries and employee benefits will remain at the current level with minimal increase in the near future.
Depreciation. For the six months ended December 31, 2010, depreciation increased 1.9% as compared to the six months ended December 31, 2009. This slight increase was primarily due to our newly purchased fixed assets for which we began the depreciation in the six months ended December 31, 2010.
Selling, General and Administrative Expenses. Selling, general and administrative expenses consist of selling, office expenses and supplies, utilities, insurance, telephone and communications, maintenance and automobile expense incurred by the Jin Ma Companies as well as expenses incurred by us which primarily consist of professional and other fees. Selling, general and administrative expenses increased 85.2% for the six months ended December 31, 2010 compared to the six months ended December 31, 2009. The increase was primarily attributable to the increase in the amortization of stock-based professional fees for business development and planning of $180,000 in the 2011 period. We expect to incur similar expenses in future periods.
Total Other Income (Expenses). For the six months ended December 31, 2010, we recorded other income of $562,788 as compared to other income of $2,301,738 in the six months ended December 31, 2009. For the six months ended December 31, 2010 and 2009, other income (expenses) primarily consisted of the following:
| · | For the six months ended December 31, 2010, we did not record any gain on extinguishment of derivative liabilities as compared to a gain of $1,623,209 related to the conversion and repayment of convertible debt during the six months ended December 31, 2009; |
|
|
|
| · | For the six months ended December 31, 2010, we recorded a gain on change in fair value of derivative liabilities of $157,092 related to the change in fair value of derivative liabilities associated with warrants as compared to $2,002,937 related to the change in fair value of derivative liabilities associated with warrants and the embedded conversion option on convertible debt during the six months ended December 31, 2009; |
|
|
|
| · | For the six months ended December 31, 2010, we did not dispose any assets. For the six months ended December 31, 2009, Jin Ma Construction recognized a gain from the sale of land use rights and property of $449,473. |
35
| · | For the six months ended December 31, 2010, we recorded interest income of $650,860 as compared to interest income of $543,149 in the six months ended December 31, 2009, an increase of $107,711 attributable to the recording of interest income from the collection of the payments from the Chemistry School; and |
|
|
|
| · | For the six months ended December 31, 2010, we recorded interest expense of $252,006 as compared to $2,317,076 in the six months ended December 31, 2009, a decrease of $2,065,070 or 89.1% which was attributable to a decrease in interest expense from the amortization of debt discount of approximately $1,932,000, a decrease in interest of approximately $95,000 attributable to the repayment of convertible debt, and a decrease in interest of approximately $88,000 from the repayment of loan payable offset by the decrease in interest expenses caused by the write-off of a penalty of $50,000 in the fiscal 2010 period. |
Provision for Income Taxes. Total provision for income taxes increased 224.2% for the six months ended December 31, 2010 (26.6% of income before income taxes) from the six months ended December 31, 2009 (10.4% of income before income taxes). The increase in the provision for income taxes was attributable to an increase in income before income taxes related to our Chinese subsidiaries and VIEs. The increase in the provision for income taxes as a percentage of income before income taxes was attributable to the effect of our U.S. net losses on our overall effective tax rate for the six months ended December 31, 2010 as compared to the effect of our U.S. net gains on our overall effective tax rate for the six months ended December 31, 2009.
Net Income. Net income increased 3.3% for the six months ended December 31, 2010 from the six months ended December 31, 2009. This increase was primarily attributable to an increase in revenues and related gross profits offset by an increase in operating expenses, a decrease in other income and an increase in provision for income taxes as described above. This translates to basic net income per common share of $1.45 and $1.88, and diluted net income per common share of $1.42 and $1.85, for the six months ended December 31, 2010 and 2009, respectively.
Comprehensive Income. For the six months ended December 31, 2010, we reported unrealized gain on foreign currency translation of $1,154,673 as compared to $33,861 for the six months ended December 31, 2009 which reflects the effect of the declining value of the U.S. dollar. These gains are non-cash items. As described elsewhere herein, the functional currency of our China subsidiaries and variable interest entities is the Chinese Renminbi. The accompanying consolidated financial statements have been translated and presented in U.S. dollars using period end rates of exchange for assets and liabilities, and average rates of exchange for the period for net revenues, costs, and expenses. Net gains resulting from foreign exchange transactions, if any, are included in the consolidated statements of income and do not have a significant effect on our consolidated financial statements. As a result of this non-cash foreign currency translation gain, we reported comprehensive income of $3,964,768 for the six months ended December 31, 2010 as compared to comprehensive gain of $2,755,131 for the six months ended December 31, 2009.
Comparison of Three Months Ended December 31, 2010 and Three Months Ended December 31, 2009.
|
| For the Three Months Ended December 31, |
| ||||||||||
|
| 2010 |
| % of Total |
| 2009 |
| % of Total |
| ||||
NET REVENUES |
|
|
|
|
|
|
|
|
|
|
|
|
|
Construction |
| $ | 15,400,661 |
|
| 93.8 |
| $ | 4,405,892 |
|
| 83.1 |
|
Hotel |
|
| 724,213 |
|
| 4.4 |
|
| 734,809 |
|
| 13.9 |
|
Real estate |
|
| 302,400 |
|
| 1.8 |
|
| 158,981 |
|
| 3.0 |
|
Total Revenues |
|
| 16,427,274 |
|
| 100.0 |
|
| 5,299,682 |
|
| 100.0 |
|
COST OF SALES |
|
|
|
|
|
|
|
|
|
|
|
|
|
Construction |
|
| 13,280,141 |
|
| 86.2 | * |
| 3,878,214 |
|
| 88.0 | * |
Hotel |
|
| 393,607 |
|
| 54.3 | * |
| 494,312 |
|
| 67.3 | * |
Real estate |
|
| 241,712 |
|
| 79.9 | * |
| 167,050 |
|
| 105.1 | * |
Total Cost of Sales |
|
| 13,915,460 |
|
| 84.7 |
|
| 4,539,576 |
|
| 85.7 |
|
GROSS PROFIT |
|
|
|
|
|
|
|
|
|
|
|
|
|
Construction |
|
| 2,120,520 |
|
| 13.8 | * |
| 527,678 |
|
| 12.0 | * |
Hotel |
|
| 330,606 |
|
| 45.7 | * |
| 240,497 |
|
| 32.7 | * |
Real estate |
|
| 60,688 |
|
| 20.1 | * |
| (8,069 | ) |
| (5.1 | )* |
Total Gross Profit |
| $ | 2,511,814 |
|
| 15.3 |
| $ | 760,106 |
|
| 14.3 |
|
* Represents percentage of respective segments total net revenues
36
Net Revenues. For the second quarter of 2011, our overall net revenues increased 210.0% from the second quarter of 2010. The increase in revenues was mainly due to increased activity in our construction and real estate operations caused by an improvement in the real estate market in Hohhot.
Net revenues related to Jin Ma Construction by construction project are summarized as follows:
Project Name |
| For the Three |
|
| % |
| For the Three |
|
| % |
| ||
Fu Xing Bath Center |
| $ | — |
|
| 0.0 | * | $ | 917,870 |
|
| 20.8 | * |
Lanyu Garden Number 3 residential building |
|
| — |
|
| 0.0 | * |
| 385,905 |
|
| 8.8 | * |
Ai Bo Garden residential apartment project |
|
| — |
|
| 0.0 | * |
| (117,435 | ) |
| (2.7 | )* |
Jianhe Garden residential project |
|
| 6,369,104 |
|
| 41.4 | * |
| 2,333,235 |
|
| 53.0 | * |
Tuzuoqi Low-rent House project |
|
| (93,085 | ) |
| (0.6 | )* |
| 886,317 |
|
| 20.1 | * |
Fuhengyuan residential project |
|
| 2,795,513 |
|
| 18.1 | * |
| — |
|
| 0.0 | * |
Tiantixingyuan No. 1 – No. 7 project |
|
| 6,329,129 |
|
| 41.1 | * |
| — |
|
| 0.0 | * |
Total construction segment net revenues |
| $ | 15,400,661 |
|
| 100.0 |
| $ | 4,405,892 |
|
| 100.0 |
|
* Represents percentage of construction segment net revenues.
The increase in Jan Ma Construction’s revenue for the second quarter of 2011 as compared to the second quarter of 2010 was attributable to the timing of Jin Ma Construction’s business as well as a turnaround in the real estate market in Hohhot which occurred in the second quarter of 2010.
Net revenues for Jin Ma Hotel’s operations decreased 1.4% for second quarter of 2011 from the second quarter of 2010 primarily due to a small decrease in sales at the hotel’s banquet and catering facility. We continue to focus on our marketing efforts to increase traffic to the hotel, to target new tour groups and local traffic to the banquet facilities.
For the three months ended December 31, 2010 and 2009, net revenues from our real estate development operations are summarized as follows:
|
|
|
|
|
|
|
Project Name |
| For the Three |
| For the Three | ||
Building 1 to 4 of Procuratorate Housing Estates |
| $ | 164,452 |
| $ | — |
Inner Mongolia Electrical Vocational Technical School |
|
| 136,144 |
|
| 158,981 |
Inner Mongolia Chemistry College |
|
| 1,804 |
|
| — |
|
|
|
|
|
|
|
Total real estate segment net revenues |
| $ | 302,400 |
| $ | 158,981 |
Cost of Revenues. Overall, cost of revenues as a percentage of net revenues decreased from 85.7% for the second quarter of 2010 to 84.7% of net revenues for the second quarter of 2011. This overall change included the following segment changes:
| · | Cost of revenues as a percentage of net revenues from Jin Ma Construction’s operation for the three months ended December 31, 2010 decreased to 86.2% from 88.0% for the second quarter of 2010. The slight decrease was mainly attributable to the slight decrease in construction materials and labor costs. |
|
|
|
| · | Cost of revenues as a percentage of net revenues for Jin Ma Hotel’s operations for the second quarter of 2011 decreased to 54.3% from 67.3% for the second quarter of 2010. The decrease in cost of sales as a percentage of net revenues was primarily attributable to the better management of raw material costs. |
37
| · | Cost of revenues for Jin Ma Real Estate’s operation as a percentage of net real estate revenues for the second quarter of 2011 decreased to 79.9% from 105.1% for the second quarter of 2010. In the second quarter of 2011, 45.0% of revenues for our real estate development operation related to the Vocational School and 0.6% of revenues for our real estate development operation related to the Chemistry School and 54.4% was attributable to the cost of our remaining units of real estate held for sale. In the second quarter of 2010, 100% of revenues for our real estate development operation was attributable to the Vocational School and was recognized on the installment method which apportions each cash receipt and principal payment by the buyer between cost recovered and profit. The different revenue mix in the second quarter of 2011 had an effect of lowering cost of sales as a percentage of revenues as compared to the second quarter of 2010. |
Gross Profit. Gross profit increased 230.5% for the second quarter of 2011 from the second quarter of 2010. Gross profit margin increased from 14.3% for the second quarter of 2010 to 15.3% for the second quarter of 2011. The increase in gross profit was attributable to an increase in revenues generated from Jin Ma Construction and Jin Ma Real Estate.
Total Operating Expenses. For the second quarter of 2011, overall operating expenses decreased 16.4% from the second quarter of 2010. This decrease was mainly due to a decrease in other hotel operating expenses, an increase in bad debt recovery offset by an increase in salaries and employee benefits, and an increase in selling, general and administrative expenses.
Other Hotel Operating Expenses. Other hotel operating expenses represent costs and expenses associated with operating Jin Ma Hotel's restaurant and banquet facilities and hotel operating expenses except for food and beverage costs which have been included in cost of revenues. Other hotel operating expenses decreased 84.0% for the second quarter of 2011 from the second quarter of 2010. Other hotel operating expenses were 1.7% of hotel revenues for the second quarter of 2011 as compared to 10.4% for the second quarter of 2010. The decrease in other hotel operating expenses for the second quarter of 2011 is primarily attributable to a decrease in expenditures related to the purchase of low cost items such as plates, glasses which were expensed during the second quarter of 2010, the period these items were put in use.
Bad Debt (Recovery) Expenses. For the second quarter of 2011, bad debt recovery income amounted to $188,120 as compared to bad debt recovery income of $97,564 for the second quarter of 2010, an increase of $90,556 or 92.8% and relates to the collection of aged receivable balances previously written off.
Salaries and Employee Benefits. For the second quarter of 2011, salaries and employee benefits increased 4.5% as compared to the second quarter of 2010. This slight increase is primarily related to the increase in employee salaries.
Depreciation. For the second quarter of 2011, depreciation increased 3.4% as compared to the second quarter of 2010. This slight increase was primarily due to our newly purchased fixed assets for which we recorded depreciation in the 2011 period.
Selling, General and Administrative Expenses. Selling, general and administrative expenses increased 60.8% for the second quarter of 2011 compared to the second quarter of 2010. The increase was primarily attributable to the increase in professional fees paid for business development and planning of $90,000 offset by a decrease in other selling, general and administrative expenses of approximately$28,000.
Total Other Income (Expenses). In the second quarter of 2011, we recorded other income of $426,958 as compared to other income of $1,673,520 in the second quarter of 2010. In the second quarter of 2011 and 2010, other income (expenses) primarily consisted of the following:
| · | in the second quarter of 2011, we did not record any gain on extinguishment of derivative liabilities as compared to a gain of $561,602 related to the conversion and repayment of convertible debt in the second quarter of 2010; |
|
|
|
| · | in the second quarter of 2011, we recorded a gain on change in fair value of derivative liabilities of $121,612 related to the change in fair value of derivative liabilities associated with warrants as compared to $1,314,381 related to the change in fair value of derivative liabilities associated with warrants and the embedded conversion option on convertible debt in the second quarter of 2010; |
|
|
|
| · | in the second quarter of 2011, we recorded interest income of $431,248 as compared to interest income of $543,092 in the second quarter of 2010, a decrease of $111,844. In the second quarter of 2011, we recorded interest income from the collection of the partial annual payment from the Vocational School while in the second quarter of 2010, we recorded interest income from the collection of the whole annual payment from the Vocational School; and |
38
| · | in the second quarter of 2011, we recorded interest expense of $125,960 as compared to $745,695 in the second quarter of 2010, a decrease of $619,735 or 83.1% which was attributable to a decrease in interest expense from the debt discount of approximately $598,000, a decrease in interest of approximately $30,000 from the convertible debt and a decrease in interest of approximately $42,000 from the loan payable offset by the increase in interest expenses caused by the write-off of penalty of $50,000. |
Provision for Income Taxes. Total provision for income taxes increased 714.4% in the second quarter of 2011 (25.5% of income before income taxes) from the second quarter of 2010 (4.1% of income before income taxes). The increase in the provision for income taxes was attributable to an increase in income before income taxes related to our Chinese subsidiaries and the VIEs. The increase in the provision for income taxes as a percentage of income before income taxes was attributable to the effect of our U.S. net losses on our overall effective tax rate for the second quarter of 2011 as compared to the effect of our U.S. net gains on our overall effective tax rate for the second quarter of 2010.
Net Income. Net income increased 0.7% for the second quarter of 2011 from the second quarter of 2010. This increase was primarily attributable to an increase in revenues and related gross profits, a decrease in operating expenses offset by a decrease in other income and an increase in provision for income taxes as described above. This translates to basic net income per common share of $0.97 and $1.22, and diluted net income per common share of $0.96 and $1.22, for the three months ended December 31, 2010 and 2009, respectively.
Comprehensive Income. For the second quarter of 2011, we reported unrealized gain on foreign currency translation of $529,724 as compared to $1,716 for the second quarter of 2010 which reflects the effect of the declining value of the U.S. dollar. As a result of this non-cash foreign currency translation gain, we reported comprehensive income of $2,425,554 for the second quarter of 2011 as compared to comprehensive income of $1,884,196 for the second quarter of 2010.
Liquidity and Capital Resources
Liquidity is the ability of a company to generate adequate amounts of cash to meet its needs for cash. Our principal liquidity demands are based on the capital needs of the Jin Ma Companies related to the development of new properties, land use right acquisitions, and our general corporate purposes. We do not have any external sources of liquidity. The Jin Ma Companies have historically relied on bank loans and advances from related parties to supplement their working capital.
At December 31, 2010, we had a cash balance of $594,349, substantially all of which is located in financial institutions in China under the control of the Jin Ma Companies.
Our working capital increased by $4,234,456 to $3,695,114 at December 31, 2010 from a working capital deficit balance of $539,342 at June 30, 2010. This increase in working capital is primarily attributable to:
| · | An increase in cash and cash equivalents of $284,353, |
| · | An increase in accounts receivable, net of allowance for doubtful accounts, of $4,084,679, |
| · | An increase in notes receivable on sales type lease – current portion of $545,672, |
| · | An increase in other receivables, net of allowance for doubtful accounts, of $86,876, |
| · | An increase in construction in progress – current portion of $14,246,384, |
| · | A decrease in accrued expenses of $77,352, |
| · | A decrease in taxes payable of $437,566, |
| · | A decrease in derivative liability of $157,092, |
| · | A decrease in billings in excess of costs and estimated earnings of $89,475, |
Offset by:
| · | A decrease in prepaid expenses of $167,827, |
| · | A decrease in cost and estimated earnings in excess of billings of $40,628, |
| · | A decrease in real estate held for sale of $166,403, |
| · | A decrease in deferred tax assets of $41,763, |
| · | An increase in loans payable – current portion of $92,024, |
| · | An increase in accounts payable of $14,941,307 associated with the increase in construction in progress, |
| · | An increase in due to related parties of $276,270, |
| · | An increase in advances from customers of $46,482. |
39
Our balance sheet at December 31, 2010 reflects loans payable to third parties of $3,501,316 due through September 2012 which were working capital loans made to the Jin Ma Companies by third parties. These loans bear annual interest rates ranging from 11.16% to 24% and are due between March 2011 and September 2012. Of this amount, approximately $3.0 million is secured by the assets of the Jin Ma Hotel and the remaining balances are unsecured. These loans generally can be renewed with the respective parties when the loans mature.
The Jin Ma Companies intend to meet their liquidity requirements, including capital expenditures related to the purchase of land for the development of future projects, through cash flow provided by operations, and from the collection of outstanding accounts and notes receivable balances. Additionally, during the first half of fiscal 2011, the Jin Ma Companies received advances from a company owned by our chief executive officer of approximately $265,000 which was used for working capital purposes. Upon acquiring land for future developments, the Jin Ma Companies intend to raise funds to develop its projects by the presale of units and by obtaining financing mainly from local banking institutions with which it has done business in the past. We also expect to fund projects through related party advances, from the collection of previous accounts receivable and from progress billings. We believe that the relationships with these banks are in good standing and that the Jin Ma Companies’ real estate will secure the loans needed. We estimate that the Jin Ma Companies will have sufficient cash flow from operations to satisfy their working capital needs and to fund their operations for the next 12 months from the collection of their outstanding accounts and notes receivable. However, any delay in the collection of the receivables would have an adverse effect on their ability to fund their working capital requirements. In addition, the PRC central government unexpectedly raised the benchmark interest rate in an effort to address the rapidly growing real estate market and housing price inflation. While the rise in interest rates will increase the Jin Ma Companies’ borrowing costs, the Jin Ma Companies are unable to anticipate at this time what additional impact, if any, the PRC government’s monetary policies will have on its business.
The Jin Ma Companies have $3.0 million of debt which becomes due by May 2011 and the majority of which is collateralized by the assets of the Jin Ma Hotel. The Jin Ma Companies do not presently have sufficient capital to satisfy this obligation. While the Jin Ma Companies believe they will be able to restructure this debt to extend the due date, if they are unable to do so, or to otherwise refinance the amount, a risk exists that this debt could be foreclosed upon which would deprive the Jin Ma Companies of revenue associated with this company and would materially adversely impact our results of operations in future periods.
We require working capital to pay general and administrative expense, including audit, legal and related fees, associated with our reporting obligations under the Securities Exchange Act of 1934. Other than the management fees which are due us by the Jin Ma Companies, we do not presently have any other source of working capital. At December 31, 2010, we were owed approximately $24.6 million by the Jin Ma Companies. We continue to be reliant on the Jin Ma Companies to pay the service fees due us and/or to repay all or a portion of the funds advanced to the Jin Ma Companies. Even if the Jin Ma Companies pay all the past due amounts to us, it is possible that the Jin Ma Companies will continue to fail to timely pay our management fees. Although we have received funds from the Jin Ma Companies to fund our operation during the first half of fiscal 2011, if the quarterly service fees due us under the Contractual Arrangement are not paid to us on a timely basis, it is possible that we will not have sufficient funds to pay our operating expenses in future periods, our ability to continue as a going concern is in jeopardy and investors could lose their entire investment in our company.
Operating Activities
Net cash flow provided by operating activities was $84,584 for the six months ended December 31, 2010 as compared to net cash used in operating activities of $2,125,742 for the six months ended December 31, 2009, an increase of $2,210,326.
For the six months ended December 31, 2010, net cash flow provided by operating activities was primarily attributable to:
| · | net income of $2,810,095 adjusted for the add-back of non-cash items such as depreciation of $392,437, stock-based compensation of $116,094, warrants issued for service of $31,188, and the reduction of net income for non-cash items such as bad debt recovery of $195,612, and a gain on changes in fair value of derivative liabilities of $157,092 and; |
|
|
|
| · | the receipt of cash from operations from changes in operating assets and liabilities such as: |
| • | a decrease in notes receivable of $318,298 due to the collections of annual payments due; |
|
|
|
| • | a decrease in prepaid expenses of $169,253; |
|
|
|
| • | a decrease in costs and estimated earnings in excess of billings of $42,700; |
|
|
|
| • | a decrease in real estate held for sale of $174,377 attributable to the sale of units; |
40
| • | an increase in accounts payable and accrued expenses of $14,562,314 related to an increase in amounts due to subcontractors which will be paid upon the collection of the related accounts receivable; and |
|
|
|
| • | an increase in advances from customers of $41,475. |
| · | offset by the use of cash from changes in operating assets and liabilities such as: |
| • | an increase in accounts receivable of $3,597,076, |
|
|
|
| • | an increase in other receivable of $77,145, and |
|
|
|
| • | an increase in construction in progress of $14,009,349 related primarily to Jin Ma Real Estate’s Shuian Renjia residential project, |
|
|
|
| • | a decrease in taxes payable of $450,871 primarily related to payments made, and |
|
|
|
| • | a decrease in billings in excess of costs and estimated earnings of $90,626. |
For the six months ended December 31, 2009, net cash flow used in operating activities was primarily due to:
| · | the adjustments of non-cash items such as bad debt recovery of $105,555, a gain on sale of land use right of $449,472, a gain from debt extinguishment of $1,623,209 and a gain on change in fair value of derivative liabilities of $2,002,937 and offset by net income of $2,721,270 which was adjusted for the non-cash items such as depreciation of $385,121 and interest expense from amortization of debt discount of $1,931,611; and |
|
|
|
| · | the use of cash from changes in operating assets and liabilities such as: |
| • | an increase in accounts receivable of $409,136; |
|
|
|
| • | an increase in construction in progress of $2,746,228; |
|
|
|
| • | a decrease in accounts payable and accrued expenses of $2,310,257; and |
|
|
|
| • | a decrease in taxes payable of $1,452,604 primarily related to payments made; |
| · | offset by the receipt of cash from changes in operating assets and liabilities such as: |
| • | a decrease in notes receivable of $158,067; |
|
|
|
| • | a decrease in other receivables of $1,176,271; and |
|
|
|
| • | an increase in advances from customers of $2,621,660. |
Investing Activities
Net cash flow used in investing activities was $41,033 for the six months ended December 31, 2010 as compared to cash provided by investing activities of $2,161,621 for the six months ended December 31, 2009. For the six months ended December 31, 2010, we spent cash of $41,033 on purchase of property and equipment. For the six months ended December 31, 2009, cash provided by investing activities consisted of proceeds from sale of land use right of $2,193,441 offset by $31,820 cash used for purchase of property and equipment.
Financing Activities
Net cash flow provided by financing activities was $227,746 for the six months ended December 31, 2010 which was attributable to proceeds from advances from related party of $264,928 offset by repayment of loans payable of $37,182. Net cash flow provided by financing activities was $293,501 for the six months ended December 31, 2009 which was attributable to proceeds from advances from related party of $1,203,780 offset by repayment of loan payable of $146,229 and repayment of convertible debt of $764,050.
41
Contractual Obligations and Off-Balance Sheet Arrangements
Contractual Obligations
Jin Ma Real Estate guarantees a customer’s mortgage until the home and the title of ownership are delivered to the customer. If a property buyer defaults under the loan, Jin Ma Real Estate is required, during the guarantee period, to repay all debt owed by the defaulting property buyer to the mortgage bank. Jin Ma Real Estate’s liability for guarantor’s obligation is valued based on the actual outstanding mortgage amount at each reporting period. For the six months ended December 31, 2010 and 2009, the liability for guarantor’s obligation was not material and Jin Ma Real Estate has not suffered any losses.
The Jin Ma Companies have certain fixed contractual obligations and commitments that include future estimated payments. Changes in its business needs, cancellation provisions, changing interest rates, and other factors may result in actual payments differing from the estimates. We cannot provide certainty regarding the timing and amounts of payments. We have presented below a summary of the most significant assumptions used in the determination of amounts presented in the tables, in order to assist in the review of this information within the context of our consolidated financial position, results of operations, and cash flows.
The following tables summarize the Jin Ma Companies’ contractual obligations as of December 31, 2010, and the effect these obligations are expected to have on our liquidity and cash flows in future periods.
| Payments Due by Period | |||||||||||||
| Total |
| Less than 1 year |
| 1-3 Years |
| 4-5 Years |
| 5 Years + | |||||
Contractual Obligations : |
|
|
|
|
|
|
|
|
| |||||
Bank and other third-party Indebtedness | $ | 3,501,316 |
| $ | 3,183,702 |
| $ | 317,614 |
|
| — |
|
| — |
Total Contractual Obligations: | $ | 3,501,316 |
| $ | 3,183,702 |
| $ | 317,614 |
|
| — |
|
| — |
Off-balance Sheet Arrangements
Neither we nor the Jin Ma Companies have entered into any other financial guarantees or other commitments to guarantee the payment obligations of any third parties other than the guarantee of mortgages for Jin Ma Real Estate’s customers in the normal course of business. For the six months ended December 31, 2010 and 2009, the liability for guarantor’s obligation was not material and Jin Ma Real Estate has not incurred any losses related to the guarantee of mortgages. We have not entered into any derivative contracts that are indexed to our shares and classified as shareholder’s equity or that are not reflected in our consolidated financial statements. Furthermore, we do not have any retained or contingent interest in assets transferred to an unconsolidated entity that serves as credit, liquidity or market risk support to such entity. We do not have any variable interest in any unconsolidated entity that provides financing, liquidity, market risk or credit support to us or engages in leasing or hedging services with us.
|
|
ITEM 3. | QUANTITATIVE AND QUALITATIVE DISCLOSURES ABOUT MARKET RISK. |
Not applicable to a smaller reporting company.
|
|
ITEM 4. | CONTROLS AND PROCEDURES |
Disclosure Controls and Procedures
As required by Rule 13a-15 under the Securities Exchange Act of 1934, as of December 31, 2010, the end of the period covered by this report, our management concluded its evaluation of the effectiveness of the design and operation of our disclosure controls and procedures. Disclosure controls and procedures refer to controls and other procedures designed to ensure that information required to be disclosed in the reports we file or submit under the Securities Exchange Act of 1934 is recorded, processed, summarized and reported within the time periods specified in the rules and forms of the SEC and that such information is accumulated and communicated to our management, including our Chief Executive Officer and Chief Financial Officer, to allow timely decisions regarding required disclosure.
42
Our management does not expect that our disclosure controls and procedures will prevent all error and all fraud. A control system, no matter how well designed and operated, can provide only reasonable, not absolute, assurance that the control system’s objectives will be met. Further, the design of a control system must reflect the fact that there are resource constraints, and the benefits of controls must be considered relative to their costs. Because of the inherent limitations in all control systems, no evaluation of controls can provide absolute assurance that all control issues and instances of fraud, if any, have been detected. These inherent limitations include the realities that judgments in decision-making can be faulty, and that breakdowns can occur because of simple error or mistake. The design of any system of controls is based in part upon certain assumptions about the likelihood of future events, and there can be no assurance that any design will succeed in achieving its stated goals under all potential future conditions.
Management conducted its evaluation of disclosure controls and procedures at December 31, 2010 under the supervision of our Chief Executive Officer and our Chief Financial Officer. Based on that evaluation, Messrs. Yang and Wasserman concluded that because of the continuing material weaknesses in internal control over financial reporting described below, our disclosure controls and procedures were not effective as of December 31, 2010.
During the assessment of the effectiveness of internal control over financial reporting as of June 30, 2010, our management identified material weaknesses related to:
| · | our failure to properly record certain common stock purchase warrants and conversion options related to convertible debt as derivative liabilities and our failure to properly record the subsequent accounting for the changes in the fair value of the associated liabilities at September 30, 2009, December 31, 2009 and March 31, 2010 , |
|
|
|
| · | the lack of U.S. GAAP expertise of the Jin Ma Companies’ internal accounting staff, |
|
|
|
| · | the lack of our internal audit functions, |
|
|
|
| · | the absence of an Audit Committee as of June 30, 2010, and |
|
|
|
| · | a lack of segregation of duties within accounting functions. |
As a result of these material weaknesses, our Chief Executive Officer and Chief Financial Officer concluded that our internal control over financial reporting was not effective as of June 30, 2010. A material weakness is a deficiency, or a combination of deficiencies, in internal control over financial reporting, such that there is a reasonable possibility that a material misstatement of our annual or interim financial statements will not be prevented or detected on a timely basis. A significant deficiency is a deficiency, or a combination of deficiencies, in internal control over financial reporting that is less severe than a material weakness; yet important enough to merit attention by those responsible for oversight of the company’s financial reporting.
While we have made certain changes in our internal control over financial reporting during the six months ended December 31, 2010 to remediate the weakness associated with the recording of derivative liabilities, we have not remediated the remaining material weaknesses cited at June 30, 2010. In order to correct these material weaknesses, we have committed to the establishment of effective internal audit functions and the addition of accounting staff at the Jin Ma Companies with the proper expertise. We will also implement changes to our internal controls to ensure that derivative liabilities are properly recorded in future periods. We have began our search for additional accounting staff with assistance from recruiters and through referrals, however, due to the scarcity of qualified candidates with extensive experience in U.S. GAAP reporting and accounting in the region in which the Jin Ma Companies conduct operations, we were not able to hire sufficient internal audit resources before the end of December 31, 2010. However, during fiscal 2011 we will increase our search for qualified candidates with assistance from recruiters and through referrals.
We believe that the foregoing steps will remediate the material weaknesses identified above, and we will continue to monitor the effectiveness of these steps and make any changes that our management deems appropriate. Until we are able to hire the proper accounting staff it is unlikely we will be able to remediate these material weaknesses in our internal control over financial reporting.
Changes in Internal Control over Financial Reporting
During the period covered by this report, we enhanced our internal control procedures to ensure that we properly record certain common stock purchase warrants and conversion options related to convertible debt as derivative liabilities and properly record the subsequent accounting for the changes in the fair value of the associated liabilities in accordance with U.S. GAAP. These changes specifically addressed the material weaknesses in our internal control over the recording derivative liabilities. Other than this change in our internal control over financial reporting, there have been no changes in our internal control over financial reporting during the six months ended December 31, 2010 that has materially affected, or is reasonably likely to materially affect, our internal control over financial reporting.
43
PART II – OTHER INFORMATION
ITEM 1. | LEGAL PROCEEDINGS. |
None.
ITEM 1A. | RISK FACTORS. |
Not applicable to a smaller reporting company.
ITEM 2. | UNREGISTERED SALES OF EQUITY SECURITIES AND USE OF PROCEEDS. |
On December 10, 2010, we issued an aggregate of 50,000 shares of our common stock to our chief executive officer and our chief financial officer for services rendered by them. The shares were valued at $3.45 per share based on the fair value on the date of grant. In connection with the issuance of these shares, we recorded compensation expenses of $115,000 and reduced accrued expenses of $57,500.
On December 10, 2010, we issued 3,750 shares of its common stock to its five directors for services rendered by them. The shares were valued at $3.45 per share based on the fair value on the date of grant. In connection with the issuance of these shares, we reduced accrued expenses of $12,938.
On December 10, 2010, we issued 750 shares of its common stock to a director for services rendered and to be rendered by him. The shares were valued at $3.45 per share based on the fair value on the date of grant. In connection with the issuance of these shares, we recorded compensation expenses of $1,094, reduced accrued expenses of $250 and recorded prepaid expenses of $1,244 which will be amortized over the remaining service period.
These issuances were exempt from registration under the Securities Act of 1933 in reliance on an exemption provided by Section 4(2) of that Act,. Each person to whom the shares were issued was an accredited investor and acquired the shares for investment and not with a view to the sale or distribution and received information concerning us, our business and our financial condition, and the stock certificates bear an investment legend. No brokerage fees were paid in connection with any of these stock issuances.
ITEM 3. | DEFAULTS UPON SENIOR SECURITIES. |
None.
ITEM 4. | (REMOVED AND RESERVED). |
None.
ITEM 5. | OTHER INFORMATION. |
None.
ITEM 6. | EXHIBITS. |
Rule 13a-14(a)/15d-14(a) certification of Chief Executive Officer | |
Rule 13a-14(a)/15d-14(a) certificate of Chief Financial Officer | |
Section 1350 certification of Chief Executive Officer | |
Section 1350 certification of Chief Financial Officer |
44
SIGNATURES
Pursuant to the requirements of the Securities Exchange Act of 1934, the registrant has duly caused this report to be signed on its behalf by the undersigned thereunto duly authorized.
| Gold Horse International, Inc. |
|
|
Date: February 22, 2011 | By: /s/ Liankuan Yang |
| Liankuan Yang |
| Chief Executive Officer, principal executive officer |
|
|
Date: February 22, 2011 | By: /s/ Adam Wasserman |
| Adam Wasserman |
| Chief Financial Officer, principal financial and accounting officer |
45