Attached files
Table of Contents
UNITED STATES
SECURITIES AND EXCHANGE COMMISSION
Washington, D.C. 20549
FORM 10-K
| x | ANNUAL REPORT PURSUANT TO SECTION 13 OR 15(d) OF THE SECURITIES EXCHANGE ACT OF 1934 |
For the fiscal year ended December 31, 2010
OR
| ¨ | TRANSITION REPORT PURSUANT TO SECTION 13 OR 15(d) OF THE SECURITIES EXCHANGE ACT OF 1934 |
For the transition period from to
Commission File Number 1-8174
DUCOMMUN INCORPORATED
(Exact name of registrant as specified in its charter)
| Delaware | 95-0693330 | |
| (State or other jurisdiction of incorporation or organization) |
I.R.S. Employer Identification No. | |
| 23301 Wilmington Avenue, Carson, California | 90745-6209 | |
| (Address of principal executive offices) | (Zip code) | |
Registrant’s telephone number, including area code: (310) 513-7200
Securities registered pursuant to Section 12(b) of the Act:
| Title of each class |
Name of each exchange on which registered | |
| Common Stock, $.01 par value | New York Stock Exchange |
Securities registered pursuant to Section 12(g) of the Act:
None
(Title of class)
Indicate by check mark if the registrant is a well-known seasoned issuer, as defined in Rule 405 of the Securities Act. Yes ¨ No x
Indicate by check mark if the registrant is not required to file reports pursuant to Section 13 or Section 15(d) of the Act. Yes ¨ No x
Indicate by check mark whether the registrant (1) has filed all reports required to be filed by Section 13 or 15(d) of the Securities Exchange Act of 1934 during the preceding 12 months (or for such shorter period that the registrant was required to file such reports), and (2) has been subject to such filing requirements for the past 90 days. Yes x No ¨
Indicate by check mark whether the registrant has submitted electronically and posted on its corporate Web site, if any, every Interactive Data File required to be submitted and posted pursuant to Rule 405 of Regulation S-T (§232.405 of this chapter) during the preceding 12 months (or for such shorter period that the registrant was required to submit and post such files). Yes x No ¨
Indicate by check mark if disclosure of delinquent filers pursuant to Item 405 of Regulation S-K (§229.405 of this chapter) is not contained herein, and will not be contained, to the best of registrant’s knowledge, in definitive proxy or information statements incorporated by reference in Part III of this Form 10-K or any amendment to this Form 10-K. ¨
Indicate by check mark whether the registrant is a large accelerated filer, an accelerated filer, a non-accelerated filer or a smaller reporting company. See the definitions of “large accelerated filer”, “accelerated filer” and “smaller reporting company” in Rule 12b-2 of the Exchange Act.
| Large accelerated filer |
¨ |
Accelerated filer |
x | |||
| Non-accelerated filer |
¨ |
Smaller reporting company |
¨ | |||
Indicate by check mark whether the registrant is a shell company (as defined in Rule 12b-2 of the Exchange Act). Yes ¨ No x
The aggregate market value of the voting and nonvoting common equity held by nonaffiliates computed by reference to the price of which the common equity was last sold, or the average bid and asked price of such common equity, as of the last business day of the registrant’s most recently completed second fiscal quarter ended July 3, 2010 was approximately $201 million.
The number of shares of common stock outstanding on January 31, 2011 was 10,507,143.
DOCUMENTS INCORPORATED BY REFERENCE
The following documents are incorporated by reference:
(a) Proxy Statement for the 2011 Annual Meeting of Shareholders (the “2011 Proxy Statement”), incorporated partially in Part III hereof.
Table of Contents
FORWARD-LOOKING STATEMENTS AND RISK FACTORS
Certain statements in the Form 10-K and documents incorporated by reference contain forward-looking statements within the meaning of Section 27A of the Securities Act of 1933, as amended, and Section 21E of the Securities Exchange Act of 1934, as amended. Any such forward-looking statements involve risks and uncertainties. The Company’s future financial results could differ materially from those anticipated due to the Company’s dependence on conditions in the airline industry, the level of new commercial aircraft orders, production rates for Boeing commercial aircraft, the C-17 aircraft and Apache helicopter rotor blade programs, the level of defense spending, competitive pricing pressures, manufacturing inefficiencies, start-up costs and possible overruns on new contracts, technology and product development risks and uncertainties, product performance, risks associated with acquisitions and dispositions of businesses by the Company, increasing consolidation of customers and suppliers in the aerospace industry, possible goodwill impairment, and other factors beyond the Company’s control. See the “Management’s Discussion and Analysis of Financial Condition and Results of Operations,” “Risk Factors,” and other matters discussed in this Form 10-K.
2
Table of Contents
PART I
| ITEM 1. | BUSINESS |
GENERAL
Ducommun Incorporated (“Ducommun” or the “Company”), is the successor to a business founded in California in 1849, first incorporated in California in 1907, and reincorporated in Delaware in 1970. Ducommun, through its subsidiaries, designs, engineers and manufactures aerostructure and electromechanical components and subassemblies, and provides engineering, technical and program management services principally for the aerospace industry. These components, assemblies and services are provided principally for domestic and foreign commercial and military aircraft, helicopter, missile and space programs.
Domestic commercial aircraft programs include the Boeing 737NG, 747, 767, 777 and 787. Foreign commercial aircraft programs include the Airbus Industrie A330 and A340 aircraft, Bombardier business and regional jets, and the Embraer 145 and 170/190. Major military programs include the Boeing C-17, F-15 and F-18 and Lockheed Martin F-16, F-22 and F-35 aircraft, and various aircraft and shipboard electronics upgrade programs. Commercial and military helicopter programs include helicopters manufactured by Boeing (principally the Apache and Chinook helicopters), United Technologies, Bell, Augusta and Carson. The Company also supports various unmanned space launch vehicle and satellite programs.
On December 23, 2008, the Company acquired DynaBil Industries, Inc. (“DynaBil”), a privately-owned company based in Coxsackie, New York for $45,386,000 (net of cash acquired and excluding acquisition costs) and subsequently changed its name to Ducommun AeroStructures New York Inc. (“DAS-New York”). DAS-New York is a leading provider of titanium and aluminum structural components and assemblies for commercial and military aerospace applications. The acquisition was funded from internally generated cash, notes to the sellers, and borrowings of approximately $10,500,000 under the Company’s credit agreement. The cost of the acquisition was allocated on the basis of the estimated fair value of the assets acquired and liabilities assumed. The operating results for the acquisition have been included in the consolidated statements of income since the date of the acquisition.
On September 1, 2006, the Company acquired CMP, a privately-owned company based in Newbury Park, California for $13,804,000 (net of cash acquired and excluding acquisition costs). CMP manufactures incandescent, electroluminescent and LED edge lit panels and assemblies for the aerospace and defense industries. The cost of the acquisition was allocated on the basis of the estimated fair value of the assets acquired and liabilities assumed. The acquisition broadens the Company’s lighted human machine interface product line. The acquisition was funded from notes to the sellers, and borrowings of approximately $10,800,000 under the Company’s credit agreement. The operating results for this acquisition have been included in the consolidated statements of income since the date of the acquisition.
On May 10, 2006, the Company acquired WiseWave, a privately-owned company based in Torrance, California for $6,827,000 (net of cash, including assumed indebtedness and excluding acquisition costs). WiseWave manufactures microwave and millimeterwave products for both aerospace and non-aerospace applications. The acquisition broadens the Company’s
3
Table of Contents
microwave product line and adds millimeterwave products to its offerings. The cost of the acquisition was allocated on the basis of the estimated fair value of the assets acquired and liabilities assumed. The acquisition was funded from notes to the sellers, and borrowings of approximately $5,100,000 under the Company’s credit agreement. The operating results for this acquisition have been included in the consolidated statements of income since the date of the acquisition.
On January 6, 2006, the Company acquired Miltec, a privately-owned company based in Huntsville, Alabama for $46,811,000 (net of cash, including assumed indebtedness and excluding acquisition costs). Miltec provides engineering, technical and program management services (including design, development, integration and test of prototype products) principally for aerospace and military markets. The acquisition provided the Company a platform business with leading-edge technology in a large and growing market with substantial design engineering capability. The cost of the acquisition was allocated on the basis of the estimated fair value of the assets acquired and liabilities assumed. The acquisition was funded from internally generated cash, notes to the sellers, and borrowings of approximately $24,000,000 under the Company’s credit agreement. The operating results for this acquisition have been included in the consolidated statements of income since the date of the acquisition.
PRODUCTS AND SERVICES
Ducommun operates in two business segments: Ducommun AeroStructures, Inc. (“DAS”), which engineers and manufactures aerospace structural components and subassemblies, and Ducommun Technologies, Inc. (“DTI”), which designs, engineers and manufactures electromechanical components and subassemblies, and provides engineering, technical and program management services (including design, development, integration and test of prototype products) principally for the aerospace and military markets. DAS provides aluminum stretch-forming, titanium and aluminum hot-forming, machining, composite lay-up, metal bonding, and chemical milling services principally for domestic and foreign commercial and military aircraft, helicopter and space programs. DTI designs and manufactures illuminated push button switches and panels, microwave and millimeterwave switches and filters, fractional horsepower motors and resolvers, and mechanical and electromechanical subassemblies, and provides engineering, technical and program management services. Components and assemblies are provided principally for domestic and foreign commercial and military aircraft, helicopter and space programs as well as selected nonaerospace applications. Engineering, technical and program management services are provided principally for advanced weapons and missile defense systems.
Business Segment Information
The Company supplies products and services to the aerospace industry. The Company’s subsidiaries are organized into two strategic businesses (DAS and DTI), each of which is a reportable operating segment. The accounting policies of the Company and its two segments are the same.
4
Table of Contents
Ducommun AeroStructures, Inc.
Stretch-Forming, Hot-Forming and Machining
DAS supplies the aerospace industry with engineering and manufacturing of complex components using stretch-forming and hot-forming processes and computer-controlled machining. Stretch-forming is a process for manufacturing large, complex structural shapes primarily from aluminum sheet metal extrusions. DAS has some of the largest and most sophisticated stretch-forming presses in the United States. Hot-forming is a metal working process conducted at high temperature for manufacturing close-tolerance titanium and aluminum components. DAS designs and manufactures the tooling required for the production of parts in these forming processes. Certain components manufactured by DAS are machined with precision milling equipment, including three 5-axis gantry profile milling machines and seven 5-axis numerically-controlled routers to provide computer-controlled machining and inspection of complex parts up to 100 feet long.
Composites and Metal Bonding
DAS engineers and manufactures metal, fiberglass and carbon composite aerostructures. DAS produces helicopter main and tail rotor blades, and adhesive bonded assemblies, including spoilers, winglets, and fuselage structural panels for aircraft.
Chemical Milling
DAS is a major supplier of close tolerance chemical milling services for the aerospace industry. Chemical milling removes material in specific patterns to reduce weight in areas where full material thickness is not required. This sophisticated etching process enables DAS to produce lightweight, high-strength designs that would be impractical to produce by conventional means. DAS offers production-scale chemical milling on aluminum, titanium, steel, nickel-base and super alloys. Jet engine components, wing leading edges and fuselage skins are examples of products that require chemical milling.
Ducommun Technologies, Inc.
Panels, Switches and Related Components
DTI develops, designs and manufactures illuminated switches, switch assemblies, keyboard panels, and edge lit panels, used in many military and commercial aircraft, helicopter, and space programs. DTI manufactures switches and panels where high reliability is a prerequisite. DTI also develops, designs and manufactures microwave and millimeterwave switches, filters, and other components used principally on commercial and military aircraft and satellites. In addition, DTI develops, designs and manufactures high precision actuators, stepper motors, fractional horsepower motors and resolvers principally for space and oil service applications, and microwave and millimeterwave products for certain non-aerospace applications.
5
Table of Contents
Mechanical and Electromechanical Subassemblies
DTI is a leading manufacturer of mechanical and electromechanical subassemblies for the defense electronics and commercial aircraft markets. DTI has a fully integrated manufacturing capability, including manufacturing engineering, fabrication, machining, assembly, electronic integration and related processes. DTI’s products include sophisticated radar enclosures, gyroscopes and indicators, aircraft avionics racks, and shipboard communications and control enclosures.
Engineering, Technical and Program Management Services
DTI (through its Miltec subsidiary) is a leading provider of missile and aerospace systems design, development, integration and testing. Engineering, technical and program management services are provided principally for advanced weapons systems and missile defense primarily for United States defense, space and homeland security programs.
SALES AND MARKETING
Military components manufactured by the Company are employed in many of the country’s front-line fighters, bombers, helicopters and support aircraft, as well as sea-based applications. Engineering, technical and program management services are provided principally for United States defense, space and homeland security programs. The Company’s defense business is diversified among a number of military manufacturers and programs. In the space sector, the Company continues to support various unmanned launch vehicle and satellite programs. Sales related to military and space programs were approximately 60% of sales in 2010, 64% of total sales in 2009 and 61% of total sales in 2008.
Many of the Company’s contracts covering defense and space programs are subject to termination at the convenience of the customer (as well as for default). In the event of termination for convenience, the customer generally is required to pay the costs incurred by the Company and certain other fees through the date of termination.
The Company’s commercial business is represented on many of today’s major commercial aircraft. Sales related to commercial business were approximately 40% of total sales in 2010, 36% of total sales in 2009 and 39% of total sales in 2008. The Company’s commercial sales depend substantially on aircraft manufacturers’ production rates, which in turn depend upon deliveries of new aircraft. Deliveries of new aircraft by aircraft manufacturers are dependent on the financial capacity of the airlines and leasing companies to purchase the aircraft. Sales of commercial aircraft could be affected as a result of changes in new aircraft orders, or the cancellation or deferral by airlines of purchases of ordered aircraft. The Company’s sales for commercial aircraft programs also could be affected by changes in its customers’ inventory levels and changes in its customers’ aircraft production build rates.
MAJOR CUSTOMERS
The Company had substantial sales to Boeing, Raytheon, United Technologies and the United States government. During 2010, sales to Boeing were $107,466,000, or approximately 26% of total sales; sales to Raytheon were $48,198,000, or approximately 12% of total sales;
6
Table of Contents
sales to the United Technologies were $30,680,000, or approximately 8% of total sales and sales to the United States government were $16,875,000, or approximately 4% of total sales. Sales to Boeing, Raytheon, United Technologies and the United States government are diversified over a number of different programs.
INFORMATION ABOUT FOREIGN AND DOMESTIC OPERATIONS AND EXPORT SALES
In 2010, 2009, and 2008, sales to foreign customers worldwide were $37,970,000, $32,121,000 and $32,850,000, respectively. The Company has manufacturing facilities in Thailand and Mexico. The amounts of revenues, profitability and identifiable assets attributable to foreign sales activity were not material when compared with the revenue, profitability and identifiable assets attributed to United States domestic operations during 2010, 2009 and 2008. The Company had no sales to a foreign country greater than 3% of total sales in 2010, 2009 and 2008. The Company is not subject to any significant foreign currency risks since all sales are made in United States dollars.
RESEARCH AND DEVELOPMENT
The Company performs concurrent engineering with its customers and product development activities under Company-funded programs and under contracts with others. Concurrent engineering and product development activities are performed for commercial, military and space applications. The Company also performs high technology systems engineering and analysis, principally under customer-funded contracts, with a focus on sensors system simulation, engineering and integration.
RAW MATERIALS AND COMPONENTS
Raw materials and components used in the manufacture of the Company’s products, including aluminum, titanium, steel and carbon fibers, are generally available from a number of vendors and are generally in adequate supply. However, the Company, from time to time, has experienced increases in lead times for and deterioration in availability of, aluminum, titanium and certain other materials. Moreover, certain components, supplies and raw materials for the Company’s operations are purchased from single sources. In such instances, the Company strives to develop alternative sources and design modifications to minimize the potential for business interruptions.
COMPETITION
The aerospace industry is highly competitive, and the Company’s products and services are affected by varying degrees of competition. The Company competes worldwide with domestic and international companies in most markets it serves, some of which are substantially larger and have greater financial, sales, technical and personnel resources. Larger competitors offering a wider array of products and services than those offered by the Company can have a competitive advantage by offering potential customers bundled products and services that the Company cannot match. The Company’s ability to compete depends principally on the quality of its goods and services, competitive pricing, product performance, design and engineering capabilities, new product innovation and the ability to solve specific customer problems.
7
Table of Contents
PATENTS AND LICENSES
The Company has several patents, but it does not believe that its operations are dependent on any single patent or group of patents. In general, the Company relies on technical superiority, continual product improvement, exclusive product features, superior lead time, on-time delivery performance, quality and customer relationships to maintain its competitive advantage.
BACKLOG
Backlog is subject to delivery delays or program cancellations, which are beyond the Company’s control. As of December 31, 2010, backlog believed to be firm was approximately $328,045,000, compared to $367,138,000 at December 31, 2009. The reduction in year-over-year backlog is reflective of (i) late order release on C-17 and F-15 programs and (ii) declines in the engineering services business resulting from lower RDT&E budgets, reduced demand for specific engineering services as a result of increases in government in-sourcing and reduced Congressional earmarks. Approximately $225,000,000 of total backlog is expected to be delivered during 2011.
Trends in the Company’s overall level of backlog may not be indicative of trends in future sales because the Company’s backlog is affected by timing differences in the placement of customer orders and because the Company’s backlog tends to be concentrated in several programs to a greater extent than the Company’s sales.
ENVIRONMENTAL MATTERS
The Company’s business, operations and facilities are subject to numerous stringent federal, state and local environmental laws and regulations issued by government agencies, including the Environmental Protection Agency (“EPA”). Among other matters, these regulatory authorities impose requirements that regulate the emission, discharge, generation, management, transportation and disposal of hazardous materials, pollutants and contaminants. These regulations govern public and private response actions to hazardous or regulated substances that may be or have been released to the environment, and they require the Company to obtain and maintain licenses and permits in connection with its operations. The Company may also be required to investigate and remediate the effects of the release or disposal of materials at sites associated with past and present operations. Additionally, this extensive regulatory framework imposes significant compliance burdens and risks on the Company. The Company anticipates that capital expenditures will continue to be required for the foreseeable future to upgrade and maintain its environmental compliance efforts. The Company does not expect to spend a material amount on capital expenditures for environmental compliance during 2011.
The DAS chemical milling business uses various acid and alkaline solutions in the chemical milling process, resulting in potential environmental hazards. Despite existing waste recovery systems and continuing capital expenditures for waste reduction and management, at least for the immediate future, this business will remain dependent on the availability and cost of remote hazardous waste disposal sites or other alternative methods of disposal.
8
Table of Contents
DAS has been directed by California environmental agencies to investigate and take corrective action for ground water contamination at its facilities located in El Mirage and Monrovia, California. Based on currently available information, the Company has established a reserve for its estimated liability for such investigation and corrective action in the approximate amount of $1,509,000. DAS also faces liability as a potentially responsible party for hazardous waste disposed at two landfills located in Casmalia and West Covina, California. DAS and other companies and government entities have entered into consent decrees with respect to each landfill with the United States Environmental Protection Agency and/or California environmental agencies under which certain investigation, remediation and maintenance activities are being performed. Based upon currently available information, the Company has established a reserve for its estimated liability in connection with the landfills in the approximate amount of $1,090,000. The Company’s ultimate liability in connection with these matters will depend upon a number of factors, including changes in existing laws and regulations, the design and cost of construction, operation and maintenance activities, and the allocation of liability among potentially responsible parties.
In the normal course of business, Ducommun and its subsidiaries are defendants in certain other litigation, claims and inquiries, including matters relating to environmental laws. In addition, the Company makes various commitments and incurs contingent liabilities. While it is not feasible to predict the outcome of these matters, the Company does not presently expect that any sum it may be required to pay in connection with these matters would have a material adverse effect on its consolidated financial position, results of operations or cash flows.
EMPLOYEES
At December 31, 2010 the Company employed 1,815 persons. The Company’s DAS subsidiary is a party to a collective bargaining agreement, expiring July 1, 2012, with labor unions at its Monrovia, California facility covering 242 full-time hourly employees at year end 2010. If the unionized workers were to engage in a strike or other work stoppage, if DAS is unable to negotiate acceptable collective bargaining agreements with the unions, or if other employees were to become unionized, the Company could experience a significant disruption of the Company’s operations and higher ongoing labor costs and possible loss of customer contracts, which could have an adverse effect on its business and results of operations. The Company has not experienced any material labor-related work stoppage and considers its relations with its employees to be good.
AVAILABLE INFORMATION
The Company’s Internet website address is www.ducommun.com. The Company makes available through its Internet website its annual report on Form 10-K, quarterly reports on Form 10-Q, current reports on Form 8-K, and amendments to those reports as soon as reasonably practicable after filing with the Securities and Exchange Commission.
9
Table of Contents
| ITEM 1A. | RISK FACTORS |
The Company’s business, financial condition, results of operations and cash flows may be affected by known and unknown risks, uncertainties and other factors. Any of these risks, uncertainties and other factors could cause the Company’s future financial results to differ materially from recent financial results or from currently anticipated future financial results. In addition to those noted elsewhere in this report, the Company is subject to the following risks and uncertainties:
Aerospace Markets Are Cyclical
The aerospace markets in which the Company sells its products are cyclical and have experienced periodic declines. The Company’s sales are, therefore, unpredictable and tend to fluctuate based on a number of factors, including economic conditions and developments affecting the aerospace industry and the customers served.
Military and Space-Related Products Are Dependent Upon Government Spending
In 2010 approximately 60% of sales were derived from military and space markets. These markets are largely dependent upon government spending, particularly by the United States government.
These defense and space programs could be adversely affected by reductions in defense spending and other government budgetary pressures which would result in reductions, delays or stretch-outs of existing and future programs. Additionally, the Company’s contracts may be subject to reductions or modifications in the event of changes in government requirements. Although the Company’s fixed-price contracts generally permit it to realize increased profits if costs are less than projected, the Company bears the risk that increased or unexpected costs may reduce profits or cause losses on the contracts. The accuracy and appropriateness of certain costs and expenses used to substantiate the Company’s direct and indirect costs for the United States government are subject to extensive regulation and audit by the Defense Contract Audit Agency, an arm of the Department of Defense.
The Company Is Dependent on Various Aircraft and Helicopter Programs Including Boeing Commercial and Military Aircraft Programs, United Technologies (Sikorsky Blackhawk Helicopter Program) and Raytheon Military Programs
In 2010 approximately 26% of its sales were for Boeing commercial and military aircraft programs, 7% of its sales were for United Technologies (Sikorsky Blackhawk helicopter) programs and 12% of its sales were for Raytheon military aircraft programs. Any significant change in production rates for Boeing commercial and military aircraft programs, the United Technologies (Sikorsky Blackhawk helicopter) and the Raytheon military programs would have a material effect on the Company’s results of operations and cash flows. In addition, there is no guarantee that the Company’s current significant customers will continue to buy products from the Company at current levels. The loss of a key customer could have a material adverse effect on the Company.
10
Table of Contents
The Company Faces Risks Associated With Competitive Pricing Pressures
The aerospace industry is highly competitive and competitive pressures may adversely affect the Company. The Company competes worldwide with a number of domestic and international companies that are larger than it in terms of resources and market share. The Company is experiencing competitive pricing pressures in both its DAS and DTI businesses. These pressures have had, and are expected to continue to have, an adverse effect on the Company’s financial condition and operating results.
The Company Faces Risks of Cost Overruns and Losses on Fixed-Price Contracts
The Company sells many of its products under firm, fixed-price contracts providing for a fixed price for the products regardless of the production costs incurred by the Company. As a result, manufacturing inefficiencies, start-up costs and other factors may result in cost overruns and losses on contracts. The cost of producing products also may be adversely affected by increases in the cost of labor, materials, outside processing, overhead and other factors. In many cases, the Company makes multiyear firm, fixed-price commitments to its customers, without assurance the Company’s anticipated production costs will be achieved.
Risks Associated With Foreign Operations Could Adversely Impact the Company
The Company has facilities in Thailand and Mexico. Doing business in foreign countries is subject to various risks, including political instability, local economic conditions, foreign currency fluctuations, foreign government regulatory requirements, trade tariffs, and the potentially limited availability of skilled labor in proximity to the Company’s facilities.
The Company’s Products and Processes Are Subject to Risks from Changes in Technology
The Company’s products and processes are subject to risks of obsolescence as a result of changes in technology. To address this risk, the Company invests in product design and development, and for capital expenditures. There can be no guarantee that the Company’s product design and development efforts will be successful, or funds required to be invested for product design and development and capital expenditures will not increase materially in the future.
The Company Faces Risks Associated With Acquisitions and Dispositions of Businesses
A key element of the Company’s long-term strategy has been growth through acquisitions. The Company is continuously reviewing and actively pursuing acquisitions, including acquisitions outside of its current aerospace markets. Acquisitions may require the Company to incur additional indebtedness, resulting in increased leverage. Any significant acquisition may result in a material weakening of the Company’s financial position and a material increase in the Company’s cost of borrowings. Acquisitions also may require the Company to issue additional equity, resulting in dilution to existing stockholders. This additional financing for acquisitions and capital expenditures may not be available on terms acceptable or favorable to the Company. Acquired businesses may not achieve anticipated results, and could result in a material adverse effect on the Company’s financial condition, results
11
Table of Contents
of operations and cash flows. The Company also periodically reviews its existing businesses to determine if they are consistent with the Company’s strategy. The Company has sold, and may sell in the future, business units and product lines, which may result in either a gain or loss on disposition.
The Company’s acquisition strategy exposes it to risks. The Company may not be able to consummate acquisitions on satisfactory terms or, if any acquisitions are consummated, to satisfactorily integrate these acquired businesses. The Company’s ability to grow by acquisition is dependent upon, among other factors, the availability of suitable acquisition candidates. Growth by acquisition involves risks that could have a material adverse effect on the Company’s business, financial condition and operating results, including difficulties in integrating the operations and personnel of acquired companies, the potential amortization of acquired intangible assets, potential impairment of goodwill and the potential loss of key customers or employees of acquired companies.
Goodwill Could Be Impaired in the Future
In assessing the recoverability of the Company’s goodwill at December 31, 2010, management was required to make certain critical estimates and assumptions. These estimates and assumptions included that during the next several years the Company will make improvements in manufacturing efficiency, achieve reductions in operating costs, and obtain increases in sales and backlog. Due to many variables inherent in the estimation of a business’s fair value and the relative size of the Company’s recorded goodwill, differences in estimates and assumptions may have a material effect on the results of the Company’s impairment analysis. If any of these or other estimates and assumptions are not realized in the future, or if market multiples decline the Company may be required to record an additional impairment charge for the goodwill. The goodwill of the Company was $100,442,000 at December 31, 2010.
Significant Consolidation in the Aerospace Industry Could Adversely Affect the Company’s Business and Financial Results
The aerospace industry is experiencing significant consolidation, including the Company’s customers, competitors and suppliers. Consolidation among the Company’s customers may result in delays in the award of new contracts and losses of existing business. Consolidation among the Company’s competitors may result in larger competitors with greater resources and market share, which could adversely affect the Company’s ability to compete successfully. Consolidation among the Company’s suppliers may result in fewer sources of supply and increased cost to the Company.
The Company’s Failure to Meet Quality or Delivery Expectations of Customers Could Adversely Affect the Company’s Business and Financial Results
The Company’s customers have increased, and are expected to increase further in the future, their expectations with respect to the on-time delivery and quality of the Company’s products. In some cases, the Company does not presently satisfy these customer expectations, particularly with respect to on-time delivery. If the Company fails to meet the quality or delivery expectations of its customers, this failure could lead to the loss of one or more significant customers of the Company.
12
Table of Contents
Environmental Liabilities Could Adversely Affect the Company’s Financial Results
The Company is subject to various environmental laws and regulations. The Company’s DAS subsidiary has been directed by government environmental agencies to investigate and take corrective action for groundwater contamination at two of its facilities. DAS is also a potentially responsible party at certain sites at which it previously disposed of hazardous wastes. There can be no assurance that future developments, lawsuits and administrative actions, and liabilities relating to environmental matters will not have a material adverse effect on the Company’s results of operations or cash flows.
The DAS chemical milling business uses various acid and alkaline solutions in the chemical milling process, resulting in potential environmental hazards. Despite existing waste recovery systems and continuing capital expenditures for waste reduction and management, at least for the immediate future, this business will remain dependent on the availability and cost of remote hazardous waste disposal sites or other alternative methods of disposal.
Product Liability Claims in Excess of Insurance Could Adversely Affect the Company’s Financial Results and Financial Condition
The Company faces potential liability for personal injury or death as a result of the failure of products designed or manufactured by the Company. Although the Company maintains aircraft product liability insurance of approximately $150,000,000, any material product liability not covered by insurance could have a material adverse effect on the Company’s financial condition, results of operations and cash flows.
Damage or Destruction of the Company’s Facilities Caused by Earthquake or Other Causes Could Adversely Affect the Company’s Financial Results and Financial Condition
Although the Company maintains standard property casualty insurance covering its properties, the Company does not carry any earthquake insurance because of the cost of such insurance. Many of the Company’s properties are located in Southern California, an area subject to frequent and sometimes severe earthquake activity. Even if covered by insurance, any significant damage or destruction of the Company’s facilities could result in the inability to meet customer delivery schedules and may result in the loss of customers and significant additional costs to the Company. As a result, any significant damage or destruction of the Company’s properties could have a material adverse effect on the Company’s business, financial condition or results of operations.
The Company Is Dependent on Its Ability to Attract and Retain Key Personnel
The Company’s success depends in part upon its ability to attract and retain key engineering, technical and managerial personnel. The Company faces competition for management, engineering and technical personnel from other companies and organizations. Therefore, the Company may not be able to retain its existing management and other key personnel, or be able to fill new management, engineering and technical positions created as a result of expansion or turnover of existing personnel. The loss of members of the Company’s senior management group, or key engineering and technical personnel, could have a material adverse effect on the Company’s business.
13
Table of Contents
Effective Income Tax Rate Could Change
The Company’s effective income tax rate for 2010, 2009 and 2008, was approximately 20%, 26% and 23%, respectively, compared to the statutory federal income tax rate of 35% and state income tax rates ranging from 6% to 9%, for each of the years. The Company’s effective tax rate was lower than the statutory rates in recent years primarily due to the benefit of research and development tax credits (which have been extended through 2011). The effective tax rate for the Company could be significantly higher in the future than it has been in recent years due to changes in the Company’s level or sources of income, changes in the Company’s spending, eligibility for research and development tax credits, and changes in tax laws.
| ITEM 1B. | UNRESOLVED STAFF COMMENTS |
Not applicable.
| ITEM 2. | PROPERTIES |
The Company occupies approximately 21 facilities with a total office and manufacturing area of over 1,458,000 square feet, including both owned and leased properties. At December 31, 2010, facilities which were in excess of 50,000 square feet each were occupied as follows:
| Location |
Segment |
Square Feet |
Expiration of Lease |
|||||||
| Carson, California |
Ducommun AeroStructures |
286,000 | Owned | |||||||
| Monrovia, California |
Ducommun AeroStructures |
274,000 | Owned | |||||||
| Parsons, Kansas |
Ducommun AeroStructures |
120,000 | Owned | |||||||
| Carson, California |
Ducommun Technologies |
117,000 | 2013 | |||||||
| Phoenix, Arizona |
Ducommun Technologies |
100,000 | 2012 | |||||||
| Orange, California |
Ducommun AeroStructures |
76,000 | Owned | |||||||
| El Mirage, California |
Ducommun AeroStructures |
74,000 | Owned | |||||||
| Iuka, Mississippi |
Ducommun Technologies |
66,000 | 2013 | |||||||
| Carson, California |
Ducommun AeroStructures |
65,000 | 2014 | |||||||
| Huntsville, Alabama |
Ducommun Technologies |
52,000 | 2015 | |||||||
The Company’s facilities are, for the most part, fully utilized, although excess capacity exists from time to time based on product mix and demand. Management believes these properties are in good condition and suitable for their present use.
14
Table of Contents
| ITEM 3. | LEGAL PROCEEDINGS |
The Company is a defendant in a lawsuit entitled United States of America ex rel Taylor Smith, Jeannine Prewitt and James Ailes v. The Boeing Company and Ducommun Inc., filed in the United States District Court for the District of Kansas (the “District Court”). The lawsuit is a qui tam action brought against The Boeing Company (“Boeing”) and Ducommun on behalf of the United States of America for violations of the United States False Claims Act. The lawsuit alleges that Ducommun sold unapproved parts to the Boeing Commercial Airplanes-Wichita Division which were installed by Boeing in aircraft ultimately sold to the United States government. The number of Boeing aircraft subject to the lawsuit has been reduced to 25 aircraft following the District Court’s granting of partial summary judgment in favor of Boeing and Ducommun. The lawsuit seeks damages, civil penalties and other relief from the defendants for presenting or causing to be presented false claims for payment to the United States government. Although the amount of alleged damages are not specified, the lawsuit seeks damages in an amount equal to three times the amount of damages the United States government sustained because of the defendants’ actions, plus a civil penalty of $10,000 for each false claim made on or before September 28, 1999, and $11,000 for each false claim made on or after September 28, 1999, together with attorneys’ fees and costs. The Company intends to defend itself vigorously against the lawsuit. The Company, at this time, is unable to estimate what, if any, liability it may have in connection with the lawsuit.
| ITEM 4. | SUBMISSION OF MATTERS TO A VOTE OF SECURITY HOLDERS |
None.
15
Table of Contents
PART II
| ITEM 5. | MARKET FOR THE REGISTRANT’S COMMON EQUITY, RELATED STOCKHOLDER MATTERS AND ISSUER PURCHASES OF EQUITY SECURITIES |
The common stock of the Company (DCO) is listed on the New York Stock Exchange. On December 31, 2010, the Company had approximately 313 holders of record of common stock. The Company paid $3,147,000 of dividends in 2010, consisting of dividends of $0.075 per common share in the first, second, third and fourth quarters of 2010; and paid dividends of $0.075 per common share in the first, second, third and fourth quarters of 2009. The following table sets forth the high and low sales closing prices per share for the Company’s common stock as reported on the New York Stock Exchange for the fiscal periods indicated.
| 2010 | 2009 | |||||||||||||||
| High | Low | High | Low | |||||||||||||
| First Quarter |
$ | 21.47 | $ | 16.35 | $ | 20.02 | $ | 11.68 | ||||||||
| Second Quarter |
24.17 | 16.91 | 20.22 | 14.67 | ||||||||||||
| Third Quarter |
22.88 | 16.20 | 20.40 | 15.37 | ||||||||||||
| Fourth Quarter |
23.29 | 20.27 | 20.41 | 17.00 | ||||||||||||
Equity Compensation Plan Information
The following table provides information about the Company’s compensation plans under which equity securities are authorized for issuance.
| Plan category |
Number of securities to be issued upon exercise of outstanding options, warrants and rights (a) |
Weighted-average exercise price of outstanding options, warrants and rights (b) |
Number of securities remaining available for future issuance under equity compensation plans (excluding securities reflected in column (a)) (c)(2) |
|||||||||
| Equity compensation plans approved by security holders(1) |
1,086,216 | $ | 18.191 | 406,310 | ||||||||
| Equity compensation plans not approved by security holders |
0 | 0 | 0 | |||||||||
| Total |
1,086,216 | $ | 18.191 | 406,310 | ||||||||
| (1) | The number of securities to be issued consists of 929,850 for stock options, 66,366 for restricted stock units and 90,000 for performance stock units at target. The weighted average exercise price applies only to the stock options. |
| (2) | Awards are not restricted to any specified form or structure and may include, without limitation, sales or bonuses of stock, restricted stock, stock options, reload stock options, stock purchase warrants, other rights to acquire stock, securities convertible into or redeemable for stock, stock appreciation rights, limited stock appreciation rights, phantom stock, dividend equivalents, performance units or performance shares, and an award may consist of one such security or benefit, or two or more of them in tandem or in the alternative. |
16
Table of Contents
Performance Graph
The following graph compares the yearly percentage change in the Company’s cumulative total shareholder return with the cumulative total return of the Russell 2000 Index and the Spade Defense Index for the periods indicated, assuming the reinvestment of any dividends. The graph is not necessarily indicative of future price performance.
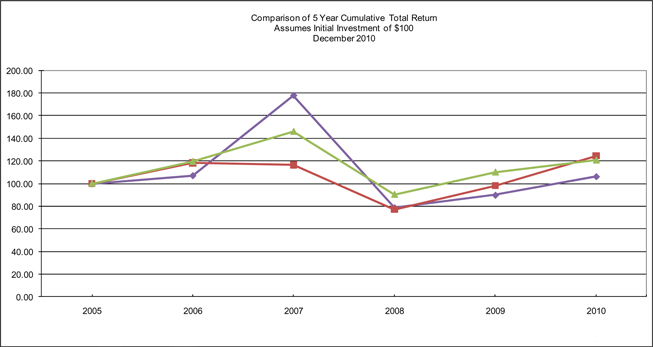
| 2005 | 2006 | 2007 | 2008 | 2009 | 2010 | |||||||||||||||||||
|
Ducommun Inc.
|
100.00 | 107.13 | 177.90 | 78.76 | 89.85 | 106.22 | ||||||||||||||||||
|
Russell 2000 Index
|
100.00 | 118.35 | 116.52 | 77.14 | 98.11 | 124.45 | ||||||||||||||||||
|
Spade Defense Index
|
100.00 | 119.33 | 145.79 | 90.34 | 109.96 | 120.54 | ||||||||||||||||||


17
Table of Contents
Issuer Purchases of Equity Securities
The following table provides information about Company purchases of equity securities that are registered by the Company pursuant to Section 12 of the Exchange Act during the quarter ended December 31, 2010.
| Period |
Total Number of Shares (or Units) Purchased |
Average Price Paid Per Share (or Unit) |
Total Number of Shares (or Units) Purchased as Part of Publicly Announced Plans or Programs |
Maximum Number (or Approximate Dollar Value) of Shares (or Units) that May Yet Be Purchased Under the Plans or Programs (1) |
||||||||||||
| Month beginning October 3, 2010 and ending October 30, 2010 |
0 | $ | 0.00 | 0 | $ | 2,773,030 | ||||||||||
| Month beginning October 31, 2010 and ending November 27, 2010 |
0 | $ | 0.00 | 0 | $ | 2,773,030 | ||||||||||
| Month beginning November 28, 2010 and ending December 31, 2010 |
0 | $ | 0.00 | 0 | $ | 2,773,030 | ||||||||||
| Total |
0 | $ | 0.00 | 0 | $ | 2,773,030 | ||||||||||
| (1) | The Company did not repurchase any of its common shares during 2010. The Company repurchased 74,300 and 69,000 of its common shares during 2009 and 2008, respectively. At December 31, 2010, $2,773,030 remained available to repurchase common stock of the Company under stock repurchase programs previously approved by the Board of Directors. |
18
Table of Contents
| ITEM 6. | SELECTED FINANCIAL DATA |
| Year Ended December 31, |
2010 | 2009(a) | 2008(a)(b) | 2007 | 2006(c) | |||||||||||||||
| (In thousands, except per share amounts) |
||||||||||||||||||||
| Net Sales |
$ | 408,406 | $ | 430,748 | $ | 403,803 | $ | 367,297 | $ | 319,021 | ||||||||||
| Gross Profit as a Percentage of Sales |
19.6 | % | 18.3 | % | 20.3 | % | 20.6 | % | 19.6 | % | ||||||||||
| Income from Operations Before Taxes |
24,663 | 13,760 | 17,049 | 27,255 | 18,088 | |||||||||||||||
| Income Tax Expense |
(4,855 | ) | (3,577 | ) | (3,937 | ) | (7,634 | ) | (3,791 | ) | ||||||||||
| Net Income |
$ | 19,808 | $ | 10,183 | $ | 13,112 | $ | 19,621 | $ | 14,297 | ||||||||||
| Per Common Share: |
||||||||||||||||||||
| Basic earnings per share |
$ | 1.89 | $ | 0.97 | $ | 1.24 | $ | 1.89 | $ | 1.40 | ||||||||||
| Diluted earnings per share |
1.87 | 0.97 | 1.23 | 1.88 | 1.39 | |||||||||||||||
| Dividends Per Share |
0.30 | 0.30 | 0.15 | — | — | |||||||||||||||
| Working Capital |
$ | 90,106 | $ | 85,825 | $ | 69,672 | $ | 77,703 | $ | 55,355 | ||||||||||
| Total Assets |
345,452 | 353,909 | 366,186 | 332,476 | 297,033 | |||||||||||||||
| Long-Term Debt, Including Current Portion |
3,280 | 28,252 | 30,719 | 25,751 | 30,436 | |||||||||||||||
| Total Shareholders’ Equity |
254,185 | 233,886 | 224,446 | 214,051 | 187,025 | |||||||||||||||
| (a) | The results for 2009 and 2008 include after-tax non-cash goodwill impairment charges of $7,753,000 and $8,000,000, respectively resulting from annual impairment testing required by ASC 350. There was no goodwill impairment in 2010, 2007 or 2006. |
| (b) | In December 2008 the Company acquired DynaBil, which is now a part of DAS. This transaction was accounted for as a purchase business combination. |
| (c) | In January, May and September 2006 the Company acquired Miltec, WiseWave and CMP, which are now part of DTI. These transactions were accounted for as purchase business combinations. |
19
Table of Contents
| ITEM 7. | MANAGEMENT’S DISCUSSION AND ANALYSIS OF FINANCIAL CONDITION AND RESULTS OF OPERATIONS |
Overview
Ducommun Incorporated (“Ducommun” or the “Company”), through its subsidiaries designs, engineers and manufactures aerostructure and electromechanical components and subassemblies, and provides engineering, technical and program management services principally for the aerospace industry. These components, assemblies and services are provided principally for domestic and foreign commercial and military aircraft, helicopter, missile and space programs.
Domestic commercial aircraft programs include the Boeing 737NG, 747, 767, 777 and 787. Foreign commercial aircraft programs include the Airbus Industrie A330 and A340 aircraft, Bombardier business and regional jets, and the Embraer 145 and 170/190. Major military programs include the Boeing C-17, F-15 and F-18 and Lockheed Martin F-16, F-22 and F-35 aircraft, and various aircraft and shipboard electronics upgrade programs. Commercial and military helicopter programs include helicopters manufactured by Boeing (principally the Apache and Chinook helicopters), United Technologies, Bell, Augusta and Carson. The Company also supports various unmanned space launch vehicle and satellite programs.
In the fourth quarter of 2009, the Company recorded a non-cash charge of $12,936,000 at DTI (relating to its Miltec reporting unit) for the impairment of goodwill. In the fourth quarter of 2008, the Company recorded a non-cash charge of $13,064,000 at DTI (relating to its Miltec reporting unit) for the impairment of goodwill. The charge in both 2009 and 2008 reduced goodwill recorded in connection with the acquisition of Miltec and did not impact the Company’s normal business operations. There was no impairment of goodwill in 2010.
20
Table of Contents
The Company manufactures components and assemblies principally for domestic and foreign commercial and military aircraft, helicopter and space programs. The Company’s Miltec subsidiary provides engineering, technical and program management services almost entirely for United States defense, space and homeland security programs. The Company’s mix of military and space and commercial business in 2010, 2009 and 2008, respectively, was approximately as follows:
| 2010 | 2009 | 2008 | ||||||||||
| Commercial |
||||||||||||
| Large Aircraft |
20 | % | 18 | % | 17 | % | ||||||
| Regional and Business Aircraft |
8 | % | 7 | % | 9 | % | ||||||
| Helicopter |
7 | % | 7 | % | 8 | % | ||||||
| Other |
5 | % | 4 | % | 5 | % | ||||||
| Total Commercial |
40 | % | 36 | % | 39 | % | ||||||
| Military and Space |
||||||||||||
| Aircraft |
27 | % | 26 | % | 21 | % | ||||||
| Helicopter |
20 | % | 22 | % | 22 | % | ||||||
| Engineering Services |
9 | % | 12 | % | 13 | % | ||||||
| Space and Other |
4 | % | 4 | % | 5 | % | ||||||
| Total Military and Space |
60 | % | 64 | % | 61 | % | ||||||
| Total |
100 | % | 100 | % | 100 | % | ||||||
21
Table of Contents
The Company is dependent on various aircraft and helicopter programs including Boeing commercial and military aircraft programs, United Technologies (Sikorsky Blackhawk helicopter program) and Raytheon military programs. Sales to these programs, as a percentage of total sales, for 2010, 2009 and 2008, respectively, were approximately as follows:
| 2010 | 2009 | 2008 | ||||||||||
| Boeing Commercial and Military Aircraft |
26 | % | 32 | % | 32 | % | ||||||
| United Technologies (Sikorsky Blackhawk Helicopter) |
7 | % | 7 | % | 2 | % | ||||||
| Raytheon Military Programs |
12 | % | 8 | % | 8 | % | ||||||
| All Other |
55 | % | 53 | % | 58 | % | ||||||
| Total |
100 | % | 100 | % | 100 | % | ||||||
Sales, gross profit as a percentage of sales, selling, general and administrative expense as a percentage of sales, the effective tax rate and the diluted earnings per share in 2010, 2009 and 2008 , respectively, were as follows:
| 2010 | 2009 | 2008 | ||||||||||
| Sales (in $000’s) |
$ | 408,406 | $ | 430,748 | $ | 403,803 | ||||||
| Gross Profit % of Sales |
19.6 | % | 18.3 | % | 20.3 | % | ||||||
| SG&A Expense % of Sales |
13.1 | % | 11.5 | % | 12.5 | % | ||||||
| Effective Tax Rate |
19.7 | % | 26.0 | % | 23.1 | % | ||||||
| Diluted Earnings Per Share |
$ | 1.87 | $ | 0.97 | $ | 1.23 | ||||||
Net sales in 2010 were $408,406,000, compared to net sales of $430,748,000 for 2009. The decrease in net sales in 2010 from 2009 was primarily due to lower sales of engineering services and lower product sales for military helicopters, partially offset by growth in product sales of commercial aircraft programs.
Gross profit, as a percent of sales, increased to 19.6% in 2010 from 18.3% in 2009. Gross profit margins in 2010 were negatively impacted by approximately $4,948,000, or 1.8 percentage points, due to start-up and development costs on several new programs which generated approximately $10,448,000 in sales. In addition, gross profit for 2010 was favorably impacted by an adjustment to operating expense of approximately $1,285,000, or 0.3 percentage points, relating to the reversal of certain accounts payable accruals recorded in prior periods. The Company determined that certain accounts payable that were accrued during the period from 2004 to 2010, in fact had been paid or were not otherwise owed to suppliers. The Company assessed the materiality of this reversal and concluded it was immaterial to previously reported annual and interim amounts. Gross profit margin in 2009 was negatively impacted by inventory reserves and valuation adjustments of $5,141,000 and a liability recorded for uncollected sales tax from customers of $617,000.
22
Table of Contents
Selling, general and administrative (“SG&A”) expense increased to $53,678,000, or 13.1% of sales in 2010, compared to $49,615,000, or 11.5% of sales in 2009. The increase in SG&A expense was primarily due to higher expenses from the amortization of intangible assets of approximately $1,142,000, higher compensation costs and increased investments in product development programs. SG&A expenses in 2009 were favorably impacted by a reduction in environmental reserves of $2,241,000.
Interest expense was lower in 2010, due to lower debt levels. Income tax expense increased in 2010 due to higher income before taxes, partially offset by a lower effective tax rate.
Critical Accounting Policies
Critical accounting policies are those accounting policies that can have a significant impact on the presentation of our financial condition and results of operations, and that require the use of subjective estimates based upon past experience and management’s judgment. Because of the uncertainty inherent in such estimates, actual results may differ from these estimates. Below are those policies applied in preparing our financial statements that management believes are the most dependent on the application of estimates and assumptions. For additional accounting policies, see Note 1 of “Notes to Consolidated Financial Statements.”
Revenue Recognition
The Company recognizes product sales when persuasive evidence of an arrangement exists, the price is fixed or determinable, collection is reasonably assured and delivery of products has occurred or services have been rendered. Revenue from products sold under long-term contracts is recognized by the Company on the same basis as other sale transactions using the unit of delivery method. The Company recognizes revenue on the sale of services (including prototype products) based on the type of contract: time and materials, cost-plus reimbursement and firm-fixed price. Revenue is recognized (i) on time and materials contracts as time is spent at hourly rates, which are negotiated with customers, plus the cost of any allowable materials and out-of-pocket expenses, (ii) on cost-plus reimbursement contracts based on direct and indirect costs incurred plus a negotiated profit calculated as a percentage of cost, a fixed amount or a performance-based award fee, and (iii) on fixed-price service contracts on the percentage-of-completion method measured by the percentage of costs incurred to estimated total costs.
Provision for Estimated Losses on Contracts
The Company records provisions for estimated losses on contracts considering total estimated costs to complete the contract compared to total anticipated revenues in the period in which such losses are identified. The provisions for estimated losses on contracts require management to make certain estimates and assumptions, including those with respect to the future revenue under a contract and the future cost to complete the contract. Management’s estimate of the future cost to complete a contract may include assumptions as to improvements in manufacturing efficiency and reductions in operating and material costs. If any of these or other assumptions and estimates do not materialize in the future, the Company may be required to record additional provisions for estimated losses on contracts.
23
Table of Contents
Goodwill
The Company’s business acquisitions have resulted in goodwill. In assessing the recoverability of the Company’s goodwill, management must make assumptions regarding estimated future cash flows, comparable company analyses, discount rates and other factors to determine the fair value of the respective assets. If actual results do not meet these estimates, if these estimates or their related assumptions change in the future, or if adverse equity market conditions cause a decrease in current market multiples and the Company’s stock price the Company may be required to record additional impairment charges for these assets. In the event that a goodwill impairment charge is required, it could adversely affect the operating results and financial position of the Company.
Other Intangible Assets
The Company amortizes purchased other intangible assets with finite lives over the estimated economic lives of the assets, ranging from one to fourteen years generally using the straight-line method. The value of other intangibles acquired through business combinations has been estimated using present value techniques which involve estimates of future cash flows. Actual results could vary, potentially resulting in impairment charges.
Accounting for Stock-Based Compensation
The Company uses a Black-Scholes valuation model in determining the stock-based compensation expense for options, net of an estimated forfeiture rate, on a straight-line basis over the requisite service period of the award. The Company has one award population with an option vesting term of four years. The Company estimated the forfeiture rate based on its historic experience.
For performance and restricted stock units, the Company calculates compensation expense, net of an estimated forfeiture rate, on a straight line basis over the requisite service/performance period of the awards. The performance stock units vest based on a three-year cumulative performance cycle. The restricted stock units, vest over various periods of time ranging from one to five years. The Company estimates the forfeiture rate based on its historic experience.
Inventories
Inventories are stated at the lower of cost or market, cost being determined on a first-in, first-out basis. Inventoried costs include raw materials, outside processing, direct labor and allocated overhead, adjusted for any abnormal amounts of idle facility expense, freight, handling costs, and wasted materials (spoilage) incurred, but do not include any selling, general and administrative expense. Costs under long-term contracts are accumulated into, and removed from, inventory on the same basis as other contracts. The Company assesses the inventory carrying value and reduces it, if necessary, to its net realizable value based on customer orders on hand, and internal demand forecasts using management’s best estimates given information currently available. The Company’s customer demand can fluctuate significantly caused by factors beyond the control of the Company. The Company maintains an allowance for potentially excess and obsolete inventories and inventories that are carried at costs that are higher than their estimated net realizable values. If market conditions are less favorable than those projected by management, such as an unanticipated decline in demand and not meeting expectations, inventory write-downs may be required.
24
Table of Contents
Environmental Liabilities
Environmental liabilities are recorded when environmental assessments and/or remedial efforts are probable and costs can be reasonably estimated. Generally, the timing of these accruals coincides with the completion of a feasibility study or the Company’s commitment to a formal plan of action. Further, the Company reviews and updates its environmental accruals as circumstances change and/or additional information is obtained that reasonably could be expected to have a meaningful effect on the outcome of a matter or the estimated cost thereof.
Acquisitions
On December 23, 2008, the Company acquired DynaBil Industries, Inc., a privately-owned company based in Coxsackie, New York, for $45,386,000 (net of cash acquired and excluding acquisition costs) and subsequently changed its name to Ducommun AeroStructures, New York Inc. (“DAS-New York”). DAS-New York is a leading provider of titanium and aluminum structural components and assemblies for commercial and military aerospace applications. The acquisition was funded from internally generated cash, notes to the sellers, and borrowings of approximately $10,500,000 under the Company’s credit agreement. The operating results for this acquisition have been included in the consolidated statements of income since the date of the acquisition.
Results of Operations
2010 Compared to 2009
Net sales in 2010 were $408,406,000, compared to net sales of $430,748,000 for 2009. Net sales in 2010 decreased 5% from 2009 primarily due to approximately $17,500,000 decrease in sales of engineering services and lower product sales for military helicopters (primarily Apache and Chinook helicopters), partially offset by growth in product sales of large and regional jet commercial aircraft programs. The Company’s mix of business in 2010 was approximately 60% military and space and 40% commercial, compared to 64% military and space and 36% commercial in 2009.
25
Table of Contents
The Company had substantial sales, through both of its business segments, to Boeing, Raytheon, United Technologies and the United States government. During 2010 and 2009, sales to Boeing, Raytheon, United Technologies and the United States government were as follows:
| December 31, |
2010 | 2009 | ||||||
| (In thousands) | ||||||||
| Boeing |
$ | 107,466 | $ | 133,007 | ||||
| Raytheon |
48,198 | 34,009 | ||||||
| United Technologies |
30,680 | 42,117 | ||||||
| United States government |
16,875 | 29,224 | ||||||
| Total |
$ | 203,219 | $ | 238,357 | ||||
At December 31, 2010, trade receivables from Boeing, Raytheon, United Technologies and the United States government were $9,685,000, $4,520,000, $2,049,000 and $1,262,000, respectively. The sales and receivables relating to Boeing, Raytheon, United Technologies and the United States government are diversified over a number of different commercial, military and space programs.
Military components manufactured by the Company are employed in many of the country’s front-line fighters, bombers, helicopters and support aircraft, as well as sea-based applications. Engineering, technical and program management services are provided principally for United States defense, space and homeland security programs. The Company’s defense business is diversified among military manufacturers and programs. Sales related to military and space programs were approximately $244,485,000, or 60% of total sales, compared to $275,304,000, or 64% of total sales, in 2009. The decrease in military and space sales in 2010 was primarily due to lower sales of engineering services and lower product sales for military helicopters.
Military and space product sales during 2010 and 2009 included the following programs:
| December 31, |
2010 | 2009 | ||||||
| (In thousands) | ||||||||
| Blackhawk |
$ | 42,646 | $ | 37,699 | ||||
| C-17 |
36,198 | 42,198 | ||||||
| Apache |
25,001 | 36,067 | ||||||
| F-18 |
24,495 | 21,543 | ||||||
| F-15 |
17,764 | 10,394 | ||||||
| Chinook |
9,726 | 18,642 | ||||||
| X-47B UCAS |
— | 6,652 | ||||||
| Space |
2,342 | 2,178 | ||||||
| Other |
45,470 | 41,554 | ||||||
| Military and Space Product Sales |
203,642 | 216,927 | ||||||
| Engineering Services |
40,843 | 58,377 | ||||||
| Total |
$ | 244,485 | $ | 275,304 | ||||
26
Table of Contents
The Company’s commercial business is represented on many of today’s major commercial aircraft. Sales related to commercial business were approximately $163,921,000, or 40% of total sales in 2010, compared to $155,444,000, or 36% of total sales in 2009. The increase in commercial sales during 2010 compared 2009 was primarily due to an increase in demand in the regional jet and aviation markets, and an increase in commercial large aircraft, partially offset by declines in sales for commercial helicopters.
Commercial sales during 2010 and 2009 included the following programs:
| December 31, |
2010 | 2009 | ||||||
| (In thousands) | ||||||||
| 737NG |
$ | 43,296 | $ | 42,439 | ||||
| 777 |
13,825 | 16,395 | ||||||
| Carson Helicopter |
13,674 | 14,636 | ||||||
| Other |
93,126 | 81,974 | ||||||
| Total |
$ | 163,921 | $ | 155,444 | ||||
Backlog is subject to delivery delays or program cancellations, which are beyond the Company’s control. As of December 31, 2010, backlog believed to be firm was approximately $328,045,000, compared to $367,138,000 at December 31, 2009. The reduction in year-over-year backlog is reflective of (i) late order release on C-17 and F-15 programs and Chinook and Bell helicopter programs and (ii) declines in the engineering services business resulting from lower RDT&E budgets, reduced demand for specific engineering services as a result of increases in government in-sourcing and reduced Congressional earmarks. Approximately $225,000,000 of total backlog is expected to be delivered during 2011. The backlog at December 31, 2010 included the following programs:
| Backlog (In thousands) |
||||||||
| 2010 | 2009 | |||||||
| 737NG |
$ | 61,891 | $ | 53,349 | ||||
| Blackhawk Helicopter |
39,368 | 22,925 | ||||||
| Apache Helicopter |
27,299 | 26,064 | ||||||
| F-18 |
24,692 | 24,807 | ||||||
| Carson Helicopter |
24,558 | 22,926 | ||||||
| 777 |
13,082 | 13,280 | ||||||
| C-17 |
11,563 | 29,564 | ||||||
| F-15 |
7,384 | 17,964 | ||||||
| $ | 209,837 | $ | 210,879 | |||||
27
Table of Contents
Trends in the Company’s overall level of backlog, however, may not be indicative of trends in future sales because the Company’s backlog is affected by timing differences in the placement of customer orders and because the Company’s backlog tends to be concentrated in several programs to a greater extent than the Company’s sales.
Gross profit, as a percent of sales, increased to 19.6% in 2010 from 18.3% in 2009. Gross profit margins in 2010 were negatively impacted by approximately $4,948,000, or 1.8 percentage points, due to start-up and development costs on several new programs which generated approximately $10,448,000 in sales. In addition, gross profit for 2010 was favorably impacted by an adjustment to operating expense of approximately $1,285,000, or 0.3 percentage points, relating to the reversal of certain accounts payable accruals recorded in prior periods. The Company determined that certain accounts payable that were accrued during the period from 2004 to 2010, in fact had been paid or were not otherwise owed to suppliers. The Company assessed the materiality of this reversal and concluded it was immaterial to previously reported annual and interim amounts. Gross profit margin in 2009 was negatively impacted by inventory reserves and valuation adjustments of $5,141,000 and a liability recorded for uncollected sales tax from customers of $617,000.
Selling, general and administrative (“SG&A”) expense increased to $53,678,000, or 13.1% of sales in 2010, compared to $49,615,000, or 11.5% of sales in 2009. The increase in SG&A expense was primarily due to higher expenses from the amortization of intangible assets of approximately $1,142,000, higher compensation costs and increased investments in product development programs. The SG&A expenses in 2009 was favorably impacted by a reduction in environmental reserves of $2,241,000.
In accordance with ASC 350 – Goodwill and Other Intangible Assets, the Company performed its required annual impairment test for goodwill using a discounted cash flow analysis supported by comparative market multiples to determine the fair values of its businesses versus their book values. The test as of December 31, 2010 indicated that there was no impairment of goodwill during 2010. In the fourth quarter of 2009, the Company recorded a non-cash charge of
28
Table of Contents
$12,936,000 at DTI (relating to its Miltec reporting unit) for the impairment of goodwill. The charge in 2009 reduced goodwill recorded in connection with the acquisition of Miltec. The principal factors used in the discounted cash flow analysis requiring judgment are the projected results of operations, weighted average cost of capital (“WACC”), and terminal value assumptions. The WACC takes into account the relative weights of each component of the Company’s consolidated capital structure (equity and debt) and represents the expected cost of new capital adjusted as appropriate to consider risk profiles associated with growth projection risks. The terminal value assumptions are applied to the final year of discounted cash flow model. Due to many variables inherent in the estimation of a business’s fair value and the relative size of the Company’s recorded goodwill, differences in assumptions may have a material effect on the results of the Company’s impairment analysis.
Interest expense was $1,805,000 in 2010, compared to $2,522,000 in 2009, primarily due to lower debt levels in 2010 compared to the previous year.
Income tax expense increased to $4,855,000 in 2010, compared to $3,577,000 in 2009. The increase in income tax expense was due to the higher income before taxes, partially offset by a lower effective income tax rate. The Company’s effective tax rate for 2010 was 19.7%, compared to 26.0% in 2009. Cash expended to pay income taxes was $2,546,000 in 2010, compared to $6,960,000 in 2009.
Net income for 2010 was $19,808,000, or $1.87 diluted earnings per share, compared to $10,183,000, or $0.97 diluted earnings per share in 2009. Net income for 2009 includes an after-tax charge of $3,444,000, or $0.33 per diluted share for the Eclipse inventory write-off and inventory valuation adjustment discussed above and a non-cash goodwill impairment charge of $7,753,000 or $0.74 per share.
2009 Compared to 2008
Net sales in 2009 were $430,748,000, compared to net sales of $403,803,000 for 2008. Net sales in 2009 increased 7% from 2008 primarily due to sales from DAS-New York, which was acquired in December 2008. Sales in 2009 from DAS-New York were $42,103,000. Excluding DAS-New York sales were lower in 2009 principally due to lower sales for the Apache helicopter and regional and business aircraft programs. The Company’s mix of business in 2009 was approximately 62% military, 36% commercial, and 2% space, compared to 59% military, 39% commercial, and 2% space in 2008.
29
Table of Contents
The Company had substantial sales, through both of its business segments, to Boeing, Raytheon, the United States government, and United Technologies. During 2009 and 2008, sales to Boeing, Raytheon, the United States government and United Technologies were as follows:
| December 31, |
2009 | 2008 | ||||||
| (In thousands) | ||||||||
| Boeing |
$ | 133,007 | $ | 130,783 | ||||
| Raytheon |
34,009 | 33,248 | ||||||
| United States government |
29,224 | 33,335 | ||||||
| United Technologies |
42,117 | 17,982 | ||||||
| Total |
$ | 238,357 | $ | 215,348 | ||||
At December 31, 2009, trade receivables from Boeing, Raytheon, the United States government and United Technologies were $8,719,000, $4,321,000, $1,742,000 and $2,295,000, respectively. The sales and receivables relating to Boeing, Raytheon, the United States government and United Technologies are diversified over a number of different commercial, military and space programs.
Military components manufactured by the Company are employed in many of the country’s front-line fighters, bombers, helicopters and support aircraft, as well as sea-based applications. Engineering, technical and program management services are provided principally for United States defense, space and homeland security programs. The Company’s defense business is diversified among military manufacturers and programs. Sales related to military and space programs were approximately $275,304,000, or 64% of total sales, in 2009, compared to $246,114,000, or 61% of total sales, in 2008. The increase in military sales in 2009 resulted principally from an increase in sales to the Blackhawk helicopter, primarily at DAS-New York, the X-47B UCAS and the C-17 programs at DAS and an increase in sales to the F-18 aircraft program at DTI, partially offset by a reduction in sales to the Apache helicopter program at DAS and a reduction in sales to the F-15 aircraft program at DTI.
In the space sector, the Company produces components for a variety of unmanned launch vehicles and satellite programs and provides engineering services. Sales related to space programs were approximately $8,382,000, or 2% of total sales in 2009, compared to $8,805,000, or 2% of total sales in 2008. The decrease in sales for space programs resulted principally from a decrease in engineering services at DTI.
30
Table of Contents
Military and space sales during 2009 and 2008 included the following programs:
| December 31, |
2009 | 2008 | ||||||
| (In thousands) | ||||||||
| C-17 |
$ | 42,198 | $ | 36,714 | ||||
| Blackhawk |
37,699 | 13,054 | ||||||
| Apache |
36,067 | 52,480 | ||||||
| F-18 |
21,543 | 17,542 | ||||||
| Chinook |
18,642 | 17,048 | ||||||
| F-15 |
10,394 | 13,263 | ||||||
| X-47B UCAS |
6,652 | — | ||||||
| Space |
2,178 | 2,051 | ||||||
| Other |
41,554 | 35,776 | ||||||
| Military and Space Product Sales |
216,927 | 187,928 | ||||||
| Engineering Services |
58,377 | 59,186 | ||||||
| Total |
$ | 275,304 | $ | 247,114 | ||||
The Company’s commercial business is represented on many of today’s major commercial aircraft. Sales related to commercial business were approximately $155,444,000, or 36% of total sales in 2009, compared to $156,689,000, or 39% of total sales in 2008. The reduction in commercial sales during 2009 compared to 2008 was primarily due to a decline in demand in the regional jet and aviation markets, which began to experience a slowdown at the beginning of 2009, partially offset by $14,086,000 of sales from DAS-New York, which was acquired in December 2008, and an increase of $4,180,000 in sales to the Boeing 737NG program. During 2009, the Company experienced no major program cancellations, except for the discontinuation of the Eclipse program. During 2009, sales to commercial business were lower than 2008 in the majority of the Company’s commercial aircraft programs. Sales to the Boeing 737NG program accounted for approximately $42,439,000 in sales in 2009, compared to $38,259,000 in sales in 2008. The Boeing 777 program accounted for approximately $16,395,000 in sales in 2009, of which $6,272,000 of sales were from DAS-New York, compared to $10,400,000 in sales in 2008.
Gross profit, as a percent of sales, decreased to 18.3% in 2009 from 20.3% in 2008. Gross profit margin was negatively impacted by inventory reserves and valuation adjustments of $5,141,000, a liability recorded for uncollected sales taxes from customers of $617,000 and an unfavorable change in sales mix at DAS, partially offset by an improvement in operating performance at DTI.
Selling, general and administrative (“SG&A”) expenses decreased to $49,615,000, or 11.5% of sales in 2009, compared to $50,548,000, or 12.5% of sales in 2008. The decrease in SG&A expense was primarily due to a reduction in environmental reserves of $2,241,000 and lower personnel costs, partially offset by a full year of expenses at DAS-New York, including the amortization of certain intangible assets of $1,487,000 for DAS-New York.
31
Table of Contents
In the fourth quarter of 2009, the Company recorded a non-cash charge of $12,936,000 at DTI (relating to its Miltec reporting unit) for the impairment of goodwill. In accordance with ASC 350 – Goodwill and Other Intangible Assets, the Company performed its required annual impairment test for goodwill using a discounted cash flow analysis supported by comparative market multiples to determine the fair values of its businesses versus their book values. The test as of December 31, 2009 indicated the book value of Miltec exceeded the fair value of the business. In the fourth quarter of 2009, the Company recorded a non-cash charge of $12,936,000 at DTI (relating to its Miltec reporting unit) for the impairment of goodwill. The impairment charge was primarily driven by reductions in the U.S. Government’s budgetary forecast and funding levels in the military markets resulting in the declines in the engineering services business from lower RDT&E budgets, reduced demand for specific engineering services as a result of increases in government in-sourcing and reduced Congressional earmarks. These market changes resulted in a lower forecast of future multiyear sales and cash flow for Miltec as compared to the forecast in 2008. Because the majority of Miltec’s business is U.S. Government related, the reduction in components of the U.S. Defense budget has had an unfavorable impact on the fair value assessment.
In the fourth quarter of 2008, the Company recorded a non-cash charge of $13,064,000 at DTI (relating to its Miltec reporting unit) for the impairment of goodwill. The test as of December 31, 2008 indicated the book value of Miltec exceeded the fair value of the business. The 2008 impairment charge was primarily driven by adverse equity market conditions that caused a decrease in current market multiples and the Company’s stock price as of December 31, 2008 compared with the test performed as of December 31, 2007. Thus, the impairment charge recorded in 2009 was driven by external market factors as opposed to the reduction in stock price multiples which were the primary cause for the impairment charge in 2008. The charge in both 2009 and 2008 reduced goodwill recorded in connection with the acquisition of Miltec and did not impact the Company’s normal business operations. The principal factors used in the discounted cash flow analysis requiring judgment are the projected results of operations, weighted average cost of capital (“WACC”), and terminal value assumptions. The WACC takes into account the relative weights of each component of the Company’s consolidated capital structure (equity and debt) and represents the expected cost of new capital adjusted as appropriate to consider risk profiles associated with growth projection risks. The terminal value assumptions are applied to the final year of discounted cash flow model. Due to many variables inherent in the estimation of a business’s fair value and the relative size of the Company’s recorded goodwill, differences in assumptions may have a material effect on the results of the Company’s impairment analysis. Prior to recording the goodwill impairment charge at Miltec, the Company tested the purchased intangible assets and other long-lived assets at the business as required by ASC 360 – Accounting for the Impairment or Disposal of Long-Lived Assets, and the carrying value of these assets was determined not to be impaired.
Interest expense was $2,522,000 in 2009, compared to $1,242,000 in 2008, primarily due to higher debt levels and higher interest rates in 2009 compared to the previous year.
Income tax expense decreased to $3,577,000 in 2009, compared to $3,937,000 in 2008. The decrease in income tax expense was due to the decrease in income before taxes, partially offset by a higher effective income tax rate. The Company’s effective tax rate for 2009 was 26.0%, compared to 23.1% in 2008. Cash expended to pay income taxes was $6,960,000 in 2009, compared to $7,618,000 in 2008.
32
Table of Contents
Net income for 2009 was $10,183,000, or $0.97 diluted earnings per share, compared to $13,112,000, or $1.23 diluted earnings per share in 2008. Net income for 2009 includes an after-tax charge of $3,444,000, or $0.33 per diluted share for the Eclipse inventory write-off and inventory valuation adjustment discussed above and a non-cash goodwill impairment charge of $7,753,000 or $0.74 per share. Net income for 2008 includes a non-cash goodwill impairment charge of $8,048,000 or $0.76 per share.
Financial Condition
Cash Flow Summary
Net cash provided by operating activities for 2010, 2009, and 2008 was $26,471,000, $30,812,000 and $28,044,000, respectively. Net cash provided by operating activities for 2010 was negatively impacted by an increase in inventory of $4,848,000 and tooling production cost of $5,215,000, primarily related to work-in-process for production jobs scheduled to ship in 2011 and afterward. Net cash provided by operating activities for 2010 was negatively impacted by a decrease in accrued liabilities of $2,695,000 (consisting primarily of a $2,464,000 decrease in customer deposits, a $1,076,000 decrease in accrued bonuses and incentives, a $423,000 decrease in deferred compensation, partially offset by $1,268,000 increase in all other accrued liabilities).
Net cash used in investing activities for 2010 of $7,104,000 included $7,106,000 of capital expenditures.
Net cash used in financing activities for 2010 of $27,728,000 included approximately $24,956,000 of repayment of borrowings and $3,147,000 of dividend payments.
Liquidity and Capital Resources
The Company is a party to a Second Amended and Restated Credit Agreement with Bank of America, N.A., as Administrative Agent, Wells Fargo Bank, National Association, as Syndication Agent, Union Bank, N.A., as Documentation Agent and the other lenders named therein dated June 26, 2009 (the “Credit Agreement”). The Credit Agreement provides for an unsecured revolving credit line of $120,000,000 maturing on June 26, 2014. Interest is payable quarterly on the outstanding borrowings at Bank of America’s prime rate (3.25% at December 31, 2010) plus a spread (1.5% to 2.0% per annum based on the leverage ratio of the Company) or, at the election of the Company, for terms of up to six months at the LIBOR rate (0.26% at December 31, 2010 for one month LIBOR) plus a spread (2.5% to 3.0% per annum depending on the leverage ratio of the Company). The Credit Agreement includes minimum fixed charge coverage, maximum leverage and minimum net worth covenants, an unused commitment fee (0.50% to 0.60% per annum depending on the leverage ratio of the Company), and limitations on future dispositions of property, repurchases of common stock, dividends, outside indebtedness, and acquisitions. At December 31, 2010, the Company had $119,550,000 of unused lines of credit, after deducting $450,000 for outstanding standby letters of credit. The Company had no outstanding loans and was in compliance with all covenants at December 31, 2010.
The Company continues to depend on operating cash flow and the availability of its bank line of credit to provide short-term liquidity. Cash from operations and bank borrowing capacity are expected to provide sufficient liquidity to meet the Company’s obligations during the next twelve months.
33
Table of Contents
In connection with the DAS-New York acquisition in December 2008, the Company issued a promissory note in the initial principal amount of $7,000,000 with interest of 5% per annum payable annually on each anniversary of the closing date (December 23). Principal of the promissory note in the amount of $4,000,000 was paid on June 23, 2010 and $3,000,000 is payable on December 23, 2013.
The weighted average interest rate on borrowings outstanding was 4.76% at December 31, 2010, compared to 6.14% at December 31, 2009. The carrying amount of long-term debt approximates fair value based on the terms of the related debt, recent transactions and estimates using interest rates currently available to the Company for debt with similar terms and remaining maturities.
The Company expects to spend approximately $12,000,000 for capital expenditures in 2011. The increase in capital expenditures in 2011 from 2010 is principally to support new contract awards at DAS and DTI and offshore manufacturing expansion. The Company believes the ongoing subcontractor consolidation makes acquisitions an increasingly important component of the Company’s future growth. The Company plans to continue to seek attractive acquisition opportunities and to make substantial capital expenditures for manufacturing equipment and facilities to support long-term contracts for both commercial and military aircraft programs.
The Company spent approximately $5,215,000 for tooling related investment on various sales programs in 2010. As part of the Company’s strategic direction in moving to a Tier 2 supplier additional up-front investment in tooling will be required for newer programs which have higher engineering content and higher levels of complexity in assemblies.
Dividends are subject to the approval of the Board of Directors, and will depend upon the Company’s results of operations, cash flows and financial position. The Company expects to continue to pay dividends of $0.075 per quarter per common share in 2011.
The Company has made guarantees and indemnities under which it may be required to make payments to a guaranteed or indemnified party, in relation to certain transactions, including revenue transactions in the ordinary course of business. In connection with certain facility leases the Company has indemnified its lessors for certain claims arising from the facility or the lease. The Company indemnifies its directors and officers to the maximum extent permitted under the laws of the State of Delaware. However, the Company has a directors and officers insurance policy that may reduce its exposure in certain circumstances and may enable it to recover a portion of future amounts that may be payable, if any. The duration of the guarantees and indemnities varies and, in many cases, is indefinite but subject to statute of limitations. The majority of guarantees and indemnities do not provide any limitations of the maximum potential future payments the Company could be obligated to make. Historically, payments related to these guarantees and indemnities have been immaterial. The Company estimates the fair value of its indemnification obligations as insignificant based on this history and insurance coverage and has, therefore, not recorded any liability for these guarantees and indemnities in the accompanying consolidated balance sheets. However, there can be no assurances that the Company will not have any future financial exposure under these indemnification obligations.
34
Table of Contents
As of December 31, 2010, the Company expects to make the following payments on its contractual obligations (in thousands):
| Payments due by period | ||||||||||||||||||||
| Contractual Obligations |
Total | Less than 1 year |
1 - 3 years |
3 - 5 years |
More than 5 years |
|||||||||||||||
| Long-term debt |
$ | 3,280 | $ | 187 | $ | 3,093 | $ | — | $ | — | ||||||||||
| Operating leases |
15,337 | 4,882 | 6,762 | 2,477 | 1,216 | |||||||||||||||
| Pension liability |
10,247 | 788 | 1,759 | 2,010 | 5,690 | |||||||||||||||
| Liabilities related to uncertain tax positions |
1,507 | 221 | 503 | 783 | — | |||||||||||||||
| Future interest on notes payable and long-term debt |
450 | 150 | 300 | — | — | |||||||||||||||
| Total |
$ | 30,821 | $ | 6,228 | $ | 12,417 | $ | 5,270 | $ | 6,906 | ||||||||||
The Company is a defendant in a lawsuit entitled United States of America ex rel Taylor Smith, Jeannine Prewitt and James Ailes v. The Boeing Company and Ducommun Inc., filed in the United States District Court for the District of Kansas (the “District Court”). The lawsuit is a qui tam action brought against The Boeing Company (“Boeing”) and Ducommun on behalf of the United States of America for violations of the United States False Claims Act. The lawsuit alleges that Ducommun sold unapproved parts to the Boeing Commercial Airplanes-Wichita Division which were installed by Boeing in aircraft ultimately sold to the United States government. The number of Boeing aircraft subject to the lawsuit has been reduced to 25 aircraft following the District Court’s granting of partial summary judgment in favor of Boeing and Ducommun. The lawsuit seeks damages, civil penalties and other relief from the defendants for presenting or causing to be presented false claims for payment to the United States government. Although the amount of alleged damages are not specified, the lawsuit seeks damages in an amount equal to three times the amount of damages the United States government sustained because of the defendants’ actions, plus a civil penalty of $10,000 for each false claim made on or before September 28, 1999, and $11,000 for each false claim made on or after September 28, 1999, together with attorneys’ fees and costs. The Company intends to defend itself vigorously against the lawsuit. The Company, at this time, is unable to estimate what, if any, liability it may have in connection with the lawsuit.
DAS has been directed by California environmental agencies to investigate and take corrective action for ground water contamination at its facilities located in El Mirage and Monrovia, California. Based on currently available information, the Company has established a reserve for its estimated liability for such investigation and corrective action in the approximate amount of $1,509,000. DAS also faces liability as a potentially responsible party for hazardous waste disposed at two landfills located in Casmalia and West Covina, California. DAS and other companies and government entities have entered into consent decrees with respect to each
35
Table of Contents
landfill with the United States Environmental Protection Agency and/or California environmental agencies under which certain investigation, remediation and maintenance activities are being performed. Based upon currently available information, the Company has established a reserve for its estimated liability in connection with the landfills in the approximate amount of $1,090,000. The Company’s ultimate liability in connection with these matters will depend upon a number of factors, including changes in existing laws and regulations, the design and cost of construction, operation and maintenance activities, and the allocation of liability among potentially responsible parties.
In the normal course of business, Ducommun and its subsidiaries are defendants in certain other litigation, claims and inquiries, including matters relating to environmental laws. In addition, the Company makes various commitments and incurs contingent liabilities. While it is not feasible to predict the outcome of these matters, the Company does not presently expect that any sum it may be required to pay in connection with these matters would have a material adverse effect on its consolidated financial position, results of operations or cash flows.
Off-Balance Sheet Arrangements
The Company’s off-balance sheet arrangements consist of operating leases and indemnities.
Recent Accounting Pronouncements
In April 2010, the FASB issued updated guidance on the use of the milestone method of revenue recognition that applies to research and development transactions in which one or more payments are contingent upon achieving uncertain future events or circumstances. This update provides guidance on the criteria that should be met for determining whether the milestone method of revenue recognition is appropriate. This guidance is effective on a prospective basis for milestones achieved in fiscal years, and interim periods within those years, beginning on or after June 15, 2010. The Company is currently evaluating the impact of this guidance, and it has not yet determined the impact of the standard on its financial position or results of operations, if any.
| ITEM 7A. | QUANTITATIVE AND QUALITATIVE DISCLOSURES ABOUT MARKET RISK. |
The Company had no material market risk disclosures as of December 31, 2010.
36
Table of Contents
| ITEM 8. | FINANCIAL STATEMENTS AND SUPPLEMENTARY DATA |
The financial statements and supplementary data together with the report thereon of PricewaterhouseCoopers LLP listed in the index at Item 15(a) 1 and 2 are incorporated herein by reference.
| ITEM 9. | CHANGES IN AND DISAGREEMENTS WITH ACCOUNTANTS ON ACCOUNTING AND FINANCIAL DISCLOSURE |
None.
| ITEM 9A. | CONTROLS AND PROCEDURES |
Disclosure Controls and Procedures
The Company’s chief executive officer and chief financial officer have concluded, based on an evaluation of the Company’s disclosure controls and procedures (as defined in the Securities Exchange Act of 1934 Rules 13a-15(e) and 15d-15(e)), that such disclosure controls and procedures were effective as of the end of the period covered by this report.
Internal Control Over Financial Reporting
Management’s report on the Company’s internal control over financial reporting as of December 31, 2010 is included under Item 15(a)(1) of this Annual Report on Form 10-K.
Changes in Internal Control Over Financial Reporting
There has been no change in the Company’s internal control over financial reporting during the three months ended December 31, 2010 that has materially affected, or is reasonably likely to materially affect, our internal control over financial reporting.
| ITEM 9B. | OTHER INFORMATION |
None.
37
Table of Contents
PART III
| ITEM 10. | DIRECTORS AND EXECUTIVE OFFICERS OF THE REGISTRANT |
Directors of the Registrant
The information under the caption “Election of Directors” in the 2011 Proxy Statement is incorporated herein by reference.
Executive Officers of the Registrant
The following table sets forth the names and ages of all executive officers of the Company, as of the date of this report, all positions and offices held with the Company and brief accounts of business experience during the past five years. Executive officers do not serve for any specified terms, but are typically elected annually by the Board of Directors of the Company or, in the case of subsidiary presidents, by the Board of Directors of the respective subsidiaries.
| Name (Age) |
Positions and Offices Held With Company (Year Elected) |
Other Business Experience (Past Five Years) | ||
| Kathryn M. Andrus (42) |
Vice President, Internal Audit (2008) |
Director of Internal Audit (2005-2008); Senior Manager Internal Controls and Compliance of Unified Western Grocers, Inc. (2003-2005) | ||
| Joseph P. Bellino (60) |
Vice President and Chief Financial Officer (2008) |
Executive Vice President and CFO of Kaiser Aluminum Corporation (2006-2008); CFO and Treasurer of Steel Technologies (1997-2006) | ||
| Donald C. DeVore (48) |
Vice President and Treasurer (2008) |
Senior Vice President Finance and IT of Ducommun AeroStructures, Inc. (2001-2008) | ||
| James S. Heiser (54) |
Vice President (1990), General Counsel (1988), and Secretary (1987) |
Chief Financial Officer (1996-2006) and Treasurer (1995-2006) | ||
38
Table of Contents
| Michael G. Pollack (51) |
Vice President of Sales and Marketing (2010) |
Vice President of Sales and Marketing of Ducommun AeroStructures, Inc. (2004-2010); Vice President of Sales and Marketing Ducommun Technologies, Inc. (2008-2010) | ||
| Anthony J. Reardon (60) |
Chief Executive Officer (2010), President (2008) |
President of Ducommun AeroStructures, Inc. (2003-2007) | ||
| Rosalie F. Rogers (49) |
Vice President, Human Resources (2008) |
Vice President, Human Resources of Ducommun AeroStructures, Inc. (2006-2008); Sr. Vice President of Seven Worldwide, Inc. (1998-2006) | ||
| Samuel D. Williams (62) |
Vice President (1991) and Controller (1988) |
— | ||
Audit Committee and Audit Committee Financial Expert
The information under the caption “Committees of the Board of Directors” relating to the Audit Committee of the Board of Directors in the 2011 Proxy Statement is incorporated herein by reference.
Compliance With Section 16(a) of the Exchange Act
The information under the caption “Section 16(a) Beneficial Ownership Reporting Compliance” in the 2011 Proxy Statement is incorporated herein by reference.
Code of Ethics
The information under the caption “Code of Ethics” in the 2011 Proxy Statement is incorporated herein by reference.
Changes to Procedures to Recommend Nominees
There have been no material changes to the procedures by which security holders may recommend nominees to the Company’s Board of Directors since the date of the Company’s last proxy statement.
39
Table of Contents
| ITEM 11. | EXECUTIVE COMPENSATION |
The information under the captions “Compensation of Executive Officers,” “Compensation of Directors,” “Compensation Committee Interlocks and Insider Participation” and “Compensation Committee Report” in the 2011 Proxy Statement is incorporated herein by reference.
| ITEM 12. | SECURITY OWNERSHIP OF CERTAIN BENEFICIAL OWNERS AND MANAGEMENT |
The information under the caption “Security Ownership of Certain Beneficial Owners and Management” in the 2011 Proxy Statement is incorporated herein by reference.
| ITEM 13. | CERTAIN RELATIONSHIPS AND RELATED TRANSACTIONS |
The information under the caption “Election of Directors” in the 2011 Proxy Statement is incorporated herein by reference.
| ITEM 14. | PRINCIPAL ACCOUNTANT FEES AND SERVICES |
The information under the caption “Principal Accountant Fees and Services” contained in the 2011 Proxy Statement is incorporated herein by reference.
40
Table of Contents
PART IV
| ITEM 15. | EXHIBITS, FINANCIAL STATEMENT SCHEDULES, AND REPORTS ON FORM 8-K |
| (a) | 1. Financial Statements |
The following consolidated financial statements of Ducommun Incorporated and subsidiaries, are incorporated by reference in Item 8 of this report.
| Page | ||||
| Management’s Report on Internal Control Over Financial Reporting |
42 | |||
| 43 - 44 | ||||
| Consolidated Statements of Income - Years Ended December 31, 2010, 2009 and 2008 |
45 | |||
| 46 | ||||
| 47 | ||||
| Consolidated Statements of Cash Flows - Years Ended December 31, 2010, 2009 and 2008 |
48 | |||
| 49 - 75 | ||||
| 75 | ||||
| 2. Financial Statement Schedule |
||||
| The following schedule for the years ended December 31, 2010, 2009 and 2008 is filed herewith: |
||||
| 76 | ||||
All other schedules have been omitted because they are not applicable, not required, or the information has been otherwise supplied in the financial statements or notes thereto.
| 3. Exhibits |
||||
| 77 -80 | ||||
| 81 - 82 | ||||
41
Table of Contents
Management’s Report on Internal Control Over Financial Reporting
Management of Ducommun Incorporated (the “Company”) is responsible for establishing and maintaining adequate internal control over financial reporting as defined in Rules 13a-15(f) and 15d-15(f) under the Securities Exchange Act of 1934. The Company’s internal control over financial reporting is designed to provide reasonable assurance regarding the reliability of financial reporting and the preparation of financial statements for external purposes in accordance with generally accepted accounting principles. The Company’s internal control over financial reporting includes those policies and procedures that (i) pertain to the maintenance of records that, in reasonable detail, accurately and fairly reflect the transactions and dispositions of the assets of the Company, (ii) provide reasonable assurance that transactions are recorded as necessary to permit preparation of financial statements in accordance with generally accepted accounting principles, and that receipts and expenditures of the Company are being made only in accordance with authorizations of management and directors of the Company, and (iii) provide reasonable assurance regarding prevention or timely detection of unauthorized acquisition, use or disposition of the Company’s assets that could have a material effect on the financial statements.
Because of its inherent limitations, internal control over financial reporting may not prevent or detect misstatements. Also, projections of any evaluation of effectiveness to future periods are subject to the risk that controls may become inadequate because of changes in conditions, or that the degree of compliance with the policies or procedures may deteriorate.
Management assessed the effectiveness of the Company’s internal control over financial reporting as of December 31, 2010. In making this assessment, management used the criteria set forth by the Committee of Sponsoring Organizations of the Treadway Commission (COSO) in Internal Control-Integrated Framework. Based on our assessment and those criteria, management concluded that the Company maintained effective internal control over financial reporting as of December 31, 2010.
PricewaterhouseCoopers LLP, the Company’s independent registered public accounting firm, has audited the effectiveness of the Company’s internal control over financial reporting as stated in the report which appears immediately following this Management’s Report on Internal Control over Financial Reporting.
42
Table of Contents
Report of Independent Registered Public Accounting Firm
To the Board of Directors and Shareholders of Ducommun Incorporated:
In our opinion, the consolidated financial statements listed in the index appearing under Item 15(a)(1) present fairly, in all material respects, the financial position of Ducommun Incorporated and its subsidiaries at December 31, 2010 and 2009, and the results of their operations and their cash flows for each of the three years in the period ended December 31, 2010 in conformity with accounting principles generally accepted in the United States of America. In addition, in our opinion, the financial statement schedule listed in index appearing under Item 15(a)(2) presents fairly, in all material respects, the information set forth therein when read in conjunction with the related consolidated financial statements. Also in our opinion, the Company maintained, in all material respects, effective internal control over financial reporting as of December 31, 2010, based on criteria established in Internal Control - Integrated Framework issued by the Committee of Sponsoring Organizations of the Treadway Commission (COSO). The Company’s management is responsible for these financial statements and financial statement schedule, for maintaining effective internal control over financial reporting and for its assessment of the effectiveness of internal control over financial reporting, included in Management’s Report on Internal Control Over Financial Reporting appearing under Item 15(a)(1). Our responsibility is to express opinions on these financial statements, on the financial statement schedule, and on the Company’s internal control over financial reporting based on our integrated audits. We conducted our audits in accordance with the standards of the Public Company Accounting Oversight Board (United States). Those standards require that we plan and perform the audits to obtain reasonable assurance about whether the financial statements are free of material misstatement and whether effective internal control over financial reporting was maintained in all material respects. Our audits of the financial statements included examining, on a test basis, evidence supporting the amounts and disclosures in the financial statements, assessing the accounting principles used and significant estimates made by management, and evaluating the overall financial statement presentation. Our audit of internal control over financial reporting included obtaining an understanding of internal control over financial reporting, assessing the risk that a material weakness exists, and testing and evaluating the design and operating effectiveness of internal control based on the assessed risk. Our audits also included performing such other procedures as we considered necessary in the circumstances. We believe that our audits provide a reasonable basis for our opinions.
A company’s internal control over financial reporting is a process designed to provide reasonable assurance regarding the reliability of financial reporting and the preparation of financial statements for external purposes in accordance with generally accepted accounting principles. A company’s internal control over financial reporting includes those policies and procedures that (i) pertain to the maintenance of records that, in reasonable detail, accurately and fairly reflect the transactions and dispositions of the assets of the company; (ii) provide reasonable assurance that transactions are recorded as necessary to permit preparation of financial statements in accordance with generally accepted accounting principles, and that receipts and expenditures of the company are being made only in accordance with authorizations of management and directors of the company; and (iii) provide reasonable assurance regarding prevention or timely detection of unauthorized acquisition, use, or disposition of the company’s assets that could have a material effect on the financial statements.
43
Table of Contents
Because of its inherent limitations, internal control over financial reporting may not prevent or detect misstatements. Also, projections of any evaluation of effectiveness to future periods are subject to the risk that controls may become inadequate because of changes in conditions, or that the degree of compliance with the policies or procedures may deteriorate.
PricewaterhouseCoopers LLP
Los Angeles, California
February 21, 2011
44
Table of Contents
Consolidated Statements of Income
| Year Ended December 31, |
2010 | 2009 | 2008 | |||||||||
| (In thousands, except per share amounts) | ||||||||||||
| Sales and Service Revenues |
||||||||||||
| Product sales |
$ | 367,563 | $ | 372,371 | $ | 344,617 | ||||||
| Service revenues |
40,843 | 58,377 | 59,186 | |||||||||
| Net Sales |
408,406 | 430,748 | 403,803 | |||||||||
| Operating Costs and Expenses: |
||||||||||||
| Cost of product sales |
296,104 | 305,705 | 273,974 | |||||||||
| Cost of service revenues |
32,156 | 46,210 | 47,926 | |||||||||
| Selling, general and administrative expenses |
53,678 | 49,615 | 50,548 | |||||||||
| Goodwill impairment |
— | 12,936 | 13,064 | |||||||||
| Total Operating Costs and Expenses |
381,938 | 414,466 | 385,512 | |||||||||
| Operating Income |
26,468 | 16,282 | 18,291 | |||||||||
| Interest Expense |
(1,805 | ) | (2,522 | ) | (1,242 | ) | ||||||
| Income Before Taxes |
24,663 | 13,760 | 17,049 | |||||||||
| Income Tax Expense |
(4,855 | ) | (3,577 | ) | (3,937 | ) | ||||||
| Net Income |
$ | 19,808 | $ | 10,183 | $ | 13,112 | ||||||
| Earnings Per Share: |
||||||||||||
| Basic earnings per share |
$ | 1.89 | $ | 0.97 | $ | 1.24 | ||||||
| Diluted earnings per share |
$ | 1.87 | $ | 0.97 | $ | 1.23 | ||||||
| Weighted Average Number of Common Shares Outstanding: |
||||||||||||
| Basic |
10,488,000 | 10,461,000 | 10,563,000 | |||||||||
| Diluted |
10,596,000 | 10,510,000 | 10,649,000 | |||||||||
See accompanying notes to consolidated financial statements.
45
Table of Contents
Consolidated Balance Sheets
| December 31, |
2010 | 2009 | ||||||
| (In thousands, except share data) | ||||||||
| Assets |
||||||||
| Current Assets: |
||||||||
| Cash and cash equivalents |
$ | 10,268 | $ | 18,629 | ||||
| Accounts receivable (less allowance for doubtful accounts of $415 and $570) |
47,949 | 48,378 | ||||||
| Unbilled receivables |
3,856 | 4,207 | ||||||
| Inventories |
72,597 | 67,749 | ||||||
| Production cost of contracts |
16,889 | 12,882 | ||||||
| Deferred income taxes |
5,085 | 4,794 | ||||||
| Other current assets |
4,748 | 7,452 | ||||||
| Total Current Assets |
161,392 | 164,091 | ||||||
| Property and Equipment, Net |
59,461 | 60,923 | ||||||
| Goodwill |
100,442 | 100,442 | ||||||
| Other Assets |
24,157 | 28,453 | ||||||
| $ | 345,452 | $ | 353,909 | |||||
| Liabilities and Shareholders’ Equity |
||||||||
| Current Liabilities: |
||||||||
| Current portion of long-term debt |
$ | 187 | $ | 4,963 | ||||
| Accounts payable |
39,925 | 39,434 | ||||||
| Accrued liabilities |
31,174 | 33,869 | ||||||
| Total Current Liabilities |
71,286 | 78,266 | ||||||
| Long-Term Debt, Less Current Portion |
3,093 | 23,289 | ||||||
| Deferred Income Taxes |
7,691 | 7,732 | ||||||
| Other Long-Term Liabilities |
9,197 | 10,736 | ||||||
| Total Liabilities |
91,267 | 120,023 | ||||||
| Commitments and Contingencies |
||||||||
| Shareholders’ Equity: |
||||||||
| Common stock — $.01 par value; authorized 35,000,000 shares; issued 10,650,443 shares in 2010 and 10,593,726 shares in 2009 |
106 | 106 | ||||||
| Treasury stock — held in treasury 143,300 shares in 2010 and 2009 |
(1,924 | ) | (1,924 | ) | ||||
| Additional paid-in capital |
61,684 | 58,498 | ||||||
| Retained earnings |
197,421 | 180,760 | ||||||
| Accumulated other comprehensive loss |
(3,102 | ) | (3,554 | ) | ||||
| Total Shareholders’ Equity |
254,185 | 233,886 | ||||||
| $ | 345,452 | $ | 353,909 | |||||
See accompanying notes to consolidated financial statements.
46
Table of Contents
Consolidated Statements of Changes in Shareholders’ Equity
| Shares Outstanding |
Common Stock |
Additional Paid-In Capital |
Retained Earnings (Deficit) |
Treasury Stock |
Accumulated Other Comprehensive Income/ (Expense) |
Total Shareholders’ Equity |
||||||||||||||||||||||
| (In thousands, except share data) | ||||||||||||||||||||||||||||
| Balance at December 31, 2007 |
10,549,253 | 105 | 53,444 | 162,192 | — | (1,690 | ) | 214,051 | ||||||||||||||||||||
| Comprehensive income: |
||||||||||||||||||||||||||||
| Net income |
13,112 | 13,112 | ||||||||||||||||||||||||||
| Equity adjustment for additional pension liability, net of tax |
(2,309 | ) | ||||||||||||||||||||||||||
| Equity adjustment for cash flow hedge mark-to-market adjustment, net of tax |
(433 | ) | (2,742 | ) | ||||||||||||||||||||||||
| 10,370 | ||||||||||||||||||||||||||||
| Cash Dividends |
(1,586 | ) | (1,586 | ) | ||||||||||||||||||||||||
| Common stock repurchased for treasury |
(69,000 | ) | (986 | ) | — | (986 | ) | |||||||||||||||||||||
| Stock options exercised |
32,750 | 1 | 523 | — | — | 524 | ||||||||||||||||||||||
| Stock repurchased related to the exercise of stock options |
(1,417 | ) | — | (39 | ) | — | — | (39 | ) | |||||||||||||||||||
| Stock Based Compensation |
2,623 | 2,623 | ||||||||||||||||||||||||||
| Income tax provision related to the exercise of nonqualified stock options |
— | — | (511 | ) | — | — | (511 | ) | ||||||||||||||||||||
| Balance at December 31, 2008 |
10,511,586 | $ | 106 | $ | 56,040 | $ | 173,718 | $ | (986 | ) | $ | (4,432 | ) | $ | 224,446 | |||||||||||||
| Comprehensive income: |
||||||||||||||||||||||||||||
| Net income |
10,183 | 10,183 | ||||||||||||||||||||||||||
| Equity adjustment for additional pension liability, net of tax |
494 | |||||||||||||||||||||||||||
| Equity adjustment for cash flow hedge mark-to-market adjustment, net of tax |
384 | 878 | ||||||||||||||||||||||||||
| 11,061 | ||||||||||||||||||||||||||||
| Cash Dividends |
(3,141 | ) | (3,141 | ) | ||||||||||||||||||||||||
| Common stock repurchased for treasury |
(74,300 | ) | (938 | ) | — | (938 | ) | |||||||||||||||||||||
| Stock options exercised |
19,416 | — | 44 | — | — | 44 | ||||||||||||||||||||||
| Stock repurchased related to the exercise of stock options |
(6,276 | ) | — | (105 | ) | — | — | (105 | ) | |||||||||||||||||||
| Stock Based Compensation |
2,404 | 2,404 | ||||||||||||||||||||||||||
| Income tax benefit related to the exercise of nonqualified stock options |
— | — | 115 | — | — | 115 | ||||||||||||||||||||||
| Balance at December 31, 2009 |
10,450,426 | $ | 106 | $ | 58,498 | $ | 180,760 | $ | (1,924 | ) | $ | (3,554 | ) | $ | 233,886 | |||||||||||||
| Comprehensive income: |
||||||||||||||||||||||||||||
| Net income |
19,808 | 19,808 | ||||||||||||||||||||||||||
| Equity adjustment for additional pension liability, net of tax |
44 | |||||||||||||||||||||||||||
| Equity adjustment for cash flow hedge mark-to-market adjustment, net of tax |
408 | 452 | ||||||||||||||||||||||||||
| 20,260 | ||||||||||||||||||||||||||||
| Cash Dividends |
(3,147 | ) | (3,147 | ) | ||||||||||||||||||||||||
| Stock options exercised |
77,156 | — | 769 | — | — | 769 | ||||||||||||||||||||||
| Stock repurchased related to the exercise of stock options |
(20,439 | ) | — | (404 | ) | — | — | (404 | ) | |||||||||||||||||||
| Stock Based Compensation |
2,517 | 2,517 | ||||||||||||||||||||||||||
| Income tax benefit related to the exercise of nonqualified stock options |
— | — | 304 | — | — | 304 | ||||||||||||||||||||||
| Balance at December 31, 2010 |
10,507,143 | $ | 106 | $ | 61,684 | $ | 197,421 | $ | (1,924 | ) | $ | (3,102 | ) | $ | 254,185 | |||||||||||||
47
Table of Contents
Consolidated Statements of Cash Flows
| Year Ended December 31, |
2010 | 2009 | 2008 | |||||||||
| (In thousands) | ||||||||||||
| Cash Flows from Operating Activities: |
||||||||||||
| Net Income |
$ | 19,808 | $ | 10,183 | $ | 13,112 | ||||||
| Non-Cash (Income)/Expenses: |
||||||||||||
| Depreciation and amortization |
13,597 | 13,550 | 10,477 | |||||||||
| Impairment of goodwill |
— | 12,936 | 13,064 | |||||||||
| Stock-based compensation expense |
2,517 | 2,404 | 2,623 | |||||||||
| Deferred income tax provision/(benefit) |
(495 | ) | 1,819 | (4,459 | ) | |||||||
| Income tax benefit from stock-based compensation |
304 | 115 | 87 | |||||||||
| (Recovery of)/Provision for doubtful accounts |
(155 | ) | (1,124 | ) | 1,302 | |||||||
| Other - (increase)/decrease |
384 | (525 | ) | 1,079 | ||||||||
| Changes in Assets and Liabilities: |
||||||||||||
| Accounts receivable - decrease/(increase) |
584 | 2,836 | (6,235 | ) | ||||||||
| Unbilled receivable - decrease/(increase) |
351 | 2,867 | (1,459 | ) | ||||||||
| Inventories - decrease/(increase) |
(4,848 | ) | 5,321 | (6,581 | ) | |||||||
| Production cost of contracts - increase |
(5,215 | ) | (4,794 | ) | (465 | ) | ||||||
| Other assets - decrease/(increase) |
2,721 | 356 | (572 | ) | ||||||||
| Accounts payable - increase/(decrease) |
491 | 4,076 | (433 | ) | ||||||||
| Accrued and other liabilities - (decrease)/increase |
(3,573 | ) | (19,208 | ) | 6,504 | |||||||
| Net Cash Provided by Operating Activities |
26,471 | 30,812 | 28,044 | |||||||||
| Cash Flows from Investing Activities: |
||||||||||||
| Purchase of property and equipment |
(7,106 | ) | (7,689 | ) | (12,418 | ) | ||||||
| Acquisition of businesses, net of cash acquired |
— | — | (39,283 | ) | ||||||||
| Proceeds from sale of assets |
2 | 2 | 7 | |||||||||
| Net Cash Used in Investing Activities |
(7,104 | ) | (7,687 | ) | (51,694 | ) | ||||||
| Cash Flows from Financing Activities: |
||||||||||||
| Repayment of long-term debt |
(24,956 | ) | (2,454 | ) | (2,400 | ) | ||||||
| Cash dividends paid |
(3,147 | ) | (3,141 | ) | (1,586 | ) | ||||||
| Debt issue cost paid |
— | (1,409 | ) | — | ||||||||
| Repurchase of stock |
— | (938 | ) | (986 | ) | |||||||
| Net cash effect of exercise related to stock options |
366 | (62 | ) | 484 | ||||||||
| Excess tax benefit from stock-based compensation |
9 | — | 75 | |||||||||
| Net Cash Used in Financing Activities |
(27,728 | ) | (8,004 | ) | (4,413 | ) | ||||||
| Net Decrease in Cash and Cash Equivalents |
(8,361 | ) | 15,121 | (28,063 | ) | |||||||
| Cash and Cash Equivalents - Beginning of Period |
18,629 | 3,508 | 31,571 | |||||||||
| Cash and Cash Equivalents - End of Period |
$ | 10,268 | $ | 18,629 | $ | 3,508 | ||||||
| Supplemental Disclosures of Cash Flow Information: |
||||||||||||
| Interest paid |
$ | 1,799 | $ | 2,222 | $ | 1,243 | ||||||
| Taxes paid |
$ | 2,546 | $ | 6,960 | $ | 7,618 | ||||||
Supplemental information for Non-Cash Investing and Financing Activities:
See Note 2 for non-cash investing activities related to the acquisition of businesses.
See accompanying notes to consolidated financial statements.
48
Table of Contents
Notes to Consolidated Financial Statements
Note 1. Summary of Significant Accounting Policies
Consolidation
The consolidated financial statements include the accounts of Ducommun Incorporated and its subsidiaries (“Ducommun” or the “Company”), after eliminating intercompany balances and transactions.
Ducommun operates in two business segments. Ducommun AeroStructures, Inc. (“DAS”), engineers and manufactures aerospace structural components and subassemblies. Ducommun Technologies, Inc. (“DTI”), designs, engineers and manufactures electromechanical components and subsystems, and provides engineering, technical and program management services (including design, development, integration and test of prototype products) principally for the aerospace and military markets. The significant accounting policies of the Company and its two business segments are as described below.
Subsequent Events
In connection with the preparation of the consolidated financial statements, the Company has evaluated subsequent events through February 21, 2011 which is the date the financial statements were issued.
Cash Equivalents
Cash equivalents consist of highly liquid instruments purchased with original maturities of three months or less. The cost of these investments approximates fair value.
Revenue Recognition
The Company recognizes product sales when persuasive evidence of an arrangement exists, the price is fixed or determinable, collection is reasonably assured and delivery of products has occurred or services have been rendered. Revenue from products sold under long-term contracts is recognized by the Company on a comparable basis to other sale transactions using the units of delivery method. The Company also recognizes revenue on the sale of services (including prototype products) based on the type of contract: time and materials, cost-plus reimbursement and firm-fixed price. Revenue is recognized (i) on time and materials contracts as time is spent at hourly rates, which are negotiated with customers, plus the cost of any allowable materials and out-of-pocket expenses, (ii) on cost plus reimbursement contracts based on direct and indirect costs incurred plus a negotiated profit calculated as a percentage of cost, a fixed amount or a performance-based award fee, and (iii) on fixed-price service contracts on the percentage-of-completion method measured by the percentage of costs incurred to estimated total costs.
49
Table of Contents
Provision for Estimated Losses on Contracts
The Company records provisions for estimated losses on contracts considering total estimated costs to complete the contract compared to total anticipated revenues in the period in which such losses are identified.
Allowance for Doubtful Accounts
The Company maintains an allowance for doubtful accounts for estimated losses from the inability of customers to make required payments. The allowance for doubtful accounts is evaluated periodically based on the aging of accounts receivable, the financial condition of customers and their payment history, historical write-off experience and other assumptions.
Inventory Valuation
Inventories are stated at the lower of cost or market, cost being determined on a first-in, first-out basis. Inventoried costs include raw materials, outside processing, direct labor and allocated overhead, adjusted for any abnormal amounts of idle facility expense, freight, handling costs, and wasted materials (spoilage) incurred, but do not include any selling, general and administrative expense. Costs under long-term contracts are accumulated into, and removed from, inventory on the same basis as other contracts. The Company assesses the inventory carrying value and reduces it if necessary to its net realizable value based on customer orders on hand, and internal demand forecasts using management’s best estimates given information currently available. The Company maintains an allowance for potentially excess and obsolete inventories and inventories that are carried at costs that are higher than their estimated net realizable values.
Production Cost of Contracts
Costs are incurred for certain long-term contracts that require machinery or tools to build the parts as specified within the contract. These costs include production and tooling costs. The production contract costs are recorded to cost of sales using the units of delivery method. Approximately $10,087,000 in such costs were reclassified from inventory as of December 31, 2008. Approximately $4,982,000 of the 2009 balance will be recovered from customers after one year.
Property and Depreciation
Property and equipment, including assets recorded under capital leases, are recorded at cost. Depreciation and amortization are computed using the straight-line method over the estimated useful lives and, in the case of leasehold improvements, over the shorter of the lives of the improvements or the lease term. The Company evaluates long-lived assets for recoverability considering undiscounted cash flows, when significant changes in conditions occur, and recognizes impairment losses, if any, based upon the fair value of the assets.
50
Table of Contents
Goodwill
The Company’s business acquisitions have resulted in goodwill. Goodwill is not amortized but is subject to impairment tests on an annual basis in the fourth quarter and between annual tests, in certain circumstances, when events indicate an impairment may have occurred. Goodwill is tested for impairment utilizing a two-step method. In the first step, the Company determines the fair value of the reporting unit using expected future discounted cash flows and market valuation approaches (comparable Company revenue and EBITDA multiples), requiring management to make estimates and assumptions about the reporting unit’s future prospects. If the net book value of the reporting unit exceeds the fair value, the Company then performs the second step of the impairment test which requires fair valuation of all the reporting unit’s assets and liabilities in a manner similar to a purchase price allocation, with any residual fair value being allocated to goodwill. This residual fair value of goodwill is then compared to the carrying amount to determine impairment. An impairment charge will be recognized only when the estimated fair value of a reporting unit, including goodwill, is less than its carrying amount.
Income Taxes
The Company accounts for income taxes by recognizing deferred tax assets and liabilities using enacted tax rates for the effect of temporary differences between the book and tax bases of recorded assets and liabilities. Deferred tax assets are reduced by a valuation allowance if it is more likely than not that some portion or all of the deferred tax asset will not be realized.
Tax positions taken or expected to be taken in a tax return are recognized when it is more-likely-than-not to be sustained upon examination by taxing authorities. The amount recognized is measured as the largest amount of benefit that is greater than 50 percent likely of being realized upon ultimate settlement.
Litigation and Commitments
In the normal course of business, the Company and its subsidiaries are defendants in certain litigation, claims and inquiries, including matters relating to environmental laws. In addition, the Company makes various commitments and incurs contingent liabilities. Management’s estimates regarding contingent liabilities could differ from actual results.
Environmental Liabilities
Environmental liabilities are recorded when environmental assessments and/or remedial efforts are probable and costs can be reasonably estimated. Generally, the timing of these accruals coincides with the completion of a feasibility study or the Company’s commitment to a formal plan of action. Further, the Company reviews and updates its environmental accruals as circumstances change and/or additional information is obtained that reasonably could be expected to have a meaningful effect on the outcome of a matter or the estimated cost thereof.
51
Table of Contents
Accounting for Stock-Based Compensation
The Company recognizes compensation expense for share-based payment transactions in the financial statements at their fair value. The expense is measured at the grant date, based on the calculated fair value of the share-based award, and is recognized over the requisite service period (generally the vesting period of the equity award).
Other Intangible Assets
The Company amortizes purchased other intangible assets with finite lives over the estimated economic lives of the assets, ranging from one to fourteen years generally using the straight-line method. The value of other intangibles acquired through business combinations has been estimated using present value techniques which involve estimates of future cash flows. The Company evaluates other intangible assets for recoverability considering undiscounted cash flows, when significant changes in conditions occur, and recognizes impairment losses, if any, based upon the estimated fair value of the assets.
Earnings Per Share
Basic earnings per share is computed by dividing income available to common shareholders by the weighted average number of common shares outstanding in each period. Diluted earnings per share is computed by dividing income available to common shareholders plus income associated with dilutive securities by the weighted average number of common shares outstanding plus any potential dilutive shares that could be issued if exercised or converted into common stock in each period.
The weighted average number of shares outstanding used to compute earnings per share is as follows:
| Year Ended | ||||||||||||
| December 31, 2010 |
December 31, 2009 |
December 31, 2008 |
||||||||||
| Basic weighted average shares outstanding |
10,488,000 | 10,461,000 | 10,563,000 | |||||||||
| Dilutive potential common shares |
108,000 | 49,000 | 86,000 | |||||||||
| Diluted weighted average shares outstanding |
10,596,000 | 10,510,000 | 10,649,000 | |||||||||
52
Table of Contents
The numerator used to compute diluted earnings per share is as follows:
| Year Ended | ||||||||||||
| December 31, 2010 |
December 31, 2009 |
December 31, 2008 |
||||||||||
| Net earnings (total numerator) |
$ | 19,808,000 | $ | 10,183,000 | $ | 13,112,000 | ||||||
The weighted average number of shares outstanding, included in the table below, is excluded from the computation of diluted earnings per share because the average market price did not exceed the exercise price. However, these shares may be potentially dilutive common shares in the future.
| Year Ended | ||||||||||||
| December 31, 2010 |
December 31, 2009 |
December 31, 2008 |
||||||||||
| Stock options and stock units |
435,600 | 791,400 | 543,600 | |||||||||
Comprehensive Income
Certain items such as unrealized gains and losses on certain hedging instruments and pension liability adjustments are presented as separate components of shareholders’ equity. The current period change in these items is included in other comprehensive loss and separately reported in the financial statements. Accumulated other comprehensive loss, as reflected in the Consolidated Balance Sheets under the equity section, is comprised of a pension liability adjustment of $3,102,000, net of tax, at December 31, 2010, compared to a pension liability adjustment of $3,146,000 net of tax, and an interest rate hedge mark-to-market adjustment of $408,000, net of tax, at December 31, 2009.
Recent Accounting Pronouncements
In April 2010, the FASB issued updated guidance on the use of the milestone method of revenue recognition that applies to research and development transactions in which one or more payments are contingent upon achieving uncertain future events or circumstances. This update provides guidance on the criteria that should be met for determining whether the milestone method of revenue recognition is appropriate. This guidance is effective on a prospective basis for milestones achieved in fiscal years, and interim periods within those years, beginning on or after June 15, 2010. The Company is currently evaluating the impact of this guidance, and it has not yet determined the impact of the standard on its financial position or results of operations, if any.
53
Table of Contents
Use of Estimates
Certain amounts and disclosures included in the consolidated financial statements require management to make estimates and judgments that affect the amounts of assets, liabilities, revenues and expenses, and related disclosures of contingent assets and liabilities. These estimates are based on historical experience and on various other assumptions that are believed to be reasonable under the circumstances, the results of which form the basis for making judgments about the carrying values of assets and liabilities that are not readily apparent from other sources. Actual results may differ from these estimates.
Reclassifications
Certain prior period information has been reclassified to conform to the current period presentation.
Note 2. Acquisitions
On December 23, 2008, the Company acquired DynaBil Industries, Inc., a privately-owned company based in Coxsackie, New York, for $45,386,000 (net of cash acquired and excluding acquisition costs) and subsequently changed its name to Ducommun AeroStructures New York Inc. (“DAS-New York”). DAS-New York is a leading provider of titanium and aluminum structural components and assemblies for commercial and military aerospace applications. The acquisition was funded from internally generated cash, notes to the sellers, and borrowings of approximately $10,500,000 under the Company’s credit agreement. The operating results for this acquisition have been included in the consolidated statements of income since the date of the acquisition.
The following table presents unaudited pro forma consolidated operating results for the Company for the year ended December 31, 2009, as if the Dynabil acquisition had occurred as of the beginning of the period presented.
| (Unaudited) | ||||
| Year Ended December 31, |
2008 | |||
| (In thousands, except per share amounts) | ||||
| Net sales |
$ | 446,148 | ||
| Net earnings |
7,318 | |||
| Basic earnings per share |
0.69 | |||
| Diluted earnings per share |
0.69 | |||
The consolidated financial statements reflect estimates of the fair value of the assets acquired and liabilities assumed and the related allocation of the purchase price for DynaBil. The principal estimates of fair value were determined using expected net present value techniques utilizing a 15% discount rate. Customer relationships were valued assuming an annual attrition rate of 3%.
54
Table of Contents
The table below summarizes the purchase price allocation for DynaBil at the date of acquisitions.
| December 31, |
2008 | |||
| (In thousands) | ||||
| Tangible assets, exclusive of cash |
$ | 18,523 | ||
| Intangible assets |
19,730 | |||
| Goodwill |
19,809 | |||
| Liabilities assumed |
(12,360 | ) | ||
| Cost of acquisition, net of cash acquired |
$ | 45,702 | ||
The tangible assets included in the table above included an inventory step-up of approximately $1,670,000, which reduced margins in 2009 by $1,520,000.
Note 3. Inventories
Inventories consist of the following:
| December 31, |
2010 | 2009 | ||||||
| (In thousands) | ||||||||
| Raw materials and supplies |
$ | 13,155 | $ | 18,547 | ||||
| Work in process |
61,295 | 65,565 | ||||||
| Finished goods |
6,903 | 4,353 | ||||||
| 81,353 | 88,465 | |||||||
| Less progress payments |
8,756 | 20,716 | ||||||
| Total |
$ | 72,597 | $ | 67,749 | ||||
55
Table of Contents
Note 4. Property and Equipment
Property and equipment consist of the following:
| December 31, |
2010 | 2009 | Range of Estimated Useful Lives |
|||||||||
| (In thousands) | ||||||||||||
| Land |
$ | 11,333 | $ | 11,333 | ||||||||
| Buildings and improvements |
34,067 | 33,501 | 5 -40 Years | |||||||||
| Machinery and equipment |
95,371 | 92,846 | 2 -20 Years | |||||||||
| Furniture and equipment |
21,267 | 20,518 | 2 -10 Years | |||||||||
| Construction in progress |
3,362 | 4,123 | ||||||||||
| 165,400 | 162,321 | |||||||||||
| Less accumulated depreciation and amortization |
105,939 | 101,398 | ||||||||||
| Total |
$ | 59,461 | $ | 60,923 | ||||||||
Depreciation expense was $8,413,000, $8,714,000 and $8,378,000, for the years ended December 31, 2010, 2009 and 2008, respectively.
Note 5. Goodwill and Other Intangible Assets
The carrying amounts of goodwill for the years ended December 31, 2010 and December 31, 2009 are as follows:
| Ducommun AeroStructures |
Ducommun Technologies |
Total Ducommun |
||||||||||
| (In thousands) | ||||||||||||
| Balance at December 31, 2009 |
$ | 56,595 | $ | 43,847 | $ | 100,442 | ||||||
| Goodwill impairment and adjustment |
— | — | — | |||||||||
| Balance at December 31, 2010 |
$ | 56,595 | $ | 43,847 | $ | 100,442 | ||||||
56
Table of Contents
Other intangible assets at December 31, 2010 related to acquisitions are amortized on the straight-line method over periods ranging from one to fourteen years. The fair value of other intangible assets was determined by management and consists of the following:
| December 31, 2010 | December 31, 2009 | |||||||||||||||||||||||
| (In thousands) | Gross Carrying Amount |
Accumulated Amortization |
Net Carrying Amount |
Gross Carrying Amount |
Accumulated Amortization |
Net Carrying Amount |
||||||||||||||||||
| Customer relationships |
$ | 24,200 | $ | 5,400 | $ | 18,800 | $ | 24,200 | $ | 2,678 | $ | 21,522 | ||||||||||||
| Trade names |
4,050 | 2,270 | 1,780 | 4,050 | 1,689 | 2,361 | ||||||||||||||||||
| Non-compete agreements |
2,743 | 2,605 | 138 | 2,743 | 2,047 | 696 | ||||||||||||||||||
| Contract renewal |
1,845 | 571 | 1,274 | 1,845 | 440 | 1,405 | ||||||||||||||||||
| Backlog |
1,153 | 1,153 | — | 1,153 | 1,153 | — | ||||||||||||||||||
| Total |
$ | 33,991 | $ | 11,999 | $ | 21,992 | $ | 33,991 | $ | 8,007 | $ | 25,984 | ||||||||||||
The carrying amount of other intangible assets as of December 31, 2010 and December 31, 2009 are as follows:
| December 31, 2010 | December 31, 2009 | |||||||||||||||||||||||
| Gross | Accumulated Amortization |
Net Carrying Value |
Gross | Accumulated Amortization |
Net Carrying Value |
|||||||||||||||||||
| (In thousands) | ||||||||||||||||||||||||
| Other intangible assets: |
||||||||||||||||||||||||
| Ducommun AeroStructures |
$ | 19,730 | $ | 4,168 | $ | 15,562 | $ | 19,730 | $ | 1,539 | $ | 18,191 | ||||||||||||
| Ducommun Technologies |
14,261 | 7,831 | 6,430 | 14,261 | 6,468 | 7,793 | ||||||||||||||||||
| Total |
$ | 33,991 | $ | 11,999 | $ | 21,992 | $ | 33,991 | $ | 8,007 | $ | 25,984 | ||||||||||||
Amortization expense of other intangible assets was $3,992,000, $2,850,000 and $1,585,000 for the years ended December 31, 2010, 2009 and 2008, respectively. Future amortization expense is expected to be as follows:
| Ducommun AeroStructures |
Ducommun Technologies |
Total Ducommun |
||||||||||
| (In thousands) | ||||||||||||
| 2011 |
$ | 2,867 | $ | 898 | $ | 3,765 | ||||||
| 2012 |
2,828 | 851 | 3,679 | |||||||||
| 2013 |
2,219 | 850 | 3,069 | |||||||||
| 2014 |
1,690 | 851 | 2,541 | |||||||||
| 2015 |
1,360 | 851 | 2,211 | |||||||||
| Thereafter |
4,598 | 2,129 | 6,727 | |||||||||
| $ | 15,562 | $ | 6,430 | $ | 21,992 | |||||||
57
Table of Contents
Note 6. Accrued Liabilities
Accrued liabilities consist of the following:
| December 31, |
2010 | 2009 | ||||||
| (In thousands) | ||||||||
| Accrued compensation |
$ | 20,898 | $ | 22,158 | ||||
| Accrued income tax and sales tax |
3,062 | 413 | ||||||
| Customer deposits |
1,605 | 4,069 | ||||||
| Accrued insurance costs |
1,053 | 1,465 | ||||||
| Customer claims |
1,005 | 1,103 | ||||||
| Provision for contract cost overruns |
348 | 415 | ||||||
| Other |
3,203 | 4,246 | ||||||
| Total |
$ | 31,174 | $ | 33,869 | ||||
Note 7. Long-Term Debt
Long-term debt is summarized as follows:
| December 31, |
2010 | 2009 | ||||||
| (In thousands) | ||||||||
| Bank credit agreement |
$ | — | $ | 20,000 | ||||
| Notes and other liabilities for acquisitions |
3,280 | 8,252 | ||||||
| Total debt |
3,280 | 28,252 | ||||||
| Less current portion |
187 | 4,963 | ||||||
| Total long-term debt |
$ | 3,093 | $ | 23,289 | ||||
Future long-term debt payments are as follows:
| (In thousands) |
Long-Term Debt |
|||||||
| 2012 |
$ | 39 | ||||||
| 2013 |
3,054 | |||||||
| Total |
$ | 3,093 | ||||||
The Company is a party to a Second Amended and Restated Credit Agreement with Bank of America, N.A., as Administrative Agent, Wells Fargo Bank, National Association, as Syndication Agent, Union Bank, N.A., as Documentation Agent and the other lenders named therein dated June 26, 2009 (the “Credit Agreement”). The Credit Agreement provides for an unsecured revolving credit line of $120,000,000 maturing on June 26, 2014. Interest is payable quarterly on the outstanding borrowings at Bank of America’s prime rate (3.25% at December 31, 2010) plus a spread (1.5% to 2.0% per annum based on the leverage ratio of the Company)
58
Table of Contents
or, at the election of the Company, for terms of up to six months at the LIBOR rate (0.26% at December 31, 2010 for one month LIBOR) plus a spread (2.5% to 3.0% per annum depending on the leverage ratio of the Company). The Credit Agreement includes minimum fixed charge coverage, maximum leverage and minimum net worth covenants, an unused commitment fee (0.50% to 0.60% per annum depending on the leverage ratio of the Company), and limitations on future dispositions of property, repurchases of common stock, dividends, outside indebtedness, and acquisitions. At December 31, 2010, the Company had $119,550,000 of unused lines of credit, after deducting $450,000 for outstanding standby letters of credit. The Company had no outstanding loans and was in compliance with all covenants at December 31, 2010.
In connection with the DAS-New York acquisition in December 2008, the Company issued a promissory note in the initial principal amount of $7,000,000 with interest of 5% per annum payable annually on each anniversary of the closing date (December 23). Principal of the promissory note in the amount of $4,000,000 was paid on June 23, 2010 and $3,000,000 is payable December 23, 2013.
The weighted average interest rate on borrowings outstanding was 4.76% at December 31, 2010, compared to 6.14% at December 31, 2009. The carrying amount of long-term debt approximates fair value based on the terms of the related debt, recent transactions and estimates using interest rates currently available to the Company for debt with similar terms and remaining maturities.
Note 8. Shareholders’ Equity
The Company is authorized to issue five million shares of preferred stock. At December 31, 2010 and 2009, no preferred shares were issued or outstanding.
At December 31, 2010, $2,773,030 remained available to repurchase common stock of the Company under stock repurchase programs as previously approved by the Board of Directors. The Company did not repurchase in the open market any of its common stock during 2010. The Company repurchased in the open market 74,300 shares, or $938,000 of its common stock in 2009. The Company repurchased in the open market 69,000 shares, or $986,000 of its common stock in 2008.
Note 9. Stock Options
The Company has three stock option or incentive plans. Stock awards may be made to directors, officers and key employees under the stock plans on terms determined by the Compensation Committee of the Board of Directors or, with respect to directors, on terms determined by the Board of Directors. Stock options have been and may be granted to directors, officers and key employees under the stock plans at prices not less than 100% of the market value on the date of grant, and expire not more than ten years from the date of grant. The option price and number of shares are subject to adjustment under certain dilutive circumstances. In 2010, performance stock units were awarded to ten officers and key employees, and restricted stock units were awarded to seven directors. In 2009, performance stock units were awarded to eight officers and key employees. In 2008, performance stock units were awarded to four officers and restricted stock units were awarded to one officer.
59
Table of Contents
The Company applies fair value accounting for stock-based compensation based on the grant-date fair value estimated using a Black-Scholes valuation model. The Company recognizes compensation expense, net of an estimated forfeiture rate, on a straight-line basis over the requisite service period of the award. The Company has one award population with an option vesting term of four years. The Company estimates the forfeiture rate based on its historic experience. Tax benefits realized from stock award exercise gains in excess of stock-based compensation expense recognized for financial statement purposes are reported as cash flows from financing activities rather than as operating cash flows.
The Company also examines its historic pattern of option exercises in an effort to determine if there were any discernable activity patterns based on certain stock option holder populations. The table below presents the weighted average expected life in months of the two identified stock option holder populations. The expected life computation is based on historic exercise patterns and post-vesting termination behavior within each of the two populations identified. The risk-free interest rate for periods within the contractual life of the award is based on the U.S. Treasury yield curve in effect at the time of grant. The expected volatility is derived from historical volatility of the Company’s common stock.
The fair value of each share-based payment award was estimated using the following assumptions and weighted average fair values as follows:
| Stock Options (1) | ||||||||||||
| Year Ended December 31, |
2010 | 2009 | 2008 | |||||||||
| Weighted average fair value of grants |
$ | 6.43 | $ | 7.16 | $ | 10.51 | ||||||
| Risk-free interest rate |
1.99 | % | 2.72 | % | 3.42 | % | ||||||
| Dividend yield |
1.66 | % | 1.68 | % | 0.00 | % | ||||||
| Expected volatility |
42.90 | % | 43.14 | % | 35.52 | % | ||||||
| Expected life in months |
66 | 65 | 65 | |||||||||
| (1) | The fair value calculation was based on stock options granted during the period. |
60
Table of Contents
Option activity during the three years ended December 31, 2010 was as follows:
| 2010 | 2009 | 2008 | ||||||||||||||||||||||
| Number of Shares |
Weighted Average Exercise Price |
Number of Shares |
Weighted Average Exercise Price |
Number of Shares |
Weighted Average Exercise Price |
|||||||||||||||||||
| Outstanding at December 31 |
817,500 | $ | 21.070 | 681,500 | $ | 22.128 | 583,875 | $ | 21.079 | |||||||||||||||
| Options granted |
190,950 | 18.040 | 199,000 | 17.952 | 190,000 | 24.416 | ||||||||||||||||||
| Options exercised |
(45,850 | ) | 16.797 | (2,750 | ) | 15.721 | (32,750 | ) | 15.975 | |||||||||||||||
| Options forfeited |
(32,750 | ) | 21.231 | (60,250 | ) | 22.983 | (59,625 | ) | 22.518 | |||||||||||||||
| Outstanding at December 31 |
929,850 | $ | 20.654 | 817,500 | $ | 21.070 | 681,500 | $ | 22.128 | |||||||||||||||
| Exerciseable at December 31 |
511,900 | $ | 21.538 | 409,375 | $ | 21.206 | 295,500 | $ | 20.547 | |||||||||||||||
| Available for grant at December 31 |
406,310 | 37,655 | 206,225 | |||||||||||||||||||||
As of December 31, 2010, total unrecognized compensation cost (before tax benefits) related to stock options of $2,293,000 is expected to be recognized over a weighted-average period of 2.4 years. The total options vested and expected to vest in the future are 929,850 shares with a weighted average exercise price of $20.65 and a weighted average remaining contractual term of 4.02 years. The aggregate intrinsic value for these options is approximately $2,145,000.
Cash received from options exercised in the years ended December 31, 2010, 2009 and 2008 was $769,000, $44,000 and $484,000, respectively. The tax benefit realized for the tax deductions from options exercised of the share-based payment awards totaled $304,000, $115,000 and $162,000 for the years ended December 31, 2010, 2009 and 2008, respectively.
Nonvested stock options at December 31, 2009 and changes through the year ended December 31, 2010 were as follows:
| Number of Shares |
Weighted-Average Grant Date Fair Value Per Share |
|||||||
| Nonvested at December 31, 2009 |
408,125 | $ | 9.26 | |||||
| Granted |
190,950 | 6.43 | ||||||
| Vested |
(161,000 | ) | 9.44 | |||||
| Forfeited |
(20,125 | ) | 8.88 | |||||
| Nonvested at December 31, 2010 |
417,950 | $ | 7.92 | |||||
The aggregate intrinsic value represents the difference between the closing price of the Company’s common stock price on the last trading day of 2010 and the exercise prices of outstanding stock options, multiplied by the number of in-the-money stock options as of the same date. This represents the total amount before tax withholdings that would have been received by stock option holders if they had all exercised the stock options on December 31, 2010. The aggregate intrinsic value of stock options exercised for the years ended December 31, 2010, 2009 and 2008 was $759,000, $8,000 and $404,000, respectively. Total fair value of options expensed was $2,517,000, $2,404,000 and $2,623,000, before tax benefits, for the year ended December 31, 2010, 2009 and 2008, respectively.
61
Table of Contents
Note 10. Employee Benefit Plans
The Company has three unfunded supplemental retirement plans. The first plan was suspended in 1986, but continues to cover certain former executives. The second plan was suspended in 1997, but continues to cover certain current and retired directors. The third plan covers one former executive. The accumulated benefit obligations under these plans at December 31, 2010 and December 31, 2009 were $1,490,000 and $1,637,000, respectively, which are included in accrued liabilities.
The Company sponsors, for all its employees, two 401(k) defined contribution plans. The first plan covers all employees, other than employees at the Company’s Miltec subsidiary, and allows the employees to make annual voluntary contributions not to exceed the lesser of an amount equal to 25% of their compensation or limits established by the Internal Revenue Code. Under this plan the Company generally provides a match equal to 50% of the employee’s contributions up to the first 6% of compensation, except for union employees who are not eligible to receive the match. The second plan covers only the employees at the Company’s Miltec subsidiary and allows the employees to make annual voluntary contributions not to exceed the lesser of an amount equal to 100% of their compensation or limits established by the Internal Revenue Code. Under this plan, Miltec generally (i) provides a match equal to 100% of the employee’s contributions up to the first 5% of compensation, (ii) contributes 3% of an employee’s compensation annually, and (iii) contributes, at the Company’s discretion, 0% to 7% of an employee’s compensation annually. The Company’s provision for matching and profit sharing contributions for the years ended December 31, 2010, December 31, 2009 and December 31, 2008 were approximately $3,477,000, $4,207,000 and $4,472,000, respectively.
The Company has a defined benefit pension plan covering certain hourly employees of a subsidiary. Pension plan benefits are generally determined on the basis of the retiree’s age and length of service. Assets of the defined benefit pension plan are composed primarily of fixed income and equity securities.
62
Table of Contents
The components of net periodic pension cost for the defined benefit pension plan are as follows:
| Year Ended December 31, |
2010 | 2009 | 2008 | |||||||||
| (In thousands) | ||||||||||||
| Service cost |
$ | 463 | $ | 469 | $ | 500 | ||||||
| Interest cost |
894 | 880 | 831 | |||||||||
| Expected return on plan assets |
(932 | ) | (689 | ) | (910 | ) | ||||||
| Amortization of actuarial losses |
371 | 486 | 96 | |||||||||
| Net periodic post retirement benefits cost |
$ | 796 | $ | 1,146 | $ | 517 | ||||||
The estimated net actuarial loss for the defined benefit pension plan that will be amortized from accumulated other comprehensive income into net periodic cost during 2011 is $375,000.
63
Table of Contents
The obligations and funded status of the defined benefit pension plan are as follows:
| 2010 | 2009 | |||||||
| (In thousands) | ||||||||
| Change in benefit obligation (1) |
||||||||
| Beginning benefit obligation (January 1) |
$ | 15,564 | $ | 13,898 | ||||
| Service cost |
463 | 469 | ||||||
| Interest cost |
894 | 880 | ||||||
| Actuarial loss |
740 | 899 | ||||||
| Benefits paid |
(582 | ) | (582 | ) | ||||
| Benefit obligation (December 31) |
$ | 17,079 | $ | 15,564 | ||||
| Change in plan assets |
||||||||
| Beginning fair value of plan assets (January 1) |
$ | 10,148 | $ | 7,159 | ||||
| Return on assets |
1,375 | 1,925 | ||||||
| Employer contribution |
1,078 | 1,646 | ||||||
| Benefits paid |
(582 | ) | (582 | ) | ||||
| Fair value of plan assets (December 31) |
$ | 12,019 | $ | 10,148 | ||||
| Funded status |
$ | (5,060 | ) | $ | (5,416 | ) | ||
| Amounts recognized in the Statement of Financial Position as noncurrent liabilities |
$ | (5,060 | ) | $ | (5,416 | ) | ||
| Unrecognized loss included in accumulated other comprehensive loss |
||||||||
| Unrecognized loss (January 1), before tax |
$ | 5,250 | $ | 6,072 | ||||
| Amortization |
(371 | ) | (486 | ) | ||||
| Liability loss |
740 | 899 | ||||||
| Asset (gain)/loss |
(443 | ) | (1,235 | ) | ||||
| Unrecognized loss (December 31), before tax |
$ | 5,176 | $ | 5,250 | ||||
| Tax impact |
(2,074 | ) | (2,104 | ) | ||||
| Unrecognized loss included in accumulated other comprehensive loss, net of tax |
$ | 3,102 | $ | 3,146 | ||||
| Accrued benefit cost included in other liabilities |
$ | 118 | $ | (164 | ) | |||
| (1) | Projected benefit obligation equals the accumulated benefit obligation for this plan. |
On December 31, 2010, the Company’s annual measurement date, the accumulated benefit obligation exceeded the fair value of the pension plan assets by $5,060,000. Such excess is referred to as an unfunded accumulated benefit obligation. The Company recognized a pension liability at December 31, 2010 and December 31, 2009 of $3,102,000 net of tax, and
64
Table of Contents
$3,146,000, net of tax, respectively, which decreased shareholders’ equity and is included in other long-term liabilities. This charge to shareholders’ equity represents a net loss not yet recognized as pension expense. This charge did not affect reported earnings, and would be decreased or be eliminated if either interest rates increase or market performance and plan returns improve or contributions cause the pension plan to return to fully funded status. During the year ended, December 31, 2010, the pension liability decreased by $44,000, net of tax.
The Company’s pension plan asset allocations at December 31, 2010 and 2009, by asset category, are as follows:
| December 31, |
2010 | 2009 | ||||||
| Equity securities |
80 | % | 79 | % | ||||
| Cash and equivalents |
13 | 13 | ||||||
| Debt securities |
7 | 8 | ||||||
| Total |
100 | % | 100 | % | ||||
Plan assets consist primarily of listed stocks and bonds and do not include any of the Company’s securities. The return on assets assumption reflects the average rate of return expected on funds invested or to be invested to provide for the benefits included in the projected benefit obligation. We select the return on asset assumption by considering our current and target asset allocation.
| Year Ended December 31, 2010 |
Level 1 | Level 2 | Level 3 | Total | ||||||||||||
| (In thousands) | ||||||||||||||||
| Cash and other investments |
$ | 1,575 | $ | — | $ | — | $ | 1,575 | ||||||||
| Fixed income securities |
— | 816 | — | 816 | ||||||||||||
| Equities (1) |
7,644 | 1,984 | — | 9,628 | ||||||||||||
| Total |
$ | 9,219 | $ | 2,800 | $ | — | $ | 12,019 | ||||||||
| (1) | Represents mutual funds and commingled accounts which invest primarily in equities, but may also hold fixed income securities, cash and other investments. |
The Company’s overall investment strategy is to achieve an asset allocation within the following ranges:
| Cash |
0-25 | % | ||
| Fixed income securities |
0-50 | % | ||
| Equities |
50-95 | % |
65
Table of Contents
The following weighted-average assumptions were used to determine the net periodic benefit cost under the pension plan at:
| Pension Benefits | ||||||||||||
| December 31, |
2010 | 2009 | 2008 | |||||||||
| Discount rate used to determine pension expense |
6.00 | % | 6.50 | % | 6.50 | % | ||||||
The following weighted average assumptions were used to determine the benefit obligations under the pension plan for:
| Pension Benefits | ||||||||||||
| Year Ended December 31, |
2010 | 2009 | 2008 | |||||||||
| Discount rate used to determine value of obligations |
5.50 | % | 6.00 | % | 6.50 | % | ||||||
| Long term rate of return |
8.50 | % | 9.00 | % | 9.00 | % | ||||||
The following benefit payments under the pension plan, which reflect expected future service, as appropriate, are expected to be paid:
| Pension Payments | ||||
| 1/1/2011-12/31/2011 |
$ | 788,000 | ||
| 1/1/2012-12/31/2012 |
835,000 | |||
| 1/1/2013-12/31/2013 |
924,000 | |||
| 1/1/2014-12/31/2014 |
973,000 | |||
| 1/1/2015-12/31/2015 |
1,037,000 | |||
| 1/1/2016-12/31/2020 |
5,691,000 | |||
The assumptions used to determine the benefit obligations and expense for the Company’s defined benefit pension plan are presented in the tables above. The expected long-term return on assets, noted above, represents an estimate of long-term returns on investment portfolios consisting of a mixture of fixed income and equity securities. The Company considers long-term rates of return in which the Company expects its pension funds to be invested. The estimated cash flows from the plan for all future years are determined based on the plan population at the measurement date. Each year’s cash flow is discounted back to the measurement date based on the yield for the year of bonds in the published CitiGroup Pension Discount Curve. The discount rate chosen is the single rate that provides the same present value as the individually discounted cash flows.
66
Table of Contents
The Company’s funding policy is to contribute cash to its pension plan so that the minimum contribution requirements established by government funding and taxing authorities are met. The Company expects to make a contribution of $591,000 to the pension plan in 2011.
Note 11. Indemnifications
The Company has made guarantees and indemnities under which it may be required to make payments to a guaranteed or indemnified party, in relation to certain transactions, including revenue transactions in the ordinary course of business. In connection with certain facility leases the Company has indemnified its lessors for certain claims arising from the facility or the lease. The Company indemnifies its directors and officers to the maximum extent permitted under the laws of the State of Delaware. However, the Company has a directors and officers insurance policy that may reduce its exposure in certain circumstances and may enable it to recover a portion of future amounts that may be payable, if any. The duration of the guarantees and indemnities varies and, in many cases is indefinite but subject to statute of limitations. The majority of guarantees and indemnities do not provide any limitations of the maximum potential future payments the Company could be obligated to make. Historically, payments related to these guarantees and indemnities have been immaterial. The Company estimates the fair value of its indemnification obligations as insignificant based on this history and insurance coverage and has, therefore, not recorded any liability for these guarantees and indemnities in the accompanying consolidated balance sheets. However, there can be no assurances that the Company will not have any future financial exposure under these indemnification obligations.
Note 12. Leases
The Company leases certain facilities and equipment for periods ranging from one to eight years. The leases generally are renewable and provide for the payment of property taxes, insurance and other costs relative to the property. Rental expense in 2010, 2009 and 2008 was $6,208,000, $5,963,000 and $4,944,000, respectively. Future minimum rental payments under operating leases having initial or remaining non-cancelable terms in excess of one year at December 31, 2010 are as follows:
| (In thousands) |
Lease Commitments |
|||
| 2011 |
$ | 4,882 | ||
| 2012 |
3,740 | |||
| 2013 |
3,022 | |||
| 2014 |
1,577 | |||
| 2015 |
900 | |||
| Thereafter |
1,216 | |||
| Total |
$ | 15,337 | ||
67
Table of Contents
Note 13. Income Taxes
The provision for income tax expense/(benefit) consists of the following:
| Year Ended December 31, |
2010 | 2009 | 2008 | |||||||||
| (In thousands) | ||||||||||||
| Current tax expense/(benefit): |
||||||||||||
| Federal |
$ | 6,204 | $ | 2,253 | $ | 7,295 | ||||||
| State |
(854 | ) | (496 | ) | 1,100 | |||||||
| 5,350 | 1,757 | 8,395 | ||||||||||
| Deferred tax expense/(benefit): |
||||||||||||
| Federal |
(686 | ) | 1,414 | (3,650 | ) | |||||||
| State |
191 | 406 | (808 | ) | ||||||||
| (495 | ) | 1,820 | (4,458 | ) | ||||||||
| Income tax expense |
$ | 4,855 | $ | 3,577 | $ | 3,937 | ||||||
68
Table of Contents
Deferred tax assets (liabilities) are comprised of the following:
| December 31, |
2010 | 2009 | ||||||
| (In thousands) | ||||||||
| Allowance for doubtful accounts |
$ | 160 | $ | 214 | ||||
| Contract overrun reserves |
134 | 137 | ||||||
| Deferred compensation |
401 | 485 | ||||||
| Employment-related reserves |
2,130 | 2,069 | ||||||
| Environmental reserves |
999 | 986 | ||||||
| Interest rate swap |
— | 272 | ||||||
| Inventory reserves |
2,506 | 3,107 | ||||||
| Pension obligation |
2,074 | 2,104 | ||||||
| State net operating loss carryforwards |
385 | 383 | ||||||
| State tax credit carryforwards |
1,455 | 1,022 | ||||||
| Stock-based compensation |
3,050 | 2,223 | ||||||
| Workers’ compensation |
145 | 207 | ||||||
| Other |
557 | 1,034 | ||||||
| 13,996 | 14,243 | |||||||
| Depreciation |
(4,122 | ) | (4,034 | ) | ||||
| Goodwill |
(4,873 | ) | (2,966 | ) | ||||
| Intangibles |
(5,230 | ) | (7,410 | ) | ||||
| Purchase accounting adjustment - inventory |
(415 | ) | (415 | ) | ||||
| Unbilled receivables |
(776 | ) | (1,655 | ) | ||||
| Valuation allowance |
(1,323 | ) | (700 | ) | ||||
| Net deferred tax assets (liabilities) |
$ | (2,743 | ) | $ | (2,937 | ) | ||
The Company has state tax credit carryforwards of $3.2 million, which begin to expire in 2017, and state net operating losses of $9.8 million, which begin to expire in 2011. Management has recorded benefits for those carryforwards it expects to be utilized on tax returns filed in the future.
Management has established a valuation allowance for items that are not expected to provide future tax benefits. Management believes it is more likely than not that the Company will generate sufficient taxable income to realize the benefit of the remaining deferred tax assets.
69
Table of Contents
The principal reasons for the variation between expected and effective tax rates are as follows:
| Year Ended December 31, |
2010 | 2009 | 2008 | |||||||||
| Statutory federal income tax rate |
35.0 | % | 35.0 | % | 35.0 | % | ||||||
| State income taxes (net of federal benefit) |
0.3 | (0.7 | ) | 2.3 | ||||||||
| Benefit of research and development tax credits |
(6.2 | ) | (8.4 | ) | (10.6 | ) | ||||||
| Benefit of qualified domestic production activities |
(3.5 | ) | (1.6 | ) | (3.4 | ) | ||||||
| Unremitted earnings/losses of foreign subsidiary |
(0.5 | ) | 1.4 | 0.4 | ||||||||
| Reduction of tax reserves |
(7.4 | ) | — | — | ||||||||
| Book income not subject to tax |
(0.8 | ) | — | — | ||||||||
| Increase in valuation allowance |
2.4 | — | — | |||||||||
| Other |
0.4 | 0.3 | (0.6 | ) | ||||||||
| Effective Income Tax Rate |
19.7 | % | 26.0 | % | 23.1 | % | ||||||
During 2010, the Company reduced certain tax reserves which were previously established for identified exposures. The decision to release the reserves was based upon events occurring during the year, including the expiration of tax statutes of limitations.
The deduction for qualified domestic production activities is treated as a “special deduction” which has no effect on deferred tax assets and liabilities existing at the enactment date. Rather, the impact of this deduction is reported in the Company’s rate reconciliation.
The Company records the interest charge and penalty charge, if any, with respect to uncertain tax positions as a component of tax expense. During the years ended December 31, 2010, 2009 and 2008, the Company recognized approximately ($140,000), ($33,000) and ($100,000) in interest related to uncertain tax positions. The Company had approximately $163,000 and $303,000 for the payment of interest and penalties accrued at December 31, 2010 and 2009, respectively.
As of January 1, 2010, the Company’s total amount of unrecognized tax benefits was $2,573,000. This amount, if recognized, would affect the annual income tax rate.
During 2010, the Company had recognized $1,620,000 of previously unrecognized tax benefit as a result of the expiration of various statutes of limitation. At December 31, 2010, the Company’s total amount of unrecognized tax benefits was $1,343,000, which if recognized, would affect the annual income tax rate. During the next year, the Company expects the liability for uncertain tax positions to increase by amounts similar to the additions that occurred in 2010.
70
Table of Contents
A reconciliation of the beginning and ending amount of unrecognized tax benefits is as follows:
| 2010 | 2009 | |||||||
| Balance at January 1, |
$ | 2,573,000 | $ | 2,014,000 | ||||
| Additions based on tax positions related to the current year |
307,000 | 707,000 | ||||||
| Additions for tax positions for prior years |
83,000 | 122,000 | ||||||
| Reductions for tax positions of prior years |
(1,620,000 | ) | (270,000 | ) | ||||
| Settlements |
— | — | ||||||
| Balance at December 31, |
$ | 1,343,000 | $ | 2,573,000 | ||||
During 2008, the Company concluded the examination of its federal income tax returns for 2005 and 2006. Federal income tax returns after 2006, California franchise (income) tax returns after 2005 and other state income tax returns after 2005 are subject to examination.
Note 14. Contingencies
The Company is a defendant in a lawsuit entitled United States of America ex rel Taylor Smith, Jeannine Prewitt and James Ailes v. The Boeing Company and Ducommun Inc., filed in the United States District Court for the District of Kansas (the “District Court”). The lawsuit is a qui tam action brought against The Boeing Company (“Boeing”) and Ducommun on behalf of the United States of America for violations of the United States False Claims Act. The lawsuit alleges that Ducommun sold unapproved parts to the Boeing Commercial Airplanes-Wichita Division which were installed by Boeing in aircraft ultimately sold to the United States government. The number of Boeing aircraft subject to the lawsuit has been reduced to 25 aircraft following the District Court’s granting of partial summary judgment in favor of Boeing and Ducommun. The lawsuit seeks damages, civil penalties and other relief from the defendants for presenting or causing to be presented false claims for payment to the United States government. Although the amount of alleged damages are not specified, the lawsuit seeks damages in an amount equal to three times the amount of damages the United States government sustained because of the defendants’ actions, plus a civil penalty of $10,000 for each false claim made on or before September 28, 1999, and $11,000 for each false claim made on or after September 28, 1999, together with attorneys’ fees and costs. The Company intends to defend itself vigorously against the lawsuit. The Company, at this time, is unable to estimate what, if any, liability it may have in connection with the lawsuit.
DAS has been directed by California environmental agencies to investigate and take corrective action for ground water contamination at its facilities located in El Mirage and Monrovia, California. Based on currently available information, the Company has established a reserve for its estimated liability for such investigation and corrective action in the approximate amount of $1,509,000. DAS also faces liability as a potentially responsible party for hazardous waste disposed at two landfills located in Casmalia and West Covina, California. DAS and other companies and government entities have entered into consent decrees with respect to each landfill with the United States Environmental Protection Agency and/or California environmental agencies under which certain investigation, remediation and maintenance activities are being performed. Based upon currently available information, the Company has
71
Table of Contents
established a reserve for its estimated liability in connection with the landfills in the approximate amount of $1,090,000. The Company’s ultimate liability in connection with these matters will depend upon a number of factors, including changes in existing laws and regulations, the design and cost of construction, operation and maintenance activities, and the allocation of liability among potentially responsible parties.
In the normal course of business, Ducommun and its subsidiaries are defendants in certain other litigation, claims and inquiries, including matters relating to environmental laws. In addition, the Company makes various commitments and incurs contingent liabilities. While it is not feasible to predict the outcome of these matters, the Company does not presently expect that any sum it may be required to pay in connection with these matters would have a material adverse effect on its consolidated financial position, results of operations or cash flows.
Note 15. Major Customers and Concentrations of Credit Risk
The Company provides proprietary products and services to the Department of Defense and various United States government agencies, and most of the prime aerospace and aircraft manufacturers. As a result, the Company’s sales and trade receivables are concentrated principally in the aerospace industry.
The Company had substantial sales, through both of its business segments, to Boeing, Raytheon, United Technologies and the United States government. During 2010 and 2009, sales to Boeing, Raytheon, United Technologies and the United States government were as follows:
| December 31, |
2010 | 2009 | ||||||
| (In thousands) | ||||||||
| Boeing |
$ | 107,466 | $ | 133,007 | ||||
| Raytheon |
48,198 | 34,009 | ||||||
| United Technologies |
30,680 | 42,117 | ||||||
| United States government |
16,875 | 29,224 | ||||||
| Total |
$ | 203,219 | $ | 238,357 | ||||
At December 31, 2010, trade receivables from Boeing, Raytheon, and United Technologies and the United States government were $9,685,000, $4,520,000, $2,049,000 and $1,262,000, respectively. The sales and receivables relating to Boeing, Raytheon, United Technologies and the United States government are diversified over a number of different commercial, military and space programs.
In 2010, 2009 and 2008, sales to foreign customers worldwide were $37,970,000, $32,121,000, and $32,850,000, respectively. The Company has manufacturing facilities in Thailand and Mexico. The amounts of revenues, profitability and identifiable assets attributable to foreign sales activity were not material when compared with the revenue, profitability and identifiable assets attributed to United States domestic operations during 2010, 2009 and 2008. The Company had no sales to a foreign country greater than 3% of total sales in 2010, 2009 and 2008. The Company is not subject to any significant foreign currency risks since all sales are made in United States dollars.
72
Table of Contents
Note 16. Business Segment Information
The Company supplies products and services to the aerospace industry. The Company’s subsidiaries are organized into two strategic businesses, each of which is a reportable operating segment. The accounting policies of the segments are the same as those of the Company, as described in Note 1. Summary of Significant Accounting Policies. Ducommun AeroStructures, Inc. (“DAS”), engineers and manufactures aerospace structural components and subassemblies. Ducommun Technologies, Inc. (“DTI”), designs, engineers and manufactures electromechanical components and subsystems, and provides engineering, technical and program management services (including design, development, integration and test of prototype products) principally for the aerospace and military markets.
In 2010, the Company had no impairment of goodwill. In the fourth quarter of 2009, the Company recorded a pre-tax non-cash charge of $12,936,000 at DTI (relating to its Miltec reporting unit) for the impairment of goodwill. In the fourth quarter of 2008, the Company recorded a pre-tax non-cash charge of $13,064,000 at DTI (relating to its Miltec reporting unit) for the impairment of goodwill. The test as of December 31, 2009 and 2008 indicated the book value of Miltec exceeded the fair value of the business.
73
Table of Contents
Financial information by operating segment is set forth below:
| Year Ended December 31, |
2010 | 2009 | 2008 | |||||||||
| (In thousands) | ||||||||||||
| Net Sales: |
||||||||||||
| Ducommun AeroStructures |
$ | 271,572 | $ | 286,857 | $ | 251,198 | ||||||
| Ducommun Technologies |
136,834 | 143,891 | 152,605 | |||||||||
| Total Net Sales |
$ | 408,406 | $ | 430,748 | $ | 403,803 | ||||||
| Segment Income Before Interest and Taxes (1): |
||||||||||||
| Ducommun AeroStructures |
$ | 28,738 | $ | 28,823 | $ | 35,063 | ||||||
| Ducommun Technologies |
13,151 | 570 | (4,087 | ) | ||||||||
| 41,889 | 29,393 | 30,976 | ||||||||||
| Corporate General and Administrative Expenses |
(15,421 | ) | (13,111 | ) | (12,685 | ) | ||||||
| Operating Income |
$ | 26,468 | $ | 16,282 | $ | 18,291 | ||||||
| Depreciation and Amortization Expenses: |
||||||||||||
| Ducommun AeroStructures |
$ | 9,666 | $ | 9,655 | $ | 6,189 | ||||||
| Ducommun Technologies |
3,880 | 3,770 | 4,154 | |||||||||
| Corporate Administration |
51 | 125 | 134 | |||||||||
| Total Depreciation and Amortization Expenses |
$ | 13,597 | $ | 13,550 | $ | 10,477 | ||||||
| Capital Expenditures: |
||||||||||||
| Ducommun AeroStructures |
$ | 5,150 | $ | 5,953 | $ | 9,718 | ||||||
| Ducommun Technologies |
1,904 | 1,724 | 2,592 | |||||||||
| Corporate Administration |
52 | 12 | 108 | |||||||||
| Total Capital Expenditures |
$ | 7,106 | $ | 7,689 | $ | 12,418 | ||||||
| (1) | Before certain allocated corporate overhead. |
| (2) | Certain expenses, previously incurred at the operating segments, are now included in the corporate general and administrative expenses as a result of the Company’s organizational changes. |
74
Table of Contents
Segment assets include assets directly identifiable with each segment. Corporate assets include assets not specifically identified with a business segment, including cash.
| As of December 31, |
2010 | 2009 | ||||||
| (In thousands) | ||||||||
| Total Assets: |
||||||||
| Ducommun AeroStructures |
$ | 232,938 | $ | 224,923 | ||||
| Ducommun Technologies |
93,505 | 98,745 | ||||||
| Corporate Administration |
19,009 | 30,241 | ||||||
| Total Assets |
$ | 345,452 | $ | 353,909 | ||||
| Goodwill and Intangibles |
||||||||
| Ducommun AeroStructures |
$ | 72,157 | $ | 74,786 | ||||
| Ducommun Technologies |
50,277 | 51,640 | ||||||
| Total Goodwill and Intangibles |
$ | 122,434 | $ | 126,426 | ||||
Supplementary Quarterly Financial Data (Unaudited)
| 2010 | 2009 | |||||||||||||||||||||||||||||||
| Three Months Ended |
Dec 31 | Oct 2 | Jul 3 | Apr 3 | Dec 31 | Oct 3 | Jul 4 | Apr 4 | ||||||||||||||||||||||||
| (in thousands, except per share amounts) | ||||||||||||||||||||||||||||||||
| Sales and Earnings |
||||||||||||||||||||||||||||||||
| Net Sales |
$ | 101,770 | $ | 99,443 | $ | 102,937 | $ | 104,256 | $ | 105,665 | $ | 109,903 | $ | 103,825 | $ | 111,355 | ||||||||||||||||
| Gross Profit |
18,549 | 19,937 | 22,343 | 19,318 | 19,261 | 22,538 | 19,728 | 17,306 | ||||||||||||||||||||||||
| Income Before Taxes |
4,241 | 5,688 | 8,431 | 6,303 | (6,216 | ) | 9,239 | 6,879 | 3,858 | |||||||||||||||||||||||
| Income Tax Expense |
(82 | ) | 85 | (2,778 | ) | (2,080 | ) | 3,015 | (3,049 | ) | (2,270 | ) | (1,273 | ) | ||||||||||||||||||
| Net Income |
$ | 4,159 | $ | 5,773 | $ | 5,653 | $ | 4,223 | $ | (3,201 | ) | $ | 6,190 | $ | 4,609 | $ | 2,585 | |||||||||||||||
| Earnings Per Share: |
||||||||||||||||||||||||||||||||
| Basic earnings per share |
$ | 0.40 | $ | 0.55 | $ | 0.54 | $ | 0.40 | $ | (0.31 | ) | $ | 0.59 | $ | 0.44 | $ | 0.25 | |||||||||||||||
| Diluted earnings per share |
$ | 0.39 | $ | 0.55 | $ | 0.53 | $ | 0.40 | $ | (0.31 | ) | $ | 0.59 | $ | 0.44 | $ | 0.25 | |||||||||||||||
In the second quarter of 2010, the Company’s gross profit was favorably impacted by an adjustment to operating expense of approximately $1,144,000, or 0.3 percentage point, relating to the reversal of certain accounts payable accruals recorded in prior periods.
In the fourth quarter of 2009, the Company recorded a non-cash charge of $12,936,000 at DTI (relating to its Miltec reporting unit) for the impairment of goodwill.
75
Table of Contents
DUCOMMUN INCORPORATED AND SUBSIDIARIES
VALUATION AND QUALIFYING ACCOUNTS
SCHEDULE II
| Column A |
Column B | Column C | Column D | Column E | ||||||||||||||||
| Additions | ||||||||||||||||||||
| Description |
Balance at Beginning of Period |
Charged to Costs and Expenses |
Charged to Other Accounts |
Deductions | Balance at End of Period |
|||||||||||||||
| FOR THE YEAR ENDED DECEMBER 31, 2010 | ||||||||||||||||||||
| Allowance for Doubtful Accounts |
$ | 570,000 | $ | 345,000 | $ | 500,000 | $ | 415,000 | ||||||||||||
| Valuation Allowance on Deferred Tax Assets |
$ | 700,000 | $ | 623,000 | (a) | $ | 1,323,000 | (b) | ||||||||||||
| Inventory Reserves |
$ | 8,010,000 | $ | 2,834,000 | $ | 4,200,000 | $ | 6,644,000 | ||||||||||||
| FOR THE YEAR ENDED DECEMBER 31, 2009 | ||||||||||||||||||||
| Allowance for Doubtful Accounts |
$ | 1,694,000 | $ | 378,000 | $ | 1,502,000 | (c) | $ | 570,000 | |||||||||||
| Valuation Allowance on Deferred Tax Assets |
$ | 366,000 | $ | 334,000 | (d) | $ | 700,000 | (e) | ||||||||||||
| Inventory Reserves |
$ | 10,158,000 | $ | 7,771,000 | $ | 9,919,000 | $ | 8,010,000 | ||||||||||||
| FOR THE YEAR ENDED DECEMBER 31, 2008 | ||||||||||||||||||||
| Allowance for Doubtful Accounts |
$ | 392,000 | $ | 1,502,000 | (c) | $ | 200,000 | $ | 1,694,000 | |||||||||||
| Valuation Allowance on Deferred Tax Assets |
$ | 278,000 | $ | 88,000 | (f) | $ | 366,000 | |||||||||||||
| Inventory Reserves |
$ | 9,348,000 | $ | 3,959,000 | $ | 3,149,000 | $ | 10,158,000 | ||||||||||||
| (a) | Increase Valuation Allowance regarding intangibles ($22,000) and Arizona R&D tax credit carryforwards ($601,000). |
| (b) | ASC 740-10-45, “Accounting for Income Taxes,” the Valuation Allowance is allocated pro-rata between Current ($811,000) and Non-Current ($512,000). |
| (c) | Increase in allowance for doubtful accounts for a customer Chapter 11 Bankruptcy filing. |
| (d) | Increase Valuation Allowance regarding state net operating loss carryforwards ($51,000), intangible ($22,000) and Arizona R&D tax credit carryforwards ($261,000). |
| (e) | ASC 740-10, “Accounting for Income Taxes,” the Valuation Allowance is allocated pro-rata between Current ($411,000) and Non-Current ($289,000). |
| (f) | Increase Valuation Allowance regarding state net operating carryforwards ($56,000) and intangibles ($32,000). |
76
Table of Contents
| (b) | Exhibits |
| 3.1 | Restated Certificate of Incorporation filed with the Delaware Secretary of State on May 29, 1990. Incorporated by reference to Exhibit 3.1 to Form 10-K for the year ended December 31, 1990. | |
| 3.2 | Certificate of Amendment of Certificate of Incorporation filed with the Delaware Secretary of State on May 27, 1998. Incorporated by reference to Exhibit 3.2 to Form 10-K for the year ended December 31, 1998. | |
| 3.3 | Bylaws as amended and restated on November 5, 2009. Incorporated by reference to Exhibit 99.1 to Form 8-K November 11, 2009. | |
| 4.1 | Second Amended and Restated Credit Agreement dated as of June 26, 2009 among Ducommun Incorporated, Bank of America, N.A., as Administrative Agent Swing Line Lender and L/C Issuer, Wells Fargo Bank, National Association, as Syndication Agent, Union Bank, N.A., as Documentation Agent, and the Lenders described herein. Incorporated by reference to Exhibit 99.1 to Form 8-K dated June 30, 2009. | |
| 4.2 | Amendment No. 1 to Second Amended and Restated Credit Agreement dated as of September 15, 2009. Among Ducommun Incorporated, Bank of America, N.A., as Administrative Agent Swing Line Lender and L/C Issuer, Wells Fargo Bank, National Association, as Syndication Agent, Union Bank, N.A., as Documentation Agent, and the Lenders described herein. Incorporated by reference to Exhibit 4.2 to Form 10-K for the year ended December 31, 2009. | |
| *10.1 | 2001 Stock Incentive Plan, as amended. Incorporated by reference to Appendix B of Definitive Proxy Statement on Schedule 14a, filed on March 31, 2004. | |
| *10.2 | 2007 Stock Incentive Plan. Incorporated by reference to Appendix B of Definitive Proxy Statement on Schedule 14a, filed on March 29, 2010. | |
| *10.3 | Form of Nonqualified Stock Option Agreement, for grants to employees between January 1, 1999 and June 30, 2003, under the 2001 Stock Incentive Plan. Incorporated by reference to Exhibit 10.5 to Form 10-K for the year ended December 31, 1999. | |
| *10.4 | Form of Nonqualified Stock Option Agreement, for nonemployee directors under the 2007 Stock Incentive Plan and the 2001 Stock Incentive Plan. Incorporated by reference to Exhibit 10.7 to Form 10-K for the year ended December 31, 1999. | |
77
Table of Contents
| *10.5 | Form of Nonqualified Stock Option Agreement, for grants to employees after July 1, 2003, under the 2007 Stock Incentive Plan and the 2001 Stock Incentive Plan. Incorporated by reference to Exhibit 10.8 to Form 10-K for the year ended December 31, 2003. | |
| *10.6 | Form of Memorandum Amendment to Existing Stock Option Agreements dated August 25, 2003. Incorporated by reference to Exhibit 10.9 to Form 10-K for the year ended December 31, 2003. | |
| *10.7 | Form of Performance Stock Unit Agreement for 2008. Incorporated by reference to Exhibit 99.1 to Form 8-K dated February 6, 2007. | |
| *10.8 | Form of Performance Stock Unit Agreement for 2009 and 2010. Incorporated by reference to Exhibit 99.2 to Form 8-K dated February 5, 2009. | |
| *10.9 | Form of Performance Stock Unit Agreement for 2011 and thereafter. | |
| *10.10 | Form of Restricted Stock Unit Agreement. Incorporated by reference to Exhibit 99.1 to Form 8-K dated May 8, 2007. | |
| *10.11 | Form of Directors’ Restricted Stock Unit Agreement. Incorporated by reference to Exhibit 99.1 to Form 8-K dated May 10, 2010. | |
| *10.12 | Form of Key Executive Severance Agreement entered with six current executive officers of Ducommun. Incorporated by reference to Exhibit 99.1 to Form 8-K dated January 9, 2008. All of the Key Executive Severance Agreements are identical except for the name of the executive officer, the address for notice, and the date of the Agreement: | |
| Executive Officer |
Date of Agreement | |
| Joseph P. Bellino |
November 5, 2009 | |
| Joseph C. Berenato |
December 31, 2007 | |
| James S. Heiser |
December 31, 2007 | |
| Anthony J. Reardon |
December 31, 2007 | |
| Rose F. Rogers |
November 5, 2009 | |
| Samuel D. Williams |
December 31, 2007 |
| * 10.13 | Form of Indemnity Agreement entered with all directors and officers of Ducommun. Incorporated by reference to Exhibit 10.8 to Form 10-K for the year ended December 31, 1990. All of the Indemnity Agreements are identical except for the name of the director or officer and the date of the Agreement: | |
78
Table of Contents
| Director/Officer |
Date of Agreement | |
| Kathryn M. Andrus |
January 30, 2008 | |
| Joseph C. Berenato |
November 4, 1991 | |
| Joseph P. Bellino |
September 15, 2008 | |
| H. Frederick Christie |
October 23, 1985 | |
| Eugene P. Conese, Jr. |
January 26, 2000 | |
| Ralph D. Crosby, Jr. |
January 26, 2000 | |
| Donald C. DeVore, Jr. |
January 30, 2008 | |
| Robert C. Ducommun |
December 31, 1985 | |
| Dean W. Flatt |
November 5, 2009 | |
| Jay L. Haberland |
February 2, 2009 | |
| James S. Heiser |
May 6, 1987 | |
| Robert D. Paulson |
March 25, 2003 | |
| Michael G. Pollack |
January 4, 2010 | |
| Anthony J. Reardon |
January 8, 2008 | |
| Rosalie F. Rogers |
July 24, 2008 | |
| Samuel D. Williams |
November 11, 1988 |
| *10.14 | Ducommun Incorporated 2010 Bonus Plan. Incorporated by reference to Exhibit 99.1 to Form 8-K dated February 15, 2011. | |
| *10.15 | Directors’ Deferred Compensation and Retirement Plan, as amended and restated February 2, 2010. Incorporated by reference to Exhibit 10.15 to Form 10-K for the year ended December 31, 2009. | |
| *10.16 | Ducommun Incorporated Executive Retirement Plan dated May 5, 1993. Incorporated by reference to Exhibit 10.2 to Form 10-Q for the quarter ended July 3, 1993. | |
| *10.17 | Ducommun Incorporated Executive Compensation Deferral Plan dated May 5, 1993. Incorporated by reference to Exhibit 10.3 to Form 10-Q for the quarter ended July 3, 1993. | |
| *10.18 | Ducommun Incorporated Executive Compensation Deferral Plan No. 2 dated October 15, 1994. Incorporated by reference to Exhibit 10.12 to Form 10-K for the year-ended December 31, 1994. | |
| *10.19 | Amendment No. 1 to Ducommun Incorporated Executive Compensation Deferral Plan No. 2 dated October 26, 2007. Incorporated by reference to Exhibit 10.18 to Form 10-K for the year-ended December 31, 2007. | |
| *10.20 | Employment Letter Agreement dated September 5, 2008 between Ducommun Incorporated and Joseph P. Bellino. Incorporated by reference to Exhibit 99.1 to Form 8-K dated September 18, 2008. | |
79
Table of Contents
| 10.21 | Stock Purchase Agreement Dated December 22, 2008, By and Among DynaBil Acquisition, Inc., Each of the Stockholders of DynaBil Acquisition, Inc., as Sellers, Ducommun AeroStructures, Inc., as Purchaser, and Ducommun Incorporated, as Guarantor. Incorporated by reference to Exhibit 1.1 to Form 8-K dated December 23, 2008. | |
| 11 | Reconciliation of the Numerators and Denominators of the Basic and Diluted Earnings Per Share Computations | |
| 21 | Subsidiaries of registrant | |
| 23 | Consent of PricewaterhouseCoopers LLP | |
| 31.1 | Certification of Principal Executive Officer | |
| 31.2 | Certification of Principal Financial Officer | |
| 32 | Certification Pursuant to 18 U.S.C. Section 1350, as Adopted Pursuant to Section 906 of the Sarbanes-Oxley Act of 2002 | |
| * | Indicates an executive compensation plan or arrangement. |
80
Table of Contents
Pursuant to the requirements of Section 13 or 15(d) of the Securities and Exchange Act of 1934, the registrant has duly caused this report to be signed on its behalf by the undersigned, thereunto duly authorized.
| DUCOMMUN INCORPORATED | ||||||||
| Date: February 21, 2011 |
By: | /s/ JOSEPH P. BELLINO | ||||||
| Joseph P. Bellino | ||||||||
| Vice President and Chief Financial Officer | ||||||||
Pursuant to the requirements of the Securities and Exchange Act of 1934, this report has been duly signed below by the following persons on behalf of the registrant and in the capacities and on the dates indicated.
| Date: February 21, 2011 |
By: | /s/ ANTHONY J. REARDON | ||||||
| Anthony J. Reardon | ||||||||
| President, Chief Executive Officer and | ||||||||
| Chief Operating Officer | ||||||||
| (Principal Executive Officer) | ||||||||
| Date: February 21, 2011 |
By: | /s/ JOSEPH P. BELLINO | ||||||
| Joseph P. Bellino | ||||||||
| Vice President and Chief Financial Officer | ||||||||
| (Principal Financial Officer) | ||||||||
| Date: February 21, 2011 |
By: | /s/ SAMUEL D. WILLIAMS | ||||||
| Samuel D. Williams | ||||||||
| Vice President and Controller | ||||||||
| (Principal Accounting Officer) | ||||||||
81
Table of Contents
DIRECTORS
| By: | /s/ JOSEPH C. BERENATO | Date: | February 21, 2011 | |||||
| Joseph C. Berenato | ||||||||
| By: | /s/ EUGENE P. CONESE, JR. | Date: | February 21, 2011 | |||||
| Eugene P. Conese, Jr. | ||||||||
| By: | /s/ RALPH D. CROSBY, JR. | Date: | February 21, 2011 | |||||
| Ralph D. Crosby, Jr. | ||||||||
| By: | /s/ H. FREDERICK CHRISTIE | Date: | February 21, 2011 | |||||
| H. Frederick Christie | ||||||||
| By: | /s/ ROBERT C. DUCOMMUN | Date: | February 21, 2011 | |||||
| Robert C. Ducommun | ||||||||
| By: | /s/ DEAN M. FLATT | Date: | February 21, 2011 | |||||
| Dean M. Flatt | ||||||||
| By: | /s/ JAY L. HABERLAND | Date: | February 21, 2011 | |||||
| Jay L. Haberland | ||||||||
| By: | /s/ ROBERT D. PAULSON | Date: | February 21, 2011 | |||||
| Robert D. Paulson | ||||||||
| By: | /s/ ANTHONY J. REARDON | Date: | February 21, 2011 | |||||
| Anthony J. Reardon | ||||||||
82