Attached files
Table of Contents
UNITED STATES
SECURITIES AND EXCHANGE COMMISSION
Washington, D.C. 20549
FORM 10-K
| x | ANNUAL REPORT PURSUANT TO SECTION 13 OR 15(d) OF THE SECURITIES EXCHANGE ACT OF 1934 |
For the Fiscal Year Ended December 31, 2010
OR
| ¨ | TRANSITION REPORT PURSUANT TO SECTION 13 OR 15(d) OF THE SECURITIES EXCHANGE ACT OF 1934 |
For the transition period from to .
Commission file number 001-34030
HATTERAS FINANCIAL CORP.
(Exact name of registrant as specified in its charter)
| Maryland | 26-1141886 | |
| (State or other jurisdiction of incorporation or organization) |
(IRS Employer Identification No.) |
| 110 Oakwood Drive, Suite 340 Winston Salem, North Carolina |
27103 | |
| (Address of principal executive offices) | (Zip Code) |
(336) 760-9347
(Registrant’s telephone number, including area code)
Securities registered pursuant to Section 12(b) of the Act:
| Title of each class |
Name of each exchange on which registered | |
| Common stock, $0.001 par value | New York Stock Exchange |
Securities registered pursuant to Section 12(g) of the Act: None
Indicate by check mark if the registrant is a well-known seasoned issuer, as defined in Rule 405 of the Securities Act. Yes x No ¨
Indicate by check mark if the registrant is not required to file reports pursuant to Section 13 or Section 15(d) of the Exchange Act. Yes ¨ No x
Indicate by check mark whether the registrant (1) has filed all reports required to be filed by Section 13 or 15(d) of the Securities Exchange Act of 1934 during the preceding 12 months (or for such shorter period that the registrant was required to file such reports), and (2) has been subject to such filing requirements for the past 90 days. Yes x No ¨
Indicate by check mark whether the registrant has submitted electronically and posted on its corporate Web site, if any, every Interactive Data File required to be submitted and posted pursuant to Rule 405 of Regulation S-T during the preceding 12 months (or for such shorter period that the registrant was required to submit and post such files). Yes x No ¨
Indicate by check mark if disclosure of delinquent filers pursuant to Item 405 of Regulation S-K is not contained herein, and will not be contained, to the best of the registrant’s knowledge, in definitive proxy or information statements incorporated by reference in Part III of this Form 10-K or any amendment to this Form 10-K. ¨
Indicate by check mark whether the registrant is a large accelerated filer, an accelerated filer, a non-accelerated filer or a smaller reporting company. See the definitions of “large accelerated filer,” “accelerated filer” and “smaller reporting company” in Rule 12b-2 of the Exchange Act. Check one:
| Large accelerated filer | x | Accelerated filer | ¨ | |||
| Non-accelerated filer | ¨ (Do not check if a smaller reporting company) | Smaller reporting company | ¨ | |||
Indicate by check mark whether the registrant is a shell company (as defined in Rule 12b-2 of the Exchange Act). Yes ¨ No x
The aggregate market value of the voting and non-voting common equity held by non-affiliates of the registrant was approximately $1,040,141,477 based on the closing price on the New York Stock Exchange as of June 30, 2010.
Number of the registrant’s common stock outstanding as of February 18, 2011: 57,671,570
DOCUMENTS INCORPORATED BY REFERENCE
Portions of the registrant’s definitive Proxy Statement with respect to its 2011 Annual Meeting of Shareholders to be filed not later than 120 days after the end of the registrant’s fiscal year are incorporated by reference into Part II, Item 5 and Part III, Items 10,11,12,13 and 14 hereof as noted therein.
Table of Contents
INDEX
Table of Contents
Forward-Looking Statements
This report contains various “forward-looking statements.” Forward-looking statements relate to expectations, beliefs, projections, future plans and strategies, anticipated events or trends and similar expressions concerning matters that are not historical facts. In some cases, you can identify forward-looking statements by the use of forward-looking terminology such as “believes,” “expects,” “may,” “will,” “would,” “could,” “should,” “seeks,” “approximately,” “intends,” “plans,” “projects,” “estimates” or “anticipates” or the negative of these words and phrases or similar words or phrases. All forward-looking statements may be impacted by a number of risks and uncertainties, including statements regarding the following subjects:
| • | our business and investment strategy; |
| • | our anticipated results of operations; |
| • | statements about future dividends; |
| • | our ability to obtain financing arrangements; |
| • | our understanding of our competition and ability to compete effectively; |
| • | market, industry and economic trends; and |
| • | interest rates. |
The forward-looking statements in this report are based on our beliefs, assumptions and expectations of our future performance, taking into account all information currently available to us. These beliefs, assumptions and expectations are subject to risks and uncertainties and can change as a result of many possible events or factors, not all of which are known to us. If a change occurs, our business, financial condition, liquidity and results of operations may vary materially from those expressed in our forward-looking statements. You should carefully consider these risks before you make an investment decision with respect to our common stock, along with the following factors that could cause actual results to vary from our forward-looking statements:
| (1) | the factors referenced in this report, including those set forth under the sections captioned “Risk Factors” and “Management’s Discussion and Analysis of Financial Condition and Results of Operations;” |
| (2) | the federal conservatorship of Fannie Mae and Freddie Mac and related efforts, along with any changes in laws and regulations affecting the relationship between Fannie Mae and Freddie Mac and the federal government; |
| (3) | mortgage loan modification programs and future legislative action; |
| (4) | availability, terms and deployment of capital; |
| (5) | changes in economic conditions generally; |
| (6) | changes in interest rates, interest rate spreads, the yield curve or prepayment rates; |
| (7) | general volatility of the financial markets, including markets for mortgage securities; |
| (8) | inflation or deflation; |
| (9) | availability of suitable investment opportunities; |
| (10) | the degree and nature of our competition, including competition for agency securities from the U.S. Treasury; |
| (11) | changes in our business and investment strategy; |
| (12) | our dependence on our manager and ability to find a suitable replacement if our manager were to terminate its management relationship with us; |
| (13) | the existence of conflicts of interest in our relationship with our manager, certain of our directors and our officers, which could result in decisions that are not in the best interest of our shareholders; |
2
Table of Contents
| (14) | changes in personnel at our manager or the availability of qualified personnel at our manager; |
| (15) | limitations imposed on our business by our status as a real estate investment trust (“REIT”); |
| (16) | changes in generally accepted accounting principles (“GAAP”), including interpretations thereof; and |
| (17) | changes in applicable laws and regulations. |
We cannot guarantee future results, levels of activity, performance or achievements. You should not place undue reliance on forward-looking statements, which apply only as of the date of this report. We do not intend and disclaim any duty or obligation to update or revise any industry information or forward-looking statements set forth in this report to reflect new information, future events or otherwise, except as required under the U.S. federal securities laws.
PART I
| Item 1. | Business |
In this report, unless the context suggests otherwise, references to “our company,” “we,” “us” and “our” refers to Hatteras Financial Corp. and “manager” refers to Atlantic Capital Advisors LLC.
Our Company
We are an externally-managed mortgage REIT that invests primarily in single-family residential mortgage pass-through securities guaranteed or issued by a U.S. Government agency (such as the Government National Mortgage Association (“Ginnie Mae”)), or by a U.S. Government-sponsored entity (such as the Federal National Mortgage Association, (“Fannie Mae”)), and the Federal Home Loan Mortgage Corporation, (“Freddie Mac”)). We refer to these securities as “agency securities.” We were incorporated in Maryland in September 2007 and commenced operations in November 2007. We listed our common stock on the New York Stock Exchange (“NYSE”) in April 2008 and trade under the symbol “HTS.”
We are externally-managed and advised by our manager, Atlantic Capital Advisors LLC.
We are organized and conduct our operations to qualify as a REIT under the Internal Revenue Code of 1986, as amended (the “Code”), and generally are not subject to federal taxes on our income to the extent we distribute our income to our shareholders and maintain our qualification as a REIT.
Our Strategy
Our principal goal is to generate net income for distribution to our shareholders, through regular quarterly dividends, from the difference between the interest income on our investment portfolio and the interest costs of our borrowings and hedging activities, which we refer to as our net interest income, and other expenses. In general, our strategy is to manage interest rate risk while trying to eliminate any exposure to credit risk. We believe that the best approach to generating a positive net interest income is to manage our liabilities in relation to the interest rate risks of our investments. To help achieve this result, we employ repurchase financing, generally short-term, and combine our financings with hedging techniques, primarily interest rate swaps. We may, subject to maintaining our REIT qualification, also employ other hedging techniques from time to time, including interest rate caps, floors and swap options to protect against adverse interest rate movements.
We focus on agency securities consisting of residential mortgage loans with short effective durations, which we believe reduces the impact of changes in interest rates on the market value of our portfolio and on our net interest income. However, because our investments vary in interest rate, prepayment speed and maturity, the leverage or borrowings that we employ to fund our asset purchases will never exactly match the terms or performance of our assets, even after we have employed our hedging techniques. Based on our manager’s experience, the interest rates of our assets will change more slowly than the corresponding short term borrowings used to finance our assets. Consequently, changes in interest rates, particularly short-term interest rates, may significantly influence our net income and shareholders’ equity.
Our manager’s approach to managing our portfolio is to take a longer term view of assets and liabilities; accordingly, our periodic earnings and mark-to-market valuations at the end of a period will not significantly
3
Table of Contents
influence our strategy of providing stable cash distributions to shareholders over the long term. Our manager has invested and seeks to invest in agency securities that it believes are likely to generate attractive risk-adjusted returns on capital invested, after considering (1) the amount and nature of anticipated cash flows from the asset, (2) our ability to borrow against the asset, (3) the capital requirements resulting from the purchase and financing of the asset, and (4) the costs of financing, hedging, and managing the asset.
Our Assets
Our focus on asset selection is to own assets with short duration and predictable prepayment characteristics. Since our formation, all of our invested assets have been in agency securities, and we currently intend that our investment assets will continue to be agency securities. These agency securities currently consist of whole-pool, pass-through certificates that are backed by adjustable-rate mortgages (“ARMs”) that have principal and interest payments guaranteed by Ginnie Mae, Fannie Mae or Freddie Mac. ARMs are mortgages have floating interest rates that reset on a specific time schedule, such as monthly, quarterly or annually, based on a specified index, such as the 12-month moving average of the one-year constant maturity U.S. Treasury rate (“CMT) or the London Interbank Offered Rate (“LIBOR”). The ARMs we generally invest in, sometimes referred to as hybrid ARMS, have interest rates that are fixed for an initial period (typically three, five, seven or 10 years) and then reset annually thereafter to an increment over a pre-determined interest rate index.
Our Borrowings
We borrow against our agency securities using repurchase agreements. Our borrowings generally have maturities that range from one month to one year, although occasionally we may enter into longer dated borrowing agreements to more closely match the rate adjustment period of our securities. We intend that our borrowings will generally be between eight and 12 times the amount of our shareholders’ equity. The level of our borrowings may vary periodically above or below this range depending on market conditions.
Our Hedging
Our hedging strategies are designed to reduce the impact on our income and shareholders’ equity caused by the potential adverse effects of changes in interest rates on our assets and liabilities. Subject to complying with REIT requirements, we use hedging techniques to mitigate the risk of adverse changes in interest rates on the value of our assets as well as the differences between the interest rate adjustments on our assets and borrowings. These techniques primarily consist of entering into interest rate swap agreements and may also include entering into interest rate cap or floor agreements, purchasing or selling futures contracts, purchasing put and call options on securities or securities underlying futures contracts, or entering into forward rate agreements. We intend to limit our use of hedging instruments to only those techniques described above and to enter into hedging transactions only with counterparties that we believe have a strong credit rating to help mitigate the risk of counterparty default or insolvency.
We record our derivative and hedge transactions in accordance with United States GAAP. If we fail to qualify for hedge accounting treatment as prescribed by this accounting standard, our operating results may suffer because losses on the derivatives we enter into may not be offset by a changes in the fair value or cash flows of the related hedged transaction. Consequently, any declines in the hedged interest rates would result in a charge to earnings.
Purpose of and Changes in Strategies
Our investment, financing and hedging strategies are designed to:
| • | limit credit risk; |
| • | manage cash flows so as to provide for regular quarterly distributions to our shareholders; |
| • | manage financing risks; |
| • | mitigate the fluctuations in the market value of our securities due to changing interest rates; |
| • | reduce the impact that changing interest rates have on our net interest income; |
| • | maintain our qualification as a REIT; and |
| • | comply with available exemptions from regulation as an investment company under the Investment Company Act of 1940 (the “Investment Company Act”). |
4
Table of Contents
Our board of directors has adopted a policy that currently limits our investments to agency securities. Due to changes in market conditions, the market value and duration of our securities will fluctuate from time to time and may cause our portfolio allocations to be inconsistent with the investment strategies described in this report. In such event, in consultation with our board of directors, our manager may recommend that we should reallocate our portfolio. Subject to our intent to qualify for an exemption from registration under the Investment Company Act and to maintain our qualification as a REIT, our board of directors, with the approval of a majority of our independent directors, may vary our investment strategy, our financing strategy or our hedging strategy at any time.
Our Manager
We believe our relationship with our manager, Atlantic Capital Advisors LLC, enables us to leverage our manager’s infrastructure, business relationships and management expertise to execute our investment strategy effectively. We believe that our manager’s expertise in mortgage REIT operations, agency securities, and the mortgage-backed securities and leveraged finance markets enhances our ability to acquire assets opportunistically and to finance those assets in a manner designed to generate consistent risk-adjusted returns for our shareholders.
Pursuant to the terms of the management agreement, our manager provides us with our management team, including a chief executive officer and a chief financial officer (each of whom also serves as an officer of our manager) along with appropriate support personnel. Our manager is responsible for our operations and the performance of all services and activities relating to the management of our assets and operations, subject to the direction of our board of directors.
Atlantic Capital Advisors LLC manages both our company and ACM Financial Trust, (“ACM”), a privately-held mortgage REIT founded in 1998. Michael R. Hough, our chief executive officer, is also the chief executive officer of our manager and ACM. Our president Benjamin M. Hough, chief financial officer Kenneth A. Steele, co-chief investment officer William H. Gibbs, Jr., and co-chief investment officer Frederick J. Boos, II are all also executives of our manager and of ACM. As of December 31, 2010, ACM owned approximately $ 1.1 billion in agency securities. We do not own any interest in ACM.
The Management Agreement
On November 5, 2007, we entered into a management agreement with Atlantic Capital Advisors LLC, our manager. The management agreement requires our manager to manage our business affairs in conformity with policies and investment guidelines that are approved by a majority of our independent directors and monitored by our board of directors. Our manager is subject to the direction and oversight of our board of directors. Our manager is responsible for (1) the identification, selection, purchase and sale of our portfolio investments, (2) our financing and risk management activities, and (3) providing us with investment advisory services. In addition, our manager is responsible for our day-to-day operations.
The initial term of the management agreement expired on November 5, 2010 and automatically renewed for an additional one-year term. Under terms of the agreement, it will automatically renew on November 5 of each year thereafter unless terminated under certain circumstances.
Our manager is entitled to receive a management fee payable monthly in arrears in an amount equal to 1/12th of an amount determined as follows:
| • | for our equity up to $250 million, 1.50% (per annum) of equity; plus |
| • | for our equity in excess of $250 million and up to $500 million, 1.10% (per annum) of equity; plus |
| • | for our equity in excess of $500 million and up to $750 million, 0.80% (per annum) of equity; plus |
| • | for our equity in excess of $750 million, 0.50% (per annum) of equity. |
For purposes of calculating the management fee, we define equity as the value, computed in accordance with GAAP, of our shareholders’ equity, adjusted to exclude the effects of unrealized gains or losses.
There is no incentive compensation payable to our manager pursuant to the management agreement.
Competition
Our success depends, in large part, on our ability to acquire assets at favorable spreads over our borrowing costs. In acquiring agency securities, we compete with mortgage REITs, mortgage finance and specialty finance companies, savings and loan associations, banks, mortgage bankers, insurance companies, mutual funds,
5
Table of Contents
institutional investors, investment banking firms, governmental bodies and other entities. In addition, there are numerous mortgage REITs with similar asset acquisition objectives, including ACM, and others may be organized in the future. The effect of the existence of additional REITs may be to increase competition for the available supply of mortgage assets suitable for purchase.
Employees
We are managed by Atlantic Capital Advisors LLC pursuant to the management agreement between our manager and us. We do not have any employees whom we compensate directly with salaries or other cash compensation. Our manager has approximately nine employees.
Additional Information
We have made available copies of the charters of the committees of our Board of Directors, our code of business ethics and conduct, our corporate governance guidelines, our whistleblower policy and any materials we file with the SEC on our website at www.hatfin.com. Copies of these documents are available in print to any shareholder who requests them. Requests should be sent to Hatteras Financial Corp., 110 Oakwood Drive, Suite 340, Winston-Salem, North Carolina 27103, Attention: Corporate Secretary. All filings we make with the SEC are also available free of charge on our website.
All reports filed with the Securities and Exchange Commission may also be read and copied at the SEC’s public reference room at 100 F Street, N.E., Washington, D.C. 20549. Further information regarding the operation of the public reference room may be obtained by calling 1-800-SEC-0330. In addition, all of our filed reports can be obtained at the SEC’s website at www.sec.gov.
| Item 1A. | Risk Factors |
Investment in our common stock involves significant risks. If any of the risks discussed in this report occur, our business, financial condition, liquidity and results of operations could be materially and adversely affected. The risk factors set forth below are not the only risks that may affect us. Additional risks and uncertainties not presently known to us, or not identified below, may also materially affect our business, financial condition, liquidity and results of operations. Some statements in this report, including statements in the following risk factors, constitute forward-looking statements. Please refer to the section entitled “Forward-Looking Statements.”
Risks Related to Our Management and Conflicts of Interest
We are dependent upon key employees of our manager, and we may not find suitable replacements if these key personnel are no longer available to us.
Our success depends to a significant degree upon the contributions of Messrs. Michael and Benjamin Hough and Messrs. Steele, Gibbs and Boos, whose continued service is not guaranteed, and each of whom would be difficult to replace. Because these key personnel collectively have a substantial amount of experience in the fixed income markets and these key personnel have prior experience managing a mortgage REIT, we depend on their experience and expertise to manage our day-to-day operations and our strategic business direction. In addition, many of these individuals have strong industry reputations, which aid us in identifying and financing investment opportunities. The loss of the services of these key personnel could diminish our relationships with lenders, and industry personnel and harm our business and our prospects. We cannot assure you that these individuals can be replaced with equally skilled and experienced professionals.
The management agreement between us and our manager was not negotiated on an arms-length basis and the terms, including fees payable, may not be as favorable to us as if it was negotiated with an unaffiliated third party.
Because our executive officers and two of our directors are also officers and owners of our manager, the management agreement was not negotiated on an arms-length basis, and we did not have the benefit of arms-length negotiations of the type normally conducted with an unaffiliated third party. As a result, the terms, including fees payable, may not be as favorable to us as an arms-length agreement. Furthermore, because our executive officers and two of our directors are also officers and owners of our manager, we may choose not to enforce, or to enforce less vigorously, our rights under the management agreement because of our desire to maintain our ongoing relationship with our manager.
Termination by us of our management agreement with our manager without cause is difficult and costly.
6
Table of Contents
The initial term of our management agreement expired on November 5, 2010. The agreement is automatically renewed for a one-year term on each anniversary date thereafter unless terminated. Our independent directors review our manager’s performance periodically and, following the initial term, the management agreement may be terminated upon the affirmative vote of at least two-thirds of our independent directors, or by a vote of the holders of a majority of our outstanding common stock, based upon: (1) unsatisfactory performance by our manager that is materially detrimental to us or (2) a determination that the management fees payable to our manager are not fair, subject to our manager’s right to prevent such a termination by accepting a reduction of management fees agreed to by at least two-thirds of our independent directors and our manager.
We must provide 180 days’ prior notice of any such termination. Our manager will be paid a termination fee equal to three times the average annual management fee earned by our manager during the two years immediately preceding termination. The termination fee may make it more difficult for us to terminate the management agreement. These provisions increase the cost to us of terminating the management agreement, thereby adversely affecting our ability to terminate our manager without cause.
Our manager may allocate mortgage-related opportunities to ACM, and thus may divert attractive investment opportunities away from us.
Each of our executive officers and some of our directors also serve as officers and owners of our manager. Our manager is also the external manager of ACM, a private mortgage REIT with investment objectives that are similar to ours. Furthermore, three of our executive officers, Messrs. Michael and Benjamin Hough and Mr. Gibbs are also executive officers and directors of ACM. Mr. Steele serves as our chief financial officer and also as chief financial officer of ACM. Mr. Boos serves as our co-chief investment officer and also as chief investment strategist of ACM. Our executive officers, who as of December 31, 2010 collectively and beneficially owned approximately 1.7% of the outstanding common stock of ACM on a diluted basis, intend to continue in such capacities with ACM. Most investment opportunities that are suitable for us are also suitable for ACM; therefore, these dual responsibilities create conflicts of interest for these officers in the event they are presented with opportunities that may benefit either us or ACM. Our management agreement requires our manager to allocate investments between us and ACM by determining the entity for which they believe the investment opportunity is most suitable. In making this determination, our manager considers the investment strategy and guidelines of each entity with respect to acquisition of assets, portfolio needs, market conditions, cash flow and other factors that they deem appropriate. However, our manager generally has no obligation to make any specific investment opportunities available to us, and the above mentioned conflicts of interest may result in decisions or allocations of securities that may benefit one entity more than the other. Thus, the executive officers of our manager could direct attractive investment opportunities to ACM instead of to us. Such events could result in us investing in investments that provide less attractive returns, reducing the level of distributions we may be able to pay to our shareholders.
Furthermore, in the future our manager may sponsor or provide management services to other investment vehicles with investment objectives that overlap with ours. Accordingly, we may further compete for access to the benefits that we expect our relationship with our manager to provide and for the time of its key employees.
Our manager and its key employees, who are our executive officers, face competing demands relating to their time and this may adversely affect our operations.
We rely on our manager and its employees, including Messrs. Michael and Benjamin Hough and Messrs. Steele, Gibbs and Boos, for the day-to-day operation of our business. Our manager is also the manager of ACM and each of the key employees of our manager are executive officers of ACM. As a result of their interests in ACM, Messrs. Michael and Benjamin Hough and Messrs. Steele, Gibbs and Boos face conflicts of interest in allocating their time among us and ACM.
7
Table of Contents
Because our manager has duties to ACM as well as to our company, we do not have the undivided attention of the management team of our manager and our manager faces conflicts in allocating management time and resources between our company and ACM. Further, during turbulent market conditions or other times when we need focused support and assistance from our manager, ACM or other entities for which our manager also acts as an investment manager will likewise require greater focus and attention, placing competing high levels of demand on our manager’s limited resources. In such situations, we may not receive the necessary support and assistance we require or would otherwise receive if we were internally managed or if our manager did not act as a manager for other entities.
Our board of directors approved broad investment guidelines for our manager and do not approve each investment decision made by our manager; as a result, our manager may cause us to acquire assets that produce investment returns that are below expectations or that result in net operating losses.
Our manager is authorized to follow broad investment guidelines. Our board of directors, including our independent directors, periodically reviews our investment guidelines and our investment policies. However, our board does not review each proposed investment. In addition, in conducting periodic reviews, the board of directors relies primarily on information provided to it by our manager. Furthermore, transactions entered into by our manager may be difficult or impossible to unwind by the time they are reviewed by the board of directors. Our manager has great latitude with the investment guidelines in determining the types of assets it may decide are proper investments for us.
Because our board of directors could change our investment policies without shareholder approval to permit us to invest in investments other than agency securities, we may invest in assets that bear greater credit, interest rate, prepayment or passive investment risks.
If market conditions change, our board of directors could change our investment policies without shareholder approval to permit us to invest in investments other than agency securities, such as other investment-grade mortgage assets, other real estate-related investments (which may not be investment grade) that management determines are consistent with our asset allocation policy and with our tax status as a REIT, and the securities of other REITs. If we acquire investments of lower credit quality, our profitability may decline and we may incur losses if there are defaults on assets underlying those investments or if the rating agencies downgrade the credit quality of those investments.
Investing in other REITs involves obtaining interests in real estate-related investments indirectly, which carries several risks, including the following:
| • | returns on our investments are not directly linked to returns on the assets of the REITs in which we invest; |
| • | we may have no ability to affect the management, investment decisions or operations of the REITs in which we invest; |
| • | prices of publicly-traded securities are likely to be volatile; and |
| • | the disposition value of investments is dependent upon general and specific market conditions. |
Each of these risks could cause the performance of our investments in other REITs to be lower than anticipated, which would adversely impact the overall returns for our portfolio.
Our manager’s management fee is payable regardless of our performance.
Our manager is entitled to receive a management fee from us that is based on the amount of our equity (as defined in the management agreement), regardless of the performance of our portfolio. For example, we would pay our manager a management fee for a specific period even if we experienced a net loss during the same period. Our manager’s entitlement to substantial nonperformance-based compensation might reduce its incentive to devote its time and effort to seeking investments that provide attractive risk-adjusted returns for our portfolio. This in turn could adversely affect our ability to make distributions to our shareholders and the market price of our common stock.
8
Table of Contents
Risks Related to Our Business
Volatile market conditions for mortgages and mortgage-related assets as well as the broader financial markets may adversely affect the value of the assets in which we invest.
Our results of operations are materially affected by conditions in the markets for mortgages and mortgage-related assets, including agency securities, as well as the broader financial markets and the economy generally. Beginning in 2007, significant adverse changes in financial market conditions resulted in a deleveraging of the entire global financial system and the forced sale of large quantities of mortgage-related and other financial assets. More recently, concerns over economic recession, inflation, geopolitical issues, unemployment, the availability and cost of financing, the mortgage market and a declining real estate market have contributed to increased volatility and diminished expectations for the economy and markets. In particular, the residential mortgage market in the United States has experienced a variety of difficulties and changed economic conditions, including defaults, credit losses and liquidity concerns. Certain commercial banks, investment banks and insurance companies have announced extensive losses from exposure to the residential mortgage market. These factors have impacted investor perception of the risk associated with agency securities in which we invest. As a result, values for agency securities in which we invest have experienced volatility. Any decline in the value of our investments, or perceived market uncertainty about their value, would likely make it difficult for us to obtain financing on favorable terms or at all, or maintain our compliance with terms of any financing arrangements already in place. Further increased volatility and deterioration in the broader residential mortgage and agency securities markets may adversely affect the performance and market value of our investments.
The federal conservatorship of Fannie Mae and Freddie Mac and related efforts, along with any changes in laws and regulations affecting the relationship between Fannie Mae and Freddie Mac and the federal government, may adversely affect our business.
The payments we expect to receive on the agency securities in which we invest depend upon a steady stream of payments on the mortgages underlying the securities and are guaranteed by Ginnie Mae, Fannie Mae and Freddie Mac. Ginnie Mae is part of a U.S. Government agency and its guarantees are backed by the full faith and credit of the United States. Fannie Mae and Freddie Mac are U.S. Government-sponsored entities, but their guarantees are not backed by the full faith and credit of the United States.
Since 2007, Fannie Mae and Freddie Mac have reported substantial losses and a need for substantial amounts of additional capital. In response to the deteriorating financial condition of Fannie Mae and Freddie Mac and the credit market disruption, Congress and the U.S. Treasury undertook a series of actions to stabilize these government-sponsored entities and the financial markets, generally. The Housing and Economic Recovery Act of 2008 was signed into law on July 30, 2008, and established the Federal Housing Finance Agency (“FHFA”), with enhanced regulatory authority over, among other things, the business activities of Fannie Mae and Freddie Mac and the size of their portfolio holdings. On September 7, 2008, FHFA placed Fannie Mae and Freddie Mac into federal conservatorship which is a statutory process pursuant to which the FHFA will operate Fannie Mae and Freddie Mac, support availability of mortgage financing and protect taxpayers. Appointing FHFA as conservator of both Fannie Mae and Freddie Mac allows the FHFA to control the actions of the government-sponsored entities without forcing them to liquidate, which would be the case under receivership. In addition, the U.S. Treasury has taken steps to capitalize and provide financing to Fannie Mae and Freddie Mac and agreed to purchase direct obligations and agency securities issued or guaranteed by Fannie Mae and Freddie Mac.
Shortly after Fannie Mae and Freddie Mac were placed in federal conservatorship, the Secretary of the U.S. Treasury noted that the guarantee payment structure of Fannie Mae and Freddie Mac required examination and that changes in the structures of the entities were necessary. The future roles of Fannie Mae and Freddie Mac could be significantly reduced and the nature of their guarantees could be eliminated or considerably limited relative to historical measurements. Any changes to the nature of the guarantees provided by Fannie Mae and Freddie Mac could redefine what constitutes an agency security and could have broad adverse market implications as well as negatively impact us.
The problems faced by Fannie Mae and Freddie Mac resulting in their being placed into federal conservatorship have stirred debate among some federal policy makers regarding the continued role of the U.S. Government in providing liquidity for the residential mortgage market. Following expiration of the current authorization, each of Fannie Mae and Freddie Mac could be dissolved and the U.S. Government could decide to stop providing liquidity
9
Table of Contents
support of any kind to the mortgage market. If Fannie Mae or Freddie Mac were eliminated, or their structures were to change radically, we would not be able to acquire agency securities from these companies, which would drastically reduce the amount and type of agency securities available for investment, which are our only targeted investments
Our income could be negatively affected in a number of ways depending on the manner in which related events unfold. For example, the current credit support provided by the U.S. Treasury to Fannie Mae and Freddie Mac, and any additional credit support it may provide in the future, could have the effect of lowering the interest rate we expect to receive from agency securities, thereby tightening the spread between the interest we earn on our portfolio of targeted assets and our cost of financing that portfolio. A reduction in the supply of agency securities could also negatively affect the pricing of agency securities we seek to acquire by reducing the spread between the interest we earn on our portfolio of targeted assets and our cost of financing that portfolio.
As indicated above, recent legislation has changed the relationship between Fannie Mae and Freddie Mac and the U.S. Government and requires Fannie Mae and Freddie Mac to reduce the amount of mortgage loans they own or for which they provide guarantees on agency securities. Future legislation could further change the relationship between Fannie Mae and Freddie Mac and the federal government, and could also nationalize or eliminate such entities entirely. Any law affecting these government-sponsored enterprises may create market uncertainty and have the effect of reducing the actual or perceived credit quality of securities issued or guaranteed by Fannie Mae or Freddie Mac. As a result, such laws could increase the risk of loss on investments in Fannie Mae and/or Freddie Mac agency securities. It also is possible that such laws could adversely impact the market for such securities and spreads at which they trade. All of the foregoing could materially adversely affect our business, operations and financial condition.
Difficult conditions in the financial markets, and the economy generally, have caused many lenders, including our own, to suffer substantial losses and may cause us losses related to our agency securities, and there is no assurance that these conditions will improve in the near future. As a result, we may not be able to obtain cost-effective financing.
Our results of operations are materially affected by conditions in the financial markets and the economy generally. Recently, concerns over inflation, energy costs, geopolitical issues, unemployment, the availability and cost of credit, the mortgage market and a declining real estate market have contributed to increased volatility and diminished expectations for the economy and markets.
Dramatic declines in the housing market, with decreasing home prices and increasing foreclosures and unemployment, have resulted in significant asset write-downs by financial institutions, which have caused many financial institutions to seek additional capital, to merge with other institutions and, in some cases, to fail. We rely on the availability of financing to acquire agency securities on a leveraged basis. Institutions from which we seek to obtain financing may have owned or financed residential mortgage loans, real estate-related securities and real estate loans which have declined in value and caused losses as a result of the recent downturn in the markets. Many lenders and institutional investors have reduced and, in some cases, ceased to provide funding to borrowers, including other financial institutions. If these conditions persist, these institutions may become insolvent or tighten their lending standards, which could make it more difficult for us to obtain financing on favorable terms or at all. Our financial condition and results of operations may be adversely affected if we are unable to obtain cost-effective financing for our investments.
There can be no assurance that the actions taken by the U.S. Government for the purpose of stabilizing or reforming the financial markets, or market response to those actions, may not achieve the intended effect or benefit our business, and may adversely affect us.
In response to the financial issues affecting the banking system and financial markets and going concern threats to commercial banks, investment banks and other financial institutions, the Emergency Economic Stabilization Act of 2008 (“EESA”), was enacted by the U.S. Congress. There can be no assurance that the EESA or any other U.S. Government actions will have a beneficial impact on the financial markets. To the extent the markets do not respond favorably to any such actions by the U.S. Government or such actions do not function as intended, our business may not receive the anticipated positive impact from the legislation and such result may have broad adverse market implications.
10
Table of Contents
In July 2010, the U.S. Congress enacted the Dodd Frank Wall Street Reform and Consumer Protection Act ( the “Dodd-Frank Act”), in part to impose significant investment restrictions and capital requirements on banking entities and other organizations that are significant to U.S. financial markets. For instance, the Dodd-Frank Act will impose significant restrictions on the proprietary trading activities of certain banking entities and subject other systemically significant organizations regulated by the U.S. Federal Reserve to increased capital requirements and quantitative limits for engaging in such activities. The Dodd-Frank Act also seeks to reform the asset-backed securitization market (including the mortgage-backed securities market) by requiring the retention of a portion of the credit risk inherent in the pool of securitized assets and by imposing additional registration and disclosure requirements. Certain of the new requirements and restrictions exempt agency securities, other government issued or guaranteed securities, or other securities. Nonetheless, the Dodd-Frank Act also imposes significant regulatory restrictions on the origination of residential mortgage loans. While the full impact of the Dodd-Frank Act cannot be assessed until implementing regulations are released, the Dodd-Frank Act’s extensive requirements may have a significant effect on the financial markets, and may affect the availability or terms of financing from our lender counterparties and the availability or terms of mortgage-backed securities, both of which may have an adverse effect on our business.
In addition, U.S. Government, Federal Reserve, U.S. Treasury and other governmental and regulatory bodies have taken or are considering taking other actions to address the financial crisis. We cannot predict whether or when such actions may occur or what affect, if any, such actions could have on our business, results of operations and financial condition.
Mortgage loan modification programs and future legislative action may adversely affect the value of, and the returns, on the agency securities in which we invest.
During 2008, the U.S. Government, through the Federal Housing Authority and the Federal Deposit Insurance Corporation, commenced implementation of programs designed to provide homeowners with assistance in avoiding residential mortgage loan foreclosures. The programs may involve, among other things, the modification of mortgage loans to reduce the principal amount of the loans or the rate of interest payable on the loans, or to extend the payment terms of the loans. It is likely that loan modifications would result in increased prepayments on some agency securities. These loan modification programs, as well as future legislative or regulatory actions, including amendments to the bankruptcy laws, that result in the modification of outstanding mortgage loans may adversely affect the value of, and the returns on, the agency securities in which we invest.
If we are unable to find suitable investments, we may not be able to achieve our investment objectives or pay dividends.
The availability of mortgage-related assets meeting our criteria depends upon, among other things, the level of activity and quality of and demand for securities in the mortgage securitization and secondary markets. The market for agency securities depends upon various factors including the level of activity in the residential real estate market, the level of and difference between short-term and long-term interest rates, incentives for issuers to securitize mortgage loans and demand for agency securities by institutional investors. The size and level of activity in the residential real estate lending market depends on various factors, including the level of interest rates, regional and national economic conditions and real estate values. To the extent we are unable to acquire a sufficient volume of mortgage-related assets meeting our criteria, our results of operations would be adversely affected. Furthermore, we cannot assure you that we will be able to acquire sufficient mortgage-related assets at spreads above our costs of funds.
A disproportionate rise in short-term interest rates as compared to longer-term interest rates may adversely affect our income.
The relationship between short-term and longer-term interest rates is often referred to as the “yield curve.” Ordinarily, short-term interest rates are lower than longer-term interest rates. If short-term interest rates rise disproportionately relative to longer-term interest rates (a flattening of the yield curve), our borrowing costs may increase more rapidly than the interest income earned on our assets. Because we expect our investments, on average, generally will bear interest based on longer-term rates than our borrowings, a flattening of the yield curve would tend to decrease our net income and the market value of our net assets. Additionally, to the extent cash flows from investments that return scheduled and unscheduled principal are reinvested, the spread between the yields on the new investments and available borrowing rates may decline, which would likely decrease our net income. It is also
11
Table of Contents
possible that short-term interest rates may exceed longer-term interest rates (a yield curve inversion), in which event our borrowing costs may exceed our interest income and we could incur operating losses.
A flat or inverted yield curve may adversely affect agency securities prepayment rates and supply.
Our net interest income varies primarily as a result of changes in interest rates as well as changes in interest rates across the yield curve. We believe that when the yield curve is relatively flat, borrowers have an incentive to refinance into mortgages with longer initial fixed rate periods and fixed rate mortgages, causing our agency securities to experience faster prepayments. In addition, a flatter yield curve generally leads to fixed-rate mortgage rates that are closer to the interest rates available on adjustable-rate mortgages, possibly decreasing the supply of agency securities. At times, short-term interest rates may increase and exceed long-term interest rates, causing an inverted yield curve. When the yield curve is inverted, fixed-rate mortgage rates may approach or be lower than adjustable-rate mortgage rates, further increasing agency securities prepayments and further negatively impacting agency securities supply. Increases in prepayments on our portfolio will cause our premium amortization to accelerate, lowering the yield on such assets. If this happens, we could experience a decrease in net income or incur a net loss during these periods, which may negatively impact our distributions to shareholders.
Interest rate mismatches between our agency securities and our borrowings used to fund our purchases of these securities may reduce our income during periods of changing interest rates.
Historically, we have funded most of our investments in adjustable-rate agency securities with borrowings that have interest rates that adjust more frequently than the interest rate indices and repricing terms of our agency securities. Accordingly, if short-term interest rates increase, our borrowing costs may increase faster than the interest rates on our adjustable-rate securities adjust. As a result, in a period of rising interest rates, we could experience a decrease in net income or a net loss.
Our investment strategy focuses on the acquisition of adjustable-rate agency securities. This means that their interest rates may vary over time based upon changes in an identified short-term interest rate index. In most cases, the interest rate indices and repricing terms of the agency securities that we acquire and our borrowings will not be identical, thereby potentially creating an interest rate mismatch between our investments and our borrowings. While the historical spread between relevant short-term interest rate indices has been relatively stable, there have been periods when the spread between these indices was volatile. See “Management’s Discussion and Analysis of Financial Condition and Results of Operations—Market and Interest Rate Trends and the Effect on our Portfolio—Interest Rates.” During periods of changing interest rates, these interest rate index mismatches could reduce our net income or produce a net loss, and adversely affect our dividends and the market price of our common stock.
Interest rates are highly sensitive to many factors, including governmental, monetary and tax policies, domestic and international economic and political considerations and other factors, all of which are beyond our control.
Interest rate caps on our adjustable-rate agency securities may reduce our income or cause us to suffer a loss during periods of rising interest rates.
The mortgage loans underlying our adjustable-rate securities typically will be subject to periodic and lifetime interest rate caps. Additionally, we may invest in ARMs with an initial “teaser” rate that will provide us with a lower than market interest rate initially, which may accordingly have lower interest rate caps than ARMs without such teaser rates. Periodic interest rate caps limit the amount an interest rate can increase during a given period. Lifetime interest rate caps limit the amount an interest rate can increase through maturity of a mortgage loan. If these interest rate caps apply to the mortgage loans underlying our adjustable-rate securities, the interest distributions made on the related securities will be similarly impacted. Our borrowings may not be subject to similar interest rate caps. Accordingly, in a period of rapidly increasing interest rates, the interest rates paid on our borrowings could increase without limitation while caps would limit the interest distributions on our adjustable-rate agency securities. Further, some of the mortgage loans underlying our adjustable-rate agency securities may be subject to periodic payment caps that result in a portion of the interest on those loans being deferred and added to the principal outstanding. As a result, we could receive less interest distributions on adjustable-rate agency securities, particularly those with an initial teaser rate, than we need to pay interest on our related borrowings. These factors could lower our net interest income, cause us to suffer a net loss or cause us to incur additional borrowings to fund interest payments during periods of rising interest rates or sell our investments at a loss.
Because we may acquire fixed-rate securities, an increase in interest rates may adversely affect our book value.
12
Table of Contents
Increases in interest rates may negatively affect the market value of our agency securities. Any fixed-rate securities we invest in generally will be more negatively affected by these increases than adjustable-rate securities. In accordance with accounting rules, we are required to reduce our shareholders’ equity, or book value, by the amount of any decrease in the market value of our mortgage-related assets. We are required to evaluate our securities on a quarterly basis to determine their fair value by using third party bid price indications provided by dealers who make markets in these securities or by third-party pricing services. If the fair value of a security is not available from a dealer or third-party pricing service, we estimate the fair value of the security using a variety of methods including, but not limited to, discounted cash flow analysis, matrix pricing, option- adjusted spread models and fundamental analysis. Aggregate characteristics taken into consideration include, but are not limited to, type of collateral, index, margin, periodic cap, lifetime cap, underwriting standards, age and delinquency experience. However, the fair value reflects estimates and may not be indicative of the amounts we would receive in a current market exchange. If we are required by accounting rules to reduce the value of one or more agency securities on our balance sheet, then our shareholders’ equity would be correspondingly reduced. Reductions in shareholders’ equity decrease the amounts we may borrow to purchase additional securities, which could restrict our ability to increase our net income.
Because we acquire agency securities that are backed by hybrid ARMs and may acquire fixed-rate securities, an increase in interest rates may adversely affect our profitability.
While all of our investments currently consist of agency securities that are backed by hybrid ARMs, which have a fixed rate for an initial period of time and then become adjustable-rate securities, we may also invest in fixed-rate mortgage securities. In a period of rising interest rates, the interest payments on our borrowings could increase while the interest payments we earn on our hybrid mortgage securities and fixed-rate mortgage securities would not change. As a result, our returns would be reduced.
We may experience a decline in the market value of our assets.
A decline in the market value of our agency securities or other assets may require us to recognize an “other-than-temporary” impairment against such assets under GAAP if we were to determine that, with respect to any assets in unrealized loss positions, we do not have the ability and intent to hold such assets to maturity or for a period of time sufficient to allow for recovery to the amortized cost of such assets. If such a determination were to be made, we would recognize unrealized losses through earnings and write down the amortized cost of such assets to a new cost basis, based on the fair market value of such assets on the date they are considered to be other-than-temporarily impaired. Such impairment charges reflect non-cash losses at the time of recognition; subsequent disposition or sale of such assets could further affect our future losses or gains, as they are based on the difference between the sale price received and adjusted amortized cost of such assets at the time of sale. In this regard, we note that the fair market value of our agency securities is and has been affected by changes in interest rates and relative “credit spreads,” or the differences in value between agency securities and U.S. Treasuries with similar durations. See “Management’s Discussion and Analysis of Financial Condition and Results of Operations—Market and Interest Rate Trends and the Effect on our Portfolio.”
Changes in prepayment rates on our agency securities may decrease our net interest income.
Pools of mortgage loans underlie the agency securities that we acquire. We will generally receive principal distributions from the principal payments that are made on these underlying mortgage loans. When borrowers repay their mortgage loans faster than expected, this will result in prepayments that are faster than expected on the agency securities. Prepayment rates are influenced by changes in current interest rates and a variety of economic, geographic and other factors, all of which are beyond our control. Prepayment rates generally increase when interest rates fall and decrease when interest rates rise, but changes in prepayment rates are difficult to predict. Prepayment rates also may be affected by conditions in the housing and financial markets, government actions, general economic conditions and the relative interest rates on fixed-rate and adjustable-rate mortgage loans. Faster than expected prepayments could adversely affect our profitability, including in the following ways:
| • | We may purchase agency securities that have a higher interest rate than the market interest rate at the time of purchase. In exchange for this higher interest rate, we would be required to pay a premium over the face amount of the security to acquire the security. In accordance with accounting rules, we would amortize this premium over the anticipated term of the mortgage security. If principal distributions are received faster than anticipated, we would be required to expense the premium faster. We may not be able to reinvest the principal distributions received on agency securities in similar new agency |
13
Table of Contents
| securities and, to the extent that we can do so, the effective interest rates on the new agency securities will likely be lower than the yields on the mortgages that were prepaid. |
| • | We also may acquire agency securities at a discount. If the actual prepayment rates on a discount mortgage security are slower than anticipated at the time of purchase, we would be required to recognize the discount as income more slowly than anticipated. This would adversely affect our profitability. Slower than expected prepayments also may adversely affect the market value of a discount mortgage security. |
Competition may prevent us from acquiring agency securities at favorable yields and that would negatively impact our profitability.
Our net income largely depends on our ability to acquire agency securities at favorable spreads over our borrowing costs. In acquiring agency securities, we compete with other mortgage REITs, mortgage finance and specialty finance companies, savings and loan associations, banks, mortgage bankers, insurance companies, mutual funds, institutional investors, investment banking firms, other lenders and other entities that purchase mortgage-related assets. Many of our competitors are substantially larger and have considerably greater financial, technical and marketing resources than we do. Several other REITs have recently raised, or are expected to raise, significant amounts of capital, and may have investment objectives that overlap with ours, which may create competition for investment opportunities. As a result, we may not in the future be able to acquire sufficient agency securities at favorable spreads over our borrowing costs which would adversely affect our profitability.
Rapid changes in the values of our real estate-related investments may make it difficult for us to maintain our qualification as a REIT or exemption from the Investment Company Act.
We may acquire non-real estate related assets in the event our independent directors change our investment strategies. If the market value or income potential of real estate-related investments declines as a result of increased interest rates, prepayment rates or other factors, we may need to increase our real estate investments and income and/or liquidate our non-qualifying assets in order to maintain our REIT qualification or exemption from the Investment Company Act. If the decline in real estate asset values and/or income occurs quickly, this may be especially difficult to accomplish. This difficulty may be exacerbated by the illiquid nature of any non-real estate assets that we may own. We may have to make investment decisions that we otherwise would not make absent the REIT and Investment Company Act considerations.
Because assets we expect to acquire may experience periods of illiquidity, we may lose profits or be prevented from earning capital gains if we cannot sell mortgage-related assets at an opportune time.
We bear the risk of being unable to dispose of our mortgage-related assets at advantageous times or in a timely manner because mortgage-related assets generally experience periods of illiquidity, including the recent period of delinquencies and defaults with respect to residential mortgage loans. The lack of liquidity may result from the absence of a willing buyer or an established market for these assets, as well as legal or contractual restrictions on resale or the unavailability of financing for these assets. As a result, our ability to vary our portfolio in response to changes in economic and other conditions may be relatively limited, which may cause us to incur losses.
Hedging against interest rate exposure may adversely affect our earnings.
Subject to complying with REIT requirements, we employ techniques that limit, or “hedge,” the adverse effects of rising interest rates on our short-term repurchase agreements and on the value of our assets. Our hedging activity will vary in scope based on the level and volatility of interest rates and principal repayments, the type of securities held and other changing market conditions. These techniques may include entering into interest rate swap agreements or interest rate cap or floor agreements, purchasing or selling futures contracts, purchasing put and call options on securities or securities underlying futures contracts, or entering into forward rate agreements. We have implemented a policy to limit our use of hedging instruments to only those techniques described above and to only enter into hedging transactions with counterparties that have a high-quality credit rating. However, there are no perfect hedging strategies, and interest rate hedging may fail to protect us from loss. In addition, these hedging strategies may adversely affect us because hedging activities involve an expense that we will incur regardless of the effectiveness of the hedging activity. Hedging activities could result in losses if the event against which we hedge does not occur. Additionally, interest rate hedging could fail to protect us or adversely affect us because, among other things:
14
Table of Contents
| • | available interest rate hedging may not correspond directly with the interest rate risk for which protection is sought; |
| • | the duration of the hedge may not match the duration of the related liability; |
| • | fair value accounting rules could foster adverse valuation adjustments due to credit quality considerations that could impact both earnings and shareholder equity. |
| • | the party owing money in the hedging transaction may default on its obligation to pay; |
| • | the credit quality of the party owing money on the hedge may be downgraded to such an extent that it impairs our ability to sell or assign our side of the hedging transaction; and |
| • | the value of derivatives used for hedging may be adjusted from time to time in accordance with accounting rules to reflect changes in fair value. Downward adjustments, or “mark-to-market losses,” would reduce our shareholders’ equity. |
We may fail to qualify for hedge accounting treatment.
We record derivative and hedge transactions in accordance with GAAP, specifically according to the Accounting Standards Codification (“ASC”) Topic on Derivatives. Under these standards, we may fail to qualify for hedge accounting treatment for a number of reasons, including if we use instruments that do not meet the definition of a derivative (such as short sales), we fail to satisfy hedge documentation and hedge effectiveness assessment requirements or our instruments are not highly effective. If we fail to qualify for hedge accounting treatment, our operating results may suffer because losses on the derivatives we enter into may not be offset by a change in the fair value of the related hedged transaction.
We are highly dependent on information and communications systems. Any systems failures could significantly disrupt our business, which may, in turn, negatively affect our operations and the market price of our common stock and our ability to pay dividends to our shareholders.
Our business is highly dependent on communications and information systems. Any failure or interruption of our manager’s systems could cause delays or other problems in our agency securities trading activities, which could have a material adverse effect on our operating results, the market price of our common stock and our ability to pay dividends to our shareholders.
Risks Related to Debt Financing
We incur significant debt to finance our investments, which subjects us to increased risk of loss.
We generally borrow between eight and 12 times the amount of our shareholders’ equity, although our borrowings may at times be above or below this amount. As of December 31, 2010, our borrowings were approximately $8.7 billion, and our debt-to-shareholders’ equity ratio was approximately 7.6:1. To the extent we exceed a debt-to-shareholders’ equity ratio of 12:1, the adverse impact on our financial condition and results of operations from the types of risks described in this section would likely be more severe. We incur leverage by borrowing against our agency securities. Incurring debt subjects us to many risks, including the risks that:
| • | our cash flow from operations will be insufficient to make required payments of principal and interest, resulting in the loss of some or all of our securities due to foreclosure or sale in order to satisfy our debt obligations; |
| • | our debt may increase our vulnerability to adverse economic and industry conditions; |
| • | we may be required to dedicate a substantial portion of our cash flow from operations to payments on our debt, thereby reducing funds available for distribution to shareholders, funding our operations, future business opportunities or other purposes; |
| • | the terms of any refinancing will not be as favorable as the terms of the debt being refinanced; |
| • | the use of leverage could adversely affect our ability to make distributions to our shareholders and could reduce the market price of our stock; |
15
Table of Contents
| • | a default under a loan could result in an involuntary liquidation of the securities pledged for such loan, including any cross-collateralized securities, which would result in a loss to us of the difference between the value of the securities upon liquidation and the carrying value of the securities; and |
| • | to the extent we are compelled to liquidate assets to repay debts, such an event could jeopardize (1) our REIT status, or (2) our exemption from registration under the Investment Company Act, the loss of either of which could decrease our overall profitability and our ability to make distributions to our shareholders. |
A decrease in the value of assets financed through repurchase agreements may lead our lenders to require us to pledge additional assets as collateral. If our assets are insufficient to meet the collateral requirements, then we may be compelled to liquidate particular assets at an inopportune time.
A majority of our borrowings are and will be secured by our agency securities, generally under repurchase agreements. The amount borrowed under a repurchase agreement is based on the market value of the agency securities pledged to secure the borrowings. Our repurchase agreements allow our lenders to revise the market value of the agency securities pledged as collateral from time to time to reflect then–current market conditions. Possible market developments, including a sharp rise in interest rates, a change in prepayment rates or increasing market concern about the value or liquidity of one or more types of securities in which our portfolio is concentrated, may cause a decline in the market value of the agency securities used to secure these debt obligations, which could limit our ability to borrow or result in lenders requiring us to pledge additional collateral to secure our borrowings or repay a portion of the outstanding borrowings, on minimal notice. In that situation, we could be required to sell agency securities under adverse market conditions in order to obtain the additional collateral required by the lender or to pay down our borrowings. If these sales are made at prices lower than the carrying value of the agency securities, we would experience losses, thus adversely affecting our operating results and net profitability. In recent months, a number of companies owning mortgage securities have been required by lenders to pledge additional collateral as the market value of their mortgage securities declined. In the ordinary course of our business, we experience margin calls, which require us to pledge additional collateral or pay down our borrowings. See “Management’s Discussion and Analysis of Financial Condition and Results of Operations — Liquidity and Capital Resources.”
Further, financial institutions may require us to maintain a certain amount of cash that is not invested or to set aside non-leveraged assets sufficient to maintain a specified liquidity position which would allow us to satisfy our collateral obligations. As a result, we may not be able to leverage our assets as fully as we would choose, which could reduce our return on equity. In the event that we are unable to meet these collateral obligations, then, as described above, our financial condition could deteriorate rapidly.
Failure to procure adequate debt financing, or to renew or replace existing debt financing as it matures, would adversely affect our results and may, in turn, negatively affect the value of our common stock and our ability to distribute dividends.
We use debt financing as a strategy to increase our return on investments. However, we may not be able to achieve our desired debt-to-equity ratio for a number of reasons, including the following:
| • | our lenders do not make debt financing available to us at acceptable rates; or |
| • | our lenders require that we pledge additional collateral to cover our borrowings, which we may be unable to do. |
The dislocations in the residential mortgage market and credit markets have led lenders, including the financial institutions that provide financing for our investments, to heighten their credit review standards, and, in some cases, to reduce or eliminate loan amounts available to borrowers. As a result, we cannot assure you that any, or sufficient, debt funding will be available to us in the future on terms that are acceptable to us. In the event that we cannot obtain sufficient funding on acceptable terms, there may be a negative impact on the value of our common stock and our ability to make distributions, and you may lose part or all of your investment.
Furthermore, because we rely primarily on short-term borrowings, our ability to achieve our investment objective depends not only on our ability to borrow money in sufficient amounts and on favorable terms, but also on our ability to renew or replace on a continuous basis our maturing short-term borrowings. As of December 31, 2010,
16
Table of Contents
a majority of our borrowings bore maturities of 30 days or less. If we are not able to renew or replace maturing borrowings, we will have to sell some or all of our assets, possibly under adverse market conditions.
Lenders may require us to enter into restrictive covenants relating to our operations.
When we obtain financing, lenders could impose restrictions on us that would affect our ability to incur additional debt, our capability to make distributions to shareholders and our flexibility to determine our operating policies. Loan documents we execute may contain negative covenants that limit, among other things, our ability to repurchase stock, distribute more than a certain amount of our funds from operations, and employ leverage beyond certain amounts.
We may incur increased borrowing costs related to repurchase agreements and that would adversely affect our profitability.
Substantially all of our borrowings are expected to be collateralized borrowings in the form of repurchase agreements. Our borrowing costs under our repurchase agreements generally correspond to short-term interest rates such as LIBOR or a short-term Treasury index, plus or minus a margin. The margins on these borrowings over or under short-term interest rates may vary depending upon:
| • | the movement of interest rates; |
| • | the availability of financing in the market; and |
| • | the credit quality, value and liquidity of our agency securities. |
As of December 31, 2010, the weighted average margin requirement under all our repurchase agreements was approximately 4.4% (weighted by borrowing amount).
If the interest rates on these repurchase agreements increase at a rate higher than the increase in rates payable on our investments, our profitability would be adversely affected.
If the counterparties to our repurchase transactions default on their obligations to resell the underlying security back to us at the end of the transaction term, or if the value of the underlying security has declined as of the end of that term or if we default on our obligations under the repurchase agreement, we will lose money on our repurchase transactions.
When we engage in a repurchase transaction, we generally sell securities to the transaction counterparty and receive cash from the counterparty. The counterparty is obligated to resell the securities back to us at the end of the term of the transaction, which is typically from 30 days to less than one year, but which may have terms in excess of one year. The cash we receive from the counterparty when we initially sell the securities to the counterparty is less than the value of those securities, which is referred to as the haircut. If the counterparty defaults on its obligation to resell the securities back to us we would incur a loss on the transaction equal to the amount of the haircut (assuming there was no change in the value of the securities). We would also lose money on a repurchase transaction if the value of the underlying securities has declined as of the end of the transaction term, as we would have to repurchase the securities for their initial value but would receive securities worth less than that amount. Any losses we incur on our repurchase transactions could adversely affect our earnings, and thus our cash available for distribution to our shareholders.
If we default on one of our obligations under a repurchase transaction, the counterparty can terminate the transaction and cease entering into any other repurchase transactions with us. In that case, we would likely need to establish a replacement repurchase facility with another repurchase dealer in order to continue to leverage our portfolio and carry out our investment strategy. There is no assurance we would be able to establish a suitable replacement facility on acceptable terms or at all.
Our use of repurchase agreements to borrow funds may give our lenders greater rights in the event that either we or a lender file for bankruptcy.
Our borrowings under repurchase agreements may qualify for special treatment under the bankruptcy code, giving our lenders the ability to avoid the automatic stay provisions of the bankruptcy code and to take possession of and liquidate our collateral under the repurchase agreements without delay in the event that we file for bankruptcy. Furthermore, the special treatment of repurchase agreements under the bankruptcy code may make it difficult for us
17
Table of Contents
to recover our pledged assets in the event that a lender files for bankruptcy. Thus, our use of repurchase agreements will expose our pledged assets to risk in the event of a bankruptcy filing by either a lender or us.
Risks Related to Our Corporate Structure
Failure to maintain an exemption from the Investment Company Act would adversely affect our results of operations.
We believe that we conduct our business in a manner that allows us to avoid being regulated as an investment company under the Investment Company Act. Under Section 3(c)(5)(C), the Investment Company Act exempts entities that are primarily engaged in the business of purchasing or otherwise acquiring “mortgages and other liens on and interests in real estate.” The staff of the SEC has provided guidance on the availability of this exemption. Specifically, the staff’s position generally requires us to maintain at least 55% of our assets directly in qualifying real estate interests and 80% in real estate-related investments (including our qualifying real estate interests). We refer to this exemption as the “Mortgage Exemption.” In order to constitute a qualifying real estate interest under the 55% requirement, a real estate interest must meet various criteria. Mortgage securities that do not represent all of the certificates issued with respect to an underlying pool of mortgages may be treated as securities separate from the underlying mortgage loans and, thus, may not qualify for purposes of the 55% requirement. Our ownership of these mortgage securities, therefore, is limited by the provisions of the Investment Company Act. Accordingly, we intend to maintain at least 55% of our assets in whole pools of mortgages issued by Ginnie Mae, Fannie Mae or Freddie Mac. We may, consistent with our investment allocation guidelines and the Investment Company Act, invest up to 45% but not less than 25% of our remaining assets in partial pools of mortgages and other real estate-related investments (including our qualifying real estate interests).
Competition for investments may prevent us from acquiring mortgage securities that meet the 55% requirement at favorable yields or from acquiring sufficient qualifying securities to comply with the Mortgage Exemption under the Investment Company Act. If we fail to continue to qualify for an exemption from registration as an investment company, our ability to use leverage would be substantially reduced and we would be unable to conduct our business as planned.
We are subject to financial reporting and other requirements for which our accounting, internal audit and other management systems and resources may not be adequately prepared.
We are subject to reporting and other obligations under the Securities Exchange Act of 1934, as amended, including the requirements of Section 404 of the Sarbanes-Oxley Act. Section 404 requires annual management assessments of the effectiveness of our internal controls over financial reporting and a report by our independent registered public accounting firm addressing these assessments as of December 31, 2010. These reporting and other obligations, such as our status as a large accelerated filer, place significant demands on our management, administrative, operational, internal audit and accounting resources and cause us to incur significant expenses. We may need to upgrade our systems or create new systems; implement additional financial and management controls, reporting systems and procedures; expand or outsource our internal audit function; and hire additional accounting, internal audit and finance staff. If we are unable to accomplish these objectives in a timely and effective fashion, our ability to comply with the financial reporting requirements and other rules that apply to reporting companies could be impaired. Any failure to maintain effective internal controls could have a material adverse effect on our business, operating results and stock price.
Our policies are determined by our board of directors, and our shareholders have limited rights.
Our board of directors is responsible for our strategic business direction. Our major policies, including our policies with respect to acquisitions, leasing, financing, growth, operations, debt limitation and distributions, are determined by our board of directors. Our board of directors may amend or revise these and other policies from time to time without a vote of our shareholders. Our board’s broad discretion in setting policies and shareholders’ inability to exert control over those policies increases the uncertainty and risks you face as a shareholder.
Our board of directors may approve the issuance of capital stock with terms that may discourage a third party from acquiring us and may increase or decrease our authorized capital stock without shareholder approval.
Our charter permits our board of directors to issue shares of preferred stock, issuable in one or more classes or series. We may issue a class of preferred stock to individual investors in order to comply with the various REIT
18
Table of Contents
requirements. Our charter further permits our board of directors to amend our charter to increase or decrease the aggregate number of shares of our authorized stock or the number of shares of stock of any class or series without shareholder approval. Our board of directors may also classify or reclassify any unissued shares of preferred or common stock and establish the preferences and rights (including the right to vote, participate in earnings and to convert into shares of our common stock) of any such shares of stock, which rights may be superior to those of shares of our common stock. Thus, our board of directors could authorize the issuance of shares of preferred or common stock with terms and conditions that could have the effect of discouraging a takeover or other transaction in which holders of some or a majority of the outstanding shares of our common stock might receive a premium for their shares over the then current market price of our common stock. Furthermore, to the extent we issue additional equity interests, your percentage ownership interest in us will be diluted. In addition, depending on the terms and pricing of any additional offerings, you may also experience dilution in the book value and fair value of your shares.
Our ownership limitations may restrict business combination opportunities.
To qualify as a REIT under the Code, no more than 50% of the value of our outstanding shares of capital stock may be owned, directly or under applicable attribution rules, by five or fewer individuals (as defined by the Code to include certain entities) during the last half of each taxable year (other than our first REIT taxable year). To preserve our REIT qualification, our charter generally prohibits direct or indirect ownership by any person of either (1) more than the aggregate stock ownership limit or (2) more than the common stock ownership limit. Generally, shares owned by affiliated owners will be aggregated for purposes of the ownership limits. Any transfer of shares of our common stock that would violate the ownership limits will result in the shares of common stock that would otherwise be held in violation of the ownership limits being designated as “shares-in-trust” and transferred automatically to a trust effective on the day before the purported transfer or other event giving rise to such excess ownership. The intended transferee will acquire no rights in such shares. The beneficiary of the trust will be one or more charitable organizations named by us. The ownership limits could have the effect of delaying, deferring or preventing a change in control or other transaction in which holders of shares of common stock might receive a premium for their shares of common stock over the then current market price or that such holders might believe to be otherwise in their best interests. The ownership limit provisions also may make our shares of common stock an unsuitable investment vehicle for any person seeking to obtain, either alone or with others as a group, ownership of either (1) more than 9.8% of the number or value of our outstanding shares of common stock or (2) more than 9.8% of the number or value of our outstanding shares of all classes.
Provisions of Maryland law and other provisions of our organizational documents may limit the ability of a third party to acquire control of our company.
Certain provisions of the Maryland General Corporation Law (“MGCL”) may have the effect of delaying, deferring or preventing a transaction or a change in control of our company that might involve a premium price for holders of our common stock or otherwise be in their best interests, including:
| • | “business combination” provisions that, subject to limitations, prohibit certain business combinations between us and an “interested stockholder” (defined generally as any person who beneficially owns 10% or more of the voting power of our shares or an affiliate thereof) for five years after the most recent date on which the shareholder becomes an interested stockholder, and thereafter impose special shareholder voting requirements on these combinations; and |
| • | “control share” provisions that provide that “control shares” of our company (defined as shares which, when aggregated with other shares controlled by the acquiring shareholder, entitle the shareholder to exercise one of three increasing ranges of voting power in electing directors) acquired in a “control share acquisition” (defined as the direct or indirect acquisition of ownership or control of “control shares”) have no voting rights except to the extent approved by our shareholders by the affirmative vote of at least two-thirds of all the votes entitled to be cast on the matter, excluding all interested shares. |
Our bylaws provide that we are not subject to the “control share” provisions of the MGCL. However, our board of directors may elect to make the “control share” statute applicable to us at any time, and may do so without shareholder approval.
Title 3, Subtitle 8 of the MGCL permits our board of directors, without shareholder approval and regardless of what is currently provided in our charter or bylaws, to elect on behalf of our company to be subject to statutory provisions that may have the effect of delaying, deferring or preventing a transaction or a change in control of our
19
Table of Contents
company that might involve a premium price for holders of our common stock or otherwise be in their best interest. Pursuant to Title 3, Subtitle 8 of the MGCL, our charter provides that our board of directors will have the exclusive power to fill vacancies on our board. As a result, unless all of the directorships are vacant, our shareholders will not be able to fill vacancies with nominees of their own choosing. Our board of directors may elect to opt in to additional provisions of Title 3, Subtitle 8 of the MGCL without shareholder approval at any time.
Additionally, our charter and bylaws contain other provisions that may delay or prevent a change of control of our company. For example, our charter and bylaws provide that the number of directors constituting our full board may be fixed only by our directors, that our bylaws may only be amended by our directors and that a special meeting of shareholders may not be called by holders of our common stock holding less than a majority of our outstanding shares entitled to vote at such meeting.
Our rights and the rights of our shareholders to take action against our directors and officers are limited, which could limit your recourse in the event of actions not in shareholders’ best interests.
Our charter limits the liability of our directors and officers for money damages, except for liability resulting from actual receipt of an improper benefit or profit in money, property or services, or a final judgment based upon a finding of active and deliberate dishonesty by the director or officer that was material to the cause of action adjudicated.
Our charter also authorizes us to indemnify our directors and officers for actions taken by them in those capacities to the extent permitted by Maryland law, and our bylaws obligate us, to the maximum extent permitted by Maryland law, to indemnify any present or former director or officer of our company from and against any claim or liability to which he or she may become subject by reason of his or her service in that capacity. In addition, we may be obligated to fund the defense costs incurred by our directors and officers. Finally, we have entered into agreements with our directors and officers pursuant to which we have agreed to indemnify them to the maximum extent permitted by Maryland law.
Future offerings of debt securities, which would rank senior to our common stock upon liquidation, and future offerings of equity securities, which would dilute our existing shareholders and may be senior to our common stock for the purposes of dividend and liquidating distributions, may adversely affect the market price of our common stock.
In the future, we may attempt to increase our capital resources by making offerings of debt or additional offerings of equity securities, including commercial paper, senior or subordinated notes and series of preferred stock or common stock. Upon liquidation, holders of our debt securities and shares of preferred stock, if any, and lenders with respect to other borrowings will receive a distribution of our available assets prior to the holders of our common stock. Additional equity offerings may dilute the holdings of our existing shareholders or reduce the market price of our common stock, or both. Preferred stock, if issued, could have a preference on liquidating distributions or a preference on dividend payments or both that could limit our ability to make a dividend distribution to the holders of our common stock. Because our decision to issue securities in any future offering will depend on market conditions and other factors beyond our control, we cannot predict or estimate the amount, timing or nature of our future offerings. Thus, holders of our common stock bear the risk of our future offerings reducing the market price of our common stock and diluting their stock holdings in us.
We have not established a minimum dividend payment level and there are no assurances of our ability to pay dividends in the future.
We intend to pay quarterly dividends and to make distributions to our shareholders in amounts such that all or substantially all of our taxable income in each year, subject to certain adjustments, is distributed. This, along with other factors, should enable us to qualify for the tax benefits accorded to a REIT under the Code. However, we have not established a minimum dividend payment level and our ability to pay dividends may be adversely affected by the risk factors described in this report. All distributions will be made at the discretion of our board of directors and will depend on our earnings, our financial condition, maintenance of our REIT status and such other factors as our board of directors may deem relevant from time to time. There are no assurances of our ability to pay dividends in the future. In addition, some of our distributions may include a return of capital.
Broad market fluctuations could negatively impact the market price of our stock.
20
Table of Contents
We cannot assure you that the market price of our common stock will not fluctuate or decline significantly in the future. Some of the factors that could affect our stock price or result in fluctuations in the price or trading volume of our common stock include:
| • | actual or anticipated variations in our quarterly operating results; |
| • | changes in our operations or earnings estimates or publication of research reports about us or the industry; |
| • | increases in market interest rates may lead purchasers of our common stock to demand a higher yield; |
| • | changes in market valuations of similar companies; |
| • | adverse market reaction to any increased indebtedness we incur in the future; |
| • | additions or departures of key management personnel; |
| • | actions by institutional shareholders; |
| • | speculation in the press or investment community; and |
| • | general market and economic conditions. |
In addition, the stock market has experienced price and volume fluctuations that have affected the market prices of many companies in industries similar or related to ours and may have been unrelated to operating performances of these companies. These broad market fluctuations could reduce the market price of our common stock.
Future issuances or sales of shares could cause our share price to decline.
Sales of substantial numbers of shares of our common stock in the public market, or the perception that such sales might occur, could adversely affect the market price of our common stock. In addition, the sale of these shares could impair our ability to raise capital through a sale of additional equity securities.
Other issuances of our common stock could have an adverse effect on the market price of our common stock. In addition, future issuances of our common stock may be dilutive to existing shareholders.
Federal Income Tax Risks
If we do not qualify as a REIT, we will be subject to tax as a regular corporation and face substantial tax liability.
We expect to continue to operate so as to qualify as a REIT under the Code. However, qualification as a REIT involves the application of highly technical and complex Code provisions for which only a limited number of judicial or administrative interpretations exist. Even a technical or inadvertent mistake could jeopardize our REIT status. Furthermore, new tax legislation, administrative guidance or court decisions, in each instance potentially with retroactive effect, could make it more difficult or impossible for us to qualify as a REIT. If we fail to qualify as a REIT in any tax year, then we would be taxed as a regular domestic corporation, which, among other things, means being unable to deduct distributions to shareholders in computing taxable income and being subject to federal income tax, including any applicable alternative minimum tax, on our taxable income at regular corporate rates. Any resulting tax liability could be substantial and would reduce the amount of cash available for distribution to shareholders, which could in turn have an adverse impact on the value of our stock. Furthermore, unless we were entitled to relief under applicable statutory provisions, we would be disqualified from treatment as a REIT for the subsequent four taxable years following the year during which we lost our qualification, and thus, our cash available for distribution to shareholders would be reduced for each of the years during which we did not qualify as a REIT.
Even if we remain qualified as a REIT, we may face other tax liabilities that reduce our cash flow.
Even if we remain qualified for taxation as a REIT, we may be subject to certain federal, state and local taxes on our income and assets. Any of these taxes would decrease cash available for distribution to our shareholders.
Complying with REIT requirements may cause us to forego otherwise attractive opportunities.
In order to maintain our qualification as a REIT for federal income tax purposes, we must continually satisfy tests concerning, among other things, the sources of our income, the nature and diversification of our assets, the amounts we distribute to our shareholders and the ownership of our stock. We may be required to make distributions
21
Table of Contents
to shareholders at disadvantageous times or when we do not have funds readily available for distribution. Thus, compliance with the REIT requirements may hinder our ability to operate solely on the basis of maximizing profits.
Complying with REIT requirements may limit our ability to hedge effectively.
The REIT provisions of the Code may limit our ability to hedge our assets and operations. Under these provisions, any income that we generate from transactions intended to hedge our interest rate, inflation and/or currency risks will be excluded from gross income for purposes of the REIT 75% and 95% gross income tests if the instrument hedges (i) interest rate risk on liabilities incurred to carry or acquire real estate assets or (ii) risk of currency fluctuations with respect to any item of income or gain that would be qualifying income under the REIT 75% or 95% gross income tests, and such instrument is properly identified under applicable regulations of the U.S. Treasury. Income from hedging transactions entered into prior to July 31, 2008 that hedge interest rate risk on liabilities incurred to carry or acquire real estate assets will be excluded from gross income for purposes of the REIT 95% gross income test, but will not be qualifying income for purposes of the REIT 75% gross income test. Income from hedging transactions that do not meet these requirements will generally constitute nonqualifying income for purposes of both the REIT 75% and 95% gross income tests. As a result of these rules, we may have to limit our use of hedging techniques that might otherwise be advantageous, which could result in greater risks associated with interest rate or other changes than we would otherwise incur.
Complying with REIT requirements may force us to liquidate otherwise attractive investments.
In order to maintain our qualification as a REIT, we must also ensure that at the end of each calendar quarter at least 75% of the value of our assets consists of cash, cash items, government securities and qualified REIT real estate assets. The remainder of our investment in securities (other than government securities and qualified real estate assets) generally cannot include more than 10% of the outstanding voting securities of any one issuer or more than 10% of the total value of the outstanding securities of any one issuer. In addition, in general, no more than 5% of the value of our assets (other than government securities and qualified real estate assets) can consist of the securities of any one issuer and no more than 20% (or, beginning with our 2009 taxable year, 25%) of the value of our total securities can be represented by securities of one or more taxable REIT subsidiaries. If we fail to comply with these requirements at the end of any calendar quarter, we must correct such failure within 30 days after the end of the calendar quarter in order to avoid losing our REIT status and suffering adverse tax consequences. As a result, we may be required to liquidate otherwise attractive investments.
Complying with REIT requirements may force us to borrow to make distributions to shareholders or otherwise depend on external sources of capital to fund such distributions.
As a REIT, we must distribute at least 90% of our REIT taxable income (subject to certain adjustments) to our shareholders. To the extent that we satisfy the distribution requirement, but distribute less than 100% of our taxable income, we will be subject to federal corporate income tax on our undistributed taxable income. In addition, we will be subject to a 4% nondeductible excise tax if the actual amount that we pay out to our shareholders in a calendar year is less than a minimum amount specified under federal tax laws. While we generally intend to make distributions so that no income or excise taxes are due, we may from time to time, consistent with maintaining our REIT qualification, elect to pay taxes in lieu of making current distributions if we decide that strategy is more favorable to our shareholders.
From time to time, we may generate taxable income greater than our net income for financial reporting purposes due to, among other things, amortization of capitalized purchase premiums, or our taxable income may be greater than our cash flow available for distribution to shareholders. If we do not have other funds available in these situations, we could be required to borrow funds, sell a portion of our agency securities at disadvantageous prices or find another alternative source of funds in order to make distributions sufficient to enable us to pay out enough of our taxable income to satisfy the distribution requirement and to avoid corporate income tax and the 4% excise tax in a particular year. These alternatives could increase our costs or reduce our equity.
Because of the distribution requirement, it is unlikely that we will be able to fund all future capital needs, including capital needs in connection with investments, from cash retained from operations. As a result, to fund future capital needs, we likely will have to rely on third-party sources of capital, including both debt and equity financing, which may or may not be available on favorable terms or at all. Our access to third-party sources of capital will depend upon a number of factors, including the market’s perception of our growth potential and our current and potential future earnings and cash distributions and the market price of our stock.
22
Table of Contents
| Item 1B. | Unresolved Staff Comments |
None.
| Item 2. | Properties |
Our executive and administrative office is located at 110 Oakwood Drive, Suite 340, Winston-Salem, NC 27103 and we have one satellite office in Columbia, Maryland. As part of our management agreement, our manager is responsible for providing offices necessary for all operations, and accordingly, all lease responsibilities belong to our manager.
| Item 3. | Legal Proceedings |
We and our manager are not currently subject to any material legal proceedings.
| Item 4. | [Removed and Reserved.] |
PART II
| Item 5. | Market for Registrant’s Common Equity, Related Stockholder Matters and Issuer Purchases of Equity Securities |
Information about our equity compensation plans and other related shareholder matters is incorporated by reference to our definitive Proxy Statement for our 2011 Annual Shareholders’ Meeting.
Market Information
Our common stock has been listed on the NYSE under the symbol “HTS” since April 30, 2008. The following table presents the high and low sales prices for our common stock as reported by the NYSE for the periods indicated.
| High | Low | |||||||
| Quarter ended March 31, 2009 |
27.65 | 21.38 | ||||||
| Quarter ended June 30, 2009 |
28.78 | 22.65 | ||||||
| Quarter ended September 30, 2009 |
33.59 | 26.28 | ||||||
| Quarter ended December 31, 2009 |
31.18 | 26.56 | ||||||
| Quarter ended March 31, 2010 |
28.32 | 23.81 | ||||||
| Quarter ended June 30, 2010 |
30.03 | 11.25 | ||||||
| Quarter ended September 30, 2010 |
30.86 | 26.73 | ||||||
| Quarter ended December 31, 2010 |
31.98 | 28.28 | ||||||
The per-share closing price for our common stock, as reported by the NYSE on February 16, 2011, was $29.03.
Holders of Our Common Stock
As of February 16, 2011, there were approximately 10 record holders of our common stock, including shares held in “street name” by nominees who are record holders, but excluding employees that received stock awards under our 2007 Equity Incentive Plan.
Dividends
We intend to continue to pay quarterly dividends to holders of shares of common stock. Future dividends will be at the discretion of the Board of Directors and will depend on our earnings and financial condition, maintenance of our REIT qualification, restrictions on making distributions under Maryland law and such other factors as our Board of Directors deems relevant. For 2010, the we paid $4.40 per share of common stock in dividends. Of the $4.40, 96.2724% represented ordinary income, and 3.7276% represented long-term capital gain, and 0.0% represented return of capital for tax purposes. For 2009, we paid $4.50 per share of common stock in dividends. Of the $4.50, 100.0% represented ordinary income, and 0.0% represented return of capital, for tax purposes. The following table sets forth, for the periods indicated, the dividends declared per share of common stock.
23
Table of Contents
| Common Dividends Declared Per Share |
||||
| Quarter ended March 31, 2009 |
$ | 1.05 | ||
| Quarter ended June 30, 2009 |
$ | 1.10 | ||
| Quarter ended September 30, 2009 |
$ | 1.15 | ||
| Quarter ended December 31, 2009 |
$ | 1.20 | ||
| Quarter ended March 31, 2010 |
$ | 1.20 | ||
| Quarter ended June 30, 2010 |
$ | 1.10 | ||
| Quarter ended September 30, 2010 |
$ | 1.10 | ||
| Quarter ended December 31, 2010 |
$ | 1.00 | ||
Performance Graph
The following graph provides a comparison of the cumulative total return on our common stock from April 30, 2008 to the NYSE closing price per share on December 31, 2010 with the cumulative total return on the Standard & Poor’s 500 Composite Stock Price Index (the “S&P 500”) and the FTSE National Association of Real Estate Investment Trusts Mortgage REIT Index (the “FTSE NAREIT MREIT Index”). Total return values were calculated assuming a $100 investment on April 30, 2008 with reinvestment of all dividends in (i) the common stock, (ii) the S&P 500 and (iii) the FTSE NAREIT MREIT Index.
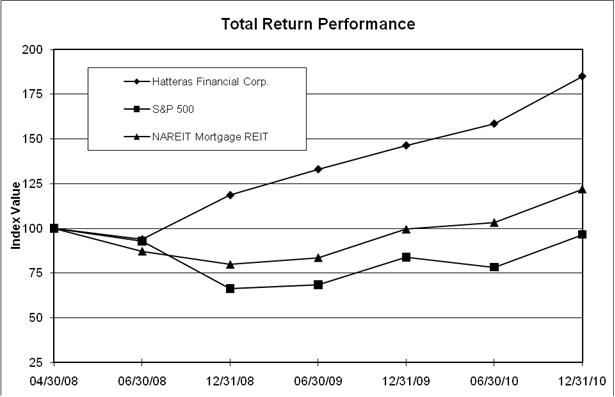
The actual returns shown on the graph above are as follows:
| Index | 04/30/08 | 06/30/08 | 12/31/08 | 06/30/09 | 12/31/09 | 06/30/10 | 12/31/10 | |||||||||||||||||||||
| Hatteras Financial Corp. |
100.00 | 93.81 | 118.56 | 133.02 | 146.33 | 158.47 | 184.95 | |||||||||||||||||||||
| S&P 500 |
100.00 | 92.76 | 66.34 | 68.44 | 83.90 | 78.32 | 96.54 | |||||||||||||||||||||
| NAREIT Mortgage REIT |
100.00 | 87.28 | 79.86 | 83.65 | 99.53 | 103.31 | 122.01 | |||||||||||||||||||||
24
Table of Contents
| Item 6. | Selected Financial Data |
The following table sets forth our selected historical operating and financial data. The selected historical operating and financial data for the years ended December 31, 2010, 2009 and 2008, and the period from September 19, 2007 (Date of Inception) to December 31, 2007 have been derived from our historical financial statements.
The information presented below is only a summary and does not provide all of the information contained in our historical financial statements, including the related notes. You should read the information below in conjunction with “Management’s Discussion and Analysis of Financial Condition and Results of Operations” and our historical financial statements, including the related notes.
| (in thousands, except per share amounts) | Period from | |||||||||||||||
| Year ended | Year ended | Year ended | September 19, 2007 to | |||||||||||||
| December 31, 2010 | December 31, 2009 | December 31, 2008 | December 31, 2007 | |||||||||||||
| Statement of Income Data |
||||||||||||||||
| MBS interest income |
$ | 263,751 | $ | 282,344 | $ | 196,322 | $ | 6,718 | ||||||||
| Other interest income |
1,265 | 771 | 2,050 | 578 | ||||||||||||
| Interest Expense |
(95,923 | ) | (96,267 | ) | (104,481 | ) | (5,332 | ) | ||||||||
| Net Interest Income |
169,093 | 186,848 | 93,891 | 1,964 | ||||||||||||
| Operating Expenses |
(13,144 | ) | (12,448 | ) | (8,714 | ) | (716 | ) | ||||||||
| Gain on sale of mortgage-backed securities |
13,551 | — | — | — | ||||||||||||
| Provision for Claim Receivable |
— | — | (6,048 | ) | — | |||||||||||
| Net Income |
$ | 169,500 | $ | 174,400 | $ | 79,129 | $ | 1,248 | ||||||||
| Earnings per share - common stock, basic |
$ | 4.30 | $ | 4.82 | $ | 3.48 | $ | 0.15 | ||||||||
| Earnings per share - common stock, diluted |
$ | 4.30 | $ | 4.82 | $ | 3.48 | $ | 0.15 | ||||||||
| Weighted average shares outstanding |
39,454,362 | 36,195,840 | 22,758,525 | 8,368,037 | ||||||||||||
| Distributions per common share |
$ | 4.40 | $ | 4.50 | $ | 3.49 | $ | — | ||||||||
| Key Portfolio Statistics |
||||||||||||||||
| Average MBS (1) |
$ | 7,052,063 | $ | 6,088,084 | $ | 3,877,007 | $ | 846,454 | ||||||||
| Average Repurchase Agreements (2) |
$ | 6,488,678 | $ | 5,555,212 | $ | 3,524,028 | $ | 831,636 | ||||||||
| Average Equity (3) |
$ | 1,019,200 | $ | 875,914 | $ | 465,966 | $ | 158,102 | ||||||||
| Average Portfolio Yield (4) |
3.74 | % | 4.64 | % | 5.06 | % | 5.50 | % | ||||||||
| Average Cost of Funds (5) |
1.48 | % | 1.73 | % | 2.96 | % | 4.71 | % | ||||||||
| Interest Rate Spread (6) |
2.26 | % | 2.91 | % | 2.10 | % | 0.79 | % | ||||||||
| Return on Average Equity (7) |
16.63 | % | 19.91 | % | 16.98 | % | 5.00 | % | ||||||||
| Average Annual Portfolio Repayment Rate (8) |
36.27 | % | 19.79 | % | 10.04 | % | 3.50 | % | ||||||||
| Debt to Equity (at period end) (9) |
7.6:1 | 6.8:1 | 6.1:1 | 8.9:1 | ||||||||||||
| Debt to Additional Paid in Capital at period end) (10) |
8.3:1 | 8.2:1 | 5.9:1 | 9.4:1 | ||||||||||||
| Selected Balance Sheet Data |
||||||||||||||||
| Mortgage-backed securities |
$ | 9,587,216 | $ | 6,992,771 | $ | 5,107,074 | $ | 1,619,290 | ||||||||
| Total Assets |
10,006,979 | 7,416,402 | 5,460,326 | 1,646,388 | ||||||||||||
| Repurchase Agreements |
8,681,060 | 6,046,518 | 4,119,435 | 1,375,512 | ||||||||||||
| Long Term Repurchase Agreements |
— | 300,000 | 400,000 | 100,000 | ||||||||||||
| Stockholder’s Equity |
1,145,484 | 931,713 | 736,287 | 165,356 | ||||||||||||
| * | Average numbers for each period are weighted based on days on our books and records. All percentages are annualized. |
| (1) | Our daily average investment in agency mortgage-backed securities (“MBS”) was calculated by dividing the sum of our daily agency MBS investments during the period by the number of days in the period. |
25
Table of Contents
| (2) | Our daily average balance outstanding under our repurchase agreements was calculated by dividing the sum of our daily outstanding balances under our repurchase agreements during the period by the number of days in the period. |
| (3) | Our daily average shareholders’ equity was calculated by dividing the sum of our daily shareholders’ equity during the period by the number of days in the period. |
| (4) | Our average portfolio yield was calculated by dividing our MBS interest income, net of amortization, by our average agency MBS. |
| (5) | Our average cost of funds was calculated by dividing our total interest expense (including hedges) by our average balance outstanding under our repurchase agreements. |
| (6) | Our interest rate spread was calculated by subtracting our average cost of funds from our average portfolio yield. |
| (7) | Our return on average equity was calculated by dividing net income by average equity. |
| (8) | Our average annual principal repayment rate was calculated by dividing our total principal payments received during the year (scheduled and unscheduled) by our average MBS. |
| (9) | Our debt to equity ratio was calculated by dividing the amount outstanding under our repurchase agreements at period end by total shareholders’ equity at period end. |
| (10) | Our debt to additional paid in capital ratio was calculated by dividing the amount outstanding under our repurchase agreements at period end by additional paid in capital at period end. |
26
Table of Contents
| Item 7. | Management’s Discussion and Analysis of Financial Condition and Results of Operations |
The following discussion of our financial condition and results of operations should be read in conjunction with our financial statements and related notes included elsewhere in this report.
Overview
We are an externally-managed mortgage REIT incorporated in Maryland in September 2007 to invest in single-family residential mortgage pass-through securities guaranteed or issued by a U.S. Government agency (such as Ginnie Mae), or by a U.S. Government-sponsored entity (such as Fannie Mae and Freddie Mac). Our principal goal is to generate net income for distribution to our shareholders through regular quarterly dividends and protect and grow our shareholders’ equity (which we also refer to as our “book value”) through prudent interest rate risk management. Our net income is determined primarily by the difference between the interest income we earn on our agency securities net of premium or discount amortization and the cost of our borrowings and hedging activities, which we also refer to as our net interest spread or net interest margin. We utilize substantial borrowings in financing our investment portfolio, which can enhance potential returns but exacerbate losses. In general, our book value is most affected by our issuance of shares of our common stock, our retained earnings or losses, and changes in the value of our investment portfolio and our hedging instruments.
We began operations in November 2007 with a private equity offering and raised additional equity three times in 2008, and then again in September 2010. Accordingly, all of our financial results and data should be viewed with the knowledge that these equity raises were significant for our company, and that some period to period comparisons may not be meaningful or may produce comparisons that may be misleading to future activity and results.
As of December 31, 2010, our mortgage-backed security (“MBS”) portfolio consisted of approximately $10.4 billion in market value, of agency securities with initial fixed-interest rate periods of three years, five years, seven years or 10 years.
The following table represents key data regarding our company since the quarter ending March 31, 2008:
(in thousands except per share amounts)
| As of | Agency Securities (1) | Repurchase Agreements |
Equity | Shares Outstanding |
Book Value Per Share |
Quarterly Weighted Average Earnings Per Share |
||||||||||||||||||
| December 31, 2010 |
$ | 10,418,764 | $ | 8,681,060 | $ | 1,145,484 | 46,116 | $ | 24.84 | $ | 0.99 | |||||||||||||
| September 30, 2010 |
$ | 9,581,916 | $ | 6,678,426 | $ | 1,190,313 | 46,085 | $ | 25.83 | $ | 1.12 | |||||||||||||
| June 30, 2010 |
$ | 7,651,266 | $ | 5,982,998 | $ | 965,619 | 37,388 | $ | 25.83 | $ | 1.01 | |||||||||||||
| March 31, 2010 |
$ | 7,125,065 | $ | 6,102,661 | $ | 929,433 | 36,472 | $ | 25.48 | $ | 1.21 | |||||||||||||
| December 31, 2009 |
$ | 7,038,987 | $ | 6,346,518 | $ | 931,713 | 36,200 | $ | 25.74 | $ | 1.28 | |||||||||||||
| September 30, 2009 |
$ | 7,303,441 | $ | 6,007,909 | $ | 943,597 | 36,200 | $ | 26.07 | $ | 1.26 | |||||||||||||
| June 30, 2009 |
$ | 6,699,512 | $ | 5,496,854 | $ | 865,204 | 36,200 | $ | 23.90 | $ | 1.20 | |||||||||||||
| March 31, 2009 |
$ | 6,329,731 | $ | 5,250,382 | $ | 803,575 | 36,192 | $ | 22.20 | $ | 1.07 | |||||||||||||
| December 31, 2008 |
$ | 5,211,730 | $ | 4,519,435 | $ | 736,287 | 36,186 | $ | 20.35 | $ | 0.73 | |||||||||||||
| September 30, 2008 |
$ | 4,974,648 | $ | 4,569,262 | $ | 527,220 | 26,777 | $ | 19.69 | $ | 1.11 | |||||||||||||
| June 30, 2008 |
$ | 5,097,189 | $ | 4,387,739 | $ | 561,176 | 26,777 | $ | 20.96 | $ | 0.88 | |||||||||||||
| March 31, 2008 |
$ | 3,036,826 | $ | 2,739,631 | $ | 329,400 | 15,268 | $ | 21.57 | $ | 0.71 | |||||||||||||
| (1) | Includes unsettled purchases and forward commitments to purchase agency MBS. |
Factors that Affect our Results of Operations and Financial Condition
Our results of operations and financial condition are affected by various factors, many of which are beyond our control, including, among other things, our net interest income, the market value of our assets and the supply of and demand for such assets. We invest in financial assets and markets, and recent events, such as discussed below, can affect our business in ways that are difficult to predict, and produce results outside of typical operating variances. Our net interest income varies primarily as a result of changes in interest rates, borrowing costs and prepayment
27
Table of Contents
speeds, the behavior of which involves various risks and uncertainties. Prepayment rates, as reflected by the rate of principal paydown, and interest rates vary according to the type of investment, conditions in financial markets, government actions, competition and other factors, none of which can be predicted with any certainty. In general, as prepayment rates on our agency securities purchased at a premium increase, related purchase premium amortization increases, thereby reducing the net yield on such assets. Because changes in interest rates may significantly affect our activities, our operating results depend, in large part, upon our ability to manage interest rate risks and prepayment risks effectively while maintaining our status as a REIT.
We anticipate that, for any period during which changes in the interest rates earned on our assets do not coincide with interest rate changes on our borrowings, such assets will reprice more slowly than the corresponding liabilities. Consequently, changes in interest rates, particularly short-term interest rates, may significantly influence our net interest income. With the maturities of our assets generally of longer term than those of our liabilities, interest rate increases will tend to decrease our net interest income and the market value of our assets (and therefore our book value). Such rate increases could possibly result in operating losses or adversely affect our ability to make distributions to our shareholders.
Prepayments on agency securities and the underlying mortgage loans may be influenced by changes in market interest rates and a variety of economic, geographic and other factors beyond our control; and consequently such prepayment rates cannot be predicted with certainty. To the extent we have acquired agency securities at a premium or discount to par, or face value, changes in prepayment rates may impact our anticipated yield. In periods of declining interest rates, prepayments on our agency securities will likely increase. If we are unable to reinvest the proceeds of such prepayments at comparable yields, our net interest income may suffer. The current climate of government intervention in the mortgage markets significantly increases the risk associated with prepayments.
While we intend to use hedging to mitigate some of our interest rate risk, we do not intend to hedge all of our exposure to changes in interest rates and prepayment rates, as there are practical limitations on our ability to insulate our portfolio from all potential negative consequences associated with changes in short-term interest rates in a manner that will allow us to seek attractive net spreads on our portfolio.
In addition, a variety of other factors relating to our business may also impact our financial condition and operating performance. These factors include:
| • | our degree of leverage; |
| • | our access to funding and borrowing capacity; |
| • | our hedging activities; and |
| • | the REIT requirements, the requirements to qualify for an exemption under the Investment Company Act and other regulatory and accounting policies related to our business. |
Our manager is entitled to receive a management fee that is based on our equity (as defined in our management agreement), regardless of the performance of our portfolio. Accordingly, the payment of our management fee may not decline in the event of a decline in our profitability and may cause us to incur losses.
For a discussion of additional risks relating to our business see “Risk Factors”.
Market and Interest Rate Trends and the Effect on our Portfolio
Credit Market Disruption
During the past few years, the residential housing and mortgage markets in the United States have experienced a variety of difficulties and changed economic conditions including loan defaults, credit losses and decreased liquidity. These conditions have resulted in volatility in the value of RMBS, including agency securities. While these markets recovered a great deal in 2010, further increased volatility and deterioration in the broader residential mortgage and RMBS markets may adversely affect the performance and market value of the agency securities in which we invest. In addition, we rely on the availability of financing to acquire agency securities on a leveraged basis. As values for certain types of agency securities declined many lenders in the agency securities market tightened their lending standards, and in some cases, withdrew financing of residential mortgage assets and agency securities. If volatile market conditions returned, our lenders may be forced to exit the repurchase market, further tighten lending standards, or increase the amount of equity capital (or “haircut”) required to obtain financing, any of which could make it more difficult or costly for us to obtain financing.
28
Table of Contents
Developments at Fannie Mae and Freddie Mac
Payments on the agency securities in which we invest are guaranteed by Fannie Mae and Freddie Mac. Because of the guarantee and the underwriting standards associated with mortgages underlying agency securities, agency securities historically have had high stability in value and been considered to present low credit risk. In 2008, Fannie Mae and Freddie Mac were placed under the conservatorship of the U.S. government due to the significant weakness of their financial condition. The turmoil in the residential mortgage sector and concern over the future role of Fannie Mae and Freddie Mac at the time generally increased credit spreads and decreased price stability of agency securities. In response to the credit market disruption and the deteriorating financial condition of Fannie Mae and Freddie Mac, Congress and the U.S. Treasury undertook a series of actions in 2008 aimed at stabilizing the financial markets in general, and the mortgage market in particular. These actions include the large-scale buying of mortgage-backed securities, significant equity infusions into banks and aggressive monetary policy. In 2010, credit spreads returned to more historic normal levels as market conditions improved.
In February 2010, Fannie Mae and Freddie Mac announced that they would execute wholesale repurchases of loans which they considered seriously delinquent from existing mortgage pools. Freddie Mac implemented its purchase program in February 2010 with actual purchases beginning in March 2010. Fannie Mae began their process in March 2010 and announced it would implement the initial purchases over a period of four months, beginning in April 2010. Further, both agencies announced that on an ongoing basis they would purchase loans from the pools of mortgage loans underlying their mortgage pass-through certificates that became 120 days delinquent. These actions increased prepayments which decreased our income and book value in 2010. We cannot predict whether or when new actions may occur, the timing and pace of current actions already implemented, or what impact if any, such actions, or future actions, could have on our business, results of operations and financial condition.
U.S. Treasury Market Intervention
One of the main factors impacting market prices was the U.S. Federal Reserve’s program to purchase agency securities which had commenced in January 2009 and was terminated on March 31, 2010. In total, $1.25 trillion of agency securities was purchased. While these purchases have ended, the program continues to impact the market supply as the government settles short sales and failed purchases. In addition, through the course of 2009, the U.S. Treasury purchased $250 billion of agency securities. An effect of these purchases has been an increase in the prices of agency securities, which has decreased our net interest margin. When these programs terminated, the market expectation was that it might cause a decrease in demand for these securities which would likely reduce their market price. However, this has not happened and we continue to see strong demand as these securities remain desirable assets in this rather volatile economic environment. It is difficult to quantify the impact, as there are many factors at work at the same time which affects the price of our securities and, therefore, our yield and book value. Due to the unpredictability in the markets for our securities in particular and yield generating assets in general, there is no pattern that can be implied with any certainty. We believe the largest risk is that if the government decides to sell significant portions of its portfolio, then we may see meaningful price declines.
Financial Regulatory Reform Bill and Other Government Activity
Certain programs initiated by the U.S. Government, through the Federal Housing Administration (“FHA”) and the Federal Deposit Insurance Corporation (“FDIC”), to provide homeowners with assistance in avoiding residential mortgage loan foreclosures are currently in effect. The programs may involve, among other things, the modification of mortgage loans to reduce the principal amount of the loans or the rate of interest payable on the loans, or to extend the payment terms of the loans. One such program is the Hope for Homeowners program, which is effective from October 1, 2008 through September 30, 2011 and will enable certain distressed borrowers to refinance their mortgages into FHA-insured loans. In addition, in February 2009, the U.S. Treasury announced the Homeowner Affordability and Stability Plan (“HASP”), which is a multi-faceted plan that also is intended to prevent residential mortgage foreclosures. While the effect of these programs has not been as extensive as originally expected, the effect of such programs for holders of agency securities could be that such holders would experience changes in the anticipated yields of their agency securities due to (i) increased prepayment rates and (ii) lower interest and principal payments.
29
Table of Contents
On July 21, 2010, President Obama signed into law the Dodd-Frank Wall Street Reform and Consumer Protection Act. This legislation aims to restore responsibility and accountability to the financial system. It is unclear how this legislation may impact the borrowing environment, investing environment for agency securities and interest rate swaps as much of the Bill’s implementation has not yet been defined by the regulators.
In November 2010, the U.S. Federal Reserve announced a program to purchase an additional $600 billion of longer-term Treasury securities by the end of the second quarter of 2011, a pace of about $75 billion per month. One of the effects of this program may be to increase the price of agency securities, which may also decrease our net interest margin. Once the program is terminated it may cause a decrease in demand for these securities, which likely would reduce their market price.
In February 2011, the U.S. Department of the Treasury along with the U.S. Department Housing and Urban Development released a report titled “Reforming America’s Housing Finance Market” to congress outlining recommendations for reforming the U.S. housing system, specifically Fannie Mae and Freddie Mac and transforming the government’s involvement in the housing market. It is unclear how future legislation may impact the housing finance market and the investing environment for agency securities as the method of reform is undecided and has not yet been defined by the regulators.
Interest Rates
The overall credit market deterioration since August 2007 has also affected prevailing interest rates. For example, interest rates have been unusually volatile since the third quarter of 2007. Since September 18, 2007, the U.S. Federal Reserve has lowered the target for the Federal Funds Rate nine times from 5.25% to 1.0% in October 2008. In December 2008, the Federal Reserve stated that it was adopting a policy of “quantitative easing” and would target keeping the Federal Funds Rate between 0 and 0.25%. Our funding costs, which traditionally have tracked 30 day LIBOR have generally benefited by this easing of monetary policy, although to a somewhat lesser extent. Because of continued uncertainty in the credit markets and U.S. economic conditions, we expect that interest rates are likely to experience continued volatility, which will likely affect our financial results since our cost of funds is largely dependent on short-term rates. For example, even though 30 day LIBOR was 0.26% at December 31, 2010, our 30 day borrowing costs associated with our repurchase agreements moved up to an average of 0.38% due to market volatility.
Historically, the 30-day LIBOR has closely tracked movements in the Federal Funds Rate. Our borrowings in the repurchase market have also historically closely tracked LIBOR. So traditionally, a lower Federal Funds rate has indicated a time of increased net interest margin and higher asset values. However, since July 2007 (prior to our commencement of operations) LIBOR and repurchase market rates have varied greatly, and often have been significantly higher than the target Federal Funds Rate. The difference between 30-day LIBOR and the Federal Funds rate has also been quite volatile, with the spread alternately returning to more normal levels and then widening out again. Towards the end of the third quarter of 2008 this difference increased to historically high levels. Although this difference had returned to more normal levels by the end of December 2008, the volatility in these rates and divergence from the historical relationship among these rates could negatively impact our ability to manage our portfolio. If this were to occur, our net interest margin and the value of our portfolio might suffer as a result. The following table shows the 30-day LIBOR as compared to the Federal Funds rate at each period end:
| 30-Day LIBOR |
Federal Funds |
|||||||
| December 31, 2010 |
0.26 | % | 0.25 | % | ||||
| September 30, 2010 |
0.26 | % | 0.25 | % | ||||
| June 30, 2010 |
0.35 | % | 0.25 | % | ||||
| March 31, 2010 |
0.25 | % | 0.25 | % | ||||
| December 31, 2009 |
0.23 | % | 0.25 | % | ||||
| September 30, 2009 |
0.25 | % | 0.25 | % | ||||
30
Table of Contents
| June 30, 2009 |
0.31 | % | 0.25 | % | ||||
| March 31, 2009 |
0.50 | % | 0.25 | % | ||||
| December 31, 2008 |
0.44 | % | 0.25 | % | ||||
| September 30, 2008 |
3.93 | % | 2.00 | % | ||||
| June 30, 2008 |
2.46 | % | 2.00 | % | ||||
| March 31, 2008 |
2.70 | % | 2.25 | % | ||||
| December 31, 2007 |
4.60 | % | 4.25 | % |
Principal Repayment Rate
Our net income is primarily a function of the difference between the yield on our assets and the financing cost of owning those assets. Since we tend to purchase assets at a premium to par, the main item that can affect the yield on our assets after they are purchased is the rate at which the mortgage borrowers repay the loan. While the scheduled repayments, which are the principal portion of the homeowners’ regular monthly payments, are fairly predictable, the unscheduled repayments, which are generally refinancing of the mortgage, are less so. Being able to accurately estimate and manage these repayment rates is a critical portion of the management of our portfolio, not only for estimating current yield but also to consider the rate of reinvestment of those proceeds into new securities and the yields which those new securities may add to our portfolio. The following table shows the average principal repayment rate for each quarter since our commencement of operations:
| Quarter ended | Average Quarterly Principal Repayment Rate |
Average Rate Annualized |
||||||
| December 31, 2010 |
7.81 | % | 31.26 | % | ||||
| September 30, 2010 |
8.48 | % | 33.91 | % | ||||
| June 30, 2010 |
11.27 | % | 45.08 | % | ||||
| March 31, 2010 |
9.01 | % | 36.04 | % | ||||
| December 31, 2009 |
5.67 | % | 22.70 | % | ||||
| September 30, 2009 |
5.56 | % | 22.26 | % | ||||
| June 30, 2009 |
5.23 | % | 20.93 | % | ||||
| March 31, 2009 |
3.09 | % | 12.36 | % | ||||
| December 31, 2008 |
1.96 | % | 7.84 | % | ||||
| September 30, 2008 |
2.12 | % | 8.46 | % | ||||
| June 30, 2008 |
3.14 | % | 12.57 | % | ||||
| March 31, 2008 |
3.90 | % | 15.61 | % | ||||
Investing the Proceeds of our Offerings
We began operations following the closing of our initial private offering on November 5, 2007. We raised additional equity capital three times in 2008 and then again in September 2010. The following is a summary of these transactions:
(Dollars in thousands except per share amounts)
| Date of |
Number of Shares of Common Stock Sold |
Offering Price Per Share |
Net Proceeds (1) |
|||||||||
| November 5, 2007 |
8,203,937 | $ | 20.00 | $ | 157,054 | |||||||
| February 5, 2008 |
6,900,000 | $ | 24.00 | $ | 158,743 | |||||||
31
Table of Contents
| April 30, 2008 (IPO) |
11,500,000 | $ | 24.00 | $ | 255,440 | |||||||
| December 15, 2008 |
9,409,090 | $ | 22.00 | $ | 196,463 | |||||||
| September 21, 2010 |
7,475,000 | $ | 28.75 | $ | 205,642 |
| (1) | After deducting underwriting costs and other fees and costs associates with issuance. |
While our operations are affected in many ways by the issuance of additional shares, the most significant immediate earnings impact is that we generally do not invest all of the proceeds immediately. Depending on market conditions, and the fact that normal trade settlement on agency securities is not based on the trade date, we have averaged around two months to invest the proceeds from these offerings. Since each capital raise was individually significant to the size of our portfolio, our results from operations, and some statistics regarding such results, may not be meaningful or portray the underlying fundamentals of our investment portfolio.
Book Value per Share
As of December 31, 2010, our book value per share of common stock (total shareholders’ equity divided by shares of common stock outstanding) was $24.84, a decrease of $0.90, from $25.74 at December 31, 2009. A steepening of the yield curve in the fourth quarter of 2010, which affected our assets more on a per share basis than our interest rate hedges, was responsible for most of this decline, although we also paid out a higher portion of our retained earnings than in previous years. Although we attempt to structure our interest rate swap portfolio to offset the changes in asset prices, they are not perfectly correlated, and depend on the corresponding durations and section of the yield curve that moves to offset each other. Also, there are other factors, such as credit perceptions, which may affect these values so at times they may move in the same direction. The following table shows the components of our book value on a per share basis at each period end:
| As of | Common Equity |
Undistributed Earnings |
Unrealized Gain/(Loss) on MBS |
Unrealized Gain/(Loss) on Interest Rate Swaps |
Book Value Per Share |
|||||||||||||||
| December 31, 2010 |
$ | 22.62 | (0.08 | ) | 3.33 | (1.03 | ) | $ | 24.84 | |||||||||||
| September 30, 2010 |
$ | 22.63 | (0.07 | ) | 5.66 | (2.39 | ) | $ | 25.83 | |||||||||||
| June 30, 2010 |
$ | 21.50 | 0.12 | 6.36 | (2.15 | ) | $ | 25.83 | ||||||||||||
| March 31, 2010 |
$ | 21.32 | 0.24 | 5.25 | (1.33 | ) | $ | 25.48 | ||||||||||||
| December 31, 2009 |
$ | 21.28 | 0.24 | 5.21 | (0.99 | ) | $ | 25.74 | ||||||||||||
| September 30, 2009 |
$ | 21.27 | 0.16 | 5.96 | (1.32 | ) | $ | 26.07 | ||||||||||||
| June 30, 2009 |
$ | 21.26 | 0.05 | 3.69 | (1.10 | ) | $ | 23.90 | ||||||||||||
| March 31, 2009 |
$ | 21.26 | (0.05 | ) | 2.75 | (1.76 | ) | $ | 22.20 | |||||||||||
| December 31, 2008 |
$ | 21.26 | (0.08 | ) | 0.90 | (1.73 | ) | $ | 20.35 | |||||||||||
| September 30, 2008 |
$ | 21.37 | 0.12 | (1.88 | ) | 0.08 | $ | 19.69 | ||||||||||||
| June 30, 2008 |
$ | 21.37 | 0.06 | (0.75 | ) | 0.28 | $ | 20.96 | ||||||||||||
| March 31, 2008 |
$ | 20.72 | 0.44 | 0.55 | (0.14 | ) | $ | 21.57 | ||||||||||||
Investments
Agency Securities
As of December 31, 2010 our agency securities portfolio was purchased at a net premium to par, or face value, with a weighted-average amortized cost of 102.13% of face value, due to the average interest rates on these securities being higher than prevailing market rates. As of December 31, 2010 we had approximately $196.8 million of unamortized premium included in the cost basis of our investments.
As of December 31, 2010 our investment portfolio consisted of agency securities as follows:
32
Table of Contents
| (dollars in thousands) Months to Reset |
% of Portfolio |
Current Face value (1) |
Weighted Avg. Coupon (2) |
Weighted Avg. Amortized Purchase Price (3) |
Amortized Cost (4) | Weighted Avg. Market Price (5) |
Market Value (6) | |||||||||||||||||||||
| 0-18 |
6.6 | % | $ | 605,240 | 3.80 | % | $ | 101.54 | $ | 614,569 | $ | 104.58 | $ | 632,979 | ||||||||||||||
| 19-36 |
17.0 | % | 1,535,856 | 5.15 | % | $ | 101.29 | 1,555,726 | $ | 106.06 | 1,628,967 | |||||||||||||||||
| 37-60 |
54.2 | % | 5,001,576 | 3.78 | % | $ | 102.13 | 5,107,959 | $ | 103.87 | 5,195,156 | |||||||||||||||||
| 61-84 |
20.2 | % | 1,897,287 | 3.46 | % | $ | 102.88 | 1,951,899 | $ | 102.20 | 1,938,935 | |||||||||||||||||
| 85-120 |
2.0 | % | 188,132 | 3.56 | % | $ | 103.52 | 194,751 | $ | 101.62 | 191,180 | |||||||||||||||||
| Total MBS |
100.0 | % | $ | 9,228,092 | 3.94 | % | $ | 102.13 | $ | 9,424,904 | $ | 103.89 | $ | 9,587,216 | ||||||||||||||
| (1) | The current face is the current monthly remaining dollar amount of principal of a mortgage security. We compute current face by multiplying the original face value of the security by the current principal balance factor. The current principal balance factor is essentially a fraction, where the numerator is the current outstanding balance and the denominator is the original principal balance. |
| (2) | For a pass-through certificate, the coupon reflects the weighted average nominal rate of interest paid on the underlying mortgage loans, net of fees paid to the servicer and the agency. The coupon for a pass-through certificate may change as the underlying mortgage loans are prepaid. The percentages indicated in this column are the nominal interest rates that will be effective through the interest rate reset date and have not been adjusted to reflect the purchase price we paid for the face amount of security. |
| (3) | Amortized purchase price is the dollar amount, per $100 of current face, of our purchase price for the security, adjusted for amortization as a result of scheduled and unscheduled principal paydowns. |
| (4) | Amortized cost is our total purchase price for the mortgage security, adjusted for amortization as a result of scheduled and unscheduled principal paydowns. |
| (5) | Market price is the dollar amount of market value, per $100 of nominal, or face, value, of the mortgage security. Under normal conditions, we compute market value by obtaining three valuations for the mortgage security from three separate and independent sources and averaging the three valuations. |
| (6) | Market value is the total market value for the mortgage security. Under normal conditions, we compute market value by obtaining valuations for the mortgage security from three separate and independent sources and averaging the three valuations. |
Our investment portfolio consisted of the following breakdown between Fannie Mae and Freddie Mac at December 31, 2010:
| December 31, 2010 | ||||||||
| (dollars in thousands) | Estimated Fair Value |
% of Total | ||||||
| Agency MBS |
||||||||
| Fannie Mae Certificates |
$ | 6,657,756 | 69.4 | % | ||||
| Freddie Mac Certificates |
2,929,460 | 30.6 | % | |||||
| Total MBS |
$ | 9,587,216 | ||||||
We typically want to own a higher percentage of Fannie Mae MBS than Freddie Mac MBS as Fannie Mae has better cash flow to the security holder as Fannie Mae pays their principal and interest quicker after accrual (45 days) as compared to Freddie Mac (75 days).
As of December 31, 2010, the ARMs underlying our agency securities had fixed interest rates for an average period of approximately 53 months after which time the interest rates reset and become adjustable annually. At December 31, 2010, 99.2% of our agency MBS were still in their initial fixed-rate period, and approximately 4.4% of our agency MBS will reach the end of their initial fixed-rate period in the next 12 months.
After the reset date, interest rates on our agency ARMs float based on spreads over various indices, usually LIBOR or the one-year CMT. These interest rate adjustments are subject to caps that limit the amount the applicable interest rate can increase during any year, known as an annual cap, and through the maturity of the
33
Table of Contents
security, known as a lifetime cap. Our agency ARMs typically have a maximum initial one-time adjustment of 5%, and the average annual interest rate increase (or decrease) to the interest rates on our agency securities is 2% per year. The average lifetime cap on increases (or decreases) to the interest rates on our agency securities is 5% from the initial stated rate.
While most of the Company’s purchases of agency MBS are accounted for using trade date accounting, some forward purchases, such as certain to-be-announced securities (“TBAs”) do not qualify for trade date accounting and are considered derivatives for financial statement purposes. Pursuant to ASC Topic 815, the Company accounts for these derivatives as all-in-one cash flow hedges. The net fair value of the forward commitment is reported on the balance sheet as an asset (or liability), with a corresponding unrealized gain (or loss) recognized in other comprehensive income. Since the Company purchases forward for the purposes of holding the securities for investment, the Company considers all its agency MBS, settled or unsettled, as part of its portfolio for the purposes of cash flow and interest rate sensitivity, and consequently hedging, duration measurement, and other related investment management activity.
Liabilities
We have entered into repurchase agreements to finance most of our agency securities. Our repurchase agreements are secured by our agency securities and bear interest at rates that have historically moved in close relationship to LIBOR. As of December 31, 2010, we had established 26 borrowing relationships with various investment banking firms and other lenders. We had outstanding balances under our repurchase agreements at December 31, 2010, of $8.7 billion.
Hedging Instruments
We generally intend to hedge as much of our interest rate risk as our manager deems prudent in light of market conditions. No assurance can be given that our hedging activities will have the desired beneficial impact on our results of operations or financial condition. Our policies do not contain specific requirements as to the percentages or amount of interest rate risk that our manager is required to hedge.
Interest rate hedging may fail to protect or could adversely affect us because, among other things:
| • | available interest rate hedging may not correspond directly with the interest rate risk for which protection is sought; |
| • | the duration of the hedge may not match the duration of the related liability; |
| • | the party owing money in the hedging transaction may default on its obligation to pay; |
| • | the credit quality of the party owing money on the hedge may be downgraded to such an extent that it impairs our ability to sell or assign our side of the hedging transaction; and |
| • | the value of derivatives used for hedging may be adjusted from time to time in accordance with accounting rules to reflect changes in fair value. Downward adjustments, or “mark-to-market losses,” would reduce our shareholders’ equity. |
As of December 31, 2010, we had entered into interest rate swap agreements designed to lock in funding costs for specific funding activities associated with specific assets, as a way to realize attractive net interest margins. Such hedges incorporate an assumed prepayment schedule, which, if not realized, will cause hedge results to differ from expectations. These swap agreements provide for fixed interest rates indexed off of one-month LIBOR and effectively fix the floating interest rates on $4.4 billion of borrowings under our repurchase agreements.
Results of Operations
We commenced our operations in November 2007 with our first private offering of our common stock. We also issued additional shares three times during 2008, and again in September 2010, each of which significantly increased our equity capital, and thus, the size of our portfolio. Under our investment strategy, it generally takes some time to deploy significant amounts investment capital. Consequently, comparison of some year over year data or quarter over quarter data, especially of gross numbers, may not be meaningful, or useful in predicting future results.
34
Table of Contents
2010 Compared to 2009
Our net income for the year ended December 31, 2010 was $169.5 million, or $4.30 per weighted average share, a decrease of $0.52 per share from earnings from the year ended December 31, 2009 of $174.4 million or $4.82 per weighted average share. There were two main drivers of this trend. The first was high prepayment rates during the year due to falling interest rates and the delinquent loan buybacks by Fannie Mae and Freddie Mac. Higher prepayments contributed in three ways to a lower interest income: 1) higher premium amortization expense; 2) lower average earning assets; 3) lower weighted average coupon as new investments were at lower coupons. The second major factor was that we had an increased share count as a result of our September 2010 common stock offering.
Our net interest income for the year ended December 31, 2010 was $169.1 million, a decrease compared to the year ended December 31, 2009 amount of $186.8 million. As mentioned in the previous paragraph, prepayments contributed significantly to this decline. Also, prepayments, and therefore amortization expense, were high in the second half of the year due to lower mortgage rates and thus a higher rate of refinancing. In 2010, our portfolio had an average yield of 3.74% and a cost of funds (including hedges) of 1.48%. This resulted in a net interest margin (or spread) of 2.26% for the year ended December 31, 2010. For the year ended December 31, 2009, our portfolio had a yield of 4.64% and a cost of funds of 1.73%, generating a net interest rate spread of 2.91%.
While the relative difference between our interest income and interest expense is more important to our performance than the absolute level of rates, the yield on our assets is a significant indicator of performance. Our gross coupon rate in 2010 dropped from 2009 due to lower overall mortgage rates combined with higher prepayment levels. At the end of 2009, we had invested in agency securities with a weighted average coupon of 4.86%. These coupon rates declined throughout 2010 primarily due to continued government intervention in the mortgage markets which meant any purchases were at lower overall interest rates. Spread compression is a normal part of an interest rate cycle, the affects of which become more pronounced the longer that rates are low and stable. Our weighted average coupon at December 31, 2010 was 3.87%.
After coupon rate, the yield on our assets is most directly affected by the rate of repayments on our agency securities. Our rate of portfolio repayment for the year ended December 31, 2010 was 36.27% as compared to 19.79% for the year ended December 31, 2009. Low overall mortgage rates combined with U.S. government intervention in the mortgage market created a significant increase in residential mortgage refinancing, and is a risk to earnings in the future. At December 31, 2010, our portfolio had an average dollar price of $102.13 per $100 of face value. Keeping the price of our portfolio close to par helps predict costs associated with repayment speeds of our assets, as changes in repayments speeds have a lesser affect on income than a higher price portfolio.
Our weighted average cost of funds (not including hedges) for the year ended December 31, 2010 was 0.42%, decreasing from 0.78% year ended December 31, 2009. The main indicator of our borrowing costs is the 30-day LIBOR, which generally closely parallels the rates we pay on our repurchase agreements. This rate (LIBOR) stayed consistently low throughout 2010, ending 2010 at 0.26%. Our cost of funds also fell because we had some longer term repurchase agreements with higher fixed rates that terminated in 2010. In 2010, we incurred expense related to our interest rate hedges of $68.9 million, as compared to $52.8million for the year ended December 31, 2009. We increased our total notional interest rate swap amount from $2.7 billion at December 31, 2009 to $4.4 billion at December 31, 2010. Lower repurchase rates combined with a lower overall rate on our hedges resulted in an average cost of funds for the year ended December 31, 2010 of 1.48%, down from 1.73% for the year ended December 31, 2009. We ended 2010 with a total $4.4 billion of interest rate swap contracts with a weighted average rate of 2.15% and weighted average term of 34 months.
We sold some of our Agency securities in 2010 as part of normal adjustments to our portfolio. Although we typically buy and hold our securities, as conditions change in any year we may choose to dispose of certain securities. For example, we may dispose of a security if it falls outside of our current desired asset mix or we believe it to be at an increased risk of prepayment. In 2010 we disposed of $540 million face value of Agency MBS for a gain of $ 13.6 million. We had no sales in 2009.
Our total operating expenses were largely unchanged for the year ended December 31, 2010 compared to the year ended December 31, 2009. Total operating expenses were $13.1 million which represented 129 basis points on average daily equity for the year ended December 31, 2010. The year ended December 31, 2009 total expenses were $12.4 million which represented 142 basis points on average equity for the year ended December 31, 2019. The main component of our operating expense is our management fee, which is paid according to the management
35
Table of Contents
agreement and is based on total equity excluding unrealized gains and losses. This comprised $9.2 million of the total expenses. The remaining expenses are share based compensation of $1.4 million, which represents the amortization of stock awards to certain officers and directors, and general and administrative expenses of $2.5 million, which includes liability insurance, auditing fees, exchange fees, and other administrative costs.
2009 Compared to 2008
Our net income for the year ended December 31, 2009 was $174.4 million, or $4.82 per weighted average share. This was a significant increase over the amount for the year ended December 31, 2008 of $79.1 million or $3.48 per weighted average share. There were two main drivers of this trend. The first was that, as mentioned earlier, we raised common equity capital three times during 2008. The last of these capital raises was in December 2008. Since our invested assets grew, our total income also increased as we had a much larger portfolio for all of 2009. The major second factor was the continued decline of short term interest rates as our borrowing cost fell throughout 2009.
Our net interest income grew from $93.9 million for the year ended December 31, 2008 to $186.8 million for the year ended December 31, 2009. Similar to the previous paragraph, a larger portfolio combined with lower interest expense were the primary drivers of this increase. In 2009, our portfolio had an average yield of 4.64% and a cost of funds (including hedges) of 1.73%. This resulted in a net interest margin (or spread) of 2.91% for the year ended December 31, 2009. For the year ended December 31, 2008, our portfolio had a yield of 5.06% and a cost of funds of 2.96%, generating a net interest rate spread of 2.10%.
While the relative difference between our interest income and interest expense is more important to our performance than the absolute level of rates, the yield on our assets is a significant indicator of performance. Our gross yield in 2009 dropped from 2008 due to lower overall mortgage rates combined with higher prepayment levels. At the end of 2008, we had invested in agency securities with a weighted average coupon of 5.28%. These coupon rates declined throughout 2009 primarily due to continued government intervention in the mortgage markets. Our weighted average coupon at December 31, 2009 was 4.86%.
After coupon rate, the yield on our assets is most directly affected by the rate of repayments on our agency securities. Our rate of portfolio repayment for the year ended December 31, 2009 was 19.79% as compared to 10.04% for the year ended December 31, 2008. Low overall mortgage rates combined with U.S. government intervention in the mortgage market created a significant increase in residential mortgage refinancing, and is a risk to earnings in the future. At December 31, 2009, our portfolio had an average dollar price of $101.52 per $100 of face value. Keeping the price of our portfolio close to par helps predict costs associated with repayment speeds of our assets, as changes in repayments speeds have a lesser affect on income than a higher price portfolio.
Our weighted average cost of funds (not including hedges) for the year ended December 31, 2009 was 0.78%, decreasing from 2.82% in the preceding year. The main indicator of our borrowing costs is the 30-day LIBOR, which generally closely parallels the rates we pay on our repurchase agreements. This rate (LIBOR) dropped throughout 2008 and 2009, ending 2009 at 0.23%. In 2009, we incurred expense related to our interest rate hedges of $52.8 million, as compared to $5.1million for the preceding year. We increased our total notional interest rate swap amount from $1.7 billion at December 31, 2008 to $2.7 billion at December 31, 2009. Lower repurchase rates combined with a lower overall rate on our hedges resulted in an average cost of funds for the year ended December 31, 2009 of 1.73%, down from 2.96% for the year ended December 31, 2008. We ended 2009 with a total $2.7 billion of interest rate swap contracts with a weighted average rate of 2.68% and weighted average term of 28 months. Additionally, we had fixed the borrowing cost on another $400 million through the use of longer term repurchase agreements, with remaining terms of between 5 and 19 months at December 31, 2009.
Our total operating expenses for the year ended December 31, 2009 were $12.4 million which represented 142 basis points on average daily equity. The previous year’s total expenses were $8.7 million (not including expenses related to Lehman Brothers default discussed in the following paragraph), which represented 181 basis points on average equity. The main component of our operating expense is our management fee, which is paid according to the management agreement and is based on total equity excluding unrealized gains and losses. This comprised $8.7 million of the total expenses. The remaining expenses are share based compensation of $1.3 million, which represents the amortization of stock awards to certain officers and directors, and general and administrative expenses of $2.5 million, which includes liability insurance, auditing fees, exchange fees, and other administrative costs.
36
Table of Contents
We incurred an unusual and non-recurring expense in 2008. In September 2008, Lehman Brothers Inc. (“LBI”) defaulted on the terms of a repurchase agreement we had with them and failed to return securities to us in which we had a net cost basis (cost of the securities plus accrued interest receivable less repurchase funds received and accrued interest payable) of $6.1 million. On September 19, 2008, LBI was placed under conservatorship by the Securities Investor Protection Corporation (“SIPC”). The LBI estate is large and complex, and meaningful information regarding the status of the estate has not yet been released. Currently, management believes it is more likely than not that any recovery would not be material and has reserved the entire amount of the receivable from LBI. If we receive any amounts in the future on our claim, we will record them as gains in the periods of recovery.
Contractual Obligations and Commitments
We had the following contractual obligations under repurchase agreements as of December 31, 2010 and December 31, 2009 (dollar amounts in thousands):
| December 31, 2010 | ||||||||||||||||
| (dollars in thousands) | Balance | Weighted Average Contractual Rate |
Contractual Interest Payments |
Total Contractual Obligation |
||||||||||||
| Within 30 days |
$ | 7,530,317 | 0.38 | % | $ | 1,758 | $ | 7,532,075 | ||||||||
| 30 days to 3 months |
1,050,743 | 0.60 | % | 572 | 1,051,315 | |||||||||||
| 3 months to 36 months |
100,000 | 2.96 | % | 1,660 | 101,660 | |||||||||||
| $ | 8,681,060 | 0.44 | % | $ | 3,990 | $ | 8,685,050 | |||||||||
| December 31, 2009 | ||||||||||||||||
| (dollars in thousands) | Balance | Weighted Average Contractual Rate |
Contractual Interest Payments |
Total Contractual Obligation |
||||||||||||
| Within 30 days |
$ | 5,946,518 | 0.24 | % | $ | 975 | $ | 5,947,493 | ||||||||
| 30 days to 3 months |
— | — | — | — | ||||||||||||
| 3 months to 36 months |
400,000 | 3.01 | % | 12,520 | 412,520 | |||||||||||
| $ | 6,346,518 | 0.41 | % | $ | 13,495 | $ | 6,360,013 | |||||||||
From time to time we may make forward commitments to purchase our Agency MBS. The commitments require physical settlement with the sellers on settlement date, usually between 30 and 90 days from the date of trade. The following table shows the Agency MBS forward purchase commitments shown as a net liability on the balance sheet as of December 31, 2010.
| Face Value | Cost | Fair Market Value |
Due to Brokers |
|||||||||||
| $ | 770,000 | $ | 790,383 | $ | 781,838 | $ | 790,383 | |||||||
We had contractual commitments under interest rate swap agreements as of December 31, 2010. These agreements were for a total notional amount of $4.4 billion, had an average rate of 2.15% and a weighted average term of 34 months.
Liquidity and Capital Resources
Our primary sources of funds are borrowings under repurchase arrangements and monthly principal and interest payments on our investments. Other sources of funds may include proceeds from debt and equity offerings
37
Table of Contents
and asset sales. We generally maintain liquidity to pay down borrowings under repurchase arrangements to reduce borrowing costs and otherwise efficiently manage our long-term investment capital. Because the level of these borrowings can be adjusted on a daily basis, the level of cash and cash equivalents carried on the balance sheet is significantly less important than our potential liquidity available under our borrowing arrangements. We currently believe that we have sufficient liquidity and capital resources available for the acquisition of additional investments, repayments on borrowings and the payment of cash dividends as required for continued qualification as a REIT.
In response to the growth of our agency securities portfolio and to recent turbulent market conditions, we have aggressively pursued additional lending counterparties in order to help increase our financial flexibility and ability to withstand periods of contracting liquidity in the credit markets. At December 31, 2010, we had uncommitted repurchase facilities with 26 lending counterparties to finance this portfolio, subject to certain conditions, and have borrowings outstanding with 20 of these counterparties.
Liquidity Sources—Repurchase Facilities
With repurchase facilities being an integral part of our financing strategy, and thus our financial condition, full understanding of the repurchase market is necessary to understand the risks and drivers of our business. For example, we anticipate that, upon repayment of each borrowing under a repurchase agreement, we will use the collateral immediately for borrowing under a new repurchase agreement. And while we have borrowing capacity under our repurchase facilities well in excess of what is required for our operations, these borrowing lines are uncommitted and generally do not provide long term excess liquidity. Currently, we have not entered into any commitment agreements under which the lender would be required to enter into new repurchase agreements during a specified period of time, nor do we presently plan to have liquidity facilities with commercial banks.
The table below sets forth the average amount of repurchase agreements outstanding during each quarter and the amount of these repurchase agreements outstanding as of the end of each quarter for the last two years. The amounts at a period end can be both above and below the average amounts for the quarter. We do not manage our portfolio to have a pre-designated amount of borrowings at quarter end. These numbers will differ as we implement our portfolio management strategies and risk management strategies over changing market conditions.
| (In thousands) | Average Daily Repurchase Agreements |
Repurchase Agreements at Period End |
Highest Daily Repurchase Balance During Quarter |
Lowest Daily Repurchase Balance During Quarter |
||||||||||||
| December 31, 2010 |
$ | 7,326,776 | $ | 8,681,060 | $ | 8,681,060 | $ | 6,633,989 | ||||||||
| September 30, 2010 |
6,302,601 | 6,678,426 | 6,736,759 | 5,934,419 | ||||||||||||
| June 30, 2010 |
6,092,328 | 5,982,998 | 6,218,628 | 5,956,811 | ||||||||||||
| March 31, 2010 |
6,222,923 | 6,102,661 | 6,346,518 | 6,047,628 | ||||||||||||
| December 31, 2009 |
6,079,893 | 6,346,518 | 6,346,518 | 6,005,602 | ||||||||||||
| September 30, 2009 |
5,781,639 | 6,007,909 | 6,012,302 | 5,496,854 | ||||||||||||
| June 30, 2009 |
5,359,086 | 5,496,854 | 5,567,486 | 5,242,988 | ||||||||||||
| March 31, 2009 |
4,985,718 | 5,250,382 | 5,273,594 | 4,519,435 | ||||||||||||
As of December 31, 2010, the weighted average margin requirement, or the percentage amount by which the collateral value must exceed the loan amount, which we also refer to as the haircut, under all our repurchase agreements, was approximately 4.4% (weighted by borrowing amount). As of December 31, 2009, our weighted average haircut was 4.80%. This rate decreased as lending conditions have stabilized, and if these conditions persist, are likely to drop further in 2011.
We commonly receive margin calls from our lenders. We may receive margin calls daily, although we typically receive them once or twice per month. We receive margin calls under our repurchase agreements for two reasons. One of these is what is known as a “factor call” which occurs each month when the new factors (amount of principal
38
Table of Contents
remaining on the security) are published by the issuing agency, such as Fannie Mae. The second type of margin call we may receive is a valuation margin call. Both factor and valuation margin calls occur whenever the total value of our assets drops beyond a threshold amount, which is usually between $100,000 and $250,000. Both of these margin calls require a dollar for dollar restoration of the margin shortfall. The total amount of our unrestricted cash and cash equivalents, plus any unpledged securities, is available to satisfy margin calls, if necessary. As of December 31, 2010 and 2009, we had approximately $630 million and $558 million, respectively in agency securities, short term investments, cash and cash equivalents available to satisfy future margin calls. To date, we have maintained sufficient liquidity to meet margin calls, and we have never been unable to satisfy a margin call, although no assurance can be given that we will be able to satisfy requests from our lenders to post additional collateral in the future.
An event of default or termination event under the standard master repurchase agreement would give our counterparty the option to terminate all repurchase transactions existing with us and require any amount due by us to the counterparty to be payable immediately. Our agreements for our repurchase facilities generally conform to the terms in the standard master repurchase agreement as published by the Securities Industry and Financial Markets Association (SIFMA) as to repayment, margin requirements and the segregation of all purchased securities covered by the repurchase agreement. In addition, each lender may require that we include supplemental terms and conditions to the standard master repurchase agreement that are generally required by the lender. Some of the typical terms which are included in such supplements and which supplement and amend terms contained in the standard agreement include changes to the margin maintenance requirements, purchase price maintenance requirements, the addition of a requirement that all controversies related to the repurchase agreement be litigated in a particular jurisdiction and cross default provisions. These provisions differ for each of our lenders.
As discussed above under “—Market and Interest Rate Trends and the Effect on our Portfolio,” over the last few years the residential mortgage market in the United States has experienced difficult conditions including:
| • | increased volatility of many financial assets, including agency securities and other high-quality MBS assets, due to news of potential security liquidations; |
| • | increased volatility and deterioration in the broader residential mortgage and MBS markets; and |
| • | significant disruption in financing of MBS. |
Although these conditions have lessened of late, if they increased and persisted, our lenders may be forced to exit the repurchase market, become insolvent or further tighten lending standards or increase the amount of haircut, any of which could make it more difficult or costly for us to obtain financing.
Effects of Margin Requirements, Leverage and Credit Spreads
Our agency securities have values that fluctuate according to market conditions and, as discussed above, the market value of our agency securities will decrease as prevailing interest rates or credit spreads increase. When the value of the securities pledged to secure a repurchase loan decreases to the point where the positive difference between the collateral value and the loan amount is less than the haircut, our lenders may issue a margin call, which means that the lender will require us to pay the margin call in cash or pledge additional collateral to meet that margin call. Under our repurchase facilities, our lenders have full discretion to determine the value of the agency securities we pledge to them. Most of our lenders will value securities based on recent trades in the market. Lenders also issue margin calls as the published current principal balance factors change on the pool of mortgages underlying the securities pledged as collateral when scheduled and unscheduled paydowns are announced monthly.
Similar to the valuation margin calls that we receive on our repurchase agreements, we also receive margin calls on our interest rate swaps when the value of a hedge position declines. This typically occurs when prevailing market rates decrease, with the severity of the decrease also dependent on the term of the hedges involved. The amount of any margin call will be dollar for dollar, with a minimum transfer amount of between $100,000 and $250,000. Our posting of collateral with our hedge counterparties can be done in cash or securities, and is generally
39
Table of Contents
bilateral, which means that if the value of our interest rate hedges increases, our counterparty will post collateral with us.
We experience margin calls in the ordinary course of our business, and under certain conditions, such as during a period of declining market value for agency securities, we experience margin calls at least monthly and often more frequently. In seeking to manage effectively the margin requirements established by our lenders, we maintain a position of cash and unpledged securities. We refer to this position as our liquidity. The level of liquidity we have available to meet margin calls is directly affected by our leverage levels, our haircuts and the price changes on our securities. If interest rates increase as a result of a yield curve shift or for another reason or if credit spreads widen, the prices of our collateral (and our unpledged assets that constitute our liquidity) will decline, we will experience margin calls, and we will use our liquidity to meet the margin calls. There can be no assurance that we will maintain sufficient levels of liquidity to meet any margin calls. If our haircuts increase, our liquidity will proportionately decrease. In addition, if we increase our borrowings, our liquidity will decrease by the amount of additional haircut on the increased level of indebtedness.
We intend to maintain a level of liquidity in relation to our assets that enables us to meet reasonably anticipated margin calls but that also allows us to be substantially invested in agency securities. We may misjudge the appropriate amount of our liquidity by maintaining excessive liquidity, which would lower our investment returns, or by maintaining insufficient liquidity, which would force us to liquidate assets into unfavorable market conditions and harm our results of operations and financial condition.
As of December 31, 2010, the weighted average haircut under our repurchase facilities was approximately 4.4%, and our leverage (defined as our debt-to-shareholders equity ratio) was approximately 7.6:1.
Liquidity Sources—Capital Offerings
In addition to our repurchase borrowings, we also rely on primary securities offerings as a source of both short-term and long-term liquidity. During 2010, we received funds from sales of our common stock under an “at-the-market” offering program and from a fully underwritten offering we completed in September.
On October 9, 2009, we entered into a Sales Agreement (the “Sales Agreement”) with Cantor Fitzgerald & Co. (“Cantor”) to create a controlled equity offering program (the “CEO Program”). Under the terms of our Sales Agreement for our CEO Program, we may offer and sell up to 5,000,000 shares of our common stock from time to time through Cantor acting as agent and/or principal. Sales of the shares of common stock, if any, may be made in private transactions, negotiated transactions or any method permitted by law deemed to be an “at the market” offering as defined in Rule 415 under the Securities Act, including sales made directly on the NYSE or to or through a market maker other than on an exchange. Under the Sales Agreement, Cantor will use its commercially reasonable efforts consistent with its normal sales and trading practices to sell the shares of common stock as directed by us. The compensation payable to for sales of shares of common stock pursuant to the Sales Agreement will be up to 2% of the gross sales price per share for any shares sold under the Sales Agreement.
Pursuant to the CEO Program, during the year ended December 31, 2010, we issued 2,314,600 shares of common stock in at-the-market transactions at an average price of $29.01 per share raising net proceeds, after sales commissions and expenses, of approximately $65.7 million. We paid $1.2 million in sales commissions to Cantor during the year ended December 31, 2010. The shares of common stock issuable pursuant to the CEO Program are registered with the SEC on our Registration Statement on Form S-3 (No. 333-159145), which became effective upon filing on October 9, 2009.
On September 24, 2010, we completed a secondary public common stock offering that resulted in the issuance of 7,475,000 shares of our common stock, including 975,000 shares pursuant to the underwriters’ overallotment option. The sales price to the public for these shares was $28.75, with net proceeds to us, after underwriters’ discount and expenses, of approximately $205.6 million. We used the proceeds of this offering to purchase additional agency securities, provide working capital, and liquidity for our hedging strategy.
On January 10, 2010 we completed a secondary public common stock offering that resulted in the issuance of 11,500,000 share of our common stock, including 1,500,000 shares pursuant to the underwriters’ overallotment option. The sales price to the public was $28.75 per share, and we received net proceeds of $325,732 after the payment of underwriting discounts and expenses. We used the proceeds of this offering to purchase additional agency securities, provide working capital, and liquidity for our hedging strategy.
40
Table of Contents
Forward-Looking Statements Regarding Liquidity
Based on our current portfolio, leverage rate and available borrowing arrangements, we believe that the net proceeds of our common equity offerings, combined with cash flow from operations and available borrowing capacity, will be sufficient to enable us to meet anticipated short-term (one year or less) liquidity requirements such as to fund our investment activities, to pay fees under our management agreement, to fund our distributions to shareholders and for general corporate expenses.
Our ability to meet our long-term (greater than one year) liquidity and capital resource requirements will be subject to obtaining additional debt financing and equity capital. We may increase our capital resources by obtaining long-term credit facilities or making public or private offerings of equity or debt securities, possibly including classes of preferred stock, common stock, and senior or subordinated notes. Such financing will depend on market conditions for capital raises and for the investment of any proceeds. If we are unable to renew, replace or expand our sources of financing on substantially similar terms, it may have an adverse effect on our business and results of operations.
We generally seek to borrow (on a recourse basis) between eight and 12 times the amount of our shareholders’ equity. At December 31, 2010 and December 31, 2009, our total borrowings were approximately $8.7 billion and $6.3 billion (excluding accrued interest), respectively, which represented a leverage ratio of approximately 7.6:1 and 6.8:1, respectively.
Critical Accounting Policies
Our financial statements are prepared in conformity with accounting principles generally accepted in the United States of America. In preparing the financial statements, management is required to make various judgments, estimates and assumptions that affect the reported amounts. Changes in these estimates and assumptions could have a material effect on our financial statements. The following is a summary of our policies most affected by management’s judgments, estimates and assumptions.
Interest Income: Interest income is accrued based on the outstanding principal amount of the investment securities and their contractual terms. Premiums and discounts associated with the purchase of investment securities is amortized or accreted into interest income over the actual lives of the securities using the effective interest method.
Market Valuation of Investment Securities: We invest in agency securities representing interests in or obligations backed by pools of single-family adjustable-rate mortgage loans. ASC Topic on Investments requires us to classify our investments as either trading, available-for-sale or held-to-maturity securities. Management determines the appropriate classifications of the securities at the time they are acquired and evaluates the appropriateness of such classifications at each balance sheet date. We currently classify all of our securities as available-for-sale. All assets that are classified as available-for-sale are carried at fair value and unrealized gains and losses are included in other comprehensive income or loss as a component of shareholders’ equity.
The Agency MBS market is primarily an over-the-counter market. As such, there are no standard, public market quotations or published trading data for individual Agency MBS. The fair values of the Company’s Agency MBS are generally determined by management by obtaining valuations for each agency security from at least three separate and independent sources and averaging the valuations.
Traders at broker-dealers function as market makers for these securities and these brokers have the most complete view of the trading activity. Brokers do not receive compensation for providing pricing information to the Company. The prices received are non-binding offers to trade, but are indicative quotations of the market value of the Company’s securities as of the market close of the last day of each quarter. The brokers receive trading data from several traders that participate in the active markets for these securities and directly observe numerous trades of securities similar to the securities owned by the Company. Given the volume of market activity for Agency MBS, it is the Company’s belief that the broker pricing accurately reflects market information for actual, contemporaneous transactions based on the Company’s review and analysis of the quotes or prices from the independent sources. The Company’s analysis also includes an evaluation of the spread between the quotes or prices. The Company does not adjust quotes or prices it obtains from brokers and pricing services. If the fair value of a security is not available
41
Table of Contents
from a dealer or third-party pricing service or such data appears unreliable, the Company estimates the fair value of the security using a variety of methods including, but not limited to, other independent pricing services, repurchase agreement pricing, discounted cash flow analysis, matrix pricing, option adjusted spread models and other fundamental analysis of observable market factors.
Security purchase and sale transactions are recorded on the trade date. Gains or losses realized from the sale of securities are included in income and are determined using the specific identification method. Firm purchase commitments to acquire “when issued” or to-be-announced (“TBA”) securities are recorded at fair value in accordance with ASC Topic 815, Derivatives and Hedging. The fair value of these purchase commitments is included in other assets or liabilities in the accompanying balance sheets.
Impairment of Assets: We assess our investment securities for other-than-temporary impairment on at least a quarterly basis. When the fair value of an investment is less than its amortized cost at the balance sheet date of the reporting period for which impairment is assessed, the impairment is designated as either “temporary” or “other-than-temporary.” In deciding on whether or not a security is other than temporarily impaired, we use a two step evaluation process. First, we determine whether we have made any decision to sell a security that is in an unrealized loss position, or, if not, is it more likely than not that we will be forced to sell the security prior to recovering its amortized cost basis. If we determine that the answer to either of these questions is “yes” then the security is considered other-than-temporarily impaired. There were no such impairment losses recognized during the periods presented.
Derivative Instruments: We account for derivative instruments in accordance with the guidance included in the ASC Topic on Derivatives and Hedging. This guidance establishes accounting and reporting standards for derivative instruments, including certain derivative instruments embedded in other contracts (collectively referred to as derivatives), and for hedging activities. The guidance requires that every derivative instrument be recorded in the balance sheet as either an asset or liability measured at its fair value, and that changes in the derivative’s fair value be recognized currently in earnings unless specific hedge accounting criteria are met. Special accounting for qualifying hedges allows a derivative’s gains and losses to either offset related results on the hedged item in the statement of income or be accumulated in other comprehensive income, and requires that a company formally document, designate, and assess the effectiveness of transactions that receive hedge accounting. We use derivative instruments to manage our exposure to changing interest rates generally with interest rate swap agreements.
Inflation
Virtually all of our assets and liabilities are interest rate sensitive in nature. As a result, interest rates and other factors influence our performance far more than inflation. Changes in interest rates do not necessarily correlate with inflation rates or changes in inflation rates. Our financial statements are prepared in accordance with GAAP and any distributions we may make will be determined by our board of directors based in part on our REIT taxable income as calculated according to the requirements of the Code; in each case, our activities and balance sheet are measured with reference to fair value without considering inflation.
Off-Balance Sheet Arrangements
As of December 31, 2010 and 2009, we did not maintain any relationships with unconsolidated entities or financial partnerships, such as entities often referred to as structured finance, or special purpose or variable interest entities, established for the purpose of facilitating off-balance sheet arrangements or other contractually narrow or limited purposes. Further, as of December 31, 2010 and 2009, we had not guaranteed any obligations of any unconsolidated entities or entered into any commitment or intent to provide funding to any such entities.
| Item 7A. | Quantitative and Qualitative Disclosures About Market Risk |
We seek to manage our risks related to the credit quality of our assets, interest rates, liquidity, prepayment speeds and market value while, at the same time, seeking to provide an opportunity to shareholders to realize attractive risk-adjusted returns through ownership of our capital stock. While we do not seek to avoid risk completely, we believe the risk can be quantified from historical experience and seek to actively manage that risk, to earn sufficient compensation to justify taking those risks and to maintain capital levels consistent with the risks we undertake.
Interest Rate Risk
42
Table of Contents
Interest rate risk is the primary component of our market risk. Interest rates are highly sensitive to many factors, including fiscal and monetary policies and domestic and international economic and political considerations, as well as other factors beyond our control. We will be subject to interest rate risk in connection with our investments and our related financing obligations.
Interest Rate Effect on Net Interest Income
Our operating results depend in large part on differences between the yields earned on our investments and our cost of borrowing and hedging activities. The cost of our borrowings will generally be based on prevailing market interest rates. During periods of rising interest rates, the borrowing costs associated with agency securities tend to increase while the income earned on agency securities may remain substantially unchanged until the interest rates reset. This results in a narrowing of the net interest spread between the assets and related borrowings and may even result in losses. The severity of any such decline would depend on our asset/liability composition at the time as well as the magnitude and duration of the interest rate increase. Further, an increase in short-term interest rates could also have a negative impact on the market value of our investments. If any of these events happen, we could experience a decrease in net income or incur a net loss during these periods, which could adversely affect our liquidity and results of operations.
We seek to mitigate interest rate risk through utilization of longer term repurchase agreements and hedging instruments, primarily interest rate swap agreements. Interest rate swap agreements are intended to serve as a hedge against future interest rate increases on our variable rate borrowings. As of December 31, 2010, we had entered into interest rate swap agreements designed to mitigate the effects of increases in interest rates under $4.4 billion of our repurchase agreements.
Hedging techniques are partly based on assumed levels of prepayments of our agency securities. If prepayments are slower or faster than assumed, the life of the agency securities will be longer or shorter, which would reduce the effectiveness of any hedging strategies we may use and may cause losses on such transactions. Hedging strategies involving the use of derivative securities are highly complex and may produce volatile returns. Hedging techniques are also limited by the rules relating to REIT qualification. In order to preserve our REIT status, we may be forced to terminate a hedging transaction at a time when the transaction is most needed.
Interest Rate Cap Risk
The ARMs that underlie our agency securities are typically subject to periodic and lifetime interest rate caps and floors, which limit the amount by which the security’s interest rate may change during any given period. However, our borrowing costs pursuant to our financing agreements will not be subject to similar restrictions. Therefore, in a period of increasing interest rates, interest rate costs on our borrowings could increase without limitation, while the interest-rate increases on our adjustable-rate and hybrid agency securities could effectively be limited by caps. Agency securities backed by ARMs may be subject to periodic payment caps that result in some portion of the interest being deferred and added to the principal outstanding. This could result in our receipt of less cash from such investments than we would need to pay the interest cost on our related borrowings. These factors could lower our net interest income or cause a net loss during periods of rising interest rates, which would harm our financial condition, cash flows and results of operations.
Interest Rate Mismatch Risk
We fund a substantial portion of our acquisition of agency securities with borrowings that are based on LIBOR, while the interest rates on these agency securities may be indexed to LIBOR or another index rate, such as the one-year CMT rate. Accordingly, any increase in LIBOR relative to one-year CMT rates may result in an increase in our borrowing costs that is not matched by a corresponding increase in the interest earnings on these investments. Any such interest rate index mismatch could adversely affect our profitability, which may negatively impact distributions to our shareholders. To seek to mitigate interest rate mismatches, we may utilize the hedging strategies discussed above.
Our analysis of risks is based on our manager’s experience, estimates and assumptions, including estimates of fair value and interest rate sensitivity. Actual economic conditions or implementation of investment decisions by our manager may produce results that differ significantly from our manager’s estimates and assumptions.
Prepayment Risk
43
Table of Contents
As we receive repayments of principal on our agency securities from prepayments and scheduled payments, premiums paid on such securities are amortized against interest income and discounts are accreted to interest income. Premiums arise when we acquire agency securities at prices in excess of the principal balance of the mortgage loans underlying such agency securities. Conversely, discounts arise when we acquire agency securities at prices below the principal balance of the mortgage loans underlying such agency securities. To date, substantially all of our agency securities have been purchased at a premium.
For financial accounting purposes, interest income is accrued based on the outstanding principal balance of the investment securities and their contractual terms. In general, purchase premiums on investment securities are amortized against interest income over the lives of the securities using the effective yield method, adjusted for actual prepayment and cash flow activity. An increase in the principal repayment rate will typically accelerate the amortization of purchase premiums and a decrease in the repayment rate will typically slow the accretion of purchase discounts, thereby reducing the yield/interest income earned on such assets.
When we receive repayments of principal on our agency securities from prepayments and scheduled payments, to maintain a similar rate of earnings per share, we may want to reinvest the proceeds from these repayments in similar yielding investments. In addition, due to standard settlement conventions, it may take time to reinvest these proceeds and leave a gap in earnings until we can find and settle on suitable investment assets. In times of market illiquidity or tight supply, we may have periods where similar types of assets are not available to replace those assets repaid to us. A decrease in earnings could be significant in periods of high prepayments.
Extension Risk
We invest in agency securities, currently backed by ARMs, which have interest rates that are fixed for the early years of the loan (typically three, five, or seven years) and thereafter reset periodically on the same basis as agency securities backed by ARMs. We compute the projected weighted-average life of our agency securities backed by ARMs based on assumptions regarding the rate at which the borrowers will prepay the underlying mortgage loans. In general, when agency securities backed by ARMs are acquired with borrowings, we may, but are not required to, enter into an interest rate swap agreement or other hedging instrument that effectively fixes our borrowing costs for a period close to the anticipated weighted-average life of the fixed-rate portion of the related agency securities. This strategy is designed to protect us from rising interest rates by fixing our borrowing costs for the duration of the fixed-rate period of the mortgage loans underlying the related agency securities.
We may structure our interest rate swap agreements to expire in conjunction with the estimated weighted average life of the fixed period of the mortgage loans underlying our agency securities. However, in a rising interest rate environment, the weighted average life of the fixed-rate mortgage loans underlying our agency securities could extend beyond the term of the swap agreement or other hedging instrument. This could have a negative impact on our results from operations, as borrowing costs would no longer be fixed after the term of the hedging instrument while the income earned on the remaining agency securities would remain fixed for a period of time. This situation may also cause the market value of our agency securities to decline, with little or no offsetting gain from the related hedging transactions. In extreme situations, we may be forced to sell assets to maintain adequate liquidity, which could cause us to incur losses.
Interest Rate Risk and Effect on Market Value Risk
Another component of interest rate risk is the effect changes in interest rates will have on the market value of our agency securities. We face the risk that the market value of our agency securities will increase or decrease at different rates than that of our liabilities, including our hedging instruments.
We primarily assess our interest rate risk by estimating the effective duration of our assets and the effective duration of our liabilities and by estimating the time difference between the interest rate adjustment of our assets and the interest rate adjustment of our liabilities. Effective duration essentially measures the market price volatility of financial instruments as interest rates change. We generally estimate effective duration using various financial models and empirical data. Different models and methodologies can produce different effective duration estimates for the same securities.
The sensitivity analysis tables presented below show the estimated impact of an instantaneous parallel shift in the yield curve, up and down 50 and 100 basis points, on the market value of our interest rate-sensitive investments and net interest income, at December 31, 2010 and 2009, assuming a static portfolio. When evaluating the impact of changes in interest rates, prepayment assumptions and principal reinvestment rates are adjusted based on our
44
Table of Contents
manager’s expectations. The analysis presented utilized assumptions, models and estimates of the manager based on the manager’s judgment and experience.
December 31, 2010
| Change in Interest rates |
Percentage Change
in Projected Net Interest Income |
Percentage Change in Projected Portfolio Value |
||||||
| + 1.00% |
(7.25 | %) | (1.50 | %) | ||||
| + 0.50% |
(3.0 | %) | (0.54 | %) | ||||
| - 0.50% |
1.48 | % | 0.26 | % | ||||
| - 1.00% |
(3.68 | %) | 0.38 | % | ||||
December 31, 2009
| Change in Interest rates |
Percentage Change
in Projected Net Interest Income |
Percentage Change in Projected Portfolio Value |
||||||
| + 1.00% |
(6.03 | %) | (1.47 | %) | ||||
| + 0.50% |
(1.8 | %) | (0.50 | %) | ||||
| - 0.50% |
(1.29 | %) | 0.02 | % | ||||
| - 1.00% |
(3.96 | %) | (0.21 | %) | ||||
While the charts above reflect the estimated immediate impact of interest rate increases and decreases on a static portfolio, we rebalance our portfolio from time to time either to seek to take advantage of or reduce the impact of changes in interest rates. It is important to note that the impact of changing interest rates on market value and net interest income can change significantly when interest rates change beyond 100 basis points from current levels. Therefore, the volatility in the market value of our assets could increase significantly when interest rates change beyond amounts shown in the table above. In addition, other factors impact the market value of and net interest income from our interest rate-sensitive investments and hedging instruments, such as the shape of the yield curve, market expectations as to future interest rate changes and other market conditions. Accordingly, interest income would likely differ from that shown above, and such difference might be material and adverse to our shareholders.
The above table quantifies the potential changes in net interest income and portfolio value, which includes the value of swaps, should interest rates immediately change. Given the low level of interest rates at December 31, 2010, we applied a floor of 0%, for all anticipated interest rates included in our assumptions. Due to presence of this floor, it is anticipated that any hypothetical interest rate decrease would have a limited positive impact on our funding costs beyond a certain level; however, because prepayments speeds are unaffected by this floor, it is expected that any increase in our prepayment speeds (occurring as a result of any interest rate decrease or otherwise) could result in an acceleration of our premium amortization and the reinvestment of such prepaid principal in lower yielding assets. As a result, because the presence of this floor limits the positive impact of any interest rate decrease on our funding costs. Therefore, at some point hypothetical interest rate decreases could cause the fair value of our financial instruments and our net interest income to decline.
| Item 8. | Financial Statements and Supplementary Data |
The required response under this Item is submitted in a separate section of this Report. See Index to the Financial Statements on page F-1.
| Item 9. | Changes in and Disagreements with Accountants on Accounting and Financial Disclosure |
None.
45
Table of Contents
| Item 9A. | Controls and Procedures |
Evaluation of Disclosure Controls and Procedures
We maintain disclosure controls and procedures to ensure that material information relating to us is made known to the officers who certify our financial reports and to the members of senior management and the board of directors.
Based on management’s evaluation as of December 31, 2010, our principal executive officer and principal financial officer have concluded that our disclosure controls and procedures (as defined in Rules 13a-15(e) or 15d-15(e) under the Securities Exchange Act of 1934) are effective to ensure that the information required to be disclosed by us in the reports that we file or submit under the Securities Exchange Act of 1934 is recorded, processed, summarized and reported within the time periods specified in SEC rules and forms.
Management’s Report on Internal Control over Financial Reporting
Our management is responsible for establishing and maintaining adequate internal control over financial reporting, as such term is defined in 13a-15(f) and 15d-15(f) of the Securities Exchange Act of 1934, as amended. Under the supervision and with the participation of our management, including our principal executive officer, we conducted an evaluation of the effectiveness of our internal control over financial reporting based on the framework in Internal Control—Integrated Framework issued by the Committee of Sponsoring Organizations of the Treadway Commission. Based on our evaluation under the framework in Internal Control—Integrated Framework, our management concluded that our internal control over financial reporting was effective as of December 31, 2010.
Ernst & Young LLP, a registered independent accounting firm, has audited our financial statements included in this annual report on Form 10-K and, as part of its audit, has issued a report on the effectiveness of our internal control over financial reporting as of December 31, 2010. This report appears on page F-27 of this Annual Report on Form 10-K.
Changes in Internal Control over Financial Reporting
There was no change to our internal control over financial reporting during the fourth quarter ended December 31, 2010 that has materially affected, or is reasonably likely to materially affect, our internal control over financial reporting.
| Item 9B. | Other Information. |
Not applicable.
46
Table of Contents
PART III
| Item 10. | Directors, Executive Officers and Corporate Governance |
The information required by Item 10 is incorporated by reference to our definitive Proxy Statement for our 2011 Annual Shareholders’ meeting.
| Item 11. | Executive Compensation |
The information required by Item 11 is incorporated by reference to our definitive Proxy Statement for our 2011 Annual Shareholders’ meeting.
| Item 12. | Security Ownership of Certain Beneficial Owners and Management and Related Stockholder Matters |
The information required by Item 12 is incorporated by reference to our definitive Proxy Statement for our 2011 Annual Shareholders’ meeting.
| Item 13. | Certain Relationships and Related Transactions, and Director Independence |
The information required by Item 13 is incorporated by reference to our definitive Proxy Statement for our 2011 Annual Shareholders’ meeting.
| Item 14. | Principal Accountant Fees and Services |
The information required by Item 14 is incorporated by reference to our definitive Proxy Statement for our 2011 Annual Shareholders’ meeting.
47
Table of Contents
PART IV
| Item 15. | Exhibits and Financial Statement Schedules |
| 1. | Financial Statements |
Included herein at pages F-1 through F-26.
| 2. | Financial Statement Schedules |
All schedules for which provision is made in Regulation S-X are either not required to be included herein under the related instructions or are inapplicable or the related information is included in the footnotes to the applicable financial statement and, therefore, have been omitted.
| 3. | Exhibits |
The following exhibits are filed as part of this Annual Report on Form 10-K:
| Exhibit Number |
Description of Exhibit | |
| 3.1 | Articles of Incorporation (1) | |
| 3.2 | Bylaws (1) | |
| 4 | Form of Common Stock Certificate (2) | |
| 10.1 | Management Agreement, by and among Hatteras Financial Corp. and Atlantic Capital Advisors LLC, dated as of November 5, 2007 (1) | |
| 10.2 | 2007 Equity Incentive Plan* (1) | |
| 10.3 | 2010 Equity Incentive Plan* (3) | |
| 10.4 | Form of Amended and Restated Restricted Stock Award Agreement for executive officers * (1) | |
| 10.5 | Form of Restricted Stock Award Agreement for independent directors * (1) | |
| 10.7 | Form of Indemnification Agreement * (1) | |
| 12.1 | Statement of computation of ratios of earnings to combined fixed charges and preferred stock dividends | |
| 21 | List of subsidiaries (1) | |
| 23 | Consent of Ernst & Young LLP | |
| 24.1 | Power of Attorney (included on the signature page of this Annual Report on Form 10-K) | |
| 31.1 | Certification of Chief Executive Officer pursuant to Section 302 of the Sarbanes-Oxley Act of 2002 | |
| 31.2 | Certification of Chief Financial Officer pursuant to Section 302 of the Sarbanes-Oxley Act of 2002 | |
| 32.1 | Certification of Chief Executive Officer pursuant to 18 U.S.C. 1350, as created by Section 906 of the Sarbanes-Oxley Act of 2002 | |
| 32.2 | Certification of Chief Financial Officer pursuant to 18 U.S.C. 1350, as created by Section 906 of the Sarbanes-Oxley Act of 2002 |
| * | Represents management contract or compensatory plan or agreement. |
| (1) | Previously filed as an exhibit to the Registrant’s Registration Statement on Form S-11 (No. 333-149314) filed with the SEC on February 20, 2008 and incorporated herein by reference. |
| (2) | Previously filed as an exhibit to Amendment No. 3 to the Registrant’s Registration Statement of Form S-11 (No. 333-149314) filed with the SEC on April 22, 2008 and incorporated herein by reference. |
| (3) | Previously filed as an exhibit to the Registrant’s Current Report of Form 8-K filed with the SEC on May 6, 2010 and incorporated herein by reference. |
48
Table of Contents
SIGNATURES
Pursuant to the requirements of Section 13 or 15(d) of the Securities Exchange Act of 1934, the registrant has duly caused this report to be signed on its behalf by the undersigned, thereunto duly authorized.
| HATTERAS FINANCIAL CORP. | ||||||||
| Dated: February 18, 2011 | By: | /s/ Michael R. Hough | ||||||
| Michael R. Hough | ||||||||
| Chief Executive Officer and Chairman of the Board of Directors | ||||||||
KNOW ALL MEN BY THESE PRESENTS, that we, the undersigned officers and directors of Hatteras Financial Corp., hereby severally constitute Michael R. Hough, Benjamin M. Hough and Kenneth A. Steele, and each of them singly, our true and lawful attorneys with full power to them, and each of them singly, to sign for us and in our names in the capacities indicated below, the Form 10-K filed herewith and any and all amendments to said Form 10-K, and generally to do all such things in our names and in our capacities as officers and directors to enable Hatteras Financial Corp. to comply with the provisions of the Securities Exchange Act of 1934, as amended and all requirements of the Securities and Exchange Commission, hereby ratifying and confirming our signatures as they may be signed by our said attorneys, or any of them, to said Form 10-K and any and all amendments thereto.
Pursuant to the requirements of the Securities Exchange Act of 1934, this report has been signed below by the following persons on behalf of the registrant and in the capacities and dates indicated.
| Date |
Signature |
|||||
| February 18, 2011 | /s/ Michael R. Hough Michael R. Hough |
Chief Executive Officer (Principal Executive Officer) and Chairman of the Board of Directors | ||||
| February 18, 2011 | /s/ Benjamin M. Hough Benjamin M. Hough |
Director | ||||
| February 18, 2011 | /s/ David W. Berson David W. Berson |
Director | ||||
| February 18, 2011 | /s/ Ira G. Kawaller Ira G. Kawaller |
Director | ||||
| February 18, 2011 | /s/ Jeffrey D. Miller Jeffrey D. Miller |
Director | ||||
| February 18, 2011 | /s/ Thomas D. Wren Thomas D. Wren |
Director | ||||
| February 18, 2011 | /s/ Kenneth A. Steele Kenneth A. Steele |
Chief Financial Officer (Principal Financial Officer and Principal Accounting Officer) | ||||
Table of Contents
Report of Independent Registered Public Accounting Firm
The Board of Directors and Shareholders of Hatteras Financial Corp.
We have audited the accompanying balance sheets of Hatteras Financial Corp. as of December 31, 2010 and 2009, and the related statements of income, shareholders’ equity, and cash flows for each of the three years in the period ended December 31, 2010. These financial statements are the responsibility of the Company’s management. Our responsibility is to express an opinion on these financial statements based on our audits.
We conducted our audits in accordance with the standards of the Public Company Accounting Oversight Board (United States). Those standards require that we plan and perform the audit to obtain reasonable assurance about whether the financial statements are free of material misstatement. An audit includes examining, on a test basis, evidence supporting the amounts and disclosures in the financial statements. An audit also includes assessing the accounting principles used and significant estimates made by management, as well as evaluating the overall financial statement presentation. We believe that our audits provide a reasonable basis for our opinion.
In our opinion, the financial statements referred to above present fairly, in all material respects, the financial position of Hatteras Financial Corp. at December 31, 2010 and 2009, and the results of its operations and its cash flows for each of the three years in the period ended December 31, 2010, in conformity with U.S. generally accepted accounting principles.
We also have audited, in accordance with the standards of the Public Company Accounting Oversight Board (United States), Hatteras Financial Corp.’s internal control over financial reporting as of December 31, 2010, based on criteria established in Internal Control-Integrated Framework issued by the Committee of Sponsoring Organizations of the Treadway Commission and our report dated February 18, 2011 expressed an unqualified opinion thereon.
/s/ Ernst & Young LLP
Raleigh, North Carolina
February 18, 2011
F - 1
Table of Contents
Hatteras Financial Corp.
Balance Sheets
| (In thousands, except per share amounts) | December 31, 2010 | December 31, 2009 | ||||||
| Assets |
||||||||
| Mortgage-backed securities, at fair value (including pledged assets of $9,089,295 and $6,660,330 at December 31, 2010 and 2009, respectively) |
$ | 9,587,216 | $ | 6,992,771 | ||||
| Cash and cash equivalents |
112,626 | 225,828 | ||||||
| Restricted cash |
75,422 | 61,361 | ||||||
| Unsettled purchased mortgage-backed securities, at fair value |
49,710 | 46,216 | ||||||
| Accrued interest receivable |
37,973 | 35,560 | ||||||
| Principal payments receivable |
84,151 | 35,917 | ||||||
| Debt security, held to maturity, at cost |
15,000 | 10,000 | ||||||
| Interest rate hedge asset |
23,944 | 7,851 | ||||||
| Other assets |
20,937 | 898 | ||||||
| Total assets |
$ | 10,006,979 | $ | 7,416,402 | ||||
| Liabilities and shareholders’ equity |
||||||||
| Repurchase agreements |
$ | 8,681,060 | $ | 6,346,518 | ||||
| Payable for unsettled securities |
49,774 | 46,453 | ||||||
| Accrued interest payable |
3,177 | 2,969 | ||||||
| Interest rate hedge liability |
71,681 | 43,446 | ||||||
| Dividend payable |
46,116 | 43,440 | ||||||
| Accounts payable and other liabilities |
9,687 | 1,863 | ||||||
| Total liabilities |
8,861,495 | 6,484,689 | ||||||
| Shareholders’ equity: |
||||||||
| Preferred stock, $.001 par value, 10,000,000 shares authorized, none outstanding at December 31, 2010 and 2009 |
— | — | ||||||
| Common stock, $.001 par value, 100,000,000 shares authorized, 46,115,990 and 36,199,911 shares issued and outstanding at December 31, 2010 and 2009, respectively |
46 | 36 | ||||||
| Additional paid-in capital |
1,043,027 | 770,232 | ||||||
| Retained earnings (accumulated deficit) |
(3,480 | ) | 8,722 | |||||
| Accumulated other comprehensive income (loss) |
105,891 | 152,723 | ||||||
| Total shareholders’ equity |
1,145,484 | 931,713 | ||||||
| Total liabilities and shareholders’ equity |
$ | 10,006,979 | $ | 7,416,402 | ||||
See accompanying notes.
F - 2
Table of Contents
Hatteras Financial Corp.
Statements of Income
For the years ended December 31, 2010, 2009 and 2008
| (In thousands, except per share amounts) | 2010 | 2009 | 2008 | |||||||||
| Interest income: |
||||||||||||
| Interest income on mortgage-backed securities |
$ | 263,751 | $ | 282,344 | $ | 196,322 | ||||||
| Interest income on short-term cash investments |
1,265 | 771 | 2,050 | |||||||||
| Interest income |
265,016 | 283,115 | 198,372 | |||||||||
| Interest expense |
95,923 | 96,267 | 104,481 | |||||||||
| Net interest income |
169,093 | 186,848 | 93,891 | |||||||||
| Operating expenses: |
||||||||||||
| Management fee |
9,205 | 8,677 | 6,151 | |||||||||
| Share based compensation |
1,432 | 1,296 | 1,190 | |||||||||
| General and administrative |
2,507 | 2,475 | 1,373 | |||||||||
| Total operating expenses |
13,144 | 12,448 | 8,714 | |||||||||
| Other income/(expense): |
||||||||||||
| Gain on sale of mortgage-backed securities |
13,551 | — | — | |||||||||
| Provision for counterparty default |
— | — | (6,048 | ) | ||||||||
| Other income/(expense) |
13,551 | — | (6,048 | ) | ||||||||
| Net income |
$ | 169,500 | $ | 174,400 | $ | 79,129 | ||||||
| Earnings per share - common stock, basic and diluted |
$ | 4.30 | $ | 4.82 | $ | 3.48 | ||||||
| Weighted average shares outstanding |
39,454,362 | 36,195,840 | 22,758,525 | |||||||||
See accompanying notes.
F - 3
Table of Contents
Hatteras Financial Corp.
Statements of Changes in Shareholders’ Equity
For the years ended December 31, 2010, 2009, and 2008
| (Dollars in thousands) | Common Stock Amount |
Additional Paid-in Capital |
Retained Earnings (Accumulated Deficit) |
Accumulated Other Comprehensive Income (Loss) |
Total | |||||||||||||||
| Balance at December 31, 2007 |
$ | 8 | $ | 157,249 | $ | 1,248 | $ | 6,851 | $ | 165,356 | ||||||||||
| Issuance of common stock |
28 | 610,720 | 610,748 | |||||||||||||||||
| Issuance of restricted stock |
— | — | — | — | — | |||||||||||||||
| Share based compensation expense |
— | 1,190 | — | — | 1,190 | |||||||||||||||
| Dividends declared on common stock |
— | — | (83,164 | ) | — | (83,164 | ) | |||||||||||||
| Comprehensive income: |
||||||||||||||||||||
| Net income |
— | — | 79,129 | — | 79,129 | |||||||||||||||
| Other comprehensive income: |
||||||||||||||||||||
| Net unrealized gain on securities available for sale |
— | — | — | 25,524 | 25,524 | |||||||||||||||
| Net unrealized loss on interest rate hedges |
— | — | — | (62,496 | ) | (62,496 | ) | |||||||||||||
| Comprehensive income |
42,157 | |||||||||||||||||||
| Balance at December 31, 2008 |
$ | 36 | $ | 769,159 | $ | (2,787 | ) | $ | (30,121 | ) | $ | 736,287 | ||||||||
| Issuance of restricted stock |
– | – | – | – | — | |||||||||||||||
| Cost of issuance of common stock |
(223 | ) | (223 | ) | ||||||||||||||||
| Share based compensation expense |
– | 1,296 | – | – | 1,296 | |||||||||||||||
| Dividends declared on common stock |
– | – | (162,891 | ) | – | (162,891 | ) | |||||||||||||
| Comprehensive income: |
||||||||||||||||||||
| Net income |
– | – | 174,400 | – | 174,400 | |||||||||||||||
| Other comprehensive income: |
||||||||||||||||||||
| Net unrealized gain on securities available for sale |
– | – | – | 156,090 | 156,090 | |||||||||||||||
| Net unrealized gain on interest rate hedges |
– | – | – | 26,754 | 26,754 | |||||||||||||||
| Comprehensive income |
357,244 | |||||||||||||||||||
| Balance at December 31, 2009 |
$ | 36 | $ | 770,232 | $ | 8,722 | $ | 152,723 | $ | 931,713 | ||||||||||
| Issuance of restricted stock |
– | – | – | – | — | |||||||||||||||
| Issuance of common stock |
10 | 271,363 | 271,373 | |||||||||||||||||
| Share based compensation expense |
– | 1,432 | – | – | 1,432 | |||||||||||||||
| Dividends declared on common stock |
– | – | (181,702 | ) | – | (181,702 | ) | |||||||||||||
| Comprehensive income: |
||||||||||||||||||||
| Net income |
– | – | 169,500 | – | 169,500 | |||||||||||||||
| Other comprehensive income: |
||||||||||||||||||||
| Net unrealized loss on securities available for sale |
– | – | – | (34,898 | ) | (34,898 | ) | |||||||||||||
| Net unrealized loss on interest rate hedges |
– | – | – | (11,934 | ) | (11,934 | ) | |||||||||||||
| Comprehensive income |
122,668 | |||||||||||||||||||
| Balance at December 31, 20010 |
$ | 46 | $ | 1,043,027 | $ | (3,480 | ) | $ | 105,891 | $ | 1,145,484 | |||||||||
F - 4
Table of Contents
Hatteras Financial Corp.
Statements of Cash Flows
For the years ended December 31, 2010, 2009, and 2008
| (Dollars in thousands) | 2010 | 2009 | 2008 | |||||||||
| Operating activities |
||||||||||||
| Net income |
$ | 169,500 | $ | 174,400 | $ | 79,129 | ||||||
| Adjustments to reconcile net income to net cash provided by (used in) operating activities: |
||||||||||||
| Net amortization of premium related to mortgage-backed securities |
41,778 | 19,363 | 6,429 | |||||||||
| Amortization related to interest rate swap agreements |
226 | 170 | 78 | |||||||||
| Share based compensation expense |
1,432 | 1,296 | 1,190 | |||||||||
| Provision for counterparty default |
— | — | 6,048 | |||||||||
| Hedge ineffectiveness |
210 | (344 | ) | 195 | ||||||||
| Gain on sale of mortgage-backed securities |
(13,551 | ) | — | — | ||||||||
| Changes in operating assets and liabilities: |
||||||||||||
| Increase in accrued interest receivable |
(2,413 | ) | (7,105 | ) | (20,200 | ) | ||||||
| Increase in other assets |
(20,399 | ) | (291 | ) | (755 | ) | ||||||
| Increase (decrease) accrued interest payable |
208 | (5,657 | ) | 3,612 | ||||||||
| (Decrease) increase in accounts payable and other liabilities |
(721 | ) | (47 | ) | 1,589 | |||||||
| Net cash provided by operating activities |
176,270 | 181,785 | 77,315 | |||||||||
| Investing activities |
||||||||||||
| Purchases of mortgage-backed securities |
(5,728,275 | ) | (2,965,826 | ) | (3,973,352 | ) | ||||||
| Purchase of security, held to maturity |
(5,000 | ) | (10,000 | ) | — | |||||||
| Principal repayments of mortgage-backed securities |
2,467,288 | 1,190,153 | 382,355 | |||||||||
| Sale of mortgage-backed securities |
563,688 | — | — | |||||||||
| Net cash used in investing activities |
(2,702,299 | ) | (1,785,673 | ) | (3,590,997 | ) | ||||||
| Financing activities |
||||||||||||
| Issuance of common stock, net of cost of issuance |
271,373 | (223 | ) | 610,748 | ||||||||
| Cash dividends paid |
(179,027 | ) | (146,228 | ) | (56,388 | ) | ||||||
| (Increase) decrease in restricted cash on swap arrangements |
(14,061 | ) | 5,366 | (66,727 | ) | |||||||
| Proceeds from repurchase agreements |
76,875,143 | 63,174,301 | 38,138,209 | |||||||||
| Principal repayments on repurchase agreements |
(74,540,601 | ) | (61,347,217 | ) | (34,986,885 | ) | ||||||
| Net cash provided by financing activities |
2,412,827 | 1,685,999 | 3,638,957 | |||||||||
| Net increase (decrease) in cash and cash equivalents |
(113,202 | ) | 82,111 | 125,275 | ||||||||
| Cash and cash equivalents, beginning of period |
225,828 | 143,717 | 18,442 | |||||||||
| Cash and cash equivalents, end of period |
$ | 112,626 | $ | 225,828 | $ | 143,717 | ||||||
| Supplemental disclosure of cash flow information |
||||||||||||
| Cash paid during the period for interest |
$ | 95,715 | $ | 101,924 | $ | 100,869 | ||||||
| Supplemental schedule of non-cash financing activities |
||||||||||||
| Obligation to brokers for purchase of unsettled mortgage-backed securities |
$ | 840,157 | $ | 46,453 | $ | 104,467 | ||||||
| Mortgage-backed securities held under defaulted repurchase agreement, including accrued interest of $301 |
$ | — | $ | — | $ | 114,671 | ||||||
| Repurchase agreement offset by default of counterparty, including accrued interest payable of $182 |
$ | — | $ | — | $ | 107,582 | ||||||
See accompanying notes.
F - 5
Table of Contents
Hatteras Financial Corp.
Notes to Financial Statements
December 31, 2010
(Dollars in thousands except per share amounts)
1. Organization and Business Description
Hatteras Financial Corp. (the “Company”) was incorporated in Maryland on September 19, 2007, and commenced its planned business activities on November 5, 2007, the date of the initial closing of a private issuance of common stock. The Company was formed to invest in residential mortgage-backed securities (“MBS”), issued or guaranteed by the U.S. Government or U.S. Government sponsored agencies such as the Government National Mortgage Association (“Ginnie Mae”), the Federal National Mortgage Association (“Fannie Mae”) and the Federal Home Loan Mortgage Corporation (“Freddie Mac”) (“Agency MBS”). The Company is externally managed by Atlantic Capital Advisors, LLC (“ACA”).
The Company has elected to be taxed as a real estate investment trust (“REIT”). As a result, the Company does not pay federal income taxes on taxable income distributed to shareholders if certain REIT qualification tests are met. It is the Company’s policy to distribute 100% of its taxable income, after application of available tax attributes, within the time limits prescribed by the Internal Revenue Code of 1986, as amended (the “Code”), which may extend into the subsequent taxable year.
2. Summary of Significant Accounting Policies
Basis of Presentation and Use of Estimates
The accompanying financial statements are prepared on the accrual basis of accounting in accordance with U.S. generally accepted accounting principles (“GAAP”). The preparation of financial statements in conformity with GAAP requires management to make estimates and assumptions that affect the reported amounts of assets and liabilities and disclosure of contingent assets and liabilities at the date of the financial statements and the reported amounts of revenues and expenses during the reporting period. Actual results could differ from those estimates. Significant estimates affecting the accompanying financial statements include the valuation of MBS and derivative instruments.
Since inception, the Company has limited its exposure to credit losses on its portfolio of securities by purchasing MBS guaranteed by Fannie Mae and Freddie Mac. The portfolio is diversified to avoid undue exposure to loan originator, geographic and other types of concentration. The Company manages the risk of prepayments of the underlying mortgages by creating a diversified portfolio with a variety of prepayment characteristics. See Note 4 for additional information on MBS.
F - 6
Table of Contents
Hatteras Financial Corp.
Notes to Financial Statements—(Continued)
December 31, 2010
(Dollars in thousands except per share amounts)
Cash and Cash Equivalents
The Company considers all highly liquid investments with original maturities of three months or less, and which are not restricted as to use, to be cash equivalents. The carrying amounts of cash equivalents approximate their fair value.
Restricted Cash
Restricted cash is cash held in margin accounts at various counterparties to offset interest rate hedging liabilities.
Interest Income
Interest income is earned and recognized based on the outstanding principal amount of the investment securities and their contractual terms. Premiums and discounts associated with the purchase of the investment securities are amortized or accreted into interest income over the actual lives of the securities using the effective interest method.
Financial Instruments
The Company considers its cash and cash equivalents, restricted cash, MBS (settled and unsettled), forward purchase commitments, debt security held to maturity, accrued interest receivable, accounts payable, derivative instruments, repurchase agreements and accrued interest payable to meet the definition of financial instruments. The carrying amount of cash and cash equivalents, restricted cash, accrued interest receivable and accounts payable approximate their fair value due to the short maturities of these instruments. See Note 4 for discussion of the fair value of MBS and forward purchase commitments. See Note 5 for discussion of the fair value of the held to maturity debt security. See Note 7 for discussion of the fair value of derivatives. The carrying amount of the repurchase agreements and accrued interest payable is deemed to approximate fair value since the lines are based upon a variable rate of interest.
Since inception through December 31, 2010, the Company has limited its exposure to credit losses on its portfolio of securities by purchasing MBS guaranteed by Fannie Mae and Freddie Mac. The portfolio is diversified to avoid undue exposure to loan originator, geographic and
F - 7
Table of Contents
Hatteras Financial Corp.
Notes to Financial Statements—(Continued)
December 31, 2010
(Dollars in thousands except per share amounts)
other types of concentration. The Company manages the risk of prepayments of the underlying mortgages by creating a diversified portfolio with a variety of prepayment characteristics. See Note 4 for additional information on MBS.
The Company is engaged in various trading and brokerage activities including derivative interest rate swap agreements in which counterparties primarily include broker-dealers, banks, and other financial institutions. In the event counterparties do not fulfill their obligations, the Company may be exposed to risk of loss. The risk of default depends on the creditworthiness of the counterparty and/or issuer of the instrument. It is the Company’s policy to review, as necessary, the credit standing for each counterparty. See Note 7 for additional information on interest rate swap agreements.
Mortgage-Backed Securities
The Company invests in Agency MBS representing interests in or obligations backed by pools of single-family adjustable-rate mortgage loans. Guidance under the Financial Accounting Standards Board (“FASB”) Accounting Standards Codification (“ASC”) Topic on Investments requires the Company to classify its investments as either trading, available-for-sale or held-to-maturity securities. Management determines the appropriate classifications of the securities at the time they are acquired and evaluates the appropriateness of such classifications at each balance sheet date. The Company currently classifies all of its Agency MBS as available-for-sale. All assets that are classified as available-for-sale are carried at fair value and unrealized gains and losses are included in other comprehensive income or loss as a component of shareholders’ equity. The estimated fair values of MBS are determined by management by obtaining valuations for its MBS from at least three separate and independent sources and averaging these valuations. Security purchase and sale transactions are recorded on the trade date. Gains or losses realized from the sale of securities are included in income and are determined using the specific identification method. Firm purchase commitments to acquire “when issued” or to-be-announced (“TBA”) securities are recorded at fair value in accordance with ASC Topic 815, Derivatives and Hedging. The fair value of these purchase commitments is included in other assets or liabilities in the accompanying balance sheets.
The Company assesses its investment securities for other-than-temporary impairment on at least a quarterly basis. When the fair value of an investment is less than its amortized cost at the balance sheet date of the reporting period for which impairment is assessed, the impairment is designated as either “temporary” or “other-than-temporary.” In deciding on whether or not a security is other than temporarily impaired, the Company uses a two step evaluation process. First, the Company determines whether it has made any decision to sell a security that is in an unrealized loss position, or, if not the Company determines whether it is more likely than not that the Company will be required to sell the security prior to recovering its amortized cost basis. If the answer to either of these questions is “yes” then the security is considered other-than-temporarily impaired. There were no such impairment losses recognized during the periods presented.
F - 8
Table of Contents
Hatteras Financial Corp.
Notes to Financial Statements—(Continued)
December 31, 2010
(Dollars in thousands except per share amounts)
Repurchase Agreements
The Company finances the acquisition of its Agency MBS through the use of repurchase agreements. Under these repurchase agreements, the Company sells securities to a lender and agrees to repurchase the same securities in the future for a price that is higher than the original sales price. The difference between the sale price that the Company receives and the repurchase price that the Company pays represents interest paid to the lender. Although structured as a sale and repurchase obligation, a repurchase agreement operates as a financing under which the Company pledges its securities as collateral to secure a loan which is equal in value to a specified percentage of the estimated fair value of the pledged collateral. The Company retains beneficial ownership of the pledged collateral. At the maturity of a repurchase agreement, the Company is required to repay the loan and concurrently receives back its pledged collateral from the lender or, with the consent of the lender, the Company may renew such agreement at the then prevailing financing rate. These repurchase agreements may require the Company to pledge additional assets to the lender in the event the estimated fair value of the existing pledged collateral declines.
Comprehensive Income
In accordance with the guidance included in ASC Topic on Comprehensive Income, the Company is required to separately report its comprehensive income. Other comprehensive income refers to revenue, expenses, gains, and losses that are recorded directly as an adjustment to shareholders’ equity. Other comprehensive income for the Company generally arises from unrealized gains or losses generated from changes in market values of the securities held as available-for-sale and derivative instruments.
Derivative Instruments
The Company accounts for derivative instruments in accordance with the guidance included in the ASC Topic on Derivatives and Hedging. This guidance establishes accounting and reporting standards for derivative instruments, including certain derivative instruments embedded in other contracts (collectively referred to as derivatives), and for hedging activities. The guidance requires that every derivative instrument be recorded in the balance sheet as either an asset or liability measured at its fair value, and that changes in the derivative’s fair value be recognized currently in earnings unless specific hedge accounting criteria are met. Special accounting for qualifying hedges allows a derivative’s gains and losses to either offset related results on the hedged item in the statement of income or be accumulated in other comprehensive income, and requires that a company formally document, designate, and assess the effectiveness of transactions that receive hedge accounting. The Company uses derivative instruments to manage its exposure to changing interest rates generally with interest rate swap agreements.
Income Taxes
The Company has elected to be taxed as a REIT under the Code. The Company will generally not be subject to Federal income tax to the extent that it distributes 100% of its taxable income,
F - 9
Table of Contents
after application of available tax attributes, within the time limits prescribed by the Code and as long as it satisfies the ongoing REIT requirements including meeting certain asset, income and stock ownership tests.
Share-Based Compensation
Share-based compensation is accounted for under the guidance included in the ASC Topic on Stock Compensation. For share and share-based awards issued to employees, a compensation charge is recorded in earnings based on the fair value of the award. For transactions with non-employees in which services are performed in exchange for the Company’s common stock or other equity instruments, the transactions are recorded on the basis of the fair value of the service received or the fair value of the equity instruments issued, whichever is more readily measurable at the date of issuance. The Company’s share-based compensation transactions resulted in compensation expense of $1,432, $1,296, and $1,190 for the years ended December 31, 2010 and 2009, and 2008, respectively.
Earnings Per Common Share (EPS)
Basic EPS is computed by dividing net income available to holders of common stock by the weighted average number of shares of common stock outstanding during the period. Diluted EPS is computed by dividing net income available to holders of common stock by the weighted average shares of common stock and common equivalent shares outstanding during the period. For the diluted EPS calculation, common equivalent shares outstanding includes the weighted average number of shares of common stock outstanding adjusted for the effect of dilutive unexercised stock options.
Recent Accounting Pronouncements
In January 2010, the FASB issued an Accounting Standards Update (“ASU”) on Improving Disclosures About Fair Value Measurements, which clarifies certain existing disclosure requirements and requires additional disclosures for recurring and nonrecurring fair value measurements. These additional disclosures include amounts and reasons for significant transfers between Level 1 and Level 2 of the fair value hierarchy; significant transfers in and out of Level 3 of the fair value hierarchy; and information about purchases, sales, issuances and settlements on a gross basis in the reconciliation of recurring Level 3 measurements. The requirements of this standard are effective for periods beginning after December 15, 2009, with the exception of the requirement of information about purchases, sales, issuances and settlements of Level 3 measurements, which becomes effective for periods ending after December 15, 2010. The Company adopted the guidance related to these disclosures and the adoption did not have a material effect on the Company’s financial statements.
F - 10
Table of Contents
Hatteras Financial Corp.
Notes to Financial Statements—(Continued)
December 31, 2010
(Dollars in thousands except per share amounts)
3. Financial Instruments
The Company’s valuation techniques for financial instruments are based on observable and unobservable inputs. Observable inputs reflect readily obtainable data from independent sources, while unobservable inputs reflect the Company’s market assumptions. The ASC Topic on Fair Value Measurements classifies these inputs into the following hierarchy:
Level 1 Inputs – Quoted prices for identical instruments in active markets.
Level 2 Inputs – Quoted prices for similar instruments in active markets; quoted prices for identical or similar instruments in markets that are not active; and model-derived valuations whose inputs are observable or whose significant value drivers are observable.
Level 3 Inputs – Instruments with primarily unobservable value drivers.
The fair values of the Company’s Agency MBS and interest rate hedges based on the level of inputs are summarized below:
| December 31, 2010 | December 31, 2009 | |||||||||||||||||||||||||||||||
| Fair Value Measurements Using |
Total at | Fair Value Measurements Using | Total at | |||||||||||||||||||||||||||||
| Level 1 | Level 2 | Level 3 | Fair Value | Level 1 | Level 2 | Level 3 | Fair Value | |||||||||||||||||||||||||
| Assets |
||||||||||||||||||||||||||||||||
| Mortgage backed securities |
$ | — | $ | 9,587,216 | $ | — | $ | 9,587,216 | $ | — | $ | 6,992,771 | $ | — | $ | 6,992,771 | ||||||||||||||||
| Unsettled purchased mortgage backed securities |
— | 49,710 | — | 49,710 | — | 46,216 | — | 46,216 | ||||||||||||||||||||||||
| Interest rate hedges |
— | 23,944 | — | 23,944 | — | 7,851 | — | 7,851 | ||||||||||||||||||||||||
| Total |
$ | — | $ | 9,660,870 | $ | — | $ | 9,660,870 | $ | — | $ | 7,046,838 | $ | — | $ | 7,046,838 | ||||||||||||||||
| Liabilities |
||||||||||||||||||||||||||||||||
| Forward purchase commitments* |
$ | — | $ | 8,545 | $ | — | $ | 8,545 | $ | — | $ | — | $ | — | $ | — | ||||||||||||||||
| Interest rate hedges |
— | 71,681 | — | $ | 71,681 | — | 43,446 | — | $ | 43,446 | ||||||||||||||||||||||
| Total |
$ | — | $ | 80,226 | $ | — | 80,226 | $ | — | $ | 43,446 | $ | — | $ | 43,446 | |||||||||||||||||
*This line item is located in Accounts payable and other liabilities on the balance sheet.
F - 11
Table of Contents
Hatteras Financial Corp.
Notes to Financial Statements—(Continued)
December 31, 2010
(Dollars in thousands except per share amounts)
The carrying values and approximate fair values of all financial instruments as of December 31, 2010 and 2009 were as follows:
| December 31, 2010 | December 31, 2009 | |||||||||||||||
| Carrying | Fair | Carrying | Fair | |||||||||||||
| Value | Value | Value | Value | |||||||||||||
| Assets |
||||||||||||||||
| Mortgage backed securities |
$ | 9,587,216 | $ | 9,587,216 | $ | 6,992,771 | $ | 6,992,771 | ||||||||
| Unsettled purchased mortgage backed securities |
49,710 | 49,710 | 46,216 | 46,216 | ||||||||||||
| Cash and cash equivalents |
112,626 | 112,626 | 225,828 | 225,828 | ||||||||||||
| Restricted cash |
75,422 | 75,422 | 61,361 | 61,361 | ||||||||||||
| Accrued interest receivable |
37,973 | 37,973 | 35,560 | 35,560 | ||||||||||||
| Debt Security |
15,000 | 15,000 | 10,000 | 10,000 | ||||||||||||
| Interest rate hedge asset |
23,944 | 23,944 | 7,851 | 7,851 | ||||||||||||
| Short term investment* |
19,943 | 19,943 | — | — | ||||||||||||
| Liabilities |
||||||||||||||||
| Repurchase agreements |
$ | 8,681,060 | $ | 8,681,060 | $ | 6,346,518 | $ | 6,346,518 | ||||||||
| Payable for unsettled securities |
49,774 | 49,774 | 46,453 | 46,453 | ||||||||||||
| Accrued interest payable |
3,177 | 3,177 | 2,969 | 2,969 | ||||||||||||
| Interest rate hedge liability |
71,681 | 71,681 | 43,446 | 43,446 | ||||||||||||
| Forward purchase commitments |
8,545 | 8,545 | — | — | ||||||||||||
* This line item is included in other assets on the balance sheet.
4. Mortgage-Backed Securities
All of the Company’s Agency MBS were classified as available-for-sale and, as such, are reported at their estimated fair value. The Agency MBS market is primarily an over-the-counter market. As such, there are no standard, public market quotations or published trading data for individual Agency MBS. The fair values of the Company’s Agency MBS are generally determined by management by obtaining valuations for each agency security from at least three separate and independent sources and averaging the valuations.
Traders at broker-dealers function as market makers for these securities and these brokers have the most complete view of the trading activity. Brokers do not receive compensation for providing pricing information to the Company. The prices received are non-binding offers to trade, but are indicative quotations of the market value of the Company’s securities as of the market close of the last day of each quarter. The brokers receive trading data from several traders that participate in the active markets for these securities and directly observe numerous trades of securities similar to the securities owned by the Company. Given the volume of market activity for Agency MBS, it is the Company’s belief that the broker pricing accurately reflects market information for actual, contemporaneous transactions based on the Company’s review and analysis of the quotes or prices from the independent sources. The Company’s analysis also includes an evaluation of the spread between the quotes or prices. The Company does not adjust quotes or prices it obtains from brokers and pricing services.
If the fair value of a security is not available from a dealer or third-party pricing service or such data appears unreliable, the Company estimates the fair value of the security using a variety of methods including, but not limited to, other independent pricing services, repurchase agreement pricing, discounted cash flow analysis, matrix pricing, option adjusted spread models and other fundamental analysis of observable market factors. At December 31, 2010, all of the Company’s Agency MBS values were based on third-party sources.
F - 12
Table of Contents
Hatteras Financial Corp.
Notes to Financial Statements—(Continued)
December 31, 2010
(Dollars in thousands except per share amounts)
To validate the prices the Company obtains, to ensure the Company’s fair value determinations are consistent with the ASC Topic on Fair Value Measurements and Disclosures, and to ensure that the Company properly classifies its assets and liabilities in the fair value hierarchy, the Company evaluates the pricing information it receives taking into account factors such as coupon, prepayment experience, fixed/adjustable rate, coupon index, time to next reset and issuing agency, among other factors.
The Company’s MBS portfolio consists solely of Agency MBS, which are backed by a U.S. Government agency or a U.S. Government sponsored entity. The following table presents certain information about the Company’s MBS at December 31, 2010.
| MBS | Gross | Gross | ||||||||||||||
| Amortized | Unrealized | Unrealized | Estimated | |||||||||||||
| Cost | Loss | Gain | Fair Value | |||||||||||||
| Agency MBS |
||||||||||||||||
| Fannie Mae Certificates |
$ | 6,537,472 | $ | (18,342 | ) | $ | 138,626 | $ | 6,657,756 | |||||||
| Freddie Mac Certificates |
2,887,432 | (14,783 | ) | 56,811 | 2,929,460 | |||||||||||
| Total MBS |
$ | 9,424,904 | $ | (33,125 | ) | $ | 195,437 | $ | 9,587,216 | |||||||
The following table presents certain information about the Company’s MBS at December 31, 2009.
| MBS | Gross | Gross | ||||||||||||||
| Amortized | Unrealized | Unrealized | Estimated | |||||||||||||
| Cost | Loss | Gain | Fair Value | |||||||||||||
| Agency MBS |
||||||||||||||||
| Fannie Mae Certificates |
$ | 4,850,341 | $ | (1,290 | ) | $ | 127,739 | $ | 4,976,790 | |||||||
| Freddie Mac Certificates |
1,953,727 | — | 62,254 | $ | 2,015,981 | |||||||||||
| Total MBS |
$ | 6,804,068 | $ | (1,290 | ) | $ | 189,993 | $ | 6,992,771 | |||||||
The components of the carrying value of available-for-sale Agency MBS at December 31, 2010 and 2009 are presented below.
| December 31, 2010 | December 30, 2009 | |||||||
| Principal balance |
$ | 9,228,093 | $ | 6,702,302 | ||||
| Unamortized premium |
196,823 | 101,789 | ||||||
| Unamortized discount |
(12 | ) | (23 | ) | ||||
| Gross unrealized gains |
195,437 | 189,993 | ||||||
| Gross unrealized losses |
(33,125 | ) | (1,290 | ) | ||||
| Carrying value/estimated fair value |
$ | 9,587,216 | $ | 6,992,771 | ||||
F - 13
Table of Contents
Hatteras Financial Corp.
Notes to Financial Statements—(Continued)
December 31, 2010
(Dollars in thousands except per share amounts)
The Company monitors the performance and market value of its Agency MBS portfolio on an ongoing basis. At December 31, 2010 and 2009, the Company had the following securities in a loss position presented below:
| Less than 12 months | Less than 12 months | |||||||||||||||
| as of December 31, 2010 | as of December 31, 2009 | |||||||||||||||
| Fair Market | Unrealized | Fair Market | Unrealized | |||||||||||||
| Value | Loss | Value | Loss | |||||||||||||
| Fannie Mae Certificates |
$ | 1,641,355 | $ | (18,342 | ) | $ | 313,882 | $ | (1,290 | ) | ||||||
| Freddie Mac Certificates |
1,186,443 | (14,783 | ) | — | — | |||||||||||
| Total temporarily impaired securities |
$ | 2,827,798 | $ | (33,125 | ) | $ | 313,882 | $ | (1,290 | ) | ||||||
The Company did not make the decision to sell the above securities as of December 31, 2010 and 2009, nor was it deemed more likely than not the Company would be required to sell these securities before recovery of their amortized cost basis.
The following table presents components of interest income on the Company’s Agency MBS portfolio for the years ended December 31, 2010, 2009 and 2008:
| Twelve Months Ended | ||||||||||||
| December 31, 2010 |
December 31, 2009 |
December 31, 2008 |
||||||||||
| Coupon interest on MBS |
$ | 305,529 | $ | 301,707 | $ | 202,751 | ||||||
| Net premium amortization |
(41,778 | ) | (19,363 | ) | (6,429 | ) | ||||||
| Interest income on MBS, net |
$ | 263,751 | $ | 282,344 | $ | 196,322 | ||||||
The contractual maturity of the Company’s Agency MBS ranges from 20 to 30 years. Because of prepayments on the underlying mortgage loans, the actual weighted-average maturity is expected to be less than the stated maturity. The following table presents certain information about the Company’s Agency MBS that will reprice or amortize based on contractual terms, which do not consider prepayment assumptions, at December 31, 2010 and 2009.
| December 31, 2010 | December 31, 2009 | |||||||||||||||||||||||
| Fair Value | % of Total | Weighted Average Coupon |
Fair Value | % of Total | Weighted Average Coupon |
|||||||||||||||||||
| Months to Coupon Reset or Contractual Payment |
||||||||||||||||||||||||
| 0 - 18 Months |
$ | 632,979 | 6.6 | % | 3.80 | % | $ | 843,019 | 12.0 | % | 4.78 | % | ||||||||||||
| 19 - 36 Months |
1,628,967 | 17.0 | % | 5.15 | % | 1,050,973 | 15.0 | % | 5.60 | % | ||||||||||||||
| 37 - 60 Months |
5,195,156 | 54.2 | % | 3.78 | % | 3,717,454 | 53.2 | % | 4.63 | % | ||||||||||||||
| 61 - 84 Months |
1,938,935 | 20.2 | % | 3.46 | % | 1,367,106 | 19.6 | % | 5.00 | % | ||||||||||||||
| 85 - 120 Months |
191,180 | 2.0 | % | 3.56 | % | 14,219 | 0.2 | % | 4.38 | % | ||||||||||||||
| Total MBS |
$ | 9,587,216 | 100.0 | % | 3.94 | % | $ | 6,992,771 | 100.0 | % | 4.86 | % | ||||||||||||
Unsettled Agency MBS Purchases
While most of the Company’s purchases of Agency MBS are accounted for using trade date accounting, some forward purchases, such as certain TBA’s do not qualify for trade date accounting and are considered derivatives for financial statement purposes. Pursuant to ASC Topic 815, the Company accounts for these derivatives as all-in-one cash flow hedges. The net fair value of the forward commitment is reported on the balance sheet as an asset (or liability), with a corresponding unrealized gain (or loss) recognized in other comprehensive income. The following table shows the Agency MBS forward purchase commitments shown as a net liability on the balance sheet as of December 31, 2010.
| Face |
Cost |
Fair Market |
Due to |
Net | ||||
| $ 770,000 | $790,383 | $781,838 | $790,383 | $(8,545) | ||||
Since the Company purchases forward for the purposes of holding the securities for investment, the Company considers all its Agency MBS, settled or unsettled, as part of its portfolio for the purposes of cash flow and interest rate sensitivity, and consequently hedging, duration measurement, and other related investment management activity.
F - 14
Table of Contents
Hatteras Financial Corp.
Notes to Financial Statements—(Continued)
December 31, 2010
(Dollars in thousands except per share amounts)
5. Debt Security, Held to Maturity
During 2009, the Company acquired a $10,000 debt security from a repurchase lending counterparty. The note was refinanced in 2010 and at that time the Company acquired an additional $5,000 of the debt security during the refinancing transaction for a total of $15,000 that matures May 10, 2012. The refinanced debt security bears interest at the rate of 4.5% above the three-month LIBOR rate. The Company estimates the fair value of this note to approximate amortized cost based on the prices of other securities with similar maturities, considering the coupon, the lack of marketability and the non-public nature of the issuer.
6. Repurchase Agreements
At December 31, 2010 and 2009, the Company had repurchase agreements in place in the amount of $8,681,060 and $6,346,518, respectively, to finance Agency MBS purchases. As of December 31, 2010 and 2009, the weighted average interest rate on these borrowings was 0.44% and 0.41%, respectively. The Company’s repurchase agreements are collateralized by the Company’s Agency MBS and typically bear interest at rates that are based on LIBOR. At December 31, 2010 and 2009, the Company had repurchase agreements outstanding with 20 and 18 counterparties, respectively, with a weighted average contractual maturity of 0.9 month and 1.6 months, respectively. The following table presents the contractual repricing information regarding the Company’s repurchase agreements:
| December 31, 2010 | ||||||||||||||||
| (dollars in thousands) | Balance | Weighted Average Contractual Rate |
Contractual Interest Payments |
Total
Contractual Obligation |
||||||||||||
| Within 30 days |
$ | 7,530,317 | 0.38 | % | $ | 1,758 | $ | 7,532,075 | ||||||||
| 30 days to 3 months |
1,050,743 | 0.60 | % | 572 | 1,051,315 | |||||||||||
| 3 months to 36 months |
100,000 | 2.96 | % | 1,660 | 101,660 | |||||||||||
| $ | 8,681,060 | 0.44 | % | $ | 3,990 | $ | 8,685,050 | |||||||||
7. Derivatives - Interest Rate Swap Agreements
Risk Management Objective of Using Derivatives
The Company is exposed to certain risk arising from both its business operations and economic conditions. The Company principally manages its exposures to a wide variety of business and operational risks through management of its core business activities. The Company manages economic risks, including interest rate, liquidity, and credit risk primarily by managing the amount, sources, and duration of its debt funding. The Company’s primary source of debt funding is repurchase agreements. Since the interest rate on repurchase agreement changes on a monthly basis, the Company is exposed to constantly changing interest rates, and the cash flows associated with these rates. To minimize the effect of changes in these interest rates, the Company enters into interest rate swap agreements which help to manage the volatility in the interest rate exposures and their related cash flows.
F - 15
Table of Contents
Hatteras Financial Corp.
Notes to Financial Statements—(Continued)
December 31, 2010
(Dollars in thousands except per share amounts)
Cash Flow Hedges of Interest Rate Risk
The Company finances its activities primarily through repurchase agreements, which are generally settled on a short-term basis, usually from one to three months. At each settlement date, the Company refinances each repurchase agreement at the market interest rate at that time. Since the interest rates on its repurchase agreements change on a monthly basis, the Company is constantly exposed to changing interest rates. The Company’s objectives in using interest rate derivatives are to add stability to interest expense and to manage its exposure to interest rate movements. To accomplish this objective, the Company currently uses interest rate swaps as part of its interest rate risk management strategy. Interest rate swaps designated as cash flow hedges involve the receipt of variable-rate amounts from a counterparty in exchange for the Company making fixed-rate payments over the life of the agreements without exchange of the underlying notional amount. The effect of these hedges is to synthetically lock up interest rates on a portion of the Company’s outstanding debt for the terms of the swaps.
For qualifying derivatives under cash flow hedge accounting, effective hedge gains or losses are initially recorded in accumulated other comprehensive income (loss) and subsequently reclassified into earnings in the period that the hedged forecasted transaction affects earnings. For the year ended December 31, 2010 and 2009, these effective hedge losses totaled $80,351 and $26,256, respectively. Ineffective gains or (losses) are recorded on a current basis in earnings and for the year ended December 31, 2010 and 2009, the Company recorded ($210) and $344 of hedge ineffectiveness gain (loss) in earnings, respectively, attributable primarily to differences in the reset dates on the Company’s swaps versus the refinancing dates of its repurchase agreements.
Amounts reported in accumulated other comprehensive income related to derivatives will be reclassified to interest expense as interest is accrued and paid on the Company’s repurchase agreements. During the next 12 months, the Company estimates that an additional $61,506 will be reclassified as an increase to interest expense.
The Company is hedging its exposure to the variability in future cash flows for forecasted transactions over an average period of 34 months.
| Maturity |
Notional Amount |
Remaining Term in Months |
Fixed Interest Rate in Contract |
|||||||||
| 12 months or less |
$ | 900,000 | 5 | 3.36 | % | |||||||
| Over 12 months to 24 months |
400,000 | 22 | 1.75 | % | ||||||||
| Over 24 months to 36 months |
800,000 | 30 | 2.05 | % | ||||||||
| Over 36 months to 48 months |
1,100,000 | 43 | 1.95 | % | ||||||||
| Over 48 months to 60 months |
1,200,000 | 53 | 1.64 | % | ||||||||
| Total |
$ | 4,400,000 | 34 | 2.15 | % | |||||||
F - 16
Table of Contents
Hatteras Financial Corp.
Notes to Financial Statements—(Continued)
December 31, 2010
(Dollars in thousands except per share amounts)
The fair values of interest rate swaps are determined using the market standard methodology of netting the discounted future fixed cash receipts (or payments) and the discounted expected variable cash payments (or receipts). The variable cash payments (or receipts) are based on an expectation of future interest rates (forward curves) derived from observable market interest rate curves. The table below presents the fair value of the Company’s derivative financial instruments, as well as their classification on the balance sheets as of December 31, 2010 and 2009, respectively.
| Asset Derivatives | Liability Derivatives | |||||||||||||||||||||||||||
| As of December 31, 2010 | As of December 31, 2009 | As of December 31, 2010 | As of December 31, 2009 | |||||||||||||||||||||||||
| Balance Sheet |
Fair Value |
Balance Sheet |
Fair Value |
Balance Sheet |
Fair Value |
Balance Sheet |
Fair Value |
|||||||||||||||||||||
| Interest rate |
Interest rate | Interest rate | Interest rate | Interest rate | ||||||||||||||||||||||||
| Interest rate hedge |
hedge asset | $ | 23,944 | hedge asset | $ | 7,851 | hedge liability | $ | 71,681 | hedge liability | $ | 43,446 | ||||||||||||||||
| Other | Account payable | |||||||||||||||||||||||||||
| Forward purchase commitment |
assets | $ | — | — | $ | — | and other liabilities | $ | 8,545 | — | $ | — | ||||||||||||||||
The table below presents the effect of the Company’s derivative financial instruments on the income statement for the year ended December 31, 2010.
| Derivative type for cash flow hedge |
Amount of loss recognized in OCI on derivative (effective portion) |
Location of loss reclassified from accumulated OCI into income (effective portion) |
Amount of loss reclassified from accumulated OCI into income (effective portion) |
Location of loss recognized in income on derivative (ineffective portion) |
Amount of loss recognized in income on derivative (ineffective portion) |
|||||||||||
| Interest Rate |
$ | 80,351 | Interest Expense | $ | 68,418 | Interest Expense | $ | 210 | ||||||||
F - 17
Table of Contents
Hatteras Financial Corp.
Notes to Financial Statements—(Continued)
December 31, 2010
(Dollars in thousands except per share amounts)
The table below presents the effect of the Company’s derivative financial instruments on the income statement for the year ended December 31, 2009.
| Derivative type for cash flow hedge |
Amount of loss recognized in OCI on derivative (effective portion) |
Location of loss reclassified from accumulated OCI into income (effective portion) |
Amount of loss reclassified from accumulated OCI into income (effective portion) |
Location of gain recognized in income on derivative (ineffective portion) |
Amount of gain recognized in income on derivative (ineffective portion) |
|||||||||||||||
| Interest Rate |
$ | 26,256 | Interest Expense | $ | 53,010 | Interest Expense | $ | 344 | ||||||||||||
The following table presents the impact of the Company’s interest rate swap agreements on the Company’s accumulated other comprehensive loss for the years ended December 31, 2010 and 2009, respectively.
| December 31, 2010 | December 31, 2009 | |||||||
| Beginning balance |
$ | (35,742 | ) | $ | (62,496 | ) | ||
| Unrealized loss on interest rate swaps |
(80,351 | ) | (26,256 | ) | ||||
| Reclassification of net losses included in income statement |
68,417 | 53,010 | ||||||
| Ending balance |
$ | (47,676 | ) | $ | (35,742 | ) | ||
Credit-risk-related Contingent Features
The Company has agreements with certain of its derivative counterparties that contain a provision where if the Company defaults on any of its indebtedness, including default where repayment of the indebtedness has not been accelerated by the lender, then the Company could also be declared in default on its derivative obligations.
The Company has agreements with certain of its derivative counterparties that contain a provision where if the Company’s U.S. GAAP shareholders’ equity declines by a specified percentage over a specified time period, or if the Company fails to maintain a minimum shareholders’ equity threshold, then the Company could be declared in default on its derivative obligations. The Company has an agreement with one of its derivative counterparties that contain a provision where if the Company exceeds a leverage ratio of 12 to 1 then the Company could be declared in default on its derivative obligations with that counterparty.
As of December 31, 2010, the fair value of derivatives in a net liability position related to these agreements was $47,737. The Company has collateral posting requirements with each of its counterparties and all interest rate swap agreements were fully collateralized as of December 31, 2010. At December 31, 2010 the Company was in compliance with these requirements.
8. Capital Stock
The total number of shares of capital stock which the Company has the authority to issue is 100,000,000 shares of common stock with a par value of $0.001 per share and 10,000,000 shares of preferred stock with a par value of $0.001 per share. The Board of Directors has the authority to increase the authorized amounts, or to classify any unissued shares by setting or changing in any one or more respects the preferences, conversion or other rights, voting powers, restrictions, limitations as to dividends, qualifications or terms or conditions of redemption of such shares.
F - 18
Table of Contents
Hatteras Financial Corp.
Notes to Financial Statements—(Continued)
December 31, 2010
(Dollars in thousands except per share amounts)
Issuance of Common Stock
In September 2010, the Company completed a secondary public offering of 7,475,000 shares of its common stock, including 975,000 shares pursuant to the underwriters’ overallotment option, at a price to the public of $28.75 per share, and received net proceeds of $205,642 after the payment of underwriting discounts and expenses.
Issuance of Common Stock – CEO Program
On October 9, 2009, the Company entered into a Sales Agreement (the “Sales Agreement”) with Cantor Fitzgerald & Co. (“Cantor”) to create a controlled equity offering program (the “CEO Program”). Under the terms of the Sales Agreement, the Company may offer and sell up to 5,000,000 shares of its common stock from time to time through Cantor, acting as agent and/or principal. Sales of the shares of common stock, if any, may be made in private transactions, negotiated transactions or any method permitted by law deemed to an “at the market” offering as defined in Rule 415 under the Securities Act of 1933, as amended, including sales made directly on the New York Stock Exchange (“NYSE”) or to or though a market maker other than on an exchange. For the year ended December 31, 2010, the Company issued 2,314,600 shares of common stock in at-the-market transactions, raising net proceeds to the Company, after sales commissions, fees and expenses, of $65,731. In addition to sales commissions, the Company incurs legal, accounting and other fees associated with the issuance of shares under this program. The total amount charged to additional paid in capital in connection with the issuance of these shares in 2010 was $1,530. For the year ended December 31, 2009, the Company did not issue any shares of common stock in an at-the-market transaction. The shares of common stock issuable pursuant to the CEO Program are registered with the SEC on the Company’s Registration Statement on Form S-3 (No. 333-159145), which became effective upon filing on October 9, 2009.
9. Earnings per Share
| For the year ended December 30, 2010 |
For the year ended December 30, 2009 |
For the year ended December 30, 2008 |
||||||||||
| Basic earnings per share: |
||||||||||||
| Net income |
$ | 169,500 | $ | 174,400 | $ | 79,129 | ||||||
| Weighted average shares |
39,454.362 | 36,196.840 | 22,758.525 | |||||||||
| Basic earnings per share |
$ | 4.30 | $ | 4.82 | $ | 3.48 | ||||||
| Diluted earnings per share: |
||||||||||||
| Net income |
$ | 169,500 | $ | 174,400 | $ | 79,129 | ||||||
| Weighted average shares |
39,454,362 | 36,196,840 | 22,758,525 | |||||||||
| Potential dilutive shares from exercise of stock options |
— | 19,525 | 7,009 | |||||||||
| Diluted weighted average shares |
39,454.362 | 36,216,365 | 22,765,534 | |||||||||
| Diluted earnings per share |
$ | 4.30 | $ | 4.82 | $ | 3.48 | ||||||
F - 19
Table of Contents
Hatteras Financial Corp.
Notes to Financial Statements—(Continued)
December 31, 2010
(Dollars in thousands except per share amounts)
10. Market and Dividend Information
The New York Stock Exchange trading symbol for Hatteras’ common shares is HTS. The high and low sales prices and dividends declared on the common shares were as follows:
| Year Ended December 31, 2010 | Year Ended December 31, 2009 | |||||||||||||||||||||||
| Sales Price | Dividend | Sales Price | Dividend | |||||||||||||||||||||
| High | Low | Declared | High | Low | Declared | |||||||||||||||||||
| First Quarter |
$ | 28.32 | $ | 23.81 | $ | 1.20 | $ | 27.65 | $ | 21.38 | $ | 1.05 | ||||||||||||
| Second Quarter |
30.03 | 11.25 | 1.10 | 28.78 | 22.65 | 1.10 | ||||||||||||||||||
| Third Quarter |
30.86 | 26.73 | 1.10 | 33.59 | 26.28 | 1.15 | ||||||||||||||||||
| Fourth Quarter |
31.98 | 28.28 | 1.00 | 31.18 | 26.56 | 1.20 | ||||||||||||||||||
11. Equity Incentive Plan
The Company’s equity incentive plans provide for the grant of awards to the Company’s employees, the Company’s manager and its employees, the Company’s independent directors, and other significant service providers. Awards may consist of nonqualified stock options, incentive stock options, restricted and unrestricted shares of stock, stock appreciation rights, phantom stock awards or other stock-based awards, and typically vest over periods of three to five years from grant date. The equity incentive plans are administered by the compensation and governance committee or by any other committee appointed by the Board of Directors or, in the absence of such a committee, by the Board of Directors. At December 31, 2010, 1,123,807 awards relating to shares of common stock remained available for grant. Unless previously terminated by the Board of Directors, awards may be granted under the equity incentive plans until the tenth anniversary of the date that the Company’s shareholders approved such plan.
F - 20
Table of Contents
Hatteras Financial Corp.
Notes to Financial Statements—(Continued)
December 31, 2010
(Dollars in thousands except per share amounts)
Stock Option Awards
Each stock option awarded is exercisable after the period or periods specified in the award agreement, which will generally not exceed ten years from the date of grant. Stock options will be exercisable at such times and subject to such terms as determined by the compensation and governance or other administrative committee. The following table presents information about the Company’s stock options for the period presented:
| Options | Weighted Average Price on Grant Date |
Weighted Average Remaining Life (years) |
Aggregate Intrinsic Value |
|||||||||||||
| Outstanding at beginning of year: |
81,000 | $ | 20.00 | 7.8 | $ | 645 | ||||||||||
| Granted |
— | — | — | — | ||||||||||||
| Cancelled/forfeited |
— | — | — | — | ||||||||||||
| Exercised |
(81,000 | ) | — | — | — | |||||||||||
| Outstanding at December 31, 2010 |
— | $ | — | — | $ | — | ||||||||||
| Shares vested at end of year |
— | $ | — | — | $ | — | ||||||||||
| Options exercisable at December 31, 2010 |
— | $ | — | — | $ | — | ||||||||||
The Company recorded compensation expense of $23, $44, and $44 for each of the years ended December 31, 2010, 2009, and 2008, respectively, for options issued in 2007. The Company records compensation expense related to these options over the vesting period of the options. At December 31, 2010, the Company did not have any stock options outstanding. The remaining 27,000 of the original grant of 81,000 options vested during the year ended December 31, 2010 and 27,000 options vested in the year ended December 31, 2009. The fair value of stock options granted during the period ended December 31, 2007 was $1.63 per option. The following table presents the assumptions used to calculate the fair value of options granted during 2007, using the Black-Scholes-Merton model:
| December 31, 2007 | ||||
| Risk-Free Interest Rate |
4.0 | % | ||
| Expected Volatility |
16.4 | |||
| Dividend Yield |
6.0 | |||
| Expected Life |
|
6.0 years |
| |
Restricted Stock Awards
During the year ended December 31, 2010, the Company issued 99,409 shares of restricted common stock and recognized an expense of $307 related to the vesting of these shares. The shares vest over a three or five year period. The fair market value of the shares granted was
F - 21
Table of Contents
Hatteras Financial Corp.
Notes to Financial Statements—(Continued)
December 31, 2010
(Dollars in thousands except per share amounts)
determined by the closing stock market price on the date of grant. The Company also recognized $1,102 of compensation expense in the current year related to restricted shares issued in prior years. At December 31, 2010, the Company had unrecorded compensation expense of $2,666 related to the unvested shares of restricted common stock granted. This expense is expected to be recognized over a weighted average remaining period of 3.9 years as of December 31, 2010. The following table presents information about the Company’s restricted stock awards for the periods presented:
| 2010 | 2009 | |||||||||||||||
| Shares of Restricted Stock |
Weighted Average Fair Value on Grant Date |
Shares of Restricted Stock |
Weighted Average Fair Value on Grant Date |
|||||||||||||
| Shares non-vested at beginning of year |
74,450 | $ | 21.39 | 118,333 | $ | 20.21 | ||||||||||
| Granted |
99,409 | $ | 28.21 | 13,784 | $ | 25.78 | ||||||||||
| Cancelled/forfeited |
— | — | — | — | ||||||||||||
| Vested |
(62,259 | ) | $ | 20.62 | (57,667 | ) | $ | 20.21 | ||||||||
| Shares non-vested at end of year |
111,600 | $ | 27.89 | 74,450 | $ | 21.39 | ||||||||||
The total fair value of restricted stock awards vested during the year ended December 31, 2010, 2009 and 2008 were $1,848, $1,647 and $1,194, respectively, based upon the fair market value of the Company’s common stock on the vesting date.
12. Transactions with Related Parties
Management Fees
The Company is externally managed by ACA pursuant to a management agreement (the “Management Agreement”). All of the Company’s executive officers are also employees of ACA. ACA manages the Company’s day-to-day operations, subject to the direction and oversight of the Company’s Board of Directors which includes four independent directors. The Management Agreement expires on November 5, 2011 and is thereafter automatically renewed for an additional one-year term unless terminated under certain circumstances. ACA must be provided 180 days prior notice of any such termination and will be paid a termination fee equal to three times the average annual management fee earned by ACA during the two year period immediately preceding termination, calculated as of the end of the most recently completed fiscal quarter prior to the date of termination. Certain terminations involving the internalization of the Company’s management, however, may result in no or a capped termination fee. Under the terms of the Management Agreement, the Company is responsible for all operating expenses of the Company other than those borne by ACA. ACA is generally responsible for costs incident to the performance of its duties, such as compensation of its employees and various overhead expenses.
F - 22
Table of Contents
Hatteras Financial Corp.
Notes to Financial Statements—(Continued)
December 31, 2010
(Dollars in thousands except per share amounts)
ACA is entitled to receive a management fee payable monthly in arrears in an amount equal to 1/12th of an amount determined as follows:
| • | for the Company’s equity up to $250 million, 1.50% (per annum) of equity; plus |
| • | for the Company’s equity in excess of $250 million and up to $500 million, 1.10% (per annum) of equity; plus |
| • | for the Company’s equity in excess of $500 million and up to $750 million, 0.80% (per annum) of equity; plus |
| • | for the Company’s equity in excess of $750 million, 0.50% (per annum) of equity. |
For purposes of calculating the management fee, equity is defined as the value, computed in accordance with GAAP, of shareholders’ equity, adjusted to exclude the effects of unrealized gains or losses. For the years ended December 31, 2010, 2009, and 2008, the Company incurred $9,205, $8,677 and $6,151 in management fees, respectively. In addition, the Company recognized share based compensation expense related to common share options and restricted common shares granted to management of $1,432, $1,296, and $1,190, respectively, for the years ended December 31, 2010, 2009 and 2008, respectively. At December 31, 2010 and 2009, the Company owed ACA $828 and $730, respectively, for the management fee, which is included in accounts payable and other liabilities.
13. Accumulated Other Comprehensive Income
Accumulated other comprehensive income consists of the following components:
| December 31, 2010 | December 31, 2009 | |||||||
| Unrealized gain on agency securities, net |
$ | 162,312 | $ | 188,703 | ||||
| Unrealized loss on unsettled securities |
(64 | ) | (238 | ) | ||||
| Unrealized loss on short term investment* |
(136 | ) | — | |||||
| Unrealized loss on derivative instruments |
(56,221 | ) | (35,742 | ) | ||||
| Accumulated other comprehensive income |
105,891 | 152,723 | ||||||
* This line item is included in other assets on the balance sheet.
The Company records unrealized gains and losses on its Agency MBS and swap positions as described in Notes 4 and 7, respectively.
F - 23
Table of Contents
Hatteras Financial Corp.
Notes to Financial Statements—(Continued)
December 31, 2010
(Dollars in thousands except per share amounts)
Comprehensive income for the years ended December 31, 2010, 2009, and 2008 consists of the following components:
| For the year ended | ||||||||||||
| December 31, 2010 | December 31, 2009 | December 31, 2008 | ||||||||||
| Net Income |
$ | 169,500 | $ | 174,400 | $ | 79,129 | ||||||
| Unrealized gain (loss) on agency securities |
(26,217 | ) | 156,090 | 25,524 | ||||||||
| Unrealized loss on short term investment |
(136 | ) | — | — | ||||||||
| Unrealized gain (loss) on derivative instruments |
(20,479 | ) | 26,754 | (62,496 | ) | |||||||
| Comprehensive income |
$ | 122,668 | $ | 357,244 | $ | 42,157 | ||||||
14. Contingency
On September 18, 2008, one of the Company’s lenders, Lehman Brothers, Inc. (“LBI”), defaulted under the terms of a repurchase agreement with the Company that was scheduled to renew on September 25, 2008. LBI was placed under the conservatorship of the Securities Investor Protection Corporation (“SIPC”) on September 19, 2008. In 2008, the Company recorded a receivable of $6,048, representing the Company’s net cost basis in the assets not returned as per terms of the repurchase agreement, and filed a claim against the estate of LBI. The Company determined that collection of this amount to be less than likely, and recorded a loss $6,048, representing the entire amount of the claim. As of December 31, 2010, the claim against Lehman is still pending.
15. Subsequent Events
On January 3, 2011, the Company issued 50,000 shares of its common stock under its at-the-market program with Cantor Fitzgerald for net proceeds of $1,490. On January 5, 2011, the Company completed a secondary public offering of 11,500,000 shares of its common stock, including 1,500,000 shares pursuant to the underwriters’ overallotment option, at a price to the public of $28.75 per share, and received net proceeds of approximately $325,732 after the payment of underwriting discounts and expenses.
F - 24
Table of Contents
Hatteras Financial Corp.
Notes to Financial Statements—(Continued)
December 31, 2010
(Dollars in thousands except per share amounts)
16. Summarized Quarterly Financial Results
The following is a presentation of the quarterly results of operations for the years ended December 31, 2010 and 2009.
Hatteras Financial Corp.
Statements of Income
| (In thousands, except per share amounts) | Three months Ended December 31, 2010 (Unaudited) |
Three months Ended September 30, 2010 (Unaudited) |
Three months Ended June 30, 2010 (Unaudited) |
Three months Ended March 31, 2010 (Unaudited) |
||||||||||||
| Interest income: |
||||||||||||||||
| Interest income on mortgage-backed securities |
$ | 67,668 | $ | 63,701 | $ | 63,441 | $ | 68,941 | ||||||||
| Interest income on short-term cash investments |
284 | 323 | 298 | 277 | ||||||||||||
| Interest income |
67,952 | 64,024 | 63,739 | 69,218 | ||||||||||||
| Interest expense |
24,740 | 24,066 | 23,677 | 23,440 | ||||||||||||
| Net interest income |
43,212 | 39,958 | 40,062 | 45,778 | ||||||||||||
| Other income: |
||||||||||||||||
| Gain on sale of mortgage-backed securities |
5,783 | 6,723 | – | 1,044 | ||||||||||||
| Operating expenses: |
||||||||||||||||
| Management fee |
2,505 | 2,321 | 2,196 | 2,183 | ||||||||||||
| Share based compensation |
279 | 463 | 347 | 342 | ||||||||||||
| General and administrative |
572 | 665 | 707 | 563 | ||||||||||||
| Total operating expenses |
3,356 | 3,449 | 3,250 | 3,088 | ||||||||||||
| Net income |
$ | 45,639 | $ | 43,232 | $ | 36,812 | $ | 43,734 | ||||||||
| Earnings per share - common stock, basic |
$ | 0.99 | $ | 1.12 | $ | 1.01 | $ | 1.21 | ||||||||
| Earnings per share - common stock, diluted |
$ | 0.99 | $ | 1.11 | $ | 1.01 | $ | 1.21 | ||||||||
| Dividends per share |
$ | 1.00 | $ | 1.10 | $ | 1.10 | $ | 1.20 | ||||||||
| Weighted average shares outstanding |
46,100,493 | 38,765,078 | 36,609,290 | 36,241,823 | ||||||||||||
F - 25
Table of Contents
Hatteras Financial Corp.
Notes to Financial Statements—(Continued)
December 31, 2010
(Dollars in thousands except per share amounts)
Hatteras Financial Corp.
Statements of Income—(Continued)
| (Dollars in thousands, except per share amounts) | Three months Ended December 31, 2009 (Unaudited) |
Three
months Ended September 30, 2009 (Unaudited) |
Three months Ended June 30, 2009 (Unaudited) |
Three months Ended March 31, 2009 (Unaudited) |
||||||||||||
| Interest income: |
||||||||||||||||
| Interest income on mortgage-backed securities |
$ | 72,511 | $ | 72,442 | $ | 69,736 | $ | 67,655 | ||||||||
| Interest income on short-term cash investments |
291 | 230 | 70 | 180 | ||||||||||||
| Interest income |
72,802 | 72,672 | 69,806 | 67,835 | ||||||||||||
| Interest expense |
23,314 | 23,656 | 23,301 | 25,996 | ||||||||||||
| Net interest income |
49,488 | 49,016 | 46,505 | 41,839 | ||||||||||||
| Operating expenses: |
||||||||||||||||
| Management fee |
2,178 | 2,172 | 2,166 | 2,161 | ||||||||||||
| Share based compensation |
332 | 332 | 321 | 311 | ||||||||||||
| General and administrative |
649 | 745 | 522 | 559 | ||||||||||||
| Total operating expenses |
3,159 | 3,249 | 3,009 | 3,031 | ||||||||||||
| Other income/expense: |
||||||||||||||||
| Provision for counterparty default |
— | — | — | — | ||||||||||||
| Total expenses |
3,159 | 3,249 | 3,009 | 3,031 | ||||||||||||
| Net income |
$ | 46,329 | $ | 45,767 | $ | 43,496 | $ | 38,808 | ||||||||
| Earnings per share—common stock, basic |
$ | 1.28 | 1.26 | $ | 1.20 | $ | 1.07 | |||||||||
| Earnings per share—common stock, diluted |
$ | 1.28 | 1.26 | $ | 1.20 | $ | 1.07 | |||||||||
| Dividends per share |
$ | 1.20 | $ | 1.15 | $ | 1.10 | $ | 1.05 | ||||||||
| Weighted average shares outstanding |
36,199,911 | 36,199,911 | 36,193,070 | 36,190,316 | ||||||||||||
F - 26
Table of Contents
Report of Independent Registered Public Accounting Firm
The Board of Directors and Shareholders of Hatteras Financial Corp.
We have audited Hatteras Financial Corp.’s internal control over financial reporting as of December 31, 2010, based on criteria established in Internal Control—Integrated Framework issued by the Committee of Sponsoring Organizations of the Treadway Commission (the COSO criteria). Hatteras Financial Corp.’s management is responsible for maintaining effective internal control over financial reporting, and for its assessment of the effectiveness of internal control over financial reporting included in the accompanying Management’s Report on Internal Control over Financial Reporting. Our responsibility is to express an opinion on the company’s internal control over financial reporting based on our audit.
We conducted our audit in accordance with the standards of the Public Company Accounting Oversight Board (United States). Those standards require that we plan and perform the audit to obtain reasonable assurance about whether effective internal control over financial reporting was maintained in all material respects. Our audit included obtaining an understanding of internal control over financial reporting, assessing the risk that a material weakness exists, testing and evaluating the design and operating effectiveness of internal control based on the assessed risk, and performing such other procedures as we considered necessary in the circumstances. We believe that our audit provides a reasonable basis for our opinion.
A company’s internal control over financial reporting is a process designed to provide reasonable assurance regarding the reliability of financial reporting and the preparation of financial statements for external purposes in accordance with generally accepted accounting principles. A company’s internal control over financial reporting includes those policies and procedures that (1) pertain to the maintenance of records that, in reasonable detail, accurately and fairly reflect the transactions and dispositions of the assets of the company; (2) provide reasonable assurance that transactions are recorded as necessary to permit preparation of financial statements in accordance with generally accepted accounting principles, and that receipts and expenditures of the company are being made only in accordance with authorizations of management and directors of the company; and (3) provide reasonable assurance regarding prevention or timely detection of unauthorized acquisition, use or disposition of the company’s assets that could have a material effect on the financial statements.
Because of its inherent limitations, internal control over financial reporting may not prevent or detect misstatements. Also, projections of any evaluation of effectiveness to future periods are subject to the risk that controls may become inadequate because of changes in conditions, or that the degree of compliance with the policies or procedures may deteriorate.
In our opinion, Hatteras Financial Corp. maintained, in all material respects, effective internal control over financial reporting as of December 31, 2010, based on the COSO criteria.
We also have audited, in accordance with the standards of the Public Company Accounting Oversight Board (United States), the balance sheets of Hatteras Financial Corp. as of December 31, 2010 and 2009, and the related statements of income, shareholders’ equity, and cash flows for each of the three years in the period ended December 31, 2010 of Hatteras Financial Corp. and our report dated February 18, 2011 expressed an unqualified opinion thereon.
/s/ Ernst & Young LLP
Raleigh, North Carolina
February 18, 2011
F - 27