Attached files
| file | filename |
|---|---|
| 8-K - FORM 8-K - WEST PHARMACEUTICAL SERVICES INC | form8k.htm |
| EX-99.1 - PRESS RELEASE - WEST PHARMACEUTICAL SERVICES INC | exh99_1.htm |

1
Speakers:
Donald E. Morel, Jr.
Chairman and Chief Executive Officer
William J. Federici
Vice President and Chief Financial Officer
All trademarks and registered trademarks are the property of West Pharmaceutical Services, Inc., unless noted otherwise.
West Pharmaceutical Services, Inc.
Fourth-Quarter 2010 Analyst Conference Call
9 a.m. Eastern Time, February 17, 2011
A webcast of today’s call can be accessed in the
“Investors” section of the Company’s web site:
www.westpharma.com
“Investors” section of the Company’s web site:
www.westpharma.com
To participate in today’s call, dial:
US toll-free (866) 831-6267
International (617) 213-8857.
The passcode is 14994078.
A replay of the call will be available until
Thursday, February 24, 2011, either through the
website or by dialing:
Thursday, February 24, 2011, either through the
website or by dialing:
US toll-free (888) 286-8010
International (617) 801-6888 .
The passcode 36393850.
These presentation materials are intended to accompany today’s press release announcing the Company’s results
for the quarter and management’s discussion of those results during today’s conference call.
for the quarter and management’s discussion of those results during today’s conference call.

2
Cautionary Statement Under the Private Securities Litigation Reform Act of 1995
This presentation and any accompanying management commentary contain “forward-looking statements” as
that term is defined in the Private Securities Litigation Reform Act of 1995. Such statements include, but are not
limited to statements about expected financial results for 2011 and future years.
that term is defined in the Private Securities Litigation Reform Act of 1995. Such statements include, but are not
limited to statements about expected financial results for 2011 and future years.
Each of these estimates is based on preliminary information, and actual results could differ from these
preliminary estimates. We caution investors that the risk factors listed under “Cautionary Statement” in today’s
press release, as well as those set forth under the caption "Risk Factors" in our most recent Annual Report on
Form 10-K as filed with the Securities and Exchange Commission and as revised or supplemented by our
quarterly reports on Form 10-Q, could cause our actual results to differ materially from those estimated or
predicted in the forward-looking statements. You should evaluate any statement in light of these important
factors. Except as required by law or regulation, we undertake no obligation to publicly update any forward-
looking statements, whether as a result of new information, future events, or otherwise.
Non-GAAP Financial Measures
Certain financial measures included in today’s press release and accompanying tables, in these presentation
materials, and which may be referred to in management’s discussion of the Company’s results and outlook, are
Non-GAAP (Generally Accepted Accounting Principles) financial measures. Please refer to the “Notes to Non-
GAAP Financial Measures” at the end of these materials for more information. Non-GAAP financial measures
should not be considered in isolation or as an alternative to such measures determined in accordance with
GAAP.

3
Summary Results
$ millions, except per-share data
$ millions, except per-share data
(1) See “Non-GAAP Financial Measures” and “Notes to Non-GAAP Financial Measures”(Slides 14 - 16),
“Cautionary Statement” (Slide 2) and today’s press release.
“Cautionary Statement” (Slide 2) and today’s press release.
|
|
Three Months Ended
December 31
|
|
|
2010
|
2009
|
|
|
|
|
|
|
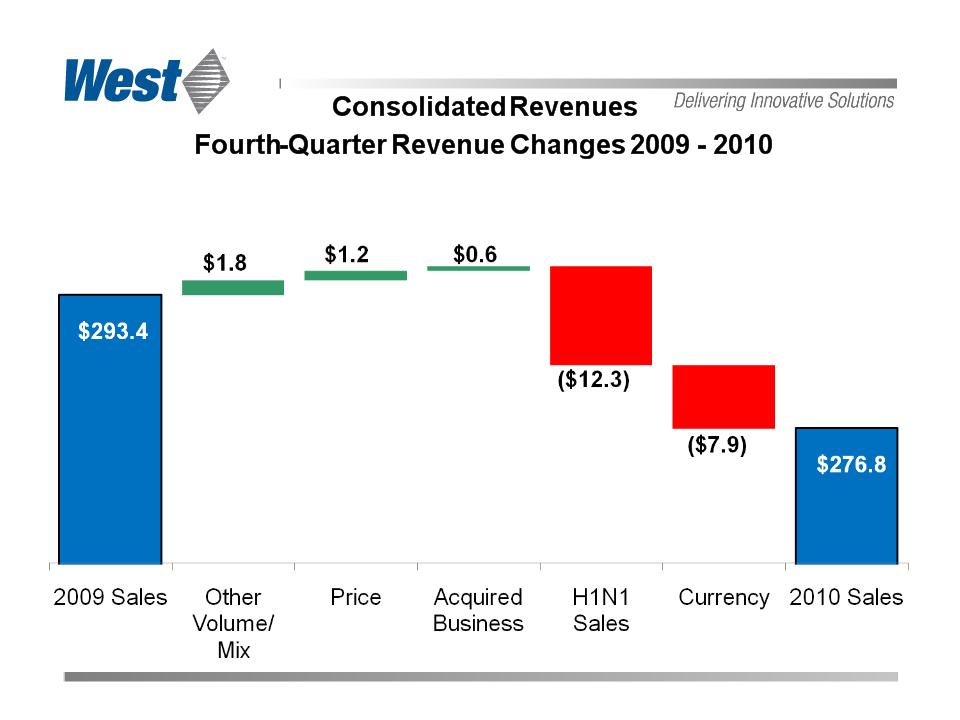
Net Sales
|
$ 276.8
|
$ 293.4
|
|
Gross Profit
|
78.0
|
83.9
|
|
Reported Operating Profit
|
5.9
|
21.7
|
|
Adjusted Operating Profit (1)
|
20.6
|
32.0
|
|
Reported Diluted EPS
|
$ 0.18
|
$ 0.59
|
|
Adjusted Diluted EPS(1)
|
$ 0.42
|
$ 0.67
|

4
Fourth Quarter Results
• Comparative Sales Reduced by:
– Non-recurring 2009 H1N1-related volumes
– Currency translation and exchange variability
• Modest Growth Excluding Those Items
– Packaging Systems customers deferred purchases
– Stronger Delivery Systems sales compensated
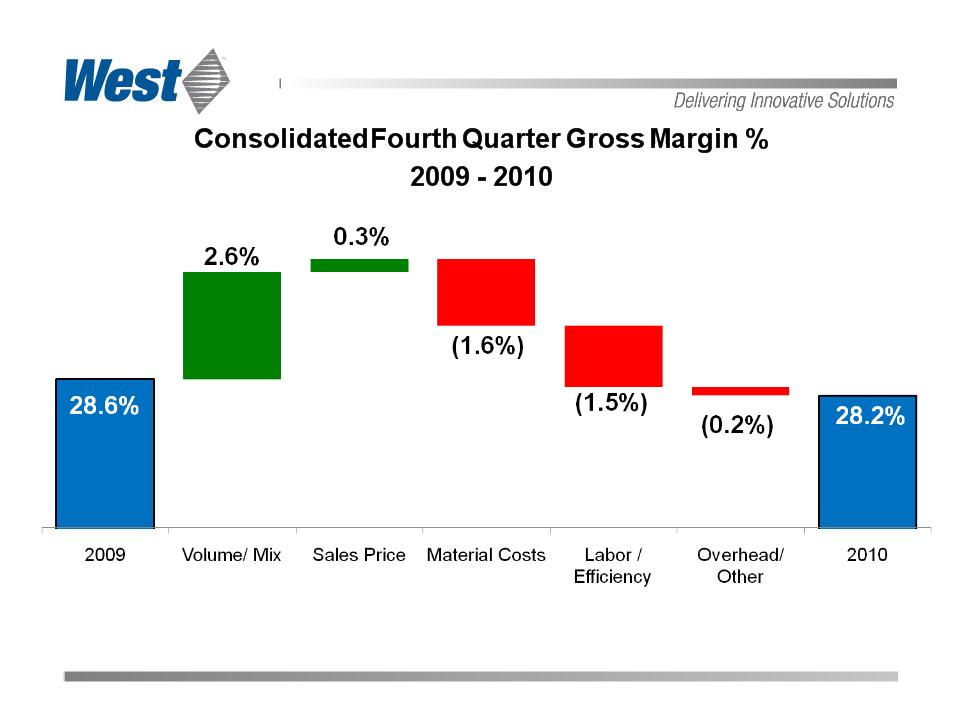
– Overall profitability suffered as a result
• Restructuring Announced

5
2011 Full-year Financial Guidance
|
($ millions, except EPS)
|
2011 Revenue(1)
|
Gross Profit %(1)
|
|
Pharmaceutical Packaging
Systems Segment |
$ 810 - $ 830
|
33.4%
|
|
|
|
|
|
Pharmaceutical Delivery
Systems Segment |
$325 - $340
|
20.5%
|
|
|
|
|
|
Consolidated
|
$1,140 - $1,170
|
29.7%
|
|
|
2011 Adjusted Diluted EPS(1)(2)
|
|
|
|
$2.25 - $2.45
|
|
(1) Guidance includes various currency exchange rate assumptions, most significantly the Euro at $1.35 for 2011.
Actual results will vary as a result of variability of exchange rates.
Actual results will vary as a result of variability of exchange rates.
(2) See “Non-GAAP Financial Measures” and “Notes to Non-GAAP Financial Measures”(Slides 14 - 16),“Cautionary
Statement” (Slide 2) and today’s press release.
Statement” (Slide 2) and today’s press release.

6
Proprietary Product Development Highlights
• Westar RU Progress Toward 2011 Commercial Scale
• Progress on Daikyo Crystal Zenith® Insert Needle
Syringe
Syringe
– Glass-related recall activity continues to high-light problems
– Demand for validated stability samples is consuming capacity
– Production capacity to expand in 2011
• Confidose® Auto-injector
– Concluding work under initial development agreement
• Electronic Patch-Injector
– Extremely high customer interest
– Incorporates flexibility of CZ primary container design
Note: Crystal Zenith® is a registered trademark of Daikyo Seiko, Ltd.

7
Fourth Quarter Adjusted Diluted EPS
|
Fourth quarter 2009 adjusted diluted EPS
|
|
$ 0.67
|
|
|
Non-recurring 2009 sales (H1N1)
|
|
(0.09)
|
|
|
Foreign currency effects
|
|
(0.06)
|
|
|
Stock-based compensation (share price only)
|
|
(0.03)
|
|
|
Research & Development
|
|
(0.03)
|
|
|
Other, net
|
|
(0.04)
|
|
|
Fourth quarter 2010 adjusted diluted EPS
|
|
$ 0.42
|
|
8
9
10
11
Summary Balance Sheet Information
|
|
December 31,
|
|
|
2010
|
2009
|
|
|
Cash and cash equivalents
|
$ 110.2
|
$ 83.1
|
|
|
|
|
|
Debt
|
$ 358.4
|
$ 379.6
|
|
Equity
|
$ 625.7
|
$ 579.1
|
|
Net debt to total invested capital
|
28.4%
|
33.9%
|
|
|
|
|
|
Working capital
|
$ 266.9
|
$ 226.1
|
12
Cash Flow Metrics
($ millions)
($ millions)
|
|
Year Ended
December 31, |
|
|
|
|
2010
|
2009
|
|
|
Depreciation and
amortization |
$ 73.2
|
$ 68.1
|
|
|
Operating cash flow
|
$ 138.3
|
$ 137.7
|
|
|
Capital expenditures
|
$ 71.1
|
$ 104.9
|
|
13
2011 Full-year Financial Guidance
|
($ millions, except EPS)
|
2011 Revenue(1)
|
Gross Profit %(1)
|
|
Pharmaceutical Packaging
Systems Segment |
$ 810 - $ 830
|
33.4%
|
|
|
|
|
|
Pharmaceutical Delivery
Systems Segment |
$325 - $340
|
20.5%
|
|
|
|
|
|
Consolidated
|
$1,140 - $1,170
|
29.7%
|
|
|
2011 Adjusted Diluted EPS(1)(2)
|
|
|
|
$2.25 - $2.45
|
|
(1) Guidance includes various currency exchange rate assumptions, most significantly the Euro at $1.35 for 2011.
Actual results will vary as a result of variability of exchange rates.
Actual results will vary as a result of variability of exchange rates.
(2) See “Non-GAAP Financial Measures” and “Notes to Non-GAAP Financial Measures”(Slides 14 - 16),“Cautionary
Statement” (Slide 2) and today’s press release.
Statement” (Slide 2) and today’s press release.

14
(1) See “Notes to Non-GAAP Financial Measures”(Slides 15 - 16), “Cautionary Statement” (Slide 2) and today’s press
release.
release.
Non-GAAP Financial Measures(1)
Three Months Ended December 31, 2010 and 2009
Three Months Ended December 31, 2010 and 2009
(in millions, except per share data)
|
|
As Reported
December 31,
2010
|
Restructuring
and related charges |
Discrete
tax items |
Non-GAAP(1)
December 31,
2010
|
|
Operating profit
|
$5.9
|
$14.7
|
$-
|
$20.6
|
|
Interest expense, net
|
4.4
|
-
|
-
|
4.4
|
|
Income before income taxes
|
1.5
|
14.7
|
-
|
16.2
|
|
Income tax expense (benefit)
|
(3.6)
|
5.3
|
1.1
|
2.8
|
|
Equity in net income of affiliated companies
|
0.8
|
-
|
-
|
0.8
|
|
Net income
|
$5.9
|
$9.4
|
($1.1)
|
$14.2
|
|
|
|
|
|
|
|
Net income per diluted share
|
$0.18
|
$0.27
|
($0.03)
|
$0.42
|
|
|
As Reported
December 31,
2009
|
Restructuring
and other |
Brazil tax
amnesty |
Discrete tax
items |
Non-GAAP(1)
December 31,
2009
|
|
Operating profit
|
$21.7
|
$8.4
|
$1.9
|
$-
|
$32.0
|
|
Interest expense, net
|
3.9
|
-
|
-
|
-
|
3.9
|
|
Income before income taxes
|
17.8
|
8.4
|
1.9
|
-
|
28.1
|
|
Income tax expense (benefit)
|
(1.1)
|
2.8
|
0.6
|
4.0
|
6.3
|
|
Equity in net income of affiliated companies
|
1.4
|
-
|
-
|
-
|
1.4
|
|
Net income
|
$20.3
|
$5.6
|
$1.3
|
($4.0)
|
$23.2
|
|
|
|
|
|
|
|
|
Net income per diluted share
|
$0.59
|
$0.16
|
$0.03
|
($0.11)
|
$0.67
|

15
NOTES TO NON-GAAP FINANCIAL MEASURES
For additional details, please see today’s press release and Safe Harbor Statement.
For additional details, please see today’s press release and Safe Harbor Statement.
These use non-GAAP financial measures. West believes that these non-GAAP measures of financial results provide useful
information to management and investors regarding certain business trends relating to West’s financial condition, results of
operations and the Company’s overall performance. Our executive management team uses adjusted operating profit and
adjusted diluted EPS to evaluate the performance of the Company in terms of profitability and to compare operating results to
prior periods. Adjusted operating profit is also used to evaluate changes in the operating results of each segment and to allocate
resources to our segments. The Company believes that the use of these non-GAAP financial measures provides an additional
tool for investors to use in evaluating ongoing operating results and trends in comparing its financial measures with other
companies.
Our executive management does not consider such non-GAAP measures in isolation or as an alternative to such measures
determined in accordance with GAAP. The principal limitation of such non-GAAP financial measures is that they exclude
significant expenses and income that are required by GAAP to be recorded. In addition, they are subject to inherent limitations
as they reflect the exercise of judgment by management about which items are excluded from the non-GAAP financial
measures. In order to compensate for these limitations, our executive management presents its non-GAAP financial measures
in connection with its GAAP results. We urge investors and potential investors to review the reconciliation of our non-GAAP
financial measures to the comparable GAAP financial measures, and not rely on any single financial measure to evaluate the
Company’s business.
In calculating adjusted operating profit and adjusted diluted EPS, we exclude the impact of items that are not considered
representative of ongoing operations. Such items include restructuring and related costs, certain asset impairments, other
specifically identified gains or losses, and discrete income tax items. A reconciliation of these adjusted non-GAAP measures to
the comparable GAAP financial measures is included in the preceding slide.
The following is a description of the items excluded from adjusted operating profit and adjusted diluted EPS:
Restructuring and related charges: During the three months ended December 31, 2010, we incurred restructuring,
impairment and related charges of $14.7 million. The majority of these costs related to the restructuring plan announced in
December of 2010. During the three months ended December 31, 2009, we recognized restructuring and other charges of $8.4
million. The majority of these charges related to a restructuring program launched in the fourth quarter of 2009 to exit certain
specialized laboratory service offerings and consolidate contract-manufacturing operations. The 2009 restructuring program was
completed during the fourth quarter of 2010.
(continued on following slide)

16
NOTES TO NON-GAAP FINANCIAL MEASURES
For additional details, please see today’s press release and Safe Harbor Statement.
For additional details, please see today’s press release and Safe Harbor Statement.
Reconciliation of 2011 Adjusted Guidance to 2011 Reported Guidance:
(1) Guidance includes various currency exchange rate assumptions, most significantly the Euro at $1.35 for
2011. Actual results will vary as a result of variability of exchange rates.
2011. Actual results will vary as a result of variability of exchange rates.
|
|
Full Year 2011 Guidance (1)
|
|
|
Diluted Earnings Per Share
|
|
Adjusted guidance
|
$2.25 to $2.45
|
|
Restructuring, net of tax
|
(0.05) - (0.06)
|
|
Reported guidance
|
$2.19 to $2.40
|
(continued from prior slide)
Brazil Tax Amnesty: During September 2009, we enrolled in a tax amnesty program in Brazil which entitled us to a
reduction
reduction
in certain tax-related penalties, interest and other costs in exchange for our irrevocable declaration of all specified tax
obligations. The fourth quarter 2009 pre-tax charge of $1.9 million was the result of an adjustment to the original amnesty
benefit to reflect the impact of a newly-issued ordinance. The full-year impact was a pre-tax gain of $2.0 million, or $0.4
million after tax.
obligations. The fourth quarter 2009 pre-tax charge of $1.9 million was the result of an adjustment to the original amnesty
benefit to reflect the impact of a newly-issued ordinance. The full-year impact was a pre-tax gain of $2.0 million, or $0.4
million after tax.
Discrete tax items: During the fourth quarter of 2010, we recognized $1.1 million in net discrete tax benefits, the majority of
which resulted from the expiration of open tax audit periods in various tax jurisdictions. During the three months ended
December 31, 2009, we similarly recognized discrete tax benefits of $4.0 million.
which resulted from the expiration of open tax audit periods in various tax jurisdictions. During the three months ended
December 31, 2009, we similarly recognized discrete tax benefits of $4.0 million.