Attached files
| file | filename |
|---|---|
| 8-K - 8-K - UNIVERSAL AMERICAN CORP. | a11-6201_18k.htm |
| EX-99.1 - EX-99.1 - UNIVERSAL AMERICAN CORP. | a11-6201_1ex99d1.htm |
Exhibit 99.2
|
|
4Q 2010 Investor Presentation February 17, 2011 1 |
|
|
Forward-Looking Statements/Non-GAAP Financial Measures This presentation contains "forward-looking" statements within the meaning of the federal securities. We warn you that forward-looking statements are only predictions and estimates, which are inherently subject to risks, trends and uncertainties, many of which are beyond our ability to control or predict with accuracy and some of which we might not even anticipate. These risks and uncertainties include: the timing to consummate the proposed transaction with CVS Caremark; negative effects from the pendency of the transaction; the risk that a condition to closing of the proposed transaction may not be satisfied; the risk that a regulatory approval that may be required for the proposed transaction is not obtained or is obtained subject to conditions that are not anticipated; the ability of Universal American to timely receive the required approval of its shareholders; the risk that the contemplated transaction does not occur for any other reason; the possibility that costs or difficulties 2 related to the separation of the Medicare Prescription Drug Business will be greater than expected; the risks to NewCo's ability to effectively operate its businesses independently of the Medicare Prescription Drug Business, including its ability to access sufficient sources of capital to fund its operations; the risks to NewCo's ability to retain and hire key personnel; the diversion of management time on transaction-related issues and other risks described in the risk factor section of our SEC reports. We give no assurance that we will achieve our expectations and we do not assume responsibility for the accuracy and completeness of the forward-looking statements. All forward-looking statements included in this presentation are based upon information available to Universal American as of the date of the presentation, and we assume no obligation to update or revise any such forward-looking statements. The discussion in this presentation of Universal American’s financial performance includes financial measures that are not derived from generally accepted accounting principles, or GAAP. Information regarding these non-GAAP financial measures is available in our quarterly earnings press releases in the Investor Relations section of Universal American’s website at www.universalamerican.com. |
|
|
Additional Information In connection with the proposed transaction with CVS Caremark, NewCo will file with the SEC a Registration Statement on Form S-4 that will include a proxy statement of Universal American that also constitutes a prospectus of NewCo. We will mail the proxy statement/prospectus to our shareholders. BEFORE MAKING ANY VOTING DECISION, SHAREHOLDERS OF UNIVERSAL AMERICAN ARE URGED TO READ THE PROXY STATEMENT/PROSPECTUS CAREFULLY BECAUSE THE PROXY STATEMENT/PROSPECTUS WILL CONTAIN IMPORTANT INFORMATION ABOUT THE PROPOSED TRANSACTION. 3 You may obtain copies of all documents filed with the SEC regarding this transaction, free of charge, at the SEC’s website (sec.gov). You will also be able to obtain these documents, free of charge, when filed, from our website, www.UniversalAmerican.com, under the tab “Investors” and then under the tab “SEC Filings.” Universal American and its directors, executive officers and certain other members of our management and employees may be soliciting proxies from Universal American shareholders in favor of the merger and the separation. Information regarding the persons who may, under the rules of the SEC, be deemed participants in the solicitation of Universal American shareholders in connection with the proposed transaction will be set forth in the proxy statement/prospectus when it is filed with the SEC. You can find information about Universal American’s executive officers and directors in its definitive proxy statement filed with the SEC on April 30, 2010. |
|
|
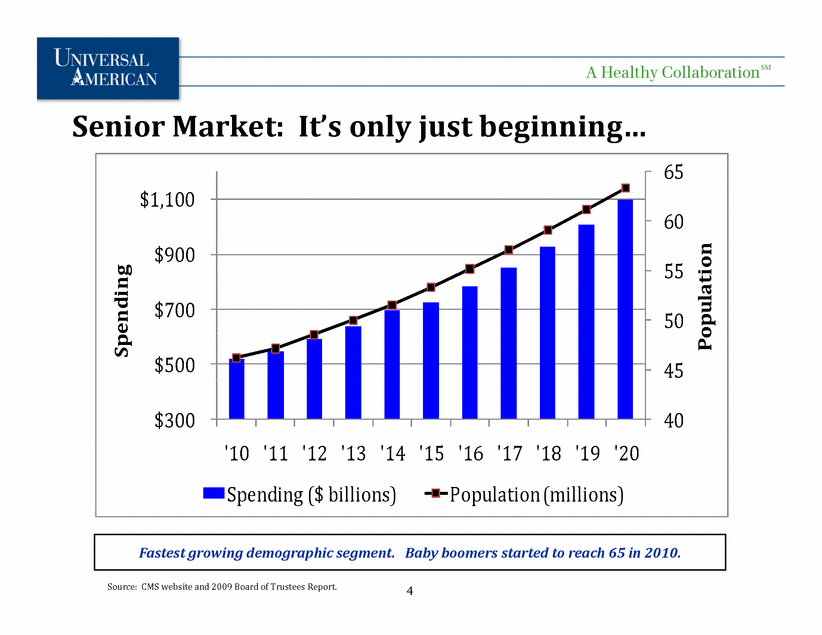
Senior Market: It’s only just beginning 50 55 60 65 $700 $900 $1,100 Population Spending 4 40 45 $300 $500 '10 '11 '12 '13 '14 '15 '16 '17 '18 '19 '20 Spending ($ billions) Population (millions) Fastest growing demographic segment. Baby boomers started to reach 65 in 2010. Source: CMS website and 2009 Board of Trustees Report. |
|
|
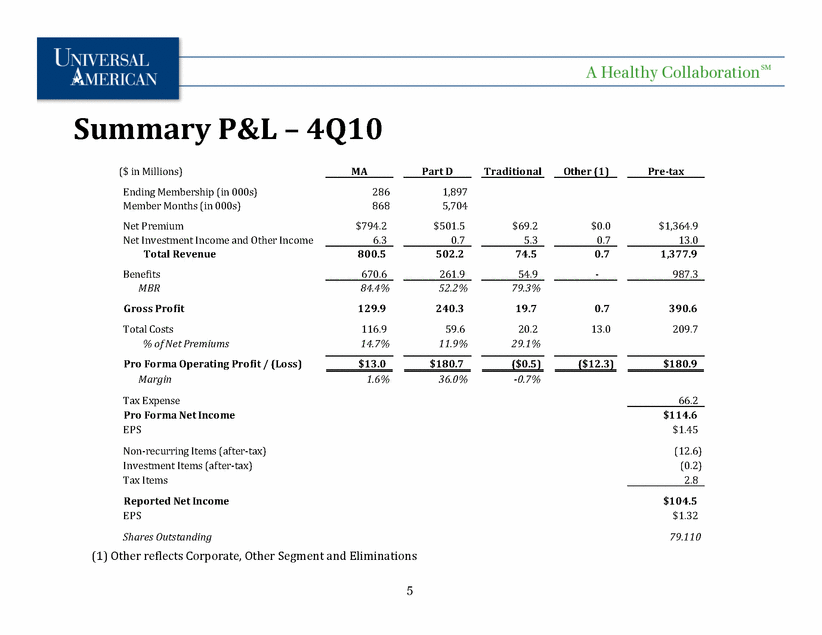
Summary P&L – 4Q10 ($ in Millions) MA Part D Traditional Other (1) Pre-tax Ending Membership (in 000s) 286 1,897 Member Months (in 000s) 868 5,704 Net Premium $794.2 $501.5 $69.2 $0.0 $1,364.9 Net Investment Income and Other Income 6.3 0.7 5.3 0.7 13.0 Total Revenue 800.5 502.2 74.5 0.7 1,377.9 Benefits 670.6 261.9 54.9 - 987.3 MBR 84.4% 52.2% 79.3% Gross Profit 129.9 240.3 19.7 0.7 390.6 5 (1) Other reflects Corporate, Other Segment and Eliminations Total Costs 116.9 59.6 20.2 13.0 209.7 % of Net Premiums 14.7% 11.9% 29.1% Pro Forma Operating Profit / (Loss) $13.0 $180.7 ($0.5) ($12.3) $180.9 Margin 1.6% 36.0% -0.7% Tax Expense 66.2 Pro Forma Net Income $114.6 EPS $1.45 Non-recurring Items (after-tax) (12.6) Investment Items (after-tax) (0.2) Tax Items 2.8 Reported Net Income $104.5 EPS $1.32 Shares Outstanding 79.110 |
|
|
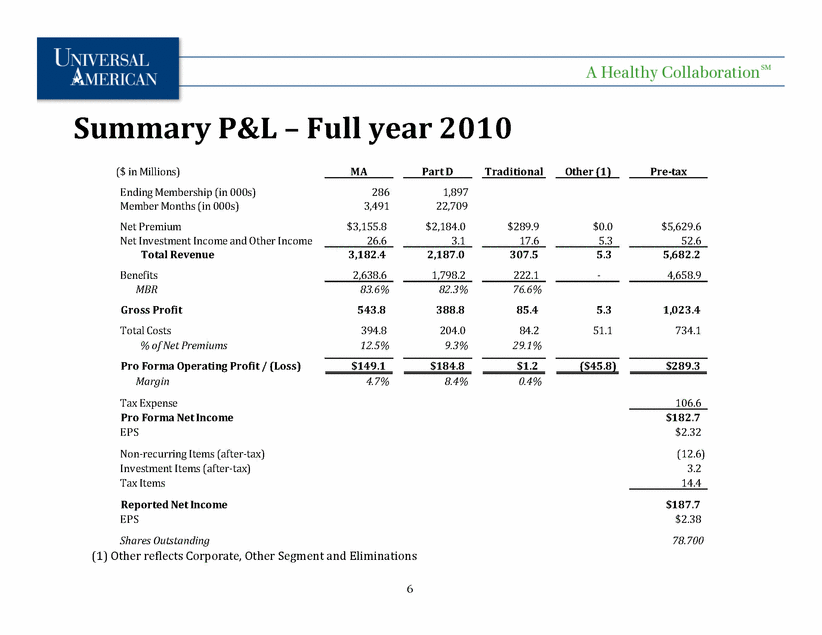
Summary P&L – Full year 2010 ($ in Millions) MA Part D Traditional Other (1) Pre-tax Ending Membership (in 000s) 286 1,897 Member Months (in 000s) 3,491 22,709 Net Premium $3,155.8 $2,184.0 $289.9 $0.0 $5,629.6 Net Investment Income and Other Income 26.6 3.1 17.6 5.3 52.6 Total Revenue 3,182.4 2,187.0 307.5 5.3 5,682.2 Benefits 2,638.6 1,798.2 222.1 - 4,658.9 MBR 83.6% 82.3% 76.6% Gross Profit 543.8 388.8 85.4 5.3 1,023.4 6 (1) Other reflects Corporate, Other Segment and Eliminations Total Costs 394.8 204.0 84.2 51.1 734.1 % of Net Premiums 12.5% 9.3% 29.1% Pro Forma Operating Profit / (Loss) $149.1 $184.8 $1.2 ($45.8) $289.3 Margin 4.7% 8.4% 0.4% Tax Expense 106.6 Pro Forma Net Income $182.7 EPS $2.32 Non-recurring Items (after-tax) (12.6) Investment Items (after-tax) 3.2 Tax Items 14.4 Reported Net Income $187.7 EPS $2.38 Shares Outstanding 78.700 |
|
|
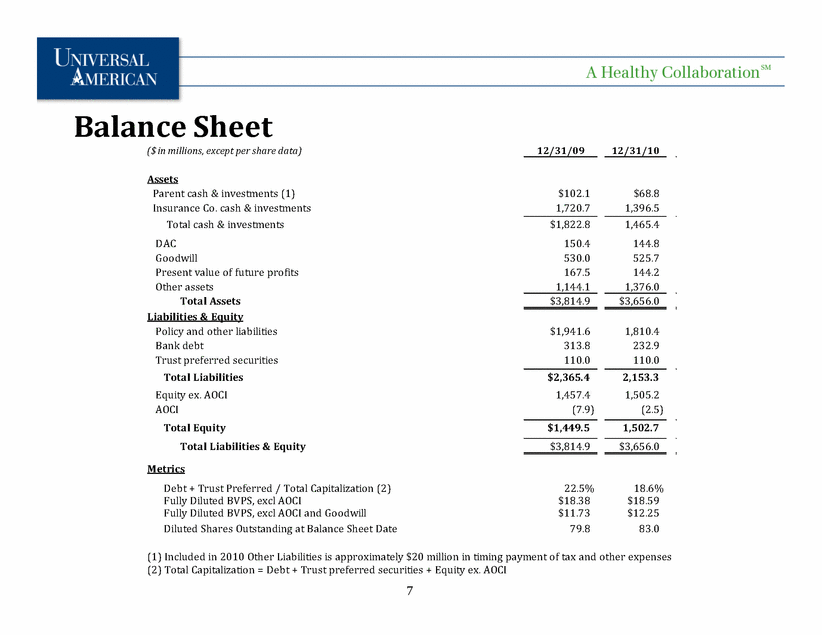
Balance Sheet ($ in millions, except per share data) 12/31/09 12/31/10 Assets Parent cash & investments (1) $102.1 $68.8 Insurance Co. cash & investments 1,720.7 1,396.5 Total cash & investments $1,822.8 1,465.4 DAC 150.4 144.8 Goodwill 530.0 525.7 Present value of future profits 167.5 144.2 Other assets 1,144.1 1,376.0 Total Assets $3,814.9 $3,656.0 Liabilities & Equity 7 Policy and other liabilities $1,941.6 1,810.4 Bank debt 313.8 232.9 Trust preferred securities 110.0 110.0 Total Liabilities $2,365.4 2,153.3 Equity ex. AOCI 1,457.4 1,505.2 AOCI (7.9) (2.5) Total Equity $1,449.5 1,502.7 Total Liabilities & Equity $3,814.9 $3,656.0 Metrics Debt + Trust Preferred / Total Capitalization (2) 22.5% 18.6% Fully Diluted BVPS, excl AOCI $18.38 $18.59 Fully Diluted BVPS, excl AOCI and Goodwill $11.73 $12.25 Diluted Shares Outstanding at Balance Sheet Date 79.8 83.0 (1) Included in 2010 Other Liabilities is approximately $20 million in timing payment of tax and other expenses (2) Total Capitalization = Debt + Trust preferred securities + Equity ex. AOCI |
|
|
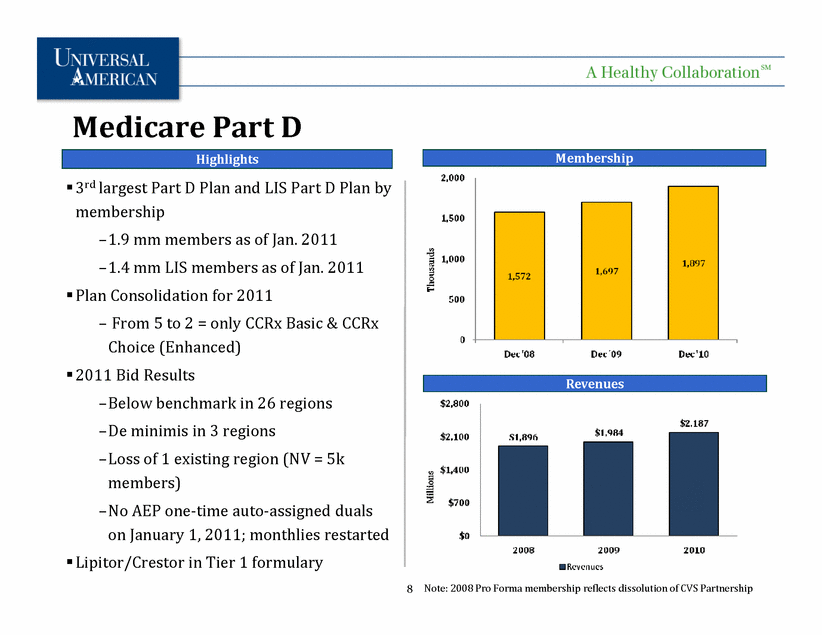
Medicare Part D Highlights Membership * 3rd largest Part D Plan and LIS Part D Plan by membership –1.9 mm members as of Jan. 2011 –1.4 mm LIS members as of Jan. 2011 Plan Consolidation for 2011 – From 5 to 2 = only CCRx Basic & CCRx 8 Revenues Note: 2008 Pro Forma membership reflects dissolution of CVS Partnership Choice (Enhanced) 2011 Bid Results –Below benchmark in 26 regions –De minimis in 3 regions –Loss of 1 existing region (NV = 5k members) –No AEP one-time auto-assigned duals on January 1, 2011; monthlies restarted Lipitor/Crestor in Tier 1 formulary |
|
|
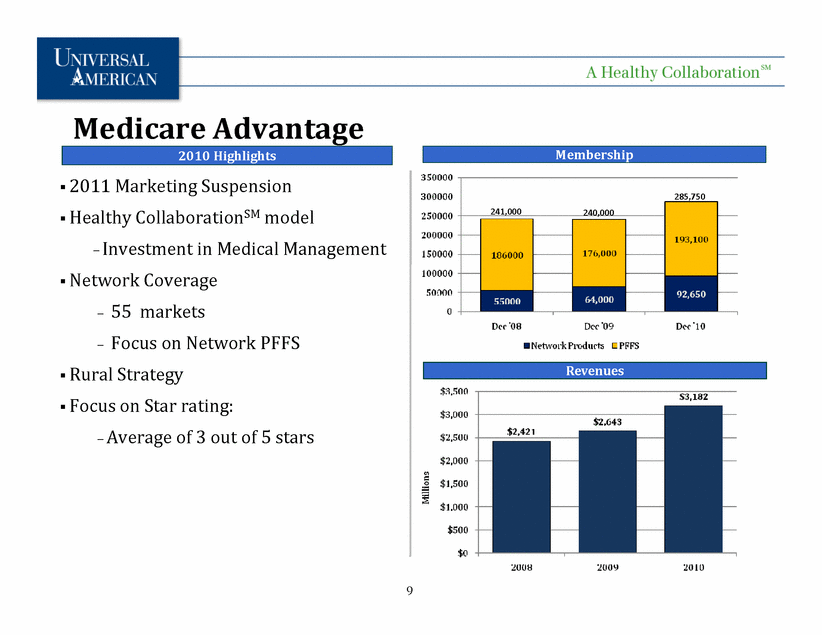
Medicare Advantage 2010 Highlights Membership 241,000 240,000 285,750 2011 Marketing Suspension Healthy CollaborationSMmodel -Investment in Medical Management Network Coverage – 55 markets 9 Revenues – Focus on Network PFFS Rural Strategy Focus on Star rating: –Average of 3 out of 5 stars |
|
|
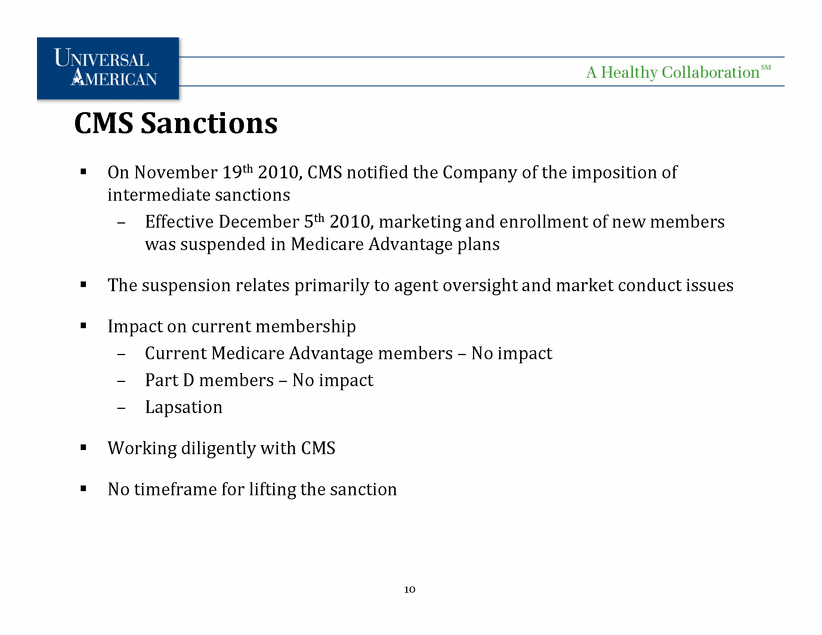
On November 19th 2010, CMS notified the Company of the imposition of intermediate sanctions – Effective December 5th 2010, marketing and enrollment of new members was suspended in Medicare Advantage plans The suspension relates primarily to agent oversight and market conduct issues Impact on current membership CMS Sanctions 10 – Current Medicare Advantage members – No impact – Part D members – No impact – Lapsation Working diligently with CMS No timeframe for lifting the sanction |
|
|
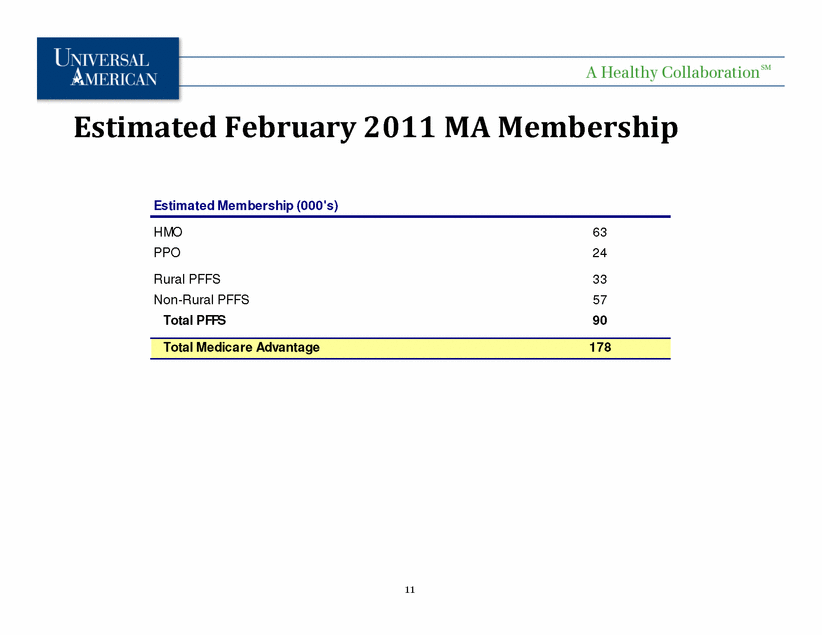
Estimated February 2011 MA Membership Estimated Membership (000's) HMO 63 PPO 24 Rural PFFS 33 Non-Rural PFFS 57 Total PFFS 90 11 Total Medicare Advantage 178 |
|
|
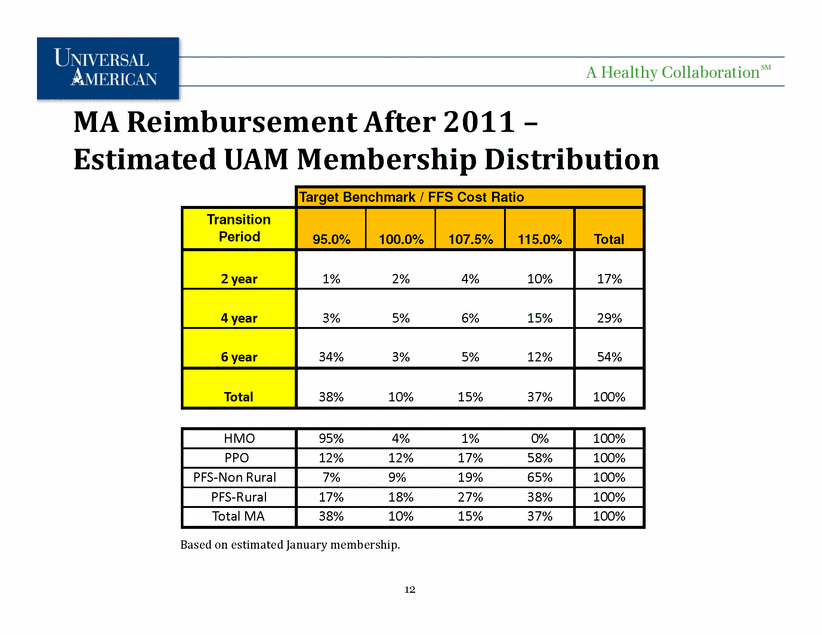
MA Reimbursement After 2011 – Estimated UAM Membership Distribution Target Benchmark / FFS Cost Ratio Transition Period 95.0% 100.0% 107.5% 115.0% Total 2 year 1% 2% 4% 10% 17% 4 year 3% 5% 6% 15% 29% 12 Based on estimated January membership. 6 year 34% 3% 5% 12% 54% Total 38% 10% 15% 37% 100% HMO 95% 4% 1% 0% 100% PPO 12% 12% 17% 58% 100% PFS-Non Rural 7% 9% 19% 65% 100% PFS-Rural 17% 18% 27% 38% 100% Total MA 38% 10% 15% 37% 100% |
|
|
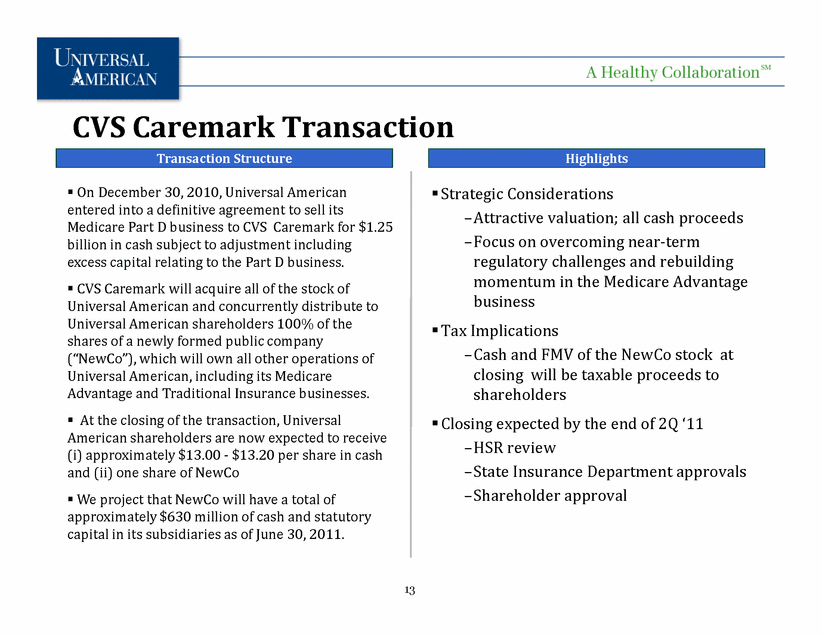
CVS Caremark Transaction Highlights Strategic Considerations –Attractive valuation; all cash proceeds –Focus on overcoming near-term regulatory challenges and rebuilding momentum in the Medicare Advantage business Transaction Structure On December 30, 2010, Universal American entered into a definitive agreement to sell its Medicare Part D business to CVS Caremark for $1.25 billion in cash subject to adjustment including excess capital relating to the Part D business. CVS Caremark will acquire all of the stock of Universal American and concurrently distribute to Universal American shareholders 100% of the 13 Tax Implications –Cash and FMV of the NewCo stock at closing will be taxable proceeds to shareholders Closing expected by the end of 2Q ‘11 –HSR review –State Insurance Department approvals –Shareholder approval shares of a newly formed public company (“NewCo”), which will own all other operations of Universal American, including its Medicare Advantage and Traditional Insurance businesses. At the closing of the transaction, Universal American shareholders are now expected to receive (i) approximately $13.00 - $13.20 per share in cash and (ii) one share of NewCo We project that NewCo will have a total of approximately $630 million of cash and statutory capital in its subsidiaries as of June 30, 2011. |
|
|
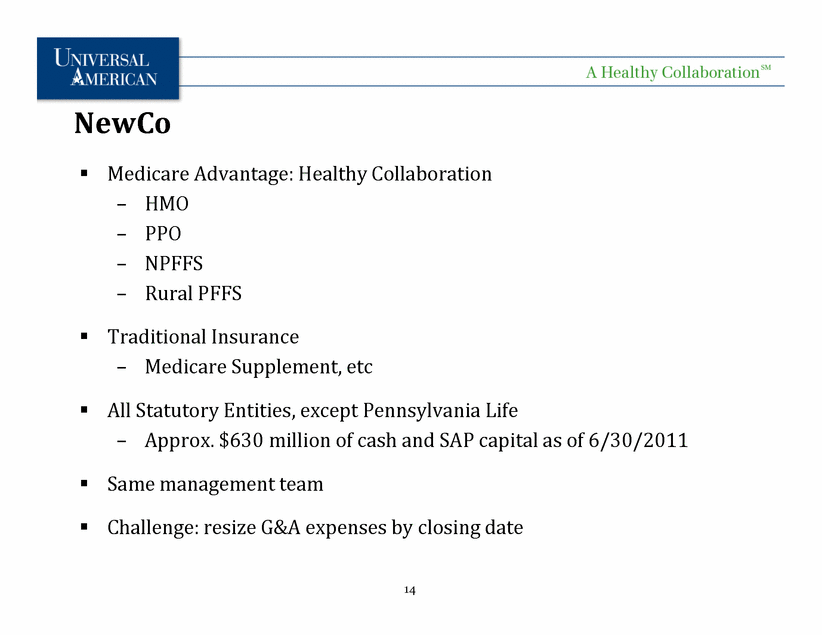
NewCo Medicare Advantage: Healthy Collaboration – HMO – PPO – NPFFS – Rural PFFS 14 Traditional Insurance – Medicare Supplement, etc All Statutory Entities, except Pennsylvania Life – Approx. $630 million of cash and SAP capital as of 6/30/2011 Same management team Challenge: resize G&A expenses by closing date |
|
|
|

