Attached files
| file | filename |
|---|---|
| 8-K - FORM 8-K - Regency Energy Partners LP | d8k.htm |
| EX-99.1 - PRESS RELEASE - Regency Energy Partners LP | dex991.htm |
 Exhibit 99.2
Regency Energy Partners
Fourth Quarter Earnings Release
February 17, 2011 |
 Forward-Looking Statements
2
Certain matters discussed in this report include “forward-looking” statements.
Forward-looking statements are identified as any statement that does not relate strictly to
historical or current facts. Statements using words such as “anticipate,”
“believe,” “intend,” “project,” “plan,” “expect,” “continue,” “estimate,” “goal,” “forecast,” “may” or
similar expressions help identify forward-looking statements. Although we believe our
forward-looking statements are based on reasonable assumptions and current expectations and
projections about future events, we cannot give assurances that such expectations will prove to
be correct. Forward-looking statements are subject to a variety of risks, uncertainties and
assumptions. These risks and uncertainties include volatility in the price of oil, natural gas,
and natural gas liquids, declines in the credit markets and the availability of credit for the
Partnership as well as for producers connected to the Partnership’s system and its customers, the
level of creditworthiness of, and performance by the Partnership’s counterparties and
customers, the Partnership's ability to access capital to fund organic growth projects and
acquisitions, and the Partnership’s ability to obtain debt and equity financing on
satisfactory terms, the Partnership's use of derivative financial instruments to hedge commodity
and interest rate risks, the amount of collateral required to be posted from time-to-time in the
Partnership's transactions, changes in commodity prices, interest rates, and demand for the
Partnership's services, changes in laws and regulations impacting the midstream sector of the
natural gas industry, weather and other natural phenomena, industry changes including the
impact of consolidations and changes in competition, the Partnership's ability to obtain
required approvals for construction or modernization of the Partnership's facilities and the
timing of production from such facilities, and the effect of accounting pronouncements issued
periodically by accounting standard setting boards. Therefore, actual results and outcomes may
differ materially from those expressed in such forward-looking information. In light of these risks, uncertainties and assumptions, the events described in the
forward-looking statements might not occur or might occur to a different extent or at a
different time than the Partnership has described. The Partnership undertakes no obligation to
update publicly or to revise any forward-looking statements, whether as a result of new
information, future events or otherwise. |
 3
2010 Highlights
?Key
Highlights Partnership
Energy Transfer Equity acquired 100% of Regency’s general partner
Introduced new senior leadership team with extensive experience in the midstream
industry Acquisitions
Acquired 49.9% interest in MEP Joint Venture
Completed $193-million
1
Zephyr acquisition
Acquired additional 6.99% interest in Haynesville Joint Venture
Operational
Completed construction of the Haynesville and Red River Expansion projects on time and
under budget Completed sale of east Texas assets
Added
485
MMcf/d
of
incremental
gathering
capacity
in
north
Louisiana
Announced expansions to our south Texas gathering system
Financial
Raised approximately $408 million of equity²
Completed a $600 million debt refinancing and extended maturity date of revolving
credit facility Maintained
quarterly distribution of 44.5 cents per common unit per quarter
Achieved
$327 million of adjusted EBITDA for full-year 2010
1
Final price paid, as reported in Regency’s Form 10-Q dated September 30,
2010 2
Net of underwriting discounts and commissions, inclusive of general partner’s
proportionate capital contribution |
 Fundamentals Review |
 Total
U.S. land rig count increased 4% from Q3 2010 to Q4 2010 Largest increases
occurred in the liquids-rich south Texas and Texas Gulf areas Rich
gas
and
crude
plays
with
associated
gas
are
seeing
greatest
levels
of
drilling
activity
1
Tudor Pickering Holt & Company, TPH Weekly Rig Roundup, January 3, 2011, and
Regency internal analysis 2
Includes injection, geothermal and unclassified rigs
5
Fundamentals: Drilling Activity
Total US Land Rig Count
Q4 09
Q1 10
Q2 10
Q3 10
Q4 10
1,188
1,419
1,624
1,786
1,858
Total Regency Operating Area Rig Count
Q4 09
Q1 10
Q2 10
Q3 10
Q4 10
889
1,065
1,225
1,315
1,382
0
100
200
300
400
500
600
700
800
900
Q4 2009
Q1 2010
Q2 2010
Q3 2010
Q4 2010
U.S. Drilling Rig Trends¹
Gas
Gas/Oil
Oil
0
50
100
150
200
250
300
350
400
Q4 2009
Q1 2010
Q2 2010
Q3 2010
Q4 2010
Rig Count Trends -
Regency Operated Area¹
Mid-Con
West TX
South Tx
North LA / East TX
Fayetteville
TX Gulf
Non-TX Gulf
Barnett Shale
Appalachian
Other
2 |
 February NYMEX contract settled at $4.32
per MMbtu
1
, which represents an 18% decrease year-over-year
WTI crude has broken out of its $70-$85/Bbl range and has reached the low $90s in
recent weeks Forward curves for natural gas and crude oil pricing suggest that
natural gas will trade at approximately $4.49/MMbtu and crude will trade at
approximately $95/Bbl for full year 2011
¹
Fundamentals: Commodity Prices
1
Forward curve pricing as of February 4, 2011
Gas Price Trends
Crude/NGL Price Trends
$2.00
$3.00
$4.00
$5.00
$6.00
Dec-09
Jan-10
Feb-10
Mar-10
Apr-10
May-10
Jun-10
Jul-10
Aug-10
Sep-10
Oct-10
Nov-10
Dec-10
Jan-11
NYMEX
HSC
Panhandle
Waha
$0.00
$20.00
$40.00
$60.00
$80.00
$100.00
Dec-09
Jan-10
Feb-10
Mar-10
Apr-10
May-10
Jun-10
Jul-10
Aug-10
Sep-10
Oct-10
Nov-10
Dec-10
Jan-11
Ethane
Propane
C4+
WTI |
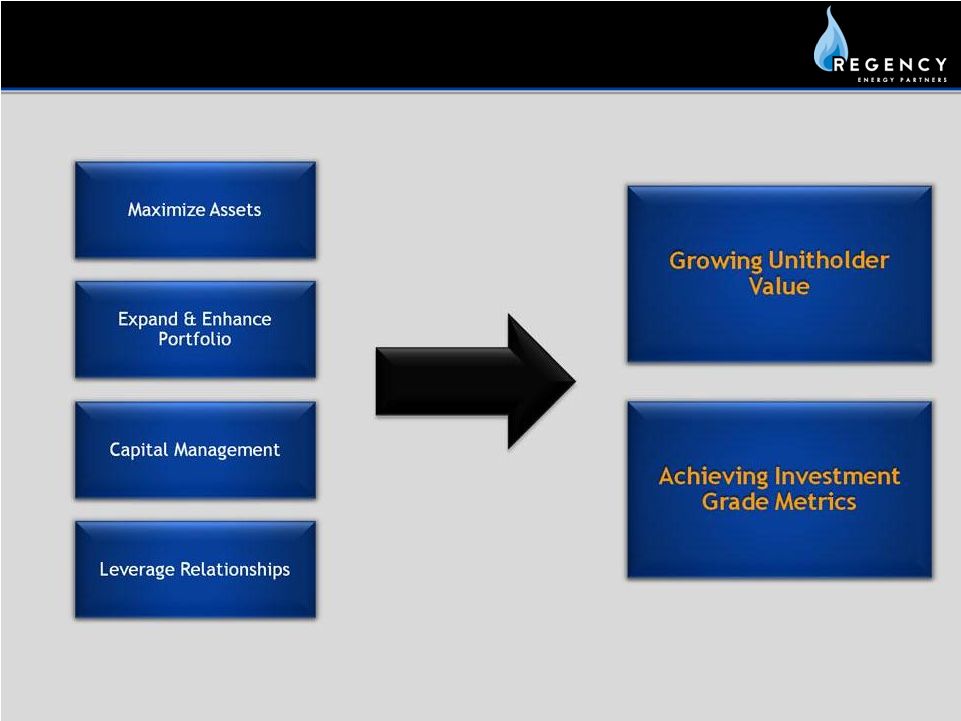
 2011 Growth Strategy |
 8
2011 Growth Strategy |
 Business Review |
 10
2010 Performance
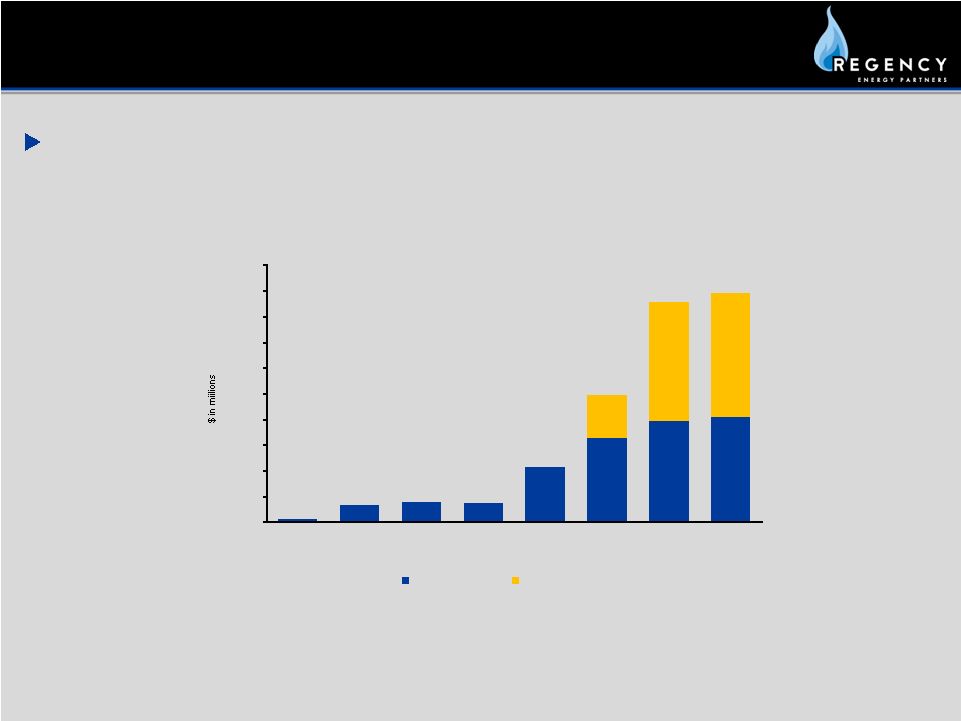
Regency produced strong fourth-quarter and full-year 2010 financial
results Comparing full-year 2010 to full-year 2009, adjusted EBITDA
increased 55% year-over-year 1
Adjusted EBITDA varies from previously disclosed amounts as a result of the inclusion
of non-cash unit based compensation as a reconciling item to adjusted EBITDA
Pro Rata Adjusted EBITDA
1
$55
$53
$51
$53
$62
$74
$90
$102
$0
$20
$40
$60
$80
$100
$120
Q1 2009
Q2 2009
Q3 2009
Q4 2009
Q1 2010
Q2 2010
Q3 2010
Q4 2010 |
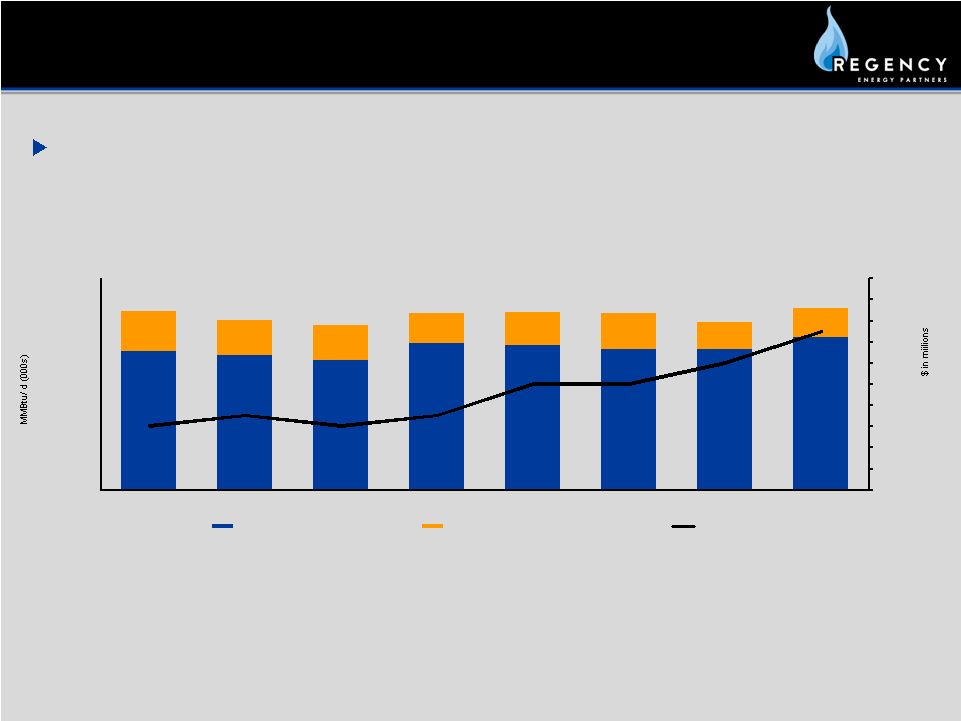 Gathering and Processing Segment
11
1
Inter-segment volumes reflect volumes moved through both Regency’s Gathering
and Processing and Transportation segments 2
Amounts differ from previously disclosed amounts due to the presentation as
discontinued operations for the disposition of east Texas assets Margins
continued to increase in the fourth quarter primarily due to increased Eagle
Ford volumes in our south Texas region
Gathering
and
Processing
Throughput
and
Adjusted
Segment
Margin
1,2
1,012
959
$45
$47
$49
$51
$53
$55
$57
$59
$61
$63
$65
0
200
400
600
800
1,000
1,200
Q1 2009
Q2 2009
Q3 2009
Q4 2009
Q1 2010
Q2 2010
Q3 2010
Q4 2010
Throughput
Intersegment Volumes
Adjusted Segment Margin
933
1,001
1,002
1,005
951
1,030 |
 Transportation Segment
12
Regency’s share of Adjusted EBITDA increased to $123 million for full-year
2010 from $11 million for full-year 2009
1
Includes Regency’s proportionate share of adjusted EBITDA
Transportation Segment Adjusted EBITDA
1
$1
$3
$4
$4
$25
-
-
-
-
$11
$43
$44
$0
$5
$10
$15
$20
$25
$30
$35
$40
$45
$50
Q1 2009
Q2 2009
Q3 2009
Q4 2009
Q1 2010
Q2 2010
Q3 2010
Q4 2010
$ in millions
Haynesville JV
MEP JV |
 Contract Compression & Contract Treating Segments
13
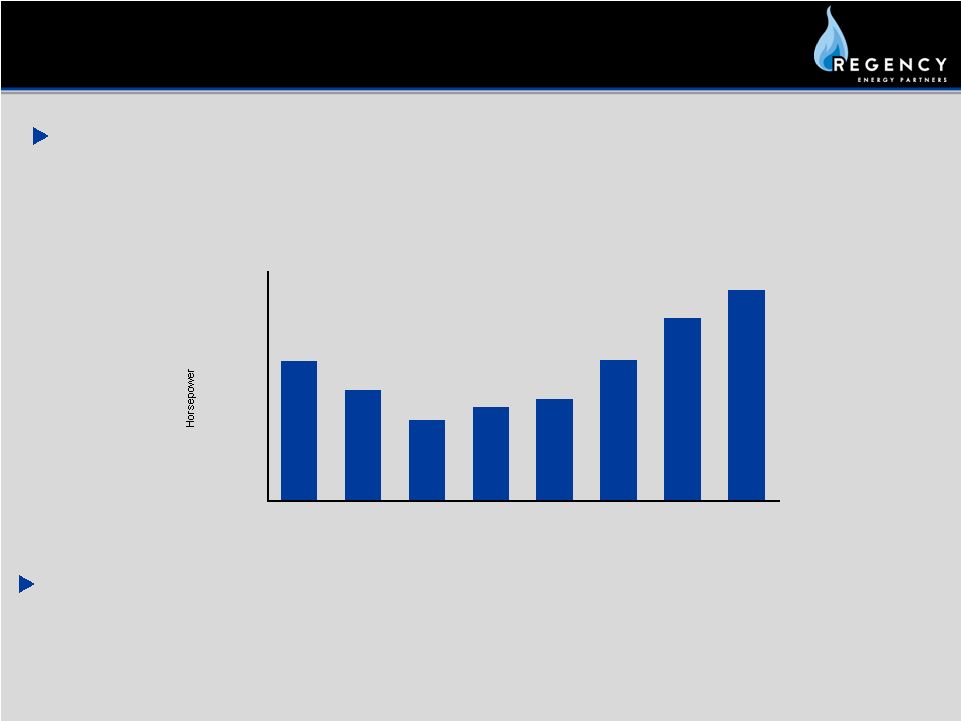
Revenue Generating Horsepower
Despite challenging market conditions, Regency’s revenue generating
horsepower has increased for five
consecutive quarters and increased 12% from year end 2009 to year end 2010
The acquisition of Zephyr Gas Services extends Regency’s contract services
capabilities from wellhead to market
789,494
767,060
743,289
753,328
759,704
790,494
823,369
844,800
680,000
700,000
720,000
740,000
760,000
780,000
800,000
820,000
840,000
860,000
Q1 2009
Q2 2009
Q3 2009
Q4 2009
Q1 2010
Q2 2010
Q3 2010
Q4 2010 |
 Financial Review |
 15
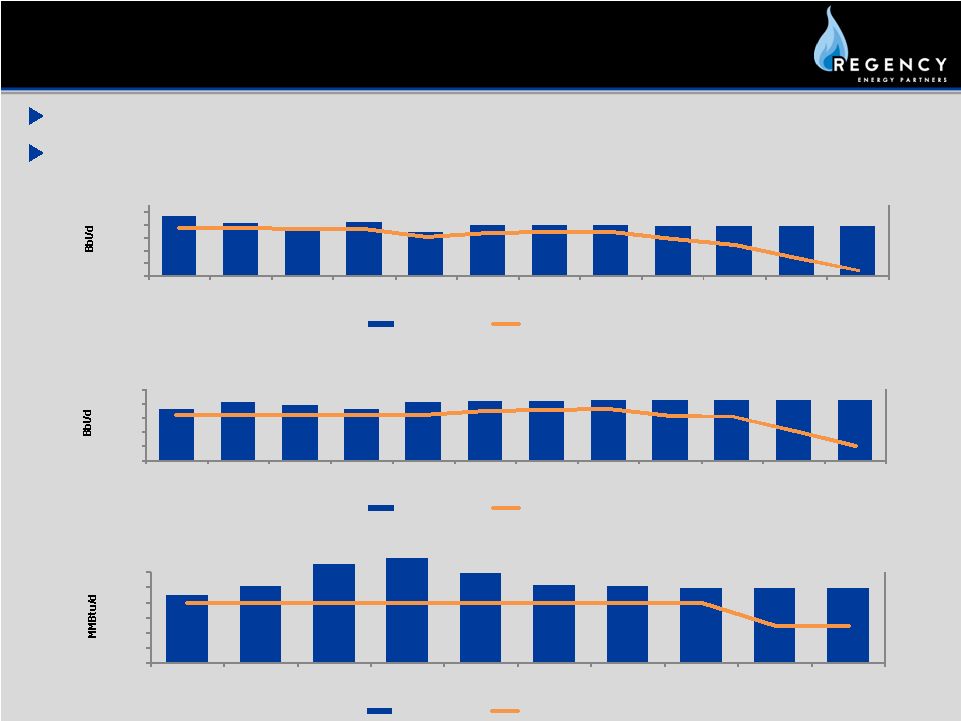
88% of NGLs, 84% of condensate, and 76% of natural gas are hedged for 2011
47% of NGLs, 55% of condensate, and 25% of natural gas are hedged for 2012
Commodity Price Risk Management
1
Percentages as February 4, 2011
90%
79%
61%
58%
68%
78%
79%
81%
51%
51%
-
2,000
4,000
6,000
8,000
10,000
12,000
Q1 2010
Q2 2010
Q3 2010
Q4 2010
Q1 2011
Q2 2011
Q3 2011
Q4 2011
Q1 2012
Q2 2012
Natural Gas Production vs. Hedged
Equity Production
Hedge
80%
92%
104%
88%
89%
86%
87%
89%
75%
63%
38%
12%
-
1,000
2,000
3,000
4,000
5,000
Q1 2010
Q2 2010
Q3 2010
Q4 2010
Q1 2011
Q2 2011
Q3 2011
Q4 2011
Q1 2012
Q2 2012
Q3 2012
Q4 2012
NGL Equity Production vs. Hedged
Equity Production
Hedge
90%
79%
83%
89%
79%
85%
85%
86%
75%
74%
48%
23%
-
200
400
600
800
1,000
Q1 2010
Q2 2010
Q3 2010
Q4 2010
Q1 2011
Q2 2011
Q3 2011
Q4 2011
Q1 2012
Q2 2012
Q3 2012
Q4 2012
Condensate Equity Production vs. Hedged
Equity Production
Hedge
1
1 |
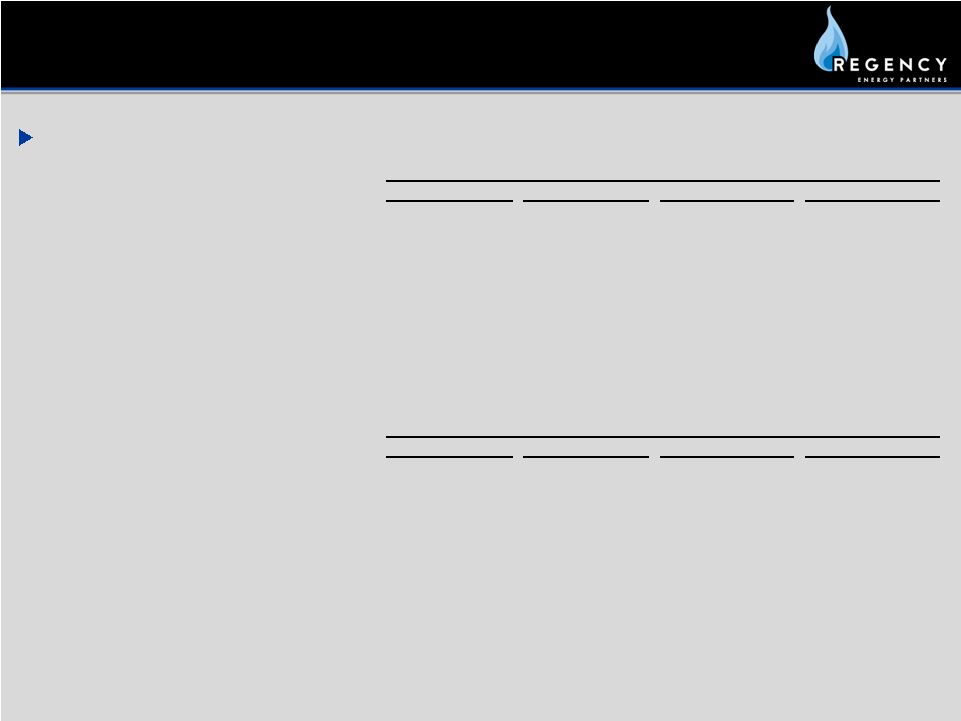
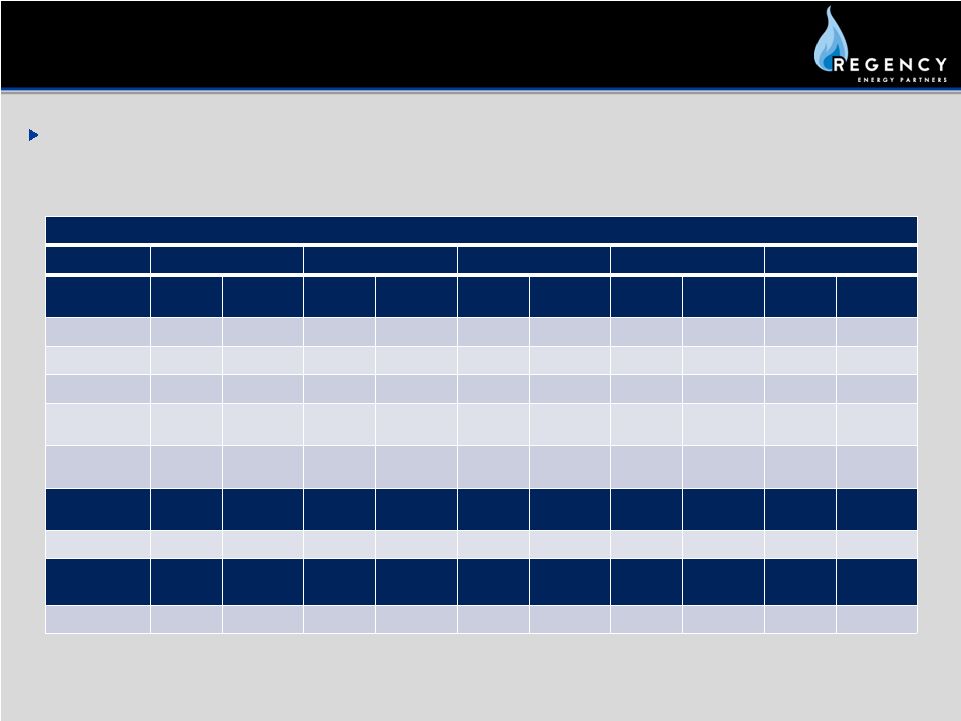 Executed Hedges by Product
2011
Q1 2012
Q2 2012
Q3 2012
Q4 2012
Bbl/d
Price
($/gal)
Bbl/d
Price
($/gal)
Bbl/d
Price
($/gal)
Bbl/d
Price
($/gal)
Bbl/d
Price
($/gal)
Ethane
1,639
$0.50
1,530
$0.47
1,020
$0.46
510
$0.47
-
-
Propane
855
$1.00
730
$1.01
730
$1.05
490
$1.10
250
$1.18
Iso Butane
-
-
-
-
-
-
-
-
-
-
Normal
Butane
536
$1.34
440
$1.36
440
$1.45
300
$1.53
150
$1.62
Natural
Gasoline
295
$1.71
230
$1.75
270
$1.94
160
$2.05
80
$2.19
Bbl/d
Price
($/Bbl)
Bbl/d
Price
($/Bbl)
Bbl/d
Price
($/Bbl)
Bbl/d
Price
($/Bbl)
Bbl/d
Price
($/Bbl)
WTI
704
$83.24
640
$84.46
630
$90.36
410
$93.66
200
$98.95
MMbtu/d
Price
($/MMbtu)
MMbtu/d
Price
($/MMbtu)
MMbtu/d
Price
($/MMbtu)
MMbtu/d
Price
($/MMbtu)
MMbtu/d
Price
($/MMbtu)
Natural Gas
8,000
$5.40
5,000
$5.04
5,000
$4.79
-
-
-
-
C
3
+ is hedged for 2012 at higher prices than 2011 (8-15%), while natural gas and
ethane are both hedged at lower prices (6-8%)
16
Commodity Price Risk Management |
 Regency
has
length
in
natural
gas
due
to
a
concerted
effort
to
minimize
“keep-whole”
exposure
A $10.00 per Bbl movement in crude along with the same percentage change in NGL pricing
would result in a $1.2 million change in Regency’s forecasted 2011
DCF A $1.00 per MMbtu movement in natural gas pricing would result in a $0.5
million change in Regency’s forecasted 2011 DCF
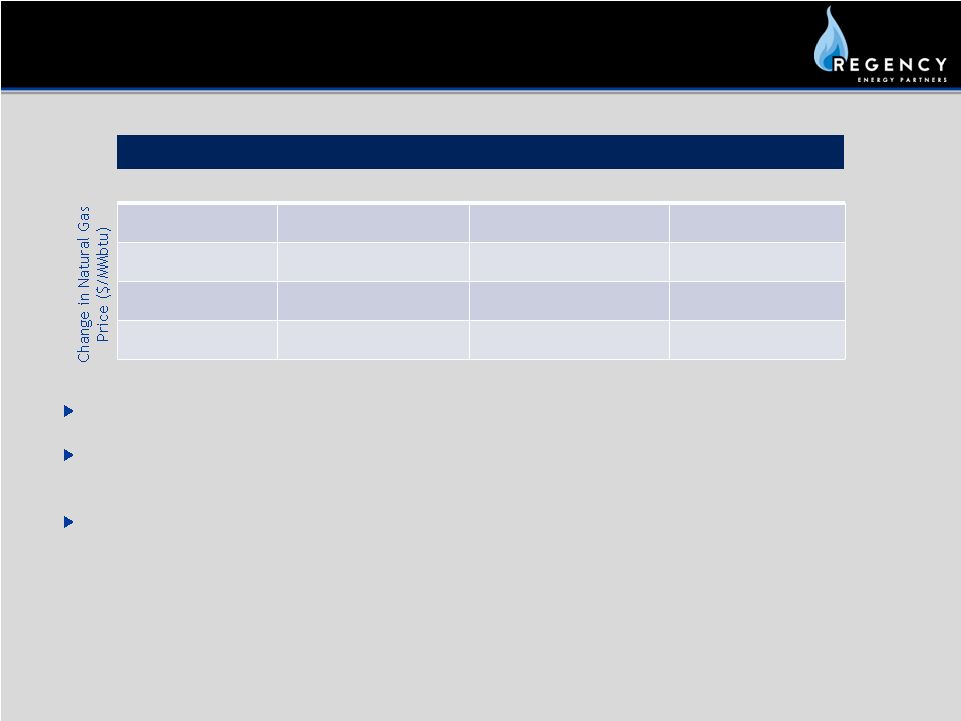
DCF Sensitivity to Commodity Price Changes –
2011
1
($ in millions)
Decrease $10.00
Flat
Increase $10.00
Decrease $1.00
$ (1.7)
$ (0.5)
$ 0.7
Flat
$ (1.2)
$ 0
$ 1.2
Increase $1.00
$ (0.7)
$0.5
$ 1.7
Change in WTI Price ($/Bbl)
17
Commodity Price Risk Management
1
Based on Regency’s 2011 projections |
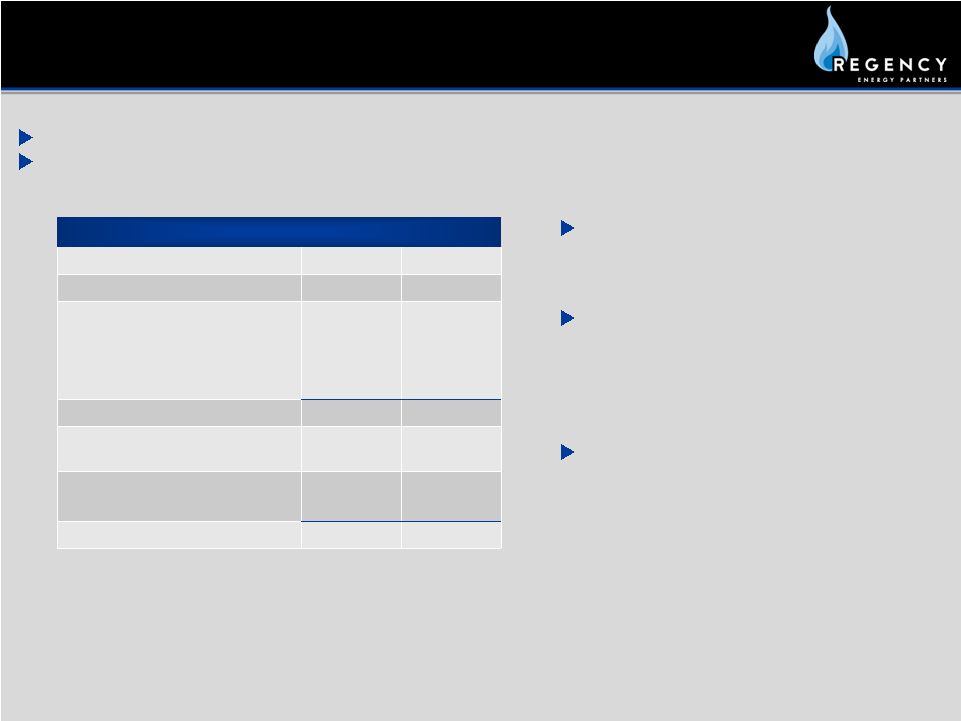 Raised
approximately $408 million of equity in August 2010 Completed a $600 million debt
restructuring/maturity extension in October 2010 18
Strong Liquidity Position
Capitalization
($ in millions)
12/31/2009
12/31/2010
Cash
$10
$9
Long-Term Debt
Revolving Credit Facility
Senior Notes Due 2013
Senior Notes Due 2016
Senior Notes Due 2018
$420
358
236
-
$285
-
256
600
Total Long-Term Debt
$1,014
$1,141
Series A Convertible Redeemable
Preferred Units
$52
$71
Partners’
Capital¹
Noncontrolling
Interest
$1,229
14
$3,261
32
Total Capitalization
$2,309
$4,505
1
Includes common units, general partner interest and accumulated other comprehensive
loss Regency’s debt maturity profile has
been extended from 4.4 years to
6.2 years
Of the $285 million drawn on the
revolving credit facility at year end,
$250 million of floating interest rate
exposure is hedged via swaps at 1.325%
through April 2012
Regency currently has over $500 million
of available liquidity on our revolving
credit facility |
 Q&A |
 Appendix |
 Consolidated Operating Results
21
December 31, 2010
December 31, 2009 (1)
REVENUES
Gas sales, including related party amounts
519,344
$
476,077
$
NGL sales, including related party amounts
390,879
239,255
Gathering, transportation and other fees, including related party
amounts 293,295
270,071
Net realized and unrealized gain from derivatives
(8,582)
37,712
Other, including related party amounts
26,727
20,162
Total revenues
1,221,663
1,043,277
OPERATING COSTS AND EXPENSES
Cost of sales, including related party amounts
862,105
674,944
Operation and maintenance
125,650
117,080
General and administrative, including related party amounts
80,951
57,863
Loss (gain) on asset sales, net
516
(133,282)
Depreciation and amortization
117,751
100,098
Total operating costs and expenses
1,186,973
816,703
OPERATING INCOME
34,690
226,574
Income from unconsolidated subsidiaries
69,365
7,886
Interest expense, net
(82,792)
(77,665)
Loss on debt refinancing, net
(17,528)
-
Other income and deductions, net
(12,126)
(15,132)
(LOSS) INCOME BEFORE INCOME TAXES
(8,391)
141,663
Income tax (benefit) expense
956
(1,095)
(LOSS) INCOME FROM CONTINUING OPERATIONS
(9,347)
142,758
DISCONTINUED OPERATIONS
Net loss from operations of east Texas assets
(1,571)
(2,269)
NET (LOSS) INCOME
(10,918)
$
140,489
$
Net
income attributable to noncontrolling interest
(562)
(91)
NET (LOSS) INCOME ATTRIBUTABLE TO REGENCY ENERGY PARTNERS LP
(11,480)
$
140,398
$
(1)
Amounts differ from previously disclosed amounts due to the presentation as discontinued operations for the disposition of east Texas assets.
Year Ended
Regency Energy Partners LP
Consolidated Statements of Operations
($ in thousands) |
 Gathering and Processing Segment
22
December 31, 2010
September 30, 2010
June 30, 2010
March 31, 2010
Gathering and Processing Segment
Financial data:
Segment margin (1)
52,915
$
42,723
$
49,568
$
50,802
$
Adjusted segment margin (1)
59,731
56,690
55,162
54,608
Operating data:
Throughput (MMbtu/d) (1)
1,029,597
950,583
1,002,089
1,005,172
NGL gross production (Bbls/d)
29,327
26,930
25,168
23,118
($ in thousands)
Three Months Ended
December 31, 2009
September 30, 2009
June 30, 2009
March 31, 2009
Gathering and Processing Segment
Financial data:
Segment margin (1)
50,982
$
54,718
$
54,321
$
53,899
$
Adjusted segment margin (1)
52,139
50,984
52,458
51,188
Operating data:
Throughput (MMbtu/d) (1)
1,000,748
932,830
959,280
1,011,588
NGL gross production (Bbls/d)
22,725
20,334
21,185
20,151
Three Months Ended
($ in thousands)
(1) Segment margin and adjusted segment margin vary from previously
disclosed amounts due to the presentation of discontinued operations for the disposition
of east Texas assets, as well as a functional reorganization of our
operating segments. (1) Segment margin
and adjusted segment margin vary from previously disclosed amounts due to the presentation of discontinued operations for the
disposition of east Texas assets, as well as a functional
reorganization of our operating segments. |
 Contract Compression Segment
23
December 31, 2010
September 30, 2010
June 30, 2010
March 31, 2010
Contract Compression Segment (1)
Financial data:
Segment margin
40,855
$
38,510
$
37,814
$
37,030
$
Operating data:
Revenue generating horsepower
844,800
823,369
790,494
759,704
Average horsepower per revenue generating
832
861
853
858
compression unit
(1) Segment margin varies from previously disclosed amounts due to a
functional reorganization of our operating segments. Three Months
Ended ($ in thousands)
December 31, 2009
September 30, 2009
June 30, 2009
March 31, 2009
Contract Compression Segment (1)
Financial data:
Segment margin
34,163
$
34,085
$
35,800
$
36,980
$
Operating data:
Revenue generating horsepower
753,328
743,289
767,060
789,494
Average horsepower per revenue generating
849
836
846
858
compression unit
(1) Segment margin varies from previously disclosed amounts due to a
functional reorganization of our operating segments. Three Months
Ended ($ in thousands) |
 Contract Treating Segment
24
December 31, 2010
September 30, 2010
June 30, 2010
March 31, 2010
Contract Treating Segment
Financial data:
Segment margin
8,725
$
2,729
$
-
$
-
$
Operating data:
Revenue generating gallons per minute
3,431
3,093
-
-
Three Months Ended
($ in thousands)
December 31, 2009
September 30, 2009
June 30, 2009
March 31, 2009
Contract Treating Segment
Financial data:
Segment margin
-
$
-
$
-
$
-
$
Operating data:
Revenue generating gallons per minute
-
-
-
-
Three Months Ended
($ in thousands) |
 Corporate and Others Segment
25
December 31, 2010
September 30, 2010
June 30, 2010
March 31, 2010
Corporate & Others (1)
Financial data:
Segment margin
5,341
$
5,763
$
4,974
$
5,014
$
(1) Segment margin varies from previously disclosed amounts due to a
functional reorganization of our operating segments. Three Months
Ended ($ in thousands)
December 31, 2009
September 30, 2009
June 30, 2009
March 31, 2009
Corporate & Others (1)
Financial data:
Segment margin
1,964
$
1,901
$
1,754
$
656
$
(1) Segment margin varies from previously disclosed amounts due to a
functional reorganization of our operating segments. Three Months
Ended ($ in thousands) |
 Transportation Segment –
Haynesville Joint Venture
26
The following provides key performance measures for 100% of the Haynesville Joint
Venture December 31, 2010
September 30, 2010
June 30, 2010
March 31, 2010
Transportation Segment - Haynesville Joint Venture
Financial data:
Segment margin
47,450
$
49,121
$
43,897
$
33,879
$
Operating data:
Throughput (MMbtu/d)
1,543,570
1,519,716
1,155,692
882,626
Three Months Ended
($ in thousands)
December 31, 2009
September 30, 2009
June 30, 2009
March 31, 2009
Transportation Segment - Haynesville Joint Venture
Financial data:
Segment margin
12,157
$
13,535
$
12,803
$
13,556
$
Operating data:
Throughput (MMbtu/d)
640,166
735,565
745,178
810,848
Three Months Ended
($ in thousands) |
 Transportation Segment –
MEP Joint Venture
27
The following provides key performance measures for 100% of the MEP Joint Venture
December 31, 2010
September 30, 2010
June 30, 2010
March 31, 2010
Transportation Segment - MEP Joint Venture (1)
Financial data:
Segment margin
57,799
$
56,197
$
51,033
$
47,316
$
Operating
data: Throughput (MMbtu/d) (2)
1,541,533
1,432,783
1,310,363
1,348,044
(2) Due to pooling of
interest corrections the MEP volume data has been revised for the quarters ended March 31, 2010 and September 30, 2010.
($ in thousands)
Three Months Ended
(1) On May 26, 2010, the Partnership purchased a 49.9 percent interest
in MEP Joint Venture from ETE. The financial and operating data are presented at 100
percent of MEP Joint Venture.
December 31, 2009
September 30, 2009
June 30, 2009
March 31, 2009
Transportation Segment - MEP Joint Venture (1)
Financial data:
Segment margin
46,199
$
34,220
$
8,614
$
421
$
Operating data:
Throughput (MMbtu/d)
1,236,620
994,924
463,802
-
Three Months Ended
($ in thousands)
(1) On May 26, 2010, the Partnership purchased a 49.9 percent interest
in MEP Joint Venture from ETE. The financial and operating data are presented at 100
percent of MEP Joint Venture. |
 Non-GAAP Reconciliation
28
2010
2009
2008
Net (loss) income
(10,918)
$
140,489
$
101,328
$
Add (deduct):
Interest expense, net
82,971
77,996
63,243
Depreciation and amortization
122,725
109,893
102,566
Income tax expense (benefit)
956
(1,095)
(266)
EBITDA (1) (2)
195,734
$
327,283
$
266,871
$
Add (deduct):
Non-cash loss (gain) from derivatives
42,613
5,163
(14,708)
Non-cash unit based compensation (3)
13,727
5,834
4,318
Loss (gain) on asset sales, net
591
(133,284)
472
Income from unconsolidated subsidiaries
(69,365)
(7,886)
-
Partnership's
ownership
interest
in
Haynesville
Joint
Venture's
adjusted
EBITDA
(4)
67,014
11,398
-
Partnership's
ownership
interest
in
MEP
Joint
Venture's
adjusted
EBITDA
(5)
55,682
-
-
Loss on debt refinancing, net
17,528
-
-
Other expense, net
3,432
2,486
2,374
Adjusted EBITDA (6)
326,956
$
210,994
$
259,327
$
(1) Earnings before interest, taxes, depreciation and
amortization. (4) 100%
of
Haynesville
Joint Venture's Adjusted EBITDA is calculated as follows:
Net income Haynesville Joint Venture
106,737
$
19,734
$
-
$
Add:
Depreciation and amortization
31,797
8,514
-
Interest expense
526
158
-
Gain on insurance settlement
(242)
-
-
Loss on sale of asset, net
105
-
-
Other expense, net
14
50
-
Haynesville Joint Venture's Adjusted EBITDA
138,937
$
28,456
$
-
$
Net income MEP Joint Venture
42,529
$
-
$
-
$
Add:
Depreciation and amortization
40,104
-
-
Total other income (expense)
28,954
-
-
MEP Joint Venture's Adjusted EBITDA
111,587
$
-
$
-
$
Year Ended December 31,
($ in thousands)
(3)
The
Partnership
added
non-cash
unit
based
compensation
as
a
reconciling
item
from
EBITDA
to
adjusted
EBITDA. Previous comparative periods have been restated.
(5)
100%
of
MEP
Joint
Venture's
Adjusted
EBITDA
is
calculated
as
followsand
represents
the
period
from
May
26, 2010 to December 31, 2010, as the Partnership acquired its 49.9
percent ownership interest on May 26, 2010: (6) Adjusted EBITDA and Combined
Adjusted EBITDA differs from previously disclosed amounts as a result of
the inclusion of income from unconsolidated subsidiary to account for
Regency's income from the Haynesville Joint Venture and the inclusion of
non-cash unit based compensation as a reconciling item to Adjusted EBITDA.
(2) EBITDA varies from previously disclosed amounts as a result
of new accounting pronouncement that requires disclosing non-controlling interest in income
separately on the face of the income statement. |
 Non-GAAP Reconciliation
29
2010
2009
2008
Net (loss) income
(10,918)
$
140,489
$
101,328
$
Add (Deduct):
Operation and maintenance
125,650
117,080
119,715
General and administrative
80,951
57,863
51,323
Loss (gain) loss on asset sales, net
516
(133,282)
457
Management services termination fee
-
-
3,888
Transaction expenses
-
-
1,620
Depreciation and amortization
117,751
100,098
93,393
Income from unconsolidated subsidiaries
(69,365)
(7,886)
-
Interest expense, net
82,792
77,665
62,940
Loss on debt refinancing, net
17,528
-
-
Other income and deductions, net
12,126
15,132
(328)
Income tax expense (benefit)
956
(1,095)
(266)
Discontinued operations
1,571
2,269
(13,931)
Total Segment Margin (1)
359,558
368,333
420,139
Non-cash loss (gain) from derivatives
30,183
(7,151)
(17,996)
Adjusted Total Segment Margin (1)
389,741
361,182
402,143
Transportation Segment Margin (1) (2)
-
11,714
66,888
Contract Compression Segment Margin (1)
154,209
141,028
125,503
Contract Treating Segment Margin (1)
11,454
-
-
Corporate & Others Segment Margin (1)
21,092
6,275
815
Inter-segment Elimination
(23,205)
(4,604)
(4,573)
Adjusted Gathering and Processing Segment Margin (1)
226,191
$
206,769
$
213,510
$
Year Ended December 31,
($ in thousands)
(1) Segment margin and adjusted segment margin vary from previously
disclosed amounts due to the presentation of discontinued operations for the
disposition of east Texas assets, a functional reorganization of our
operating segments, as well as inter-segment eliminations. (2) Transportation segment margin and adjusted transportation
segment margin represent Regency's 100% ownership in RIGS prior to contribution of
RIGS to the Haynesville Joint Venture.
|
 Non-GAAP Reconciliation
30
Three Months Ended
December 31, 2010
($ in thousands)
Net cash flows provided by operating activities
41,304
$
Add
(deduct): Depreciation and amortization, including debt issuance
cost amortization (34,556)
Write-off of debt issuance costs
1,422
Amortization of excess fair value of unconsolidated subsidiaries
(3,410)
Income from unconsolidated subsidiaries
27,028
Derivative valuation change
(18,352)
Loss on asset sales, net
(78)
Unit based compensation expenses
(1,387)
Trade accounts receivables, accrued revenues, and related party
receivables 13,708
Other current assets
1,010
Trade
accounts
payable,
accrued
cost
of
gas
and
liquids,
related
party
payables
and
deferred
revenues
(14,724)
Other current liabilities
4,667
Distributions received from unconsolidated subsidiaries
(27,028)
Other assets and liabilities
1,473
Net loss
(8,923)
$
Add:
Interest expense, net
19,791
Depreciation and amortization
33,217
Income tax benefit
(143)
EBITDA
43,942
$
Add
(deduct): Non-cash loss from derivatives
18,922
Non-cash unit based compensation
1,386
Loss on asset sales, net
78
Income from unconsolidated subsidiaries
(23,618)
Partnership's ownership interest in Haynesville Joint Venture's
adjusted EBITDA 20,374
Partnership's ownership interest in MEP Joint Venture’s adjusted
EBITDA 24,095
Loss on debt refinancing, net
15,748
Other expense, net
831
Adjusted EBITDA
101,758
$
Add
(deduct): Interest expense, excluding capitalized interest
(19,552)
Maintenance capital expenditures
(4,164)
Proceeds from asset disposal
128
Convertible preferred distribution
(1,945)
Joint venture adjustments (1)
(7,844)
Others
304
Cash available for distribution
68,685
$
(1) Adjustments for the
Partnership's share of the Haynesville Joint Venture's and MEP Joint Venture's adjustments between their respective
adjusted EBITDA and cash available for distribution. Adjustments
include interest expense, maintenance capital expenditures and the Haynesville
Joint Venture's non-cash portion of the general and
administrative management fee. |