Attached files
| file | filename |
|---|---|
| 8-K - FORM 8-K - POPULAR, INC. | g26171e8vk.htm |
Exhibit 99.1

| Fourth Quarter 2010 Financial Results Stern Agee Financial Services Symposium February 17, 2011 |

| 1 Forward Looking Statements Statements contained in this Presentation that are not based on current or historical fact are forward-looking in nature. Such forward-looking statements are based on current plans, estimates and expectations and are made pursuant to the Private Securities Litigation Reform Act of 1995. Forward-looking statements are based on known and unknown risks, assumptions, uncertainties and other factors. The Company's actual results, performance, or achievements may differ materially from any future results, performance, or achievements expressed or implied by such forward-looking statements. The Company undertakes no obligation to publicly update or revise any forward-looking statement. The financial information included in this presentation for the year and quarter ended December 31, 2010 is based on preliminary unaudited data and is subject to change. Please refer to our Annual Report on Form 10-K and other SEC reports for a discussion of those factors that could impact our future results. |
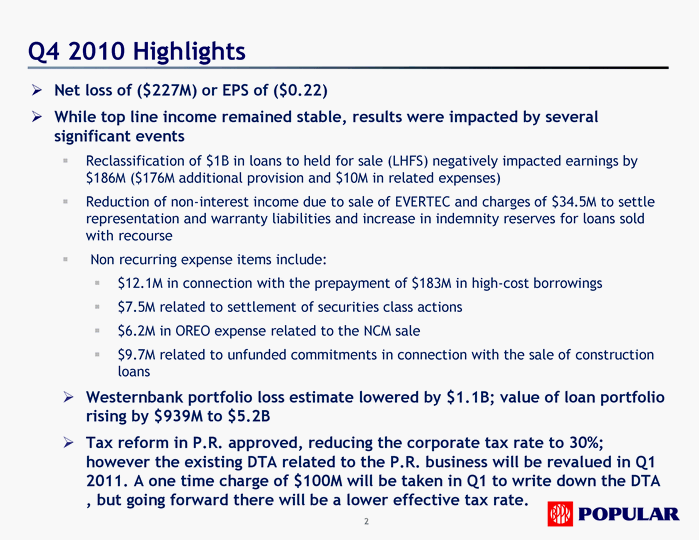
| Q4 2010 Highlights 2 Net loss of ($227M) or EPS of ($0.22) While top line income remained stable, results were impacted by several significant events Reclassification of $1B in loans to held for sale (LHFS) negatively impacted earnings by $186M ($176M additional provision and $10M in related expenses) Reduction of non-interest income due to sale of EVERTEC and charges of $34.5M to settle representation and warranty liabilities and increase in indemnity reserves for loans sold with recourse Non recurring expense items include: $12.1M in connection with the prepayment of $183M in high-cost borrowings $7.5M related to settlement of securities class actions $6.2M in OREO expense related to the NCM sale $9.7M related to unfunded commitments in connection with the sale of construction loans Westernbank portfolio loss estimate lowered by $1.1B; value of loan portfolio rising by $939M to $5.2B Tax reform in P.R. approved, reducing the corporate tax rate to 30%; however the existing DTA related to the P.R. business will be revalued in Q1 2011. A one time charge of $100M will be taken in Q1 to write down the DTA , but going forward there will be a lower effective tax rate. |
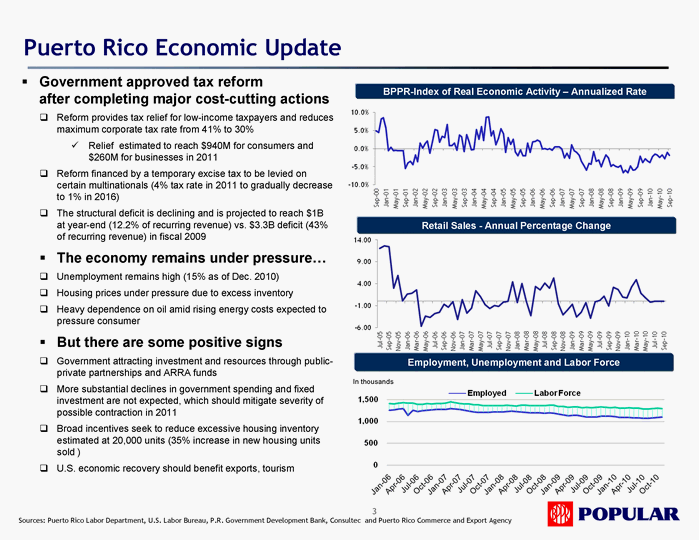
| 3 Puerto Rico Economic Update BPPR-Index of Real Economic Activity - Annualized Rate Retail Sales - Annual Percentage Change Employment, Unemployment and Labor Force Sources: Puerto Rico Labor Department, U.S. Labor Bureau, P.R. Government Development Bank, Consultec and Puerto Rico Commerce and Export Agency January 2000 - April 2010 In thousands Government approved tax reform after completing major cost-cutting actions Reform provides tax relief for low-income taxpayers and reduces maximum corporate tax rate from 41% to 30% Relief estimated to reach $940M for consumers and $260M for businesses in 2011 Reform financed by a temporary excise tax to be levied on certain multinationals (4% tax rate in 2011 to gradually decrease to 1% in 2016) The structural deficit is declining and is projected to reach $1B at year-end (12.2% of recurring revenue) vs. $3.3B deficit (43% of recurring revenue) in fiscal 2009 The economy remains under pressure... Unemployment remains high (15% as of Dec. 2010) Housing prices under pressure due to excess inventory Heavy dependence on oil amid rising energy costs expected to pressure consumer But there are some positive signs Government attracting investment and resources through public- private partnerships and ARRA funds More substantial declines in government spending and fixed investment are not expected, which should mitigate severity of possible contraction in 2011 Broad incentives seek to reduce excessive housing inventory estimated at 20,000 units (35% increase in new housing units sold ) U.S. economic recovery should benefit exports, tourism |
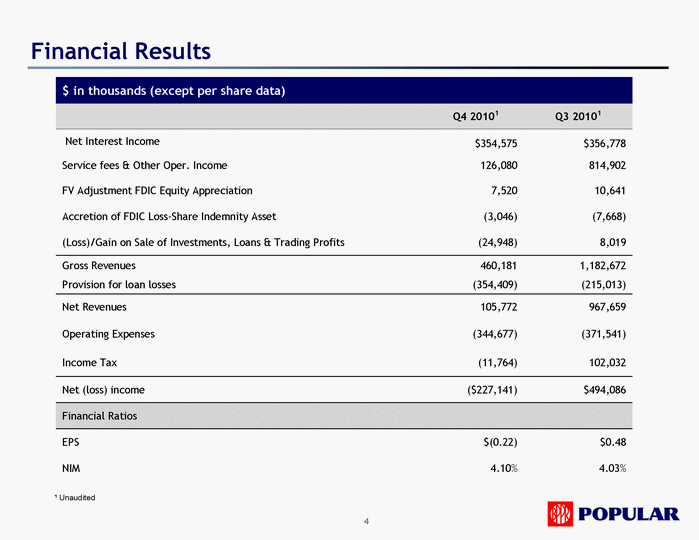
| 4 Financial Results 1 Unaudited $ in thousands (except per share data) $ in thousands (except per share data) $ in thousands (except per share data) Q4 20101 Q3 20101 Net Interest Income $354,575 $356,778 Service fees & Other Oper. Income 126,080 814,902 FV Adjustment FDIC Equity Appreciation 7,520 10,641 Accretion of FDIC Loss-Share Indemnity Asset (3,046) (7,668) (Loss)/Gain on Sale of Investments, Loans & Trading Profits (24,948) 8,019 Gross Revenues 460,181 1,182,672 Provision for loan losses (354,409) (215,013) Net Revenues 105,772 967,659 Operating Expenses (344,677) (371,541) Income Tax (11,764) 102,032 Net (loss) income ($227,141) $494,086 Financial Ratios EPS $(0.22) $0.48 NIM 4.10% 4.03% |
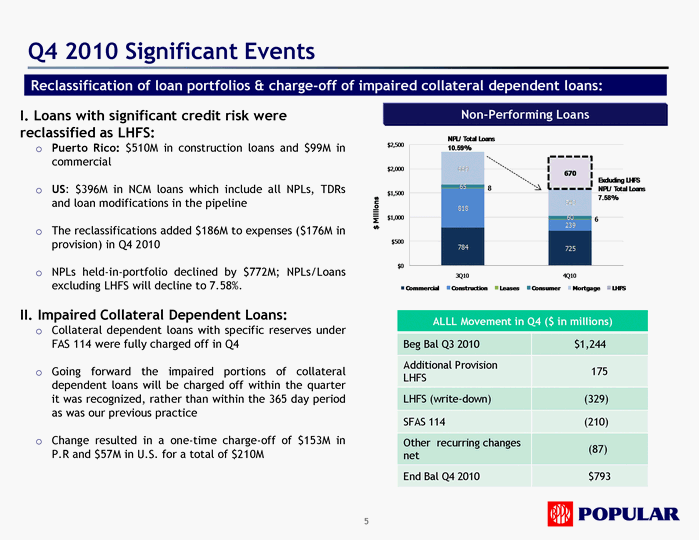
| Q4 2010 Significant Events 5 Reclassification of loan portfolios & charge-off of impaired collateral dependent loans: I. Loans with significant credit risk were reclassified as LHFS: Puerto Rico: $510M in construction loans and $99M in commercial US: $396M in NCM loans which include all NPLs, TDRs and loan modifications in the pipeline The reclassifications added $186M to expenses ($176M in provision) in Q4 2010 NPLs held-in-portfolio declined by $772M; NPLs/Loans excluding LHFS will decline to 7.58%. II. Impaired Collateral Dependent Loans: Collateral dependent loans with specific reserves under FAS 114 were fully charged off in Q4 Going forward the impaired portions of collateral dependent loans will be charged off within the quarter it was recognized, rather than within the 365 day period as was our previous practice Change resulted in a one-time charge-off of $153M in P.R and $57M in U.S. for a total of $210M ALLL Movement in Q4 ($ in millions) ALLL Movement in Q4 ($ in millions) Beg Bal Q3 2010 $1,244 Additional Provision LHFS 175 LHFS (write-down) (329) SFAS 114 (210) Other recurring changes net (87) End Bal Q4 2010 $793 Non-Performing Loans |
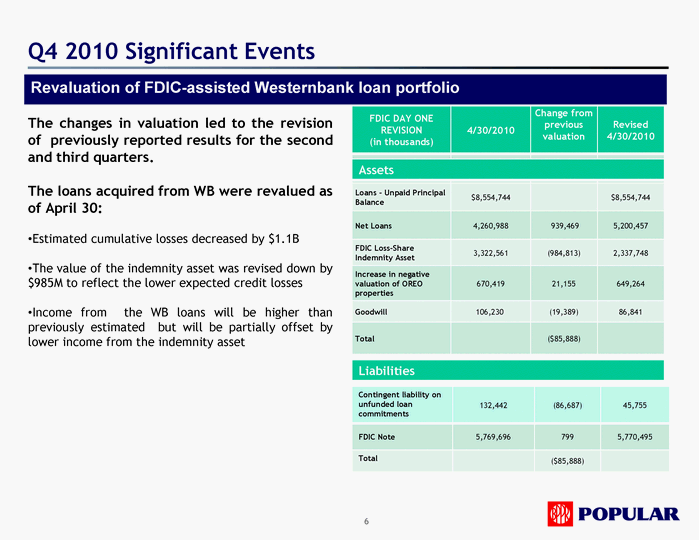
| Q4 2010 Significant Events 6 Revaluation of FDIC-assisted Westernbank loan portfolio The changes in valuation led to the revision of previously reported results for the second and third quarters. The loans acquired from WB were revalued as of April 30: Estimated cumulative losses decreased by $1.1B The value of the indemnity asset was revised down by $985M to reflect the lower expected credit losses Income from the WB loans will be higher than previously estimated but will be partially offset by lower income from the indemnity asset FDIC DAY ONE REVISION (in thousands) 4/30/2010 Change from previous valuation Revised 4/30/2010 Loans - Unpaid Principal Balance $8,554,744 $8,554,744 Net Loans 4,260,988 939,469 5,200,457 FDIC Loss-Share Indemnity Asset 3,322,561 (984,813) 2,337,748 Increase in negative valuation of OREO properties 670,419 21,155 649,264 Goodwill 106,230 (19,389) 86,841 Total ($85,888) Contingent liability on unfunded loan commitments 132,442 (86,687) 45,755 FDIC Note 5,769,696 799 5,770,495 Total ($85,888) Liabilities Assets |
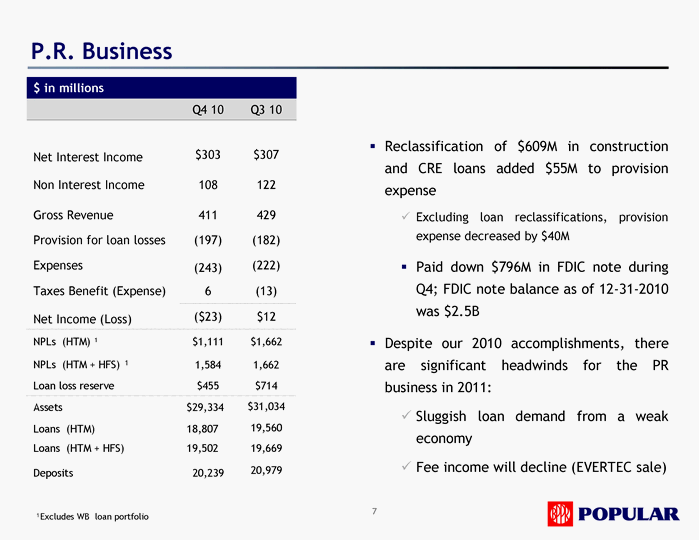
| 7 P.R. Business Reclassification of $609M in construction and CRE loans added $55M to provision expense Excluding loan reclassifications, provision expense decreased by $40M Paid down $796M in FDIC note during Q4; FDIC note balance as of 12-31-2010 was $2.5B Despite our 2010 accomplishments, there are significant headwinds for the PR business in 2011: Sluggish loan demand from a weak economy Fee income will decline (EVERTEC sale) 1Excludes WB loan portfolio $ in millions Q4 10 Q3 10 Net Interest Income $303 $307 Non Interest Income 108 122 Gross Revenue 411 429 Provision for loan losses (197) (182) Expenses (243) (222) Taxes Benefit (Expense) 6 (13) Net Income (Loss) ($23) $12 NPLs (HTM) 1 $1,111 $1,662 NPLs (HTM + HFS) 1 1,584 1,662 Loan loss reserve $455 $714 Assets $29,334 $31,034 Loans (HTM) 18,807 19,560 Loans (HTM + HFS) 19,502 19,669 Deposits 20,239 20,979 |
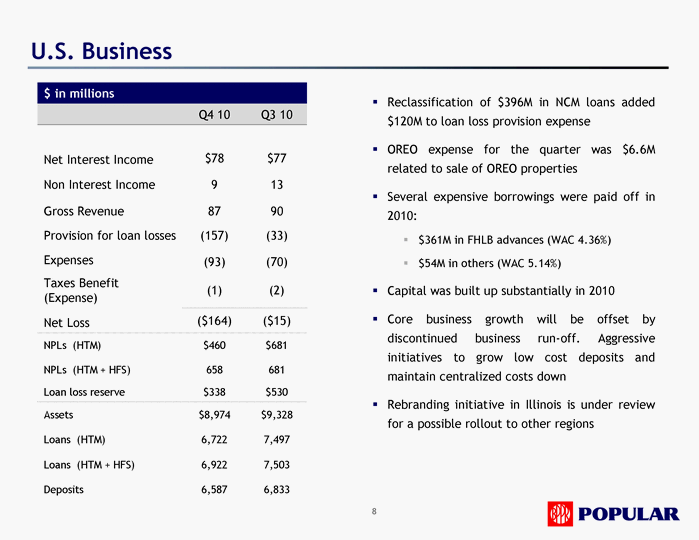
| 8 U.S. Business $ in millions Q4 10 Q3 10 Net Interest Income $78 $77 Non Interest Income 9 13 Gross Revenue 87 90 Provision for loan losses (157) (33) Expenses (93) (70) Taxes Benefit (Expense) (1) (2) Net Loss ($164) ($15) NPLs (HTM) $460 $681 NPLs (HTM + HFS) 658 681 Loan loss reserve $338 $530 Assets $8,974 $9,328 Loans (HTM) 6,722 7,497 Loans (HTM + HFS) 6,922 7,503 Deposits 6,587 6,833 Reclassification of $396M in NCM loans added $120M to loan loss provision expense OREO expense for the quarter was $6.6M related to sale of OREO properties Several expensive borrowings were paid off in 2010: $361M in FHLB advances (WAC 4.36%) $54M in others (WAC 5.14%) Capital was built up substantially in 2010 Core business growth will be offset by discontinued business run-off. Aggressive initiatives to grow low cost deposits and maintain centralized costs down Rebranding initiative in Illinois is under review for a possible rollout to other regions |
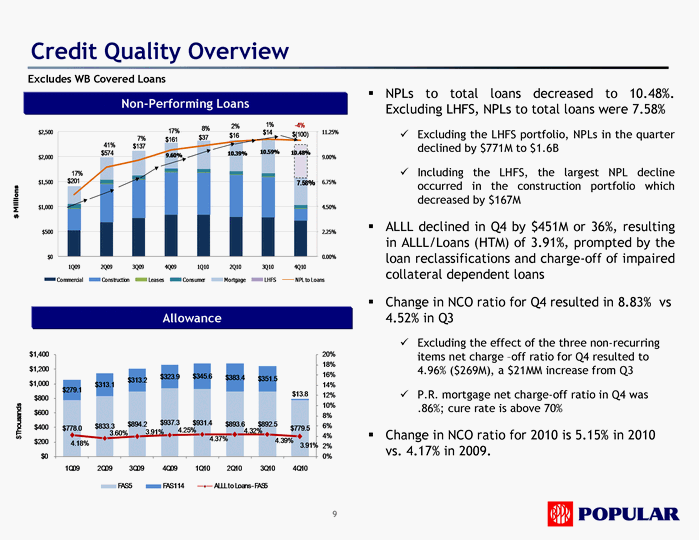
| Credit Quality Overview Non-Performing Loans Excludes WB Covered Loans 9 NPLs to total loans decreased to 10.48%. Excluding LHFS, NPLs to total loans were 7.58% Excluding the LHFS portfolio, NPLs in the quarter declined by $771M to $1.6B Including the LHFS, the largest NPL decline occurred in the construction portfolio which decreased by $167M ALLL declined in Q4 by $451M or 36%, resulting in ALLL/Loans (HTM) of 3.91%, prompted by the loan reclassifications and charge-off of impaired collateral dependent loans Change in NCO ratio for Q4 resulted in 8.83% vs 4.52% in Q3 Excluding the effect of the three non-recurring items net charge -off ratio for Q4 resulted to 4.96% ($269M), a $21MM increase from Q3 P.R. mortgage net charge-off ratio in Q4 was .86%; cure rate is above 70% Change in NCO ratio for 2010 is 5.15% in 2010 vs. 4.17% in 2009. Allowance |
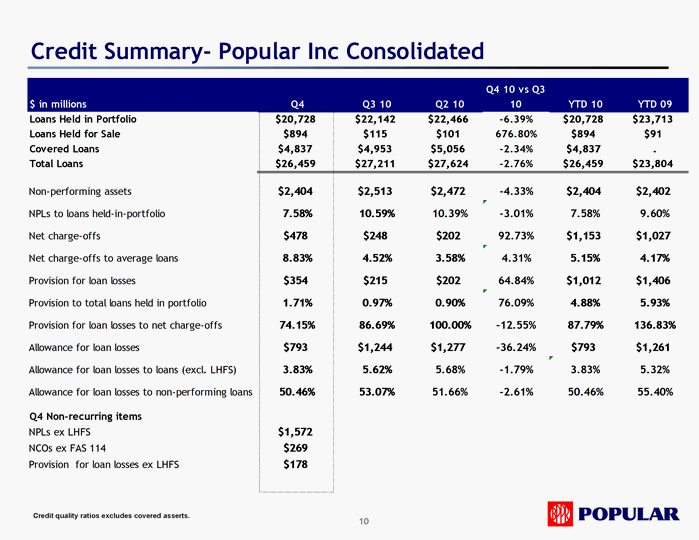
| 10 Credit Summary- Popular Inc Consolidated Credit quality ratios excludes covered asserts. |
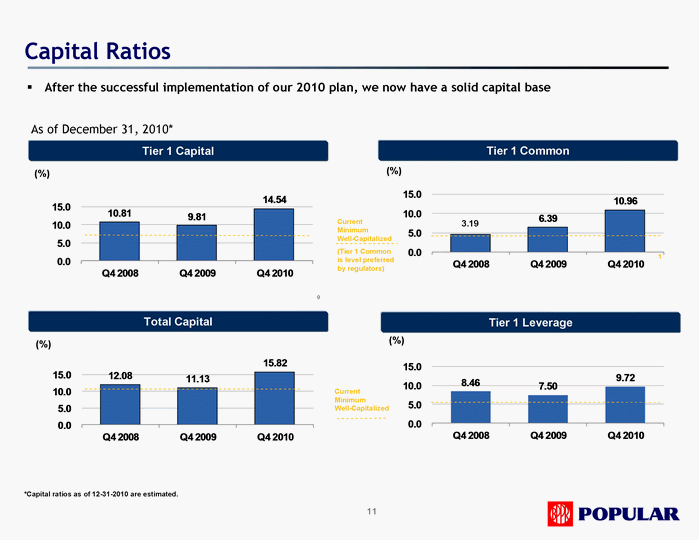
| 11 Capital Ratios As of December 31, 2010* (%) Total Capital Tier 1 Capital (%) Tier 1 Common (%) Tier 1 Leverage (%) After the successful implementation of our 2010 plan, we now have a solid capital base () *Capital ratios as of 12-31-2010 are estimated. Current Minimum Well-Capitalized (Tier 1 Common is level preferred by regulators) Current Minimum Well-Capitalized 1 3.19 |
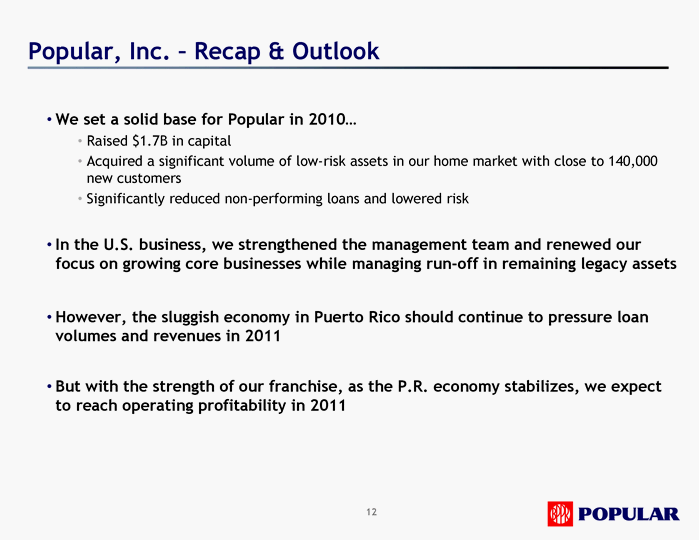
| We set a solid base for Popular in 2010... Raised $1.7B in capital Acquired a significant volume of low-risk assets in our home market with close to 140,000 new customers Significantly reduced non-performing loans and lowered risk In the U.S. business, we strengthened the management team and renewed our focus on growing core businesses while managing run-off in remaining legacy assets However, the sluggish economy in Puerto Rico should continue to pressure loan volumes and revenues in 2011 But with the strength of our franchise, as the P.R. economy stabilizes, we expect to reach operating profitability in 2011 Popular, Inc. - Recap & Outlook 12 |
