Attached files
Table of Contents
UNITED STATES
SECURITIES AND EXCHANGE COMMISSION
Washington, D.C. 20549
FORM 10-K
(Mark One)
| x | Annual Report Pursuant to Section 13 or 15(d) of the Securities Exchange Act of 1934 For the fiscal year ended December 31, 2010 |
or
| ¨ | Transition Report Pursuant to Section 13 or 15(d) of the Securities Exchange Act of 1934 |
For the transition period from to
Commission file Number 0-18490
K•SWISS INC.
(Exact name of registrant as specified in its charter)
| Delaware | 95-4265988 | |
| (State or other jurisdiction of incorporation or organization) |
(I.R.S. Employer Identification Number) | |
| 31248 Oak Crest Drive, Westlake Village, California |
91361 | |
| (Address of principal executive offices) | (Zip Code) | |
Registrant’s telephone number, including area code (818) 706-5100
Securities registered pursuant to Section 12(b) of the Act:
| Title of each Class |
Name of each exchange on which registered | |
| Class A Common Stock, par value $0.01 per share | NASDAQ |
Securities registered pursuant to Section 12(g) of the Act:
None
(Title of class)
Indicate by check mark if the registrant is a well-known seasoned issuer, as defined in Rule 405 of the Securities Act. x Yes ¨ No
Indicate by check mark if the registrant is not required to file reports pursuant to Section 13 or Section 15(d) of the Act. ¨ Yes x No
Indicate by check mark whether the registrant: (1) has filed all reports required to be filed by Section 13 or 15(d) of the Securities Exchange Act of 1934 during the preceding 12 months (or for such shorter period that the Registrant was required to file such reports), and (2) has been subject to such filing requirements for the past 90 days. x Yes ¨ No
Indicate by check mark whether the registrant has submitted electronically and posted on its corporate Web site, if any, every Interactive Data File required to be submitted and posted pursuant to Rule 405 of Regulation S-T (§ 232.405 of this chapter) during the preceding 12 months (or for such shorter period that the registrant was required to submit and post such files). ¨ Yes ¨ No
Indicate by check mark if disclosure of delinquent filers pursuant to Item 405 of Regulation S-K is not contained herein, and will not be contained, to the best of Registrant’s knowledge, in definitive proxy or information statements incorporated by reference in Part III of this Form 10-K or any amendment to this Form 10-K. ¨
Indicate by check mark whether the registrant is a large accelerated filer, an accelerated filer, a non-accelerated filer or a smaller reporting company. See definition of “large accelerated filer,” “accelerated filer” and “smaller reporting company” in Rule 12b-2 of the Exchange Act. (Check one):
Large accelerated filer ¨ Accelerated filer x Non-accelerated filer ¨ Smaller reporting company ¨
Indicate by check mark whether the registrant is a shell company (as defined in Rule 12b-2 of the Act. ¨ Yes x No
The aggregate market value of the Class A Common Stock of the Registrant held by non-affiliates of the Registrant as of June 30, 2010, the last business day of the Registrant’s most recently completed second fiscal quarter, based on the closing price of the Class A Common Stock on the Nasdaq Global Select Market on such date was $302,589,531.
The number of shares of the Registrant’s Class A Common Stock outstanding at February 16, 2011 was 27,340,139 shares. The number of shares of the Registrant’s Class B Common Stock outstanding at February 16, 2011 was 8,039,524 shares.
DOCUMENTS INCORPORATED BY REFERENCE
Portions of the proxy statement for the Registrant’s 2011 Annual Stockholders Meeting are incorporated by reference into Part III.
Table of Contents
INDEX TO ANNUAL REPORT ON FORM 10-K
FOR THE FISCAL YEAR ENDED DECEMBER 31, 2010
2
Table of Contents
PART I
| Item 1. | Business |
Company History and General Strategy
K•Swiss Inc. designs, develops and markets an array of footwear, apparel and accessories for athletic, high performance sports and fitness activities and casual wear under the K•Swiss brand. Since July 2008 and July 2010, we also design, develop and market footwear for adventurers for all terrains under the Palladium brand and apparel for mixed martial arts under the Form Athletics brand, respectively. Revenues by brand for the years ended December 31, 2010, 2009 and 2008 are as follows (in thousands):
| 2010 | 2009 | 2008 | ||||||||||
| K•Swiss brand |
$ | 185,513 | $ | 217,181 | $ | 315,913 | ||||||
| Palladium brand |
31,253 | 23,548 | 11,492 | |||||||||
| Form Athletics brand |
221 | — | — | |||||||||
| Total revenue |
$ | 216,987 | $ | 240,729 | $ | 327,405 | ||||||
K•Swiss was founded in 1966 by two Swiss brothers, who introduced one of the first leather tennis shoes in the United States. The shoe, the K•Swiss “Classic,” has remained relatively unchanged from its original design, and accounts for a significant portion of our sales. The Classic has evolved from a high-performance shoe into a casual, lifestyle shoe. In our marketing, we have consistently emphasized our commitment to produce products of high quality and enduring style and we plan to continue to emphasize the high quality and classic design of our products as we introduce new models of athletic footwear.
On December 30, 1986, K•Swiss was purchased by an investment group led by our current Chairman of the Board and President, Steven Nichols. Thereafter we recruited experienced management and reduced manufacturing costs by increasing offshore production and entering into new, lower cost purchasing arrangements. Our products are manufactured to our specifications by overseas suppliers predominately in Asia, including the People’s Republic of China (“China”), Taiwan, Thailand and Vietnam. In June 1991 and September 1992, we established operations in Taiwan and Europe, respectively, to broaden our distribution on a global scale.
In November 2001, we acquired the worldwide rights and business of Royal Elastics, an Australian-based designer and manufacturer of elasticated footwear. The purchase excluded distribution rights in Australia, which were retained by Royal Management Pty, Ltd. In April 2009, we sold certain Royal Elastics assets, consisting of its inventory located in Taiwan and its intangible trademarks to Royal Elastics Holdings Ltd., a third party, in an arm’s length transaction. Operations of the Royal Elastics brand have been accounted for and presented as a discontinued operation in the accompanying financial information.
In July 2008, we purchased a 57% equity interest in Palladium for a total purchase price of €5,350,000, or approximately $8,448,000 (including a loan of €3,650,000, or approximately $5,764,000). In June 2009, we purchased the remaining 43% equity interest in Palladium for €5,000,000 (or $7,034,000) plus a variable future purchase price, i.e. the Contingent Purchase Price (“CPP”), the terms of which were amended in May 2010. In May 2010, we revised the terms of the remaining future purchase price to be equal to the net present value of €3,000,000 plus up to €500,000 based on an amount calculated in accordance with a formula driven by Palladium’s EBITDA for the twelve months ended December 31, 2012. The €500,000 CPP will be determined each quarter based on the current quarter’s projection of Palladium’s EBITDA for the twelve months ended December 31 of the current year. Excluding the initial recognition of the CPP, any change in CPP is based on the
3
Table of Contents
change in net present value of the €3,000,000 and the current quarter’s EBITDA projection, and will be recognized as interest income or interest expense during the current quarter. The fair value of the CPP at December 31, 2010 was $3,689,000 (or €2,777,000).
In July 2010, we entered into a Membership Interest Purchase Agreement with Form Athletics, LLC (“Form Athletics”) and its Members to purchase Form Athletics for $1,600,000 in cash and additional cash consideration to certain Members of Form Athletics in an amount equal to Form Athletics’ EBITDA for the twelve months ended December 31, 2012 (“Form CPP”). The fair value of the Form CPP will be determined each quarter based on the net present value of the current quarter’s projection of Form Athletics’ EBITDA for the twelve months ended December 31, 2012. Any subsequent changes to the Form CPP will be recognized as interest income or interest expense during the applicable quarter. The fair value of the Form CPP at December 31, 2010 was $2,110,000. The acquisition of Form Athletics was recorded as a 100% purchase acquisition and the Form CPP liability was recognized and accordingly, the results of operations of the acquired business are included in the Consolidated Financial Statements from the date of acquisition.
The discussion during the remainder of this Item 1, other than the discussion relating to futures orders, trademarks and patents, and employees, relates solely to the K•Swiss brand.
K•Swiss is a corporation that was organized under the laws of the State of Delaware on April 16, 1990. The Company is successor in interest to K•Swiss Inc., a Massachusetts corporation, which in turn was successor in interest to K•Swiss Inc., a California corporation. Unless the context otherwise indicates, the terms “we,” “us,” “K•Swiss” and the “Company” as used herein refers to K•Swiss Inc. and its wholly-owned subsidiaries.
Products
Footwear
Our primary product is footwear. Our footwear products are classified into two product categories: lifestyle and performance. Currently, our brand positioning is directed more towards a performance orientation.
Our lifestyle category emphasizes the Classic and its derivatives. The lifestyle category evolved from a shoe called the Classic, which was originally developed in 1966 as a high-performance tennis shoe. Since that time, the Classic has become a popular casual shoe. The upper of the Classic includes only three separate pieces of leather, which allows for a relatively simple manufacturing process and yields a product with few seams. This simple construction improves the shoe’s comfort, fit and durability. We have from time to time incorporated certain technical advances in materials and construction, but the Classic has remained relatively unchanged in style since 1966, and continues to be the Company’s single most important product. In 2000, we successfully launched the Classic Luxury Edition and in 2009, we re-mastered and re-launched the original Classic, which is currently sold in the market today.
The performance category emphasizes performance running, as well as tennis and training. In 2008, we entered the performance running segment with an emphasis on performance innovation. In 2009, we entered into a three year agreement to be the Official Run Course Sponsor (for footwear and apparel) of the Ford Ironman World Championship, the Foster Grant Ironman World Championship 70.3, Ford Ironman Louisville, Amica Ironman 70.3, Ironman 70.3 Boise, Ironman European Championship (Ironman 70.3 Germany), Ironman UK and Ironman 70.3 Hawaii. In 2009, we also entered into a three year agreement (through 2012) to be the Presenting Sponsor of the Los Angeles Marathon.
4
Table of Contents
Within each product category we have certain styles designated as core products. Our core products offer style continuity and often include on-going improvement. We believe our core product program is a critical factor in attempting to achieve our goal of becoming the “retailers’ most profitable vendor.” The core program tends to minimize retailers’ markdowns and maximizes the effectiveness of marketing expenditures because of longer product life cycles.
Revenues, by product category, for the years ended December 31, 2010, 2009 and 2008, are as follows (dollar amounts in thousands). Most styles within the lifestyle and performance categories are offered in men’s (approximately 60% of 2010 revenues), women’s (approximately 26% of 2010 revenues) and children’s (approximately 14% of 2010 revenues). There were no customers that accounted for more than 10% of total revenues during 2010. See Note N to our Consolidated Financial Statements.
| 2010 | 2009 | 2008 | ||||||||||||||||||||||
| K•Swiss Footwear Category |
$ | % | $ | % | $ | % | ||||||||||||||||||
| Lifestyle |
$ | 102,911 | 58 | % | $ | 152,905 | 73 | % | $ | 253,787 | 83 | % | ||||||||||||
| Performance |
59,674 | 34 | 47,811 | 23 | 48,451 | 16 | ||||||||||||||||||
| Other (1) |
13,831 | 8 | 8,961 | 4 | 4,851 | 1 | ||||||||||||||||||
| Total (2) |
$ | 176,416 | 100 | % | $ | 209,677 | 100 | % | $ | 307,089 | 100 | % | ||||||||||||
| Domestic (2, 3) |
$ | 86,730 | 49 | % | $ | 99,482 | 47 | % | $ | 137,141 | 45 | % | ||||||||||||
| Foreign (2, 3) |
$ | 89,686 | 51 | % | $ | 110,195 | 53 | % | $ | 169,948 | 55 | % | ||||||||||||
| (1) | Other consists of apparel and accessories. |
| (2) | For purposes of this table, revenues do not include other domestic income and fees earned on sales by foreign licensees and distributors. |
| (3) | Included in “Total.” |
Apparel and Accessories
We market a limited line of K•Swiss branded apparel and accessories. The products are designed with the same classic strategies used in the footwear line. Classic styling allows us to appeal to a variety of markets, from consumers wanting performance apparel and accessories to the casual sportstyle consumers.
K•Swiss introduced apparel in 1999, with a new 7.0 collection of high tech tennis apparel to complement our performance 7.0 collection of footwear. Our tennis and running collections continue to offer world-class performance apparel (skirts, shorts, tops, polos, dresses and warm-ups) for both men and women. Since our introduction of the 7.0 collection of tennis apparel, we have added full collections of fitness, training and running apparel to round out the performance offering. In addition, we also offer a collection for the casual athletic consumer consisting of jackets, sweaters, sweatshirts, track jackets, tee shirts, caps, socks and bags.
The apparel line is distributed through better specialty stores, resorts and fitness centers, as well as sporting goods chains and sporting goods dealers worldwide. The tennis apparel line is sold primarily through tennis specialty and tennis pro shops. We also outfit professional and celebrity figures which offers us global branding exposure. As discussed in “Products – Footwear,” K•Swiss has entered into three year agreements as the Official Run Course Sponsor of certain Ironman Events and the Presenting Sponsor of the Los Angeles Marathon. K•Swiss sells its apparel and footwear at these events and markets all products globally.
5
Table of Contents
Sales
We sell our products through our sales executives and independent sales representatives primarily to a limited number of specialty athletic footwear stores, pro shops, sporting good stores and department stores and also through a number of foreign distributors. See “Risk Factors: Our financial success is limited to the success of our customers” and “Risk Factors: The loss of a significant customer, or a significant reduction in our sales to such customer, could adversely affect our sales and results of operations.” We also sell our products through our website and retail locations which are becoming increasingly important sales channels to us particularly in light of our limited distribution. The following table sets forth revenue by sales channels, as a percentage of product revenues, for the years ended December 31, 2010, 2009 and 2008:
| 2010 | 2009 | 2008 | ||||||||||
| Wholesale |
76 | % | 81 | % | 85 | % | ||||||
| Distributor |
14 | 13 | 12 | |||||||||
| Retail |
7 | 4 | 2 | |||||||||
| Web |
3 | 2 | 1 | |||||||||
| Total |
100 | % | 100 | % | 100 | % | ||||||
We believe the athletic and casual footwear industry experiences seasonal fluctuations, due to increased sales during certain selling seasons, including Easter, back-to-school and the year-end holiday seasons. We present full-line offerings for the Easter season for delivery during the first and second quarters and back-to-school season for delivery during the third quarter, but only limited offerings for the year-end holiday season. See “Risk Factors: Our business is affected by seasonality, which could result in fluctuations in our operating results.”
Financial information relating to domestic and international operations is presented as part of Item 8 of this report. See Note O to our Consolidated Financial Statements.
Marketing
Advertising and Promotion
We have an integrated advertising plan with broadcast, print, cinema, outdoor, retail and online initiatives. Traditional media such as television, print and outdoor is still an important part of our media plan but online and social media activities are becoming increasingly more important to our advertising strategy given the changing media landscape and consumer preferences.
The K•Swiss website (www.kswiss.com) was created in 1999 to provide consumers an opportunity to purchase our footwear, apparel and accessories online at prices competitive with our retailers and have the product shipped directly to them. Our website reflects the premium sport positioning of K•Swiss and leverages the assets of our advertising campaigns.
We offer a “futures” program, under which retailers are offered discounts on orders scheduled for delivery more than five months after the order is made. There is no guarantee that such orders will not be canceled prior to acceptance by the customer. See “Futures Orders” and “Risk Factors: Our current futures orders may not be indicative of future sales.” This program is similar to programs offered by other athletic shoe companies. The futures program has a positive effect on inventory costs, planning and production scheduling. See “Distribution.” In addition, we engage in certain sales programs from time to time that provide for extended payment terms on initial orders of new styles.
6
Table of Contents
Domestic Marketing
Domestically, our marketing uses a variety of traditional media, including television, cinema, out-of-home advertising and sports, music and general interest/fashion magazines, as well as non-traditional media, including the internet and social media networks, public relations, sports marketing, endorsements, in-store merchandising, product seeding and sponsorship.
Our footwear products are sold domestically through 31 independent regional sales representatives and 15 Company-employed sales managers. The independent sales representatives are paid on a commission basis, and are prohibited by contract from representing other brands of athletic footwear and related products. These sales personnel sold to approximately 2,400, 2,300 and 2,300 separate accounts as of December 31, 2010, 2009 and 2008, respectively.
We maintain a customer service department consisting of 10 persons at our Westlake Village, California facility. The customer service department accepts orders for our products, handles inquiries and notifies retailers of the status of their orders. We have made a substantial investment in computer equipment for general customer support and service, as well as for distribution. See “Distribution.”
International Marketing
In 1991, we established a sales management team in Asia which provides certain regional marketing materials and print and television advertising to our distributors. We have distributors in certain Pacific Rim countries and other international markets. Distributors of our products are generally contractually obligated to spend specific amounts on advertising and promotion of our products. We control the nature and content of these promotions. Certain distributors operate retail stores that sell exclusively K•Swiss branded product.
To expand the sales and marketing of our products into Europe, we opened our own office in the Netherlands in 1992. Our product is sold through Company-employed sales managers, independent sales representatives and distributors. Our European marketing uses a variety of media distribution including television advertisements, which are distributed through each region’s major network channels, print media in fashion and vertical sports magazines, social media, in-store merchandising and local publicity events and sponsorships.
Internationally, at December 31, 2010, K•Swiss had the exclusive right to market our products in 119 countries through 9 international subsidiaries and 25 distributors.
Distribution
We purchase footwear from independent manufacturers located in Asia. The time required to fill new orders placed by us with our manufacturers is approximately five months. Such footwear is generally shipped in ocean containers and delivered to our facilities.
We maintain 309,000 square feet of warehouse space at a leased facility in Mira Loma, California. See “Item 2. Properties.” In some cases, large customers may receive containers of footwear directly from the manufacturer. We ship by package express or truck from California, depending upon the size of order, customer location and availability of inventory. Distribution to European customers and certain other European distributors is based out of the public distribution facility in the Netherlands. Distribution to our customers and retail locations in Taiwan and Hong Kong are based out of the public distribution facilities in Taipei, Taiwan and Kwai Chung, Hong Kong, respectively. We generally arrange shipment of other international orders directly from our independent manufacturers.
We maintain an open-stock inventory on certain products which permits us to ship to retailers on an “at-once” basis in response to orders placed by mail, fax, toll-free telephone call or electronically.
7
Table of Contents
We have made a significant investment in computer equipment that provides on-line capability to determine open-stock availability for shipment. Additionally, products can be ordered under our “futures” program. See “Marketing—Advertising and Promotion.”
Product Design and Development
We maintain offices in California, Taiwan and the Netherlands that include a staff of individuals responsible for the product direction for each regional market. All design activities occur in our Corporate Office in Westlake Village, California. Additionally, individuals located in our Taiwan, China and Thailand offices are responsible for the execution of the design and detailed development of new styles for all global regions. The staff receives guidance from our management team in California, who meet regularly to review sales, consumer and market trends.
Manufacturing
In 2010, approximately 83% of our footwear products were manufactured in China, approximately 9% in Thailand, approximately 7% in Vietnam and approximately 1% in Taiwan. Although we have no long-term manufacturing agreements and compete with other athletic shoe companies for production facilities (including companies that are much larger than us), we believe our relationships with our footwear producers are satisfactory and that we have the ability to develop, over time, alternative sources for our footwear. Our operations, however, could be materially and adversely affected if a substantial delay occurred in locating and obtaining alternative producers. During 2010, our contract manufacturer in Thailand, one of only three manufacturers utilized by us at that time in our global supply chain, ceased operations. As a result, we experienced production delays as we attempted to secure permanent production capacity in other facilities and other regions in Asia. See “Risk Factors: Because we rely on independent manufacturers to produce our products, our sales and profitability may be adversely affected if our independent manufacturers fail to meet pricing, product quality and timeliness requirements or terminate their operations or if we are unable to obtain some components used in our products from limited supply sources or experience supply chain disruptions” and “Risk Factors: Because a large portion of our imported products are manufactured in China, our profitability may be adversely affected if the United States government takes action against China for its concern over the level of intellectual property rights protection and enforcements available in China.”
All manufacturing of footwear is performed in accordance with detailed specifications furnished by us and is subject to quality control standards, and we retain the right to reject products that do not meet our specifications. The bulk of all raw materials used in such production are purchased by manufacturers at our direction. Our inspectors at the manufacturing facilities test and inspect footwear products prior to shipment from those facilities.
During 2010, our apparel and accessory products were manufactured in Bangladesh, China, El Salvador, Hong Kong, Korea, Malaysia, Singapore, Taiwan, Thailand, the United States and Vietnam by certain manufacturers selected by us.
Our manufacturing operations and international sales are subject to the customary risks of doing business abroad, including compliance with applicable foreign laws and regulations, fluctuations in currency exchange rates, disruptions or delays in cross-border shipments, changing economic conditions, transportation costs, political instability, and the elimination, adjustment or imposition by any of the countries in which we manufacture our products of new export and import duties, quotas, tariffs, safeguard measures, anti-dumping duties, trade restrictions, restrictions on the transfer of funds and other changes and restrictions. We cannot predict the likelihood or frequency of any of such events occurring. If any of these or other factors make the conduct of business in a particular country undesirable or impractical, our business could be adversely affected.
8
Table of Contents
Our use of common elements in raw materials, lasts and dies gives us flexibility to duplicate sourcing in various countries in order to reduce the risk that we may not be able to obtain products from a particular country.
Our footwear products entering the United States are subject to customs duties which range from 8.5% to 10.0% of factory cost on footwear made principally of leather, to duties on synthetic and textile footwear ranging from 6.0% to 20.0% plus, for certain styles, $0.90 per pair. Our footwear products, manufactured in China, entering the European Union are subject to customs duties which range from 7.0% to 8.0% of landed cost on sports/technical footwear with uppers made principally of leather, a duty rate of 16.8% for synthetic upper footwear and a duty rate ranging from 23.5% to 24.5% for leather upper footwear that is considered non-sports/non-technical or sports/technical with a landed cost of under €7.50 per pair. Our footwear products, manufactured in Thailand, entering the European Union are subject to customs duties which range from 3.5% to 4.5% of landed cost on footwear with uppers made principally of leather and a duty rate of 11.9% for synthetic upper footwear. Currently, approximately 81% of our footwear volume is derived from sales of leather footwear and approximately 19% of our footwear volume is derived from sales of synthetic and textile footwear.
Futures Orders
Futures orders as of any date, represents orders scheduled to be shipped within the next six months. Futures orders do not include orders scheduled to be shipped on or prior to that date. At December 31, 2010 and 2009, total futures orders with start ship dates from January through June 2011 and 2010 were approximately $92,904,000 and $80,924,000, respectively, representing an increase of 14.8% at December 31, 2010. The 14.8% increase in total futures orders is comprised of an 8.6% increase in the first quarter 2011 futures orders and of a 26.2% increase in the second quarter 2011 futures orders. At December 31, 2010 and 2009, domestic futures orders with start ship dates from January through June 2011 and 2010 were approximately $45,216,000 and $29,583,000, respectively, representing an increase of 52.8% at December 31, 2010. At December 31, 2010 and 2009, international futures orders with start ship dates from January through June 2011 and 2010 were approximately $47,688,000 and $51,341,000, respectively, representing a decrease of 7.1% at December 31, 2010.
The mix of “futures” and “at-once” orders can vary significantly from quarter to quarter and year to year and therefore “futures” are not necessarily indicative of revenues for subsequent periods. Orders may be canceled by customers without financial penalty.
Competition
The athletic footwear industry is highly competitive. There are several marketers of footwear larger than us, including Nike and adidas. Each of these companies has substantially greater financial, distribution and marketing resources as well as greater brand awareness than us.
We have increased our emphasis on product lines beyond our Classic model. In the past, we have introduced products in such highly competitive categories as court, boating, outdoor and children’s shoes and we entered the higher end priced running category in 2008. See “Products.” There can be no assurance that we will penetrate these or other new markets or increase the market share we have established to date.
The principal elements of competition in the athletic footwear market include brand awareness, product quality, design, pricing, fashion appeal, marketing, distribution, performance and brand positioning. Our products compete primarily on the basis of technological innovations, quality, style and brand awareness among consumers. While we believe that our competitive strategy has resulted in increased brand awareness and market share, there can be no assurance that we will be able to retain or increase our market share or respond to changing consumer preferences.
9
Table of Contents
Trademarks and Patents
We utilize trademarks on all our products and believe our products are more marketable on a long-term basis when identified with distinctive markings. The K•SWISS, PALLADIUM and FORM ATHLETICS trademarks are registered in the United States and many other countries. Our Shield Emblem, the Five-Stripe Design, and the Palladium Round Logo trademarks are also registered in the United States and certain foreign countries. In a very few countries, the Five-Stripe Design trademark is not registered because local trademark officials consider it to be ornamental. We selectively seek to register the names of our shoes, logos and the names given to certain of our technical and performance innovations, including the names ULTRA-NATURAL and SHOCK SPRING. We have obtained patents in the United States and selected foreign countries for certain inventions incorporated into our products. The Company works constantly to secure and improve protection for its trademarks and other intellectual property. We vigorously defend our trademarks and patent rights against infringement worldwide and employ independent security consultants to assist in such protection. To date, we are not aware of any significant trademark counterfeiting problems regarding our products. However, see “Risk Factors: Because a large portion of our imported products are manufactured in China, our profitability may be adversely affected if the United States government takes action against China for its concern over the level of intellectual property rights protection and enforcements available in China” and “Risk Factors: Our competitive position could be harmed if we are unable to protect our intellectual property rights. Counterfeiting of our brands can divert sales and damage our brand image.”
Employees
At December 31, 2010, we employed a total of 603 persons, comprised of 240 persons in the United States, 234 persons in China, Hong Kong, Japan, Singapore, Taiwan, Thailand and Vietnam, 119 persons in France, Germany, the Netherlands and the United Kingdom and 10 persons elsewhere.
Available Information
K•Swiss’ internet address is www.kswiss.com. We make available free of charge on or through our internet website our annual report on Form 10-K, quarterly reports on Form 10-Q, current reports on Form 8-K, and amendments to those reports filed or furnished pursuant to Section 13(a) or 15(d) of the Securities and Exchange Act of 1934, as amended (the “Exchange Act”) as soon as reasonably practicable after such material is electronically filed with, or furnished to, the Securities and Exchange Commission (“S.E.C.”). Materials K•Swiss files with or furnishes to the S.E.C. may be read and copied at the S.E.C.’s Public Reference Room at 100 F Street, N.E., Washington, D.C. 20549. This information may also be obtained by calling the S.E.C. at 1-800-SEC-0330. The S.E.C. also maintains an internet website that contains reports, proxy and information statements, and other information regarding issuers that file electronically with the S.E.C. at www.sec.gov. The Company will provide a copy of any of the foregoing documents to stockholders upon request.
| Item 1A. | Risk Factors |
The Company operates in a changing environment that involves numerous known and unknown risks and uncertainties that could materially adversely affect our operations. The risks described below highlight some of the factors that have affected, and in the future could affect our operations. Additional risks we do not yet know of or that we currently think are immaterial may also affect our business operations. If any of the events or circumstances described in the following risks actually occur, our business, financial condition or results of operations could be materially adversely affected.
The market for athletic footwear is intensely competitive and if we fail to compete effectively, we could lose our market position and our business could be harmed.
The athletic footwear industry is intensely competitive, especially with respect to product offerings, technologies, marketing expenditures (including expenditures for advertising and endorsements),
10
Table of Contents
pricing, cost of production and customer service. Certain of our competitors have substantially greater financial, distribution and marketing resources as well as greater brand awareness than us. Their greater capabilities in these areas may enable them to better withstand periodic downturns in the footwear industry, compete more effectively on the basis of price and production and more quickly develop new products. Further, a major marketing or promotional success or technological innovation by one of our competitors could adversely impact our competitive position. In addition, the availability of overseas manufacturing opportunities and capacity more readily allows for the introduction of competitors with new products. In countries where the athletic footwear market is mature, it may be difficult for us to maintain or increase our market share as doing so may require us to overcome or dislodge the competitive position of one or more of our competitors, a task which may be difficult to accomplish. Our results of operations and market position may be adversely impacted by our competitors and the competitive pressures in the athletic footwear industry.
We believe our ability to compete effectively depends on a number of factors, including anticipating and responding to changing consumer preferences, demographics and demands in a timely manner, maintaining brand reputation and authenticity, performance and product reliability, developing high quality products that appeal to consumers, appropriately pricing our products, providing strong and effective marketing support, ensuring product availability, providing quality customer service, adopting new technologies, and maintaining and effectively assessing our distribution channels, and anticipating and responding to actions by our competitors, as well as many other factors beyond our control. Because many of these factors are not within our control, we may not be able to compete successfully in the future. Increased competition may result in price reductions, reduced profit margins, loss of market share, and an inability to generate cash flows that are sufficient to maintain or expand our development and marketing of new products, each of which would adversely affect our business.
The athletic footwear business is subject to consumer preferences and unanticipated shifts in consumer preferences that could adversely affect our sales and results of operations.
The athletic footwear industry is subject to rapid changes in consumer preferences. Consumer demand for athletic footwear and apparel is heavily influenced by brand image. Our initiatives to strengthen our brand image, which include conducting market research, introducing new and innovative products and initiating focused advertising campaigns, may not be successful. Our current products may not continue to be popular and new products we introduce may not achieve adequate consumer acceptance for us to recover development, manufacturing, marketing and other costs. Our failure to anticipate, identify and react to shifts in consumer preferences and maintain a strong brand image could have an adverse effect on our sales and results of operations. Also, if our customers purchase our products and do not have success in selling our products at retail, they may request a return or price adjustment to assist them in marking down the selling price to make the products more attractive to retail consumers.
Purchasing patterns are influenced by consumers’ disposable income, which is affected by economic conditions.
Consumer purchasing patterns are influenced by consumers’ disposable income. Consequently, the success of our operations may depend to a significant extent upon a number of factors affecting disposable income, including general economic conditions, level of employment, salaries and wage rates, consumer confidence, consumer perception of economic conditions, interest rates and taxation. Many of these factors are outside of our control and may have a negative impact on our sales and margins.
The consumer environment has been particularly challenging over the last several years. Disruptions in the overall economy and financial markets could further reduce consumer income,
11
Table of Contents
liquidity, credit and confidence in the economy and result in further reductions in consumer spending. Further deterioration of the consumer spending environment and increases in the unemployment rate may result in reduced demand for our products, which would be harmful to our financial position and results of operations.
If we fail to accurately forecast consumer demand, we may experience difficulties in handling customer orders or in liquidating excess inventories and our sales and brand image may be adversely affected.
The athletic footwear industry has relatively long lead times for the design and production of products. Consequently, we must commit to production tooling, and in some cases to production, in advance of orders based on our forecasts of consumer demand. The uncertainty surrounding today’s economy makes it increasingly difficult for us to accurately forecast product demand trends. If we fail to forecast consumer demand accurately, we may under-produce or over-produce our products. If we under-produce our products, we may experience inventory shortages which might delay shipments to customers, negatively impact retailer and distributor relationships, negatively impact our sales results and diminish brand awareness. Conversely, if we over-produce our products based on an aggressive forecast of consumer demand, this may result in inventory write-downs, the sale of excess inventory at discounted prices and retailers may not be able to sell the product and may seek to return the unsold quantities and cancel future orders. These outcomes could have an adverse effect on our sales and brand image.
Our current futures orders may not be indicative of future sales.
Our “futures” program allows our customers to order our products five months or more prior to delivery of product. Our current futures orders position may not be indicative of future sales. The mix of “futures” and “at-once” orders can vary significantly from quarter to quarter and year to year and therefore “futures” are not necessarily indicative of revenues for subsequent periods. Orders may be cancelled by customers without financial penalty. Customers may also reject nonconforming goods. If we experience adverse developments in customer cancellations, product returns or bad debts of customers, such developments could have a material adverse impact on our business, financial condition or results of operations.
Fluctuations in the price, availability and quality of raw materials could cause delay and increase costs.
Fluctuations in the price, availability and quality of the fabrics, leather or other raw materials used by us in our manufactured products and in the price of materials used to manufacture our footwear could have a material adverse effect on our cost of sales or our ability to meet our customers’ demands. The price and availability of such raw materials may fluctuate significantly, depending on many factors, including natural resources, such as oil and electricity, increased freight costs, increased labor costs and weather conditions. In the future, we may not be able to pass all or a portion of such higher raw materials prices on to our customers.
The loss of a significant customer, or a significant reduction in our sales to such a customer, could adversely affect our sales and results of operations.
While no customer accounted for more than 10% of our total revenues in 2010, we do have significant customers. The loss of any of these customers, or a significant reduction in our sales to any of these customers, could adversely affect our sales and results of operations. In addition, if any such customer becomes insolvent or otherwise fails to pay its debts, it could have an adverse affect on our results of operations.
12
Table of Contents
Consolidation of customers or concentration of customer market share among a few customers may increase and concentrate our credit risk, and impair our ability to sell our products.
The athletic and casual footwear and apparel retail markets in some countries where we sell our products are dominated by a few large footwear and apparel retailers with many stores. These retailers have increased their market share and may continue to do so in the future by expanding through acquisitions and construction of additional stores. Such consolidation concentrates our credit risk with a relatively small number of retailers, and, if any of these retailers were to experience a shortage of liquidity, it would increase the risk that their outstanding payables to us may not be paid. In addition, increasing market share concentration among one or a few retailers in a particular country or region increases the risk that if any one of them substantially reduces their purchases of our products, we may be unable to find a sufficient number of other retail outlets for our products to sustain the same level of revenues.
Our financial success is limited to the success of our customers.
Our financial success is directly related to the success of our customers and the willingness and financial resources of our customers to continue to buy our products. We do not have long-term contracts with any of our customers. Sales to our customers are generally on an order-by-order basis and are subject to rights of cancellation and rescheduling by our customers. If any of these customers experience a significant downturn in its business, insolvency, difficulty in obtaining financing in the capital and credit markets to purchase our products or fail to remain committed to our products or brands, then these customers may defer, reduce, cancel or discontinue purchases from us and/or fail to meet their payment obligations to us. Such conditions could decrease our revenues, or cause higher accounts receivables, reduced cash flows, greater expense associated with collection efforts or increased bad debt expense, any or all of which could have a material adverse effect on our business, results of operations and financial condition.
If we decrease the price that we charge for our products, we may earn lower gross margins and our revenues and profitability may be adversely affected.
The prices we are able to charge for our products depend on the type of product offered, the consumer and retailer response to the product and the prices charged by our competitors. To the extent that we are forced to lower our prices, our gross margins will be lower and our revenues and profitability would be adversely affected.
Our business is subject to economic conditions in our major markets. Consequently, adverse changes in economic conditions could have a negative effect on our business.
Our business is subject to economic conditions that may fluctuate in the major markets in which we operate. Factors that could cause economic conditions to fluctuate include, without limitation, recession, inflation, higher interest borrowing rates, higher levels of unemployment, higher consumer debt levels, general weakness in retail markets and changes in consumer purchasing power and preferences.
During 2008 and 2009, worldwide economic conditions deteriorated in many countries and regions in which we operate, resulting in weak equity markets, tightening of business credit and liquidity, a contraction of consumer credit, business failures, increased unemployment and declines in consumer confidence and spending. Despite more positive trends beginning in the second half of 2009, business conditions may remain difficult for the foreseeable future. If global economic and financial market conditions remain uncertain and/or weak for an extended period of time, any of the following factors, among others, could have a material adverse effect on our financial condition and results of operations:
| • | slower consumer spending may result in reduced demand for our products, reduced orders from customers for our products, order cancellations, lower revenues, increased inventories, and lower gross margins; |
13
Table of Contents
| • | continued volatility in the global markets and fluctuations in exchange rates for foreign currencies and contracts in foreign currencies could negatively impact our reported financial results and condition; |
| • | continued volatility in the prices for commodities and raw materials we use in our products could have a material adverse effect on our costs, gross margins, and ultimately our profitability; |
| • | if our customers experience declining revenues, or experience difficulty obtaining financing in the capital and credit markets to purchase our products, this could result in reduced orders for our products, order cancellations, inability of customers to timely meet their payment obligations to us, extended payment terms, higher accounts receivable, reduced cash flows, greater expense associated with collection efforts and increased bad debt expense; |
| • | a severe financial difficulty experienced by our customers may cause them to become insolvent or cease business operations, which could reduce the availability of our products to consumers; and |
| • | any difficulty or inability on the part of manufacturers of our products or other participants in our supply chain in obtaining sufficient financing to purchase raw materials or to finance general working capital needs may result in delays or non-delivery of shipments of our products. |
Our international sales and manufacturing operations are subject to the risks of doing business abroad, which could affect our ability to sell or manufacture our products in international markets, obtain products from foreign suppliers or control the cost of our products.
We operate offices and sell products in numerous countries outside the United States. Our revenue earned from international markets represents approximately 57%, 58% and 58% of our revenues for the years ended December 31, 2010, 2009 and 2008, respectively. Additionally, all of our footwear products are manufactured abroad and we have suppliers located in China, Taiwan, Thailand and Vietnam. Our athletic footwear sales and manufacturing operations are subject to the risks of doing business abroad. These risks include:
| • | fluctuations in currency exchange rates; |
| • | political instability; |
| • | limitations on conversion of foreign currencies into U.S. Dollars; |
| • | restrictions on dividend payments and other payments by our foreign subsidiaries and other restrictions on transfers of funds to or from foreign countries; |
| • | export and import duties, tariffs, regulations, quotas and other restrictions on free trade, particularly as these regulations may affect our operations in China; and |
| • | investment regulation and other restrictions by foreign governments. |
If these risks limit or prevent us from selling or manufacturing products in any significant international market, prevent us from acquiring products from our foreign suppliers or significantly increase the cost of our products, our operations could be seriously disrupted until alternative suppliers are found or alternative markets are developed. Although we enter into certain forward currency exchange contracts to hedge the risk of exchange rate fluctuations, these steps may not fully protect us against this risk and we may incur losses.
The potential imposition of additional duties, quotas, tariffs and other trade restrictions could have an adverse impact on our sales and profitability.
All of the products we manufacture overseas and import into the United States, the European Union and other countries are subject to shipment inspections, audits and customs duties collected by
14
Table of Contents
customs authorities. Customs information submitted by the Company is routinely subject to review by customs authorities. Further, additional U.S. or foreign inspections, audits, customs duties, quotas, tariffs, anti-dumping duties, safeguard measures, cargo restrictions to prevent terrorism or other trade restrictions may be imposed on the importation of our products in the future. The imposition of such restrictions in foreign countries where we operate, as well as in countries where our third party distributors and licensees operate, could result in increases in the costs of our products generally and could, as a result, adversely affect our sales and profitability.
Our business depends in part on a strong brand image.
Our brand names are one of our most important and valuable assets. Adverse publicity relating to our products, advertising, customer service or employees could tarnish our reputation and reduce the value of our brands. If our brands are damaged or consumers lose confidence in our brands, demand for our products could decrease and our financial results could be adversely affected. Further, we may be required to expend additional resources to rebuild our reputation and restore the value of our brands.
Our financial position, cash flow or results may be adversely affected by the threat of terrorism and related political instability and economic uncertainty.
The threat of potential terrorist attacks on the United States and throughout the world and political instability has created an atmosphere of economic uncertainty in the United States and in foreign markets. Our results may be impacted by the macroeconomic effects of those events. Also, a disruption in our supply chain as a result of terrorist attacks or the threat thereof may significantly affect our business and its prospects. In addition, such events may also result in heightened domestic security and higher costs for importing and exporting shipments of components and finished goods. Any of these occurrences may have a material adverse effect on our financial position, cash flow or results in any reporting period.
Because we rely on independent manufacturers to produce our products, our sales and profitability may be adversely affected if our independent manufacturers fail to meet pricing, product quality and timeliness requirements or terminate their operations or if we are unable to obtain some components used in our products from limited supply sources or experience supply chain disruptions.
We depend upon independent manufacturers to manufacture our products in a timely and cost-efficient manner while maintaining specified quality standards. We also compete with other larger companies for production capacity of independent manufacturers that produce our products. We rely heavily on manufacturing facilities located in Asia. In 2010, approximately 83% of our footwear manufacturing occurred in China, approximately 9% in Thailand, approximately 7% in Vietnam and approximately 1% in Taiwan. We also rely upon the availability of sufficient production capacity at our manufacturers. Timely delivery of product may be impacted by factors such as weather conditions, disruption of the transportation systems or shipping lines used by our suppliers, or uncontrollable factors such as natural disasters, epidemic diseases, terrorism and war. It is essential that our manufacturers deliver our products in a timely manner and in accordance with our quality standards because our orders may be cancelled by customers if agreed-upon delivery windows are not met or products are not of agreed-upon quality. Inflationary pressures, including increased labor costs, that are experienced by our independent contract manufacturers, may result in increased costs to us. A failure by one or more of our manufacturers to meet established criteria for pricing, product quality or timely delivery or the termination of operations by any one of our manufacturers could adversely impact our sales and profitability.
15
Table of Contents
Because a large portion of our imported products are manufactured in China, our profitability may be adversely affected if the United States government takes action against China for its concern over the level of intellectual property rights protection and enforcements available in China.
We rely heavily on manufacturing facilities located in China. The United States government has expressed serious concern over the level of intellectual property rights protection and enforcement available in China and the United States Trade Representative has in turn included China on its Priority Watch List. If the United States government takes action against China for its failure to adequately protect intellectual property rights, the result of that action could, among other things, include the imposition of trade sanctions that could affect the ability of the Company to continue to import products from China, which in turn could affect the costs of products purchased and sold by the Company and lead to a decline in the Company’s profitability.
Our competitive position could be harmed if we are unable to protect our intellectual property rights. Counterfeiting of our brands can divert sales and damage our brand image.
We believe that our trademarks, patents and proprietary technologies and designs are of great value. From time to time third parties have challenged, and may, in the future, try to challenge our ownership or the validity of our intellectual property. A successful challenge to any of our significant intellectual property rights could adversely affect our business and ability to generate revenue.
Our brands and designs are constantly at risk for counterfeiting and infringement of our intellectual property rights, especially in China where a large portion of our imported products are manufactured, and we find counterfeit products and products that infringe on our intellectual property rights in our markets as well as domain names that use our trade names or trademarks without our consent. We have not always been successful, particularly in some foreign countries, in combating counterfeit products and stopping infringements or other misappropriation of our intellectual property rights. Counterfeit and infringing products can cause us to lose significant sales and can also harm the integrity of our brands by associating our trademarks or designs with lesser quality or defective goods. Additionally, the scope of protection of our proprietary intellectual property rights can vary significantly from country to country, and can be quite narrow in some countries because of local law or practices. This is especially the case in China where the United States government has elevated China to its Priority Watch List, as discussed above. We may need to resort to litigation in the future to enforce our intellectual property rights. This litigation could result in substantial costs and may require the devotion of substantial resources.
We rely on our warehouses and if there is a natural disaster or other serious disruption at any of these facilities, we may be unable to deliver product effectively to our customers.
We rely on warehouses in Mira Loma, California and Rotterdam, the Netherlands. We also rely on the timely performance of services provided by third parties (i.e. Netherlands public distribution facility, freight delivery carriers) at these facilities. Any natural disaster or other serious disruption at either of these facilities due to fire, earthquake, flood, terrorist attack or any other natural or manmade cause could damage a portion of our inventory or impair our ability to use our warehouse as a docking location for product. Any of these occurrences could impair our ability to adequately supply our customers and negatively impact our operating results.
We depend on independent distributors to sell our products in certain international markets.
We sell our products in certain international markets mainly through independent distributors. If a distributor fails to meet annual sales goals, it may be difficult and costly to locate an acceptable substitute distributor. If a change in our distributors becomes necessary, we may experience increased costs, as well as a substantial disruption and loss of sales.
16
Table of Contents
Our business is affected by seasonality, which could result in fluctuations in our operating results.
We believe the athletic and casual footwear industry experiences seasonal fluctuations, due to increased sales during certain selling seasons, including Easter, back-to-school and year-end holiday seasons. We too experience moderate fluctuations in aggregate sales volume during the year. The mix of our product sales may also vary considerably from time to time as a result of changes in seasonal and geographic demand for particular types of footwear and apparel. As a result, we may not be able to accurately predict our quarterly sales. This seasonality, along with other factors that are beyond our control, including other risk factors described in this report, could adversely affect our business and cause our results of operations to fluctuate.
We may be subject to periodic litigation and other regulatory proceedings and may be affected by changes in government regulations.
From time to time we may be a party to lawsuits and regulatory actions relating to our business, including with respect to the intellectual property rights of others. Due to the inherent uncertainties of litigation and regulatory proceedings, we cannot accurately predict the ultimate outcome of any such proceedings. An unfavorable outcome could have a material adverse impact on our business, financial condition and results of operations. In addition, regardless of the outcome of any litigation or regulatory proceedings, such proceedings could result in substantial costs and may require that we devote substantial resources to defend the Company. Further, changes in government regulations both in the United States and in the countries in which we operate could have adverse affects on our business and subject us to additional regulatory actions.
Our net income may be adversely affected by an increase in our effective tax rate.
At any point in time, many tax years are subject to audit by various taxing jurisdictions. The results of these audits and negotiations with tax authorities may affect tax positions taken by us. Additionally, our effective tax rate in a given financial statement period may be materially impacted by changes in the geographic mix or level of earnings. We have not recorded United States income tax expense on earnings of selected foreign subsidiary companies as these are intended to be permanently invested, thus reducing our overall income tax expense. The amount of earnings designated as permanently invested is based upon our expectations of the future cash needs of our subsidiaries. Income tax considerations are also a factor in determining the amount of earnings to be permanently invested. Because the declaration involves our future plans and expectations of future events, the possibility exists that amounts declared as permanently invested may ultimately be repatriated. This would result in additional income tax expense in the year we determined that amounts were no longer permanently invested which in turn would adversely affect our results of operations.
We depend on attracting and retaining qualified personnel, whose loss would adversely impact our business.
Our success is largely dependent upon the efforts of Steven Nichols, our President, Chief Executive Officer and Chairman, and certain other key executives. Although we have entered into an employment agreement with Mr. Nichols that expires in December 2015, the loss of his and/or other key executive’s services would have a material adverse effect on our business and prospects. Our success also depends to a significant degree upon the continued services of our personnel. Accordingly, our continued success will depend on our ability to attract, retain and motivate qualified management, marketing, technical and sales personnel. These people are in high demand and often have competing employment opportunities. The labor market for skilled employees is highly competitive due to limited supply, and we may lose key employees or be forced to increase their
17
Table of Contents
compensation. Employee turnover could significantly increase our training and other related employee costs. The loss of the services of any key personnel or our inability to attract additional personnel could have a material adverse effect on our ability to manage our business.
A limited number of our stockholders can exert significant influence over the Company.
At December 31, 2010, the Company’s President, Chief Executive Officer and Chairman of the Board, Steven Nichols, held approximately 92.7% of the voting power of our Class B Common Stock and approximately 69.2% of total voting power. This voting power permits Mr. Nichols to exert significant influence over the outcome of stockholder votes, including votes concerning the election of a certain class of directors, by-law amendments, possible mergers, corporate control contests and other significant corporate transactions.
We depend on our computer and communications systems.
We extensively utilize computer and communications systems to operate our Internet business and manage our internal operations including without limitation, demand and supply planning, and inventory control. Any interruption of this service from power loss, telecommunications failure, failure of our computer system or other interruption caused by weather, natural disasters or any similar event could disrupt our operations and result in lost sales. In addition, hackers and computer viruses have disrupted operations at many major companies. We may be vulnerable to similar acts of sabotage, which could have a material adverse effect on our business and operations.
We rely on our management information systems to operate our business and to track our operating results. Our management information systems will require modification and refinement as our business needs change. If we experience a significant system failure or if we are unable to modify our management information systems to respond to changes in our business needs, then our ability to properly run our business could be adversely affected.
During 2008 and early 2009, we completed our implementation of the SAP information management software in a majority of our worldwide operations. During the next several years, we will continue to rollout various modules of SAP that were not implemented during our initial worldwide implementation. We may encounter computer and operational complications in connection with maintaining and implementing the SAP information system that could have a material adverse affect on our business, financial condition or results of operations.
We may face transitional challenges with acquisitions of other businesses.
The Company may from time to time pursue acquisitions of other businesses. The Company cannot provide assurance that it will be able to successfully integrate the operations of any newly-acquired businesses into the Company’s operations. Acquisitions involve numerous risks, including risks inherent in entering new markets in which the Company may not have prior experience, potential loss of significant customers or key personnel of the acquired business; managing geographically-remote operations, and potential diversion of management’s attention from other aspects of the Company’s business operations. Acquisitions may also result in incurrence of debt, dilutive issuances of the Company’s equity securities and write-offs of goodwill and substantial amortization expenses of other intangible assets. The failure to integrate newly acquired businesses could have an adverse effect on the Company’s business, results of operations and financial position.
| Item 1B. | Unresolved Staff Comments |
None.
18
Table of Contents
| Item 2. | Properties |
In 1998, we moved into our headquarters facility in Westlake Village, California. This facility, which is owned by us, is approximately 50,000 square feet. We occupy approximately eighty-five percent of this facility and lease approximately fifteen percent of this facility.
We lease a 309,000 square foot distribution facility in Mira Loma, California. We use this facility as our main distribution center. The effective monthly commitment for this facility is approximately $111,000. In July 2008, we exercised an option under the lease to extend the term of the lease until January 2015.
We also lease office space of approximately 14,000 square feet in Haarlem, the Netherlands, which is our primary European headquarters. The effective monthly commitment for this office space is approximately $22,000. During 2010, we extended the lease until March 2016, and at that time it can be renewed for an additional five years. In addition, we contract with a third party public distribution facility in Rotterdam, the Netherlands, to manage our inventory destined to European customers.
Distribution to our customers and retail locations in Taiwan and Hong Kong are based out of the public distribution facilities in Taipei, Taiwan and Kwai Chung, Hong Kong, respectively.
| Item 3. | Legal Proceedings |
The Company is, from time to time, a party to litigation which arises in the normal course of our business operations. We do not believe that we are presently a party to litigation which will have a material adverse effect on our business or operations.
| Item 4. | (Removed and Reserved) |
Executive Officers of the Registrant
The executive officers of K•Swiss are as follows:
| Name |
Age at December 31, 2010 |
Position | ||
| Steven Nichols |
68 | Chairman of the Board, Chief Executive Officer and President | ||
| Edward Flora |
59 | Chief Operating Officer | ||
| Lee Green |
57 | Corporate Counsel | ||
| David Nichols |
41 | Executive Vice President | ||
| George Powlick |
66 | Vice President of Finance, Chief Administrative Officer, Chief Financial Officer, Secretary and Director | ||
| Kimberly Scully |
43 | Corporate Controller | ||
| Brian Sullivan |
57 | Vice President of National Accounts |
Officers are appointed by and serve at the discretion of the Board of Directors.
Steven Nichols has been President, Chief Executive Officer and Chairman of the Board of K•Swiss since 1987. From 1980 to 1986, Mr. Nichols was a director and Vice President—Merchandise of Stride Rite Corp., a footwear manufacturer and holding company. In addition, Mr. Nichols was President of Stride-Rite Footwear from 1982 to 1986. From 1979 to 1982, Mr. Nichols served as an officer and President of Stride Rite Retail Corp., the largest retailer of branded children’s shoes in the United States. From 1962 through 1979, Mr. Nichols was an officer of Nichols Foot Form Corp., which operated a chain of New York retail footwear stores.
19
Table of Contents
Edward Flora, Chief Operating Officer since January 2009, joined K•Swiss as a consultant in June 1990 and served as Director—Administration from October 1990 to February 1994 and Vice President—Operations from March 1994 to January 2009. Prior to joining the Company, Mr. Flora was Vice President—Distribution for Bugle Boy Industries, a manufacturer and distributor of men’s, women’s, and children’s apparel, from 1987 through May 1990.
Lee Green, Corporate Counsel since December 1992, joined K•Swiss in December 1992. Mr. Green was formerly a partner in the international law firm of Baker & McKenzie. He worked in the firm’s Taipei office from 1985 to 1988 and its Palo Alto office from 1988 to 1992.
David Nichols, Executive Vice President since May 2004, has held various positions with K•Swiss since joining the Company in November 1995, including Executive Vice President of K•Swiss Sales Corp., President of K•Swiss Europe BV and President of K•Swiss Direct Inc.
George Powlick, Vice President of Finance, Chief Financial Officer and Secretary of the Company since January 1988, Director of the Company since 1990, Chief Operating Officer of the Company from September 2004 until January 2009, and Chief Administrative Officer since January 2009 joined the Company in January 1988. Mr. Powlick is a certified public accountant and was an audit partner in the independent public accounting firm of Grant Thornton LLP from 1975 to 1987.
Kimberly Scully, Corporate Controller since April 2003, joined K•Swiss in April 2003. Ms. Scully is a certified public accountant. From 2000 through April 2003, Ms. Scully was the Corporate Controller of SMTEK International, Inc., an electronics manufacturing services provider. From 1995 through 1999, Ms. Scully was a Corporate Accounting Manager of Home Savings of America, FSB, a $50 billion savings institution, which was acquired in 1998. From 1989 through 1995, Ms. Scully was an auditor in the independent accounting firm of KPMG LLP and became an audit manager in 1994.
Brian Sullivan, Vice President of National Accounts since December 1989, joined K•Swiss in December 1989. From 1986 to 1989, he was Vice President and General Manager of Tretorn, Inc., a manufacturer and distributor of tennis shoes. From 1984 through 1985, Mr. Sullivan was Vice President of Sales of Bancroft/Tretorn, a tennis shoe manufacturer and distributor and predecessor to Tretorn. From 1978 to 1984, Mr. Sullivan held various positions at Bancroft/Tretorn, including Field Salesperson, Marketing and Sales Planning Manager and National Sales Manager.
20
Table of Contents
| Item 5. | Market for Registrant’s Common Equity, Related Stockholder Matters and Issuer Purchases of Equity Securities |
K•Swiss Inc.’s Class A Common Stock began trading June 4, 1990 on the National Market System maintained by the National Association of Securities Dealers (now the Nasdaq Global Select Market) upon completion of our initial public offering. Per share high and low sales prices (in dollars) for the quarterly periods during 2010 and 2009 as reported by Nasdaq were as follows:
| March 31, | June 30, | September 30, | December 31, | |||||||||||||
| 2010 |
||||||||||||||||
| Low |
$ | 8.63 | $ | 8.80 | $ | 10.13 | $ | 11.03 | ||||||||
| High |
11.30 | 14.53 | 13.19 | 12.94 | ||||||||||||
| 2009 |
||||||||||||||||
| Low |
$ | 6.44 | $ | 7.43 | $ | 8.70 | $ | 7.68 | ||||||||
| High |
12.13 | 10.98 | 11.23 | 10.25 | ||||||||||||
The Class A Common Stock is listed on the Nasdaq Global Select Market under the symbol KSWS.
The number of stockholders of record of the Class A Common Stock on December 31, 2010 was 129. However, based on available information, we believe that the total number of Class A Common stockholders, including beneficial stockholders, is approximately 5,150.
There is currently no established public trading market for our Class B Common Stock. The number of stockholders of record of the Class B Common Stock on December 31, 2010 was 9.
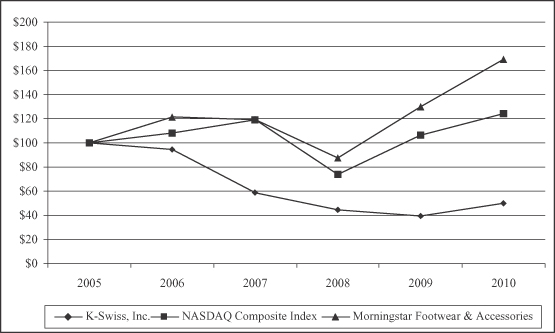
Stock Price Performance Graph
The Stock Price Performance Graph below represents a comparison of the five year total return of K•Swiss Inc. Class A Common Stock, the NASDAQ Composite Index and the Morningstar Footwear and Accessories Group. The graph assumes $100 was invested on December 31, 2005 and dividends are reinvested for all years ending December 31.
21
Table of Contents
Dividend Policy
On March 3, 2009, the Board of Directors suspended the payment of dividends for the foreseeable future to preserve liquidity and enhance the strength of the Company’s balance sheet. The payment of any future dividends will be at the discretion of our Board of Directors and will depend upon, among other things, future earnings, operations, capital requirements, our general financial condition and general business conditions. The Company did not pay any dividends during 2009 or 2010.
Purchases of Equity Securities by the Issuer
In November 2009, the Board of Directors approved a new stock repurchase program to purchase through December 31, 2014 up to $70,000,000 of the Company’s Class A Common Stock.
During the fourth quarter of 2010, the Company did not repurchase any shares of K•Swiss Class A Common Stock. $70,000,000 remains available for repurchase under the Company’s repurchase program.
22
Table of Contents
| Item 6. | Selected Financial Data |
The selected consolidated financial data presented below for each of the five years in the period ended December 31, 2010 have been derived from audited financial statements which for the most recent three years appear elsewhere herein. The data presented below should be read in conjunction with such financial statements, including the related notes thereto and the other information included herein.
| Year ended December 31, | ||||||||||||||||||||
| 2010 | 2009 | 2008 | 2007 | 2006 | ||||||||||||||||
| (In thousands, except per share data) | ||||||||||||||||||||
| Income Statement Data |
||||||||||||||||||||
| Revenues |
$ | 216,987 | $ | 240,729 | $ | 327,405 | $ | 394,540 | $ | 489,271 | ||||||||||
| Cost of goods sold |
131,908 | 154,558 | 195,385 | 210,910 | 255,865 | |||||||||||||||
| Gross profit |
85,079 | 86,171 | 132,020 | 183,630 | 233,406 | |||||||||||||||
| Selling, general and administrative expenses |
142,474 | 118,303 | 139,899 | 148,283 | 130,811 | |||||||||||||||
| Impairment on intangibles and goodwill |
— | 4,830 | — | — | — | |||||||||||||||
| Operating (loss)/profit |
(57,395 | ) | (36,962 | ) | (7,879 | ) | 35,347 | 102,595 | ||||||||||||
| Other (expense)/income, net |
(3,320 | ) | (1,249 | ) | 30,000 | 5,232 | — | |||||||||||||
| Interest income, net |
435 | 1,050 | 8,216 | 11,184 | 8,275 | |||||||||||||||
| (Loss)/Earnings before income taxes and discontinued operations |
(60,280 | ) | (37,161 | ) | 30,337 | 51,763 | 110,870 | |||||||||||||
| Income tax expense/(benefit) |
7,932 | (9,663 | ) | 5,882 | 9,868 | 31,759 | ||||||||||||||
| (Loss)/Earnings from continuing operations |
(68,212 | ) | (27,498 | ) | 24,455 | 41,895 | 79,111 | |||||||||||||
| Loss from discontinued operations, less applicable income taxes (1) |
— | (464 | ) | (3,570 | ) | (2,822 | ) | (2,247 | ) | |||||||||||
| Net (Loss)/Earnings |
$ | (68,212 | ) | $ | (27,962 | ) | $ | 20,885 | $ | 39,073 | $ | 76,864 | ||||||||
| (Loss)/Earnings per share |
||||||||||||||||||||
| Basic: |
||||||||||||||||||||
| (Loss)/Earnings from continuing operations |
$ | (1.94 | ) | $ | (0.79 | ) | $ | 0.70 | $ | 1.21 | $ | 2.30 | ||||||||
| Loss from discontinued operations |
— | (0.01 | ) | (0.10 | ) | (0.08 | ) | (0.07 | ) | |||||||||||
| Net (Loss)/Earnings |
$ | (1.94 | ) | $ | (0.80 | ) | $ | 0.60 | $ | 1.13 | $ | 2.23 | ||||||||
| Diluted: |
||||||||||||||||||||
| (Loss)/Earnings from continuing operations |
$ | (1.94 | ) | $ | (0.79 | ) | $ | 0.69 | $ | 1.18 | $ | 2.23 | ||||||||
| Loss from discontinued operations |
— | (0.01 | ) | (0.10 | ) | (0.08 | ) | (0.06 | ) | |||||||||||
| Net (Loss)/Earnings |
$ | (1.94 | ) | $ | (0.80 | ) | $ | 0.59 | $ | 1.10 | $ | 2.17 | ||||||||
| Dividends declared per common share |
$ | — | $ | — | $ | 2.20 | $ | 0.20 | $ | 0.20 | ||||||||||
| Weighted average number of shares outstanding |
||||||||||||||||||||
| Basic |
35,218 | 34,962 | 34,785 | 34,705 | 34,401 | |||||||||||||||
| Diluted (2) |
35,218 | 34,962 | 35,407 | 35,472 | 35,378 | |||||||||||||||
| Balance Sheet Data (at period end) |
||||||||||||||||||||
| Current assets |
$ | 235,186 | $ | 287,986 | $ | 332,776 | $ | 405,617 | $ | 373,440 | ||||||||||
| Current liabilities |
32,948 | 28,335 | 52,139 | 50,401 | 49,062 | |||||||||||||||
| Total assets |
288,165 | 344,150 | 394,290 | 446,353 | 404,560 | |||||||||||||||
| Total debt (3) |
970 | 4,207 | 5,376 | — | — | |||||||||||||||
| Stockholders’ equity |
234,913 | 301,783 | 324,762 | 384,233 | 345,903 | |||||||||||||||
| (1) | On April 30, 2009, the Company sold certain Royal Elastics assets. Operations of the Royal Elastics brand have been accounted for and presented as a discounted operation. |
| (2) | Includes common stock and dilutive potential common stock (options). |
| (3) | Includes all interest-bearing debt, but excludes outstanding letters of credit ($2,362,000, $700,000, $1,399,000, $1,831,000, and $196,000 as of December 31, 2010, 2009, 2008, 2007 and 2006, respectively). |
23
Table of Contents
| Item 7. | Management’s Discussion and Analysis of Financial Condition and Results of Operations |
Note Regarding Forward-Looking Statements and Analyst Reports
“Forward-looking statements,” within the meaning of the Private Securities Litigation Reform Act of 1995 (the “Act”), include certain written and oral statements made, or incorporated by reference, by us or our representatives in this report, other reports, filings with the Securities and Exchange Commission (the “S.E.C.”), press releases, conferences, or otherwise. Such forward-looking statements include, without limitation, any statement that may predict, forecast, indicate, or imply future results, performance, or achievements, and may contain the words “believe,” “anticipate,” “expect,” “estimate,” “intend,” “plan,” “project,” “will be,” “will continue,” “will likely result,” or any variations of such words with similar meaning. These statements are not guarantees of future performance and are subject to certain risks, uncertainties and assumptions that are difficult to predict. Therefore, actual results may differ materially from those expressed or forecasted in any such forward-looking statements. Investors should carefully review the risk factors set forth in the reports and documents we file with the S.E.C., including Forms 10-Q, 10-K and 8-K. Some of the other risks and uncertainties that should be considered include, but are not limited to, the following: international, national and local general economic and market conditions; the size and growth of the overall athletic footwear and apparel markets; the size of our competitors; intense competition among designers, marketers, distributors and sellers of athletic footwear and apparel for consumers and endorsers; market acceptance of all our product offerings; popularity of particular designs, categories of products, and sports; seasonal and geographic demand for our products; the size, timing and mix of purchases of our products; performance and reliability of products; difficulties in anticipating or forecasting changes in consumer preferences, demographics and demand for our product, and various market factors described above; the amount of consumer disposable income; the availability of credit facilities for our customers and/or the stability of credit markets; fluctuations and difficulty in forecasting operating results, including, without limitation, the fact that advance “futures” orders may not be indicative of future revenues due to the changing mix of futures and at-once orders; potential cancellation of future orders; our ability to continue, manage or forecast our growth and inventories; new product development and timely commercialization; fluctuations in the price, availability and quality of raw materials; the loss of, or reduction in, sales to a significant customer or distributor; the success, willingness to purchase and financial resources of our customers; pressure to decrease the prices of our products; the ability to secure and protect trademarks, patents, and other intellectual property; inadvertent and nonwillful infringement on others’ trademarks, patents and other intellectual property; difficulties in implementing, operating, maintaining, and protecting our increasingly complex information systems and controls including, without limitation, the systems related to demand and supply planning, and inventory control; difficulties in maintaining SAP information management software; interruptions in data and communication systems; concentration of production in China; changes in our effective tax rates as a result of changes in tax laws or changes in our geographic mix of sales and level of earnings; potential earthquake disruption due to the location of our warehouse and headquarters; potential disruption in supply chain due to various factors including but not limited to natural disasters, epidemic diseases or customer purchasing habits; the continued operation and ability of our manufacturers to satisfy our production requirements; our ability to secure sufficient manufacturing capacity, or the loss of, or reduction in, manufacturing capacity from significant suppliers; responsiveness of customer service; adverse publicity; concentration of credit risk to a few customers; business disruptions; increased costs of freight and transportation to meet delivery deadlines; increased material and/or labor costs; the effects of terrorist actions on business activities, customer orders and cancellations, and the United States and international governments’ responses to these terrorist actions; changes in business strategy or development plans; general risks associated with doing business outside the United States, including, without limitation, exchange rate fluctuations, import duties, tariffs, quotas and political and economic instability; changes in government regulations; liability and other claims asserted against us; the ability to attract and retain qualified personnel; a
24
Table of Contents
limited number of our stockholders can exert significant influence over the Company; transitional challenges of integrating newly acquired companies into our business; and other factors referenced or incorporated by reference in this report and other reports.
K•Swiss Inc. (the “Company,” “K•Swiss,” “we,” “us,” and “our”) operates in a very competitive and rapidly changing environment. New risk factors can arise and it is not possible for management to predict all such risk factors, nor can we assess the impact of all such risk factors on our business or the extent to which any factor, or combination of factors, may cause actual results to differ materially from those contained in any forward-looking statements. Given these risks and uncertainties, investors should not place undue reliance on forward-looking statements as a prediction of actual results.
Investors should also be aware that while we communicate, from time to time, with securities analysts, it is against our policy to disclose to them any material non-public information or other confidential commercial information. Accordingly, investors should not assume that we agree with any statement or report issued by any analyst irrespective of the content of the statement or report. Furthermore, we have a policy against issuing or confirming financial forecasts or projections issued by others. Thus, to the extent that reports issued by securities analysts or others contain any projections, forecasts or opinions, such reports are not our responsibility.
Overview
The Company designs, develops and markets an array of footwear, apparel and accessories for athletic, high performance sports and fitness activities and casual wear under the K•Swiss brand. Since July 2008 and July 2010, the Company also designs, develops and markets footwear for adventurers for all terrains under the Palladium brand and apparel for mixed martial arts under the Form Athletics brand, respectively. Sales of the Palladium brand and Form Athletics brand were approximately 14.4% and 0.1%, respectively, of total sales in 2010. The categories of footwear we sell are explained in more detail in Part I, Item 1, under the subheading, “Products.” We market our products through Company employed sales managers and independent regional sales representatives primarily to a limited number of specialty athletic footwear stores, pro shops, sporting good stores and department stores and also through a number of foreign distributors. We also sell our products through our website and retail locations, which are becoming increasingly important sales channels to us particularly in light of our limited distribution.
Due to the recent global economic crisis, the retail environment has been particularly challenging during the last few years. While economic conditions began to show signs of improvement beginning in the second half of 2009, the recovery has proceeded at a sluggish rate and the retail environment has remained weak. As a result, business conditions may remain difficult for the foreseeable future. These conditions combined with the weak demand for the Company’s product during the past few years could put additional pressure on the Company’s ability to maintain margins.
In 2010, approximately 83% of our K•Swiss brand footwear products were manufactured in China, approximately 9% in Thailand, approximately 7% in Vietnam and approximately 1% in Taiwan. During 2010, our contract manufacturer in Thailand, one of only three manufacturers utilized by us at that time in our global supply chain, ceased operations. As a result, we experienced production delays as we attempted to secure permanent production capacity in other facilities and other regions in Asia. Although we have no long-term manufacturing agreements, we believe that our current relationships with our producers are satisfactory and that we have the ability to develop alternative sources for our footwear. Our operations could, however, be materially and adversely affected if a substantial delay occurred in locating and obtaining alternative producers.
Because we record revenues when title passes and the risks and rewards of ownership have passed to our customer, our revenues may fluctuate in cases when our customers delay accepting
25
Table of Contents
shipment of products. Our total revenues decreased 9.9% in 2010 from 2009, due to a decrease in the volume of footwear sold, offset by an increase in the average underlying wholesale price per pair. Our overall gross profit margins, as a percentage of revenues, were 39.2% and 35.8% in 2010 and 2009, respectively. The increase in our gross profit margin is mainly due to product mix changes, including a lower percentage of sales of close out product which has a lower gross profit margin. Our overall selling, general and administrative expenses increased to $142,474,000 in 2010 from $118,303,000 in 2009 as a result of increases in advertising expenses, offset by decreases in data processing expenses and compensation expenses. In addition, an impairment charge of $4,830,000 on goodwill and intangible assets related to the trademarks of the Palladium brand was recognized in 2009.
Other expense for 2010 consists of the recognition of $3,320,000, which represents the net present value of the estimated Contingent Purchase Price (“CPP”) for Palladium. Other expense for 2009 includes a loss upon the purchase of the remaining 43% equity interest of Palladium of $2,616,000, offset by a gain on the sale of certain assets of the Royal Elastics brand of $1,367,000. Operations of the Royal Elastics brand have been accounted for and presented as a discontinued operation in the Consolidated Financial Statements.
In 2010, we recognized a tax valuation allowance of $27,178,000 against our U.S. and certain international deferred tax assets.
At December 31, 2010, our total futures orders with start ship dates from January through June 2011 were $92,904,000, an increase of 14.8% from the comparable period of the prior year. Of this amount, domestic futures orders were $45,216,000, an increase of 52.8%, and international futures orders were $47,688,000, a decrease of 7.1%.
The net loss for 2010 was $68,212,000, or $1.94 per share (diluted loss per share), compared to the net loss of $27,962,000, or $0.80 per share (diluted loss per share), for 2009. Net loss and diluted loss per share for 2010 included pre-tax expense of $3,320,000 related to the net present value of the CPP. Net loss and diluted loss per share for 2009 included the pre-tax impairment charge on the goodwill and intangible assets related to the trademarks of the Palladium brand of $4,830,000 and the pre-tax loss of $2,616,000 on the purchase of the remaining 43% of Palladium, offset by the net pre-tax gain on the sale of certain Royal Elastics assets of $1,367,000, as described above.
In 2010, we experienced net cash used in operating activities from continuing operations of $46,735,000, net cash used in investing activities of $40,401,000 due mainly to the purchase of investments available for sale and restricted investments available for sale, offset by proceeds from the sale or maturity of investments available for sale and net cash used in financing activities of $1,989,000 mainly as a result of net borrowings on bank lines of credit. We anticipate future cash needs for principal repayments required pursuant to borrowings under our lines of credit and, depending on future operating results, additional funds may be required for operating activities.
At December 31, 2010 and 2009, we had debt outstanding of $970,000 and $4,207,000 (in each case attributable to outstanding borrowings by Palladium under its lines of credit facilities and term loans), excluding outstanding letters of credit of $2,362,000 and $700,000 at December 31, 2010 and 2009, respectively. Our working capital decreased $57,413,000 to $202,238,000 at December 31, 2010 from $259,651,000 at December 31, 2009, mainly due to decreases in cash and cash equivalents, income taxes receivable, accounts receivable and current deferred income taxes and increases in trade accounts payable, offset by increases in investments available for sale, inventory and prepaid expenses and other current assets and decreases in bank lines of credit and current portion of long-term debt.
26
Table of Contents
Critical Accounting Policies
Our significant accounting policies are described in Note A to our Consolidated Financial Statements included in Item 8 of this Form 10-K. Our discussion and analysis of our financial condition and results of operations are based upon our Consolidated Financial Statements, which have been prepared in accordance with accounting principles generally accepted in the United States. The preparation of these financial statements requires us to make estimates and judgments that affect the reported amounts of assets, liabilities, revenues and expenses, and related disclosure of contingent assets and liabilities.
On an on-going basis, we evaluate our estimates, including those related to the carrying value of inventories, realizability of outstanding accounts receivable, goodwill and intangible assets, sales returns and allowances, and the provision for income taxes. We base our estimates on historical experience and on various other assumptions that are believed to be reasonable under the circumstances, the results of which form the basis for making judgments about the carrying values of assets and liabilities. In the past, actual results have not been materially different from our estimates. However, results may differ from these estimates under different assumptions or conditions.
We have identified the following as critical accounting policies, based on the significant judgments and estimates used in determining the amounts reported in our Consolidated Financial Statements:
Revenue Recognition
We record revenues when title passes and the risks and rewards of ownership have passed to the customer, based on the terms of sale. Title passes generally upon shipment.
In some instances, we ship product directly from our supplier to the customer. In these cases, we recognize revenue when the product is delivered to the customer according to the terms of the order. Our revenues may fluctuate in cases when our customers delay accepting shipment of product for periods up to several weeks.
As part of our revenue recognition policy, we record estimated sales returns and allowances as reductions to revenues. We base our estimates on historical rates of returns and allowances and specific identification of outstanding returns not yet received from customers. However, actual returns and allowances in any future period are inherently uncertain and thus may differ from our estimates. If actual or expected future returns and allowances were significantly greater or lower than the reserves we had established, we would record a reduction or increase to net revenues in the period in which we made such determination.
Accounts Receivable
We make ongoing estimates relating to the collectibility of our accounts receivable and maintain allowances for doubtful accounts for estimated losses resulting from the inability of our customers to make required payments. We estimate potential losses based on our knowledge of the financial condition of certain customers and historical level of credit losses, as well as an assessment of the overall retail conditions. Historically, losses have been within our expectations. If the financial condition of our customers were to change, adjustments may be required to these estimates. Furthermore, we provide for estimated losses resulting from differences that arise from the gross carrying value of our receivables and the amounts which customers estimate are owed to us. The settlement or resolution of these differences could result in future changes to these estimates. Our allowance for bad debts as a percentage of accounts receivable has remained relatively constant over the past three years despite the weak economy due to our increased scrutiny of customer relationships.
27
Table of Contents
Inventory Reserves
We also make ongoing estimates relating to the market value of inventories, based upon our assumptions about future demand and market conditions. If we estimate that the market value of our inventory is less than the cost of the inventory recorded on our books, we record a reserve equal to the difference between the cost of the inventory and the estimated market value. This reserve is recorded as a charge to cost of sales. If changes in market conditions result in reductions in the estimated market value of our inventory below our previous estimate, we would increase our reserve in the period in which we made such a determination and record the additional charge to cost of sales. Inventory reserve as a percentage of inventory decreased in 2010 and 2009 from 2008 as a result of significant reserves being established in 2008 and substantial liquidation of impaired inventory in 2009.
Income Taxes
We account for income taxes under an asset and liability approach that requires the recognition of deferred tax assets and liabilities for the expected future tax consequences of events that have been recognized in our financial statements or tax returns. We evaluate uncertain tax positions and recognize the benefit/exposure of those positions if they meet the more-likely-than-not threshold. Any tax position recognized is an adjustment to the effective tax rate. Also, at any point in time, many tax years are subject to audit by various taxing jurisdictions. The results of these audits and negotiations with tax authorities may affect tax positions taken. Additionally, our effective tax rate in a given financial statement period may be materially impacted by changes in the geographic mix or level of earnings.
We have not recorded United States income tax expense on earnings of selected foreign subsidiary companies as these are intended to be permanently invested, thus reducing our overall income tax expense. The amount of earnings designated as permanently invested is based upon our expectations of the future cash needs of our subsidiaries. Income tax considerations are also a factor in determining the amount of earnings to be permanently invested. Because the declaration involves our future plans and expectations of future events, the possibility exists that amounts declared as permanently invested may ultimately be repatriated. This would result in additional income tax expense in the year we determine that amounts were no longer permanently invested.
On a quarterly basis, we estimate what our effective tax rate will be for the full calendar year by estimating pre-tax income, excluding significant or infrequently occurring items, and tax expense for the remaining quarterly periods of the year. The estimated annual effective tax rate is then applied to year-to-date pre-tax income to determine the estimated year-to-date and quarterly tax expense. The income tax effects of infrequent or unusual items are recognized in the quarterly period in which they occur. As the year progresses, we continually refine our estimate based upon actual events and earnings. This continual estimation process periodically results in a change to our expected annual effective tax rate. When this occurs, we adjust the income tax provision during the quarter in which the change in estimate occurs so that the year-to-date income tax provision equals the estimated annual rate. Our effective tax rate fluctuates mainly due to our geographic mix of sales and earnings. In addition, starting January 1, 2005, provision has not been made for United States income taxes on earnings of selected international subsidiary companies as these are intended to be permanently invested.
We evaluate the future realization of our deferred tax assets quarterly. We review each material tax jurisdiction for which a deferred tax asset has been recorded. Our analysis includes a review of past results, future income, the tax life of net operating loss carryforwards and tax credits. We assess whether a valuation allowance should be established based on the consideration of all available evidence using a “more-likely-than-not” standard. In making such judgments, significant weight is given
28
Table of Contents
to evidence that can be objectively verified. All evidence is evaluated in forming a conclusion whether a valuation allowance, if any, needs to be recorded. A cumulative loss in recent years is significant negative evidence in considering whether deferred tax assets are realizable.
We account for the uncertainty in income tax positions and use a minimum recognition threshold that a tax position must meet before recognition in the financial statements. The evaluation of a tax position is a two-step process. The first step is a recognition process to determine whether it is more-likely-than-not that a tax position will be sustained upon examination, including resolution of any related appeals or litigation processes, based on the technical merits of the position. In evaluating whether a tax position has met the more-likely-than-not recognition threshold, it is presumed that the position will be examined by the appropriate taxing authority that has full knowledge of all relevant information. The second step is a measurement process whereby a tax position that meets the more-likely-than-not recognition threshold is calculated to determine the amount of benefit/expense to recognize in the financial statements. The tax position is measured at the largest amount of benefit/expense that is greater than 50% likely of being realized upon ultimate settlement. Any tax position recognized would be an adjustment to the effective tax rate. We recognize interest expense and penalties on income tax liabilities in income tax expense on our Consolidated Statement of Earnings/Loss. We recognize our uncertain tax positions in either accrued income taxes, if determined to be short-term, or other liabilities if determined to be long-term, on our Consolidated Balance Sheet.
Goodwill and Intangible Assets
Indefinite-lived intangible assets are evaluated for impairment at least annually, and more often when events indicate that an impairment exists. Intangible assets with finite lives are amortized over their useful lives.
Events or changes in circumstances that may trigger impairment reviews include among other factors, significant changes in business climate, operating results, planned investments, or an expectation that the carrying amount may not be recoverable. The test for impairment involves the use of estimates relating to the fair values of business operations with which the goodwill is associated and the fair values of intangible assets with indefinite lives.
We review goodwill for impairment in a two-step process. The first step is to determine whether there is potential impairment by comparing the estimated fair value of a reporting unit to its carrying value (which includes goodwill). If the fair value exceeds the carrying value, then goodwill is not considered impaired, however, if the carrying amount exceeds the fair value, then step two is performed to measure the amount of impairment loss, if any. The second step compares the implied fair value of the reporting unit goodwill with the carrying amount of that goodwill. The implied fair value of goodwill is determined by allocating fair value to all assets and liabilities. The excess, if any, is the implied fair value of goodwill. If the implied fair value of goodwill is less than the carrying amount of goodwill, then impairment is recognized.
We review intangible assets related to trademarks for impairment, by determining fair value using a “relief from royalty payments” methodology. This approach involves two steps: (i) estimating reasonable royalty rates for each trademark and (ii) applying these royalty rates to a net sales stream and discounting the resulting cash flows to determine fair value. If the fair value is less than the carrying value then impairment is recognized.
Determining the fair value of goodwill and other intangible assets is highly subjective and requires the use of estimates and assumptions. We use estimates including estimated future revenues, royalty rates and discount rates, among other factors. We also consider the following factors:
| • | the asset’s ability to continue to generate income from operations and positive cash flow in future periods; |
29
Table of Contents
| • | changes in consumer demand or acceptance of our brands and products; and |
| • | other considerations that could affect fair value or otherwise indicate potential impairment. |
In addition, facts and circumstances could change, including further deterioration of general economic conditions, customers reducing orders in response to such conditions and increased competition. These and/or other factors could result in changes to the calculation of the fair value which could result in future impairment of the remaining goodwill and other intangible assets. Changes in any one or more of these estimates and assumptions could produce different financial results.
Other Contingencies
In the ordinary course of business, we are involved in legal proceedings involving contractual and employment relationships, product liability claims, trademark rights and a variety of other matters. We record contingent liabilities resulting from claims against us, including related legal costs, when it is probable that a liability has been incurred and the amount of the loss is reasonably estimable. We disclose contingent liabilities when there is a reasonable possibility that the ultimate loss will exceed the recorded liability. Estimating probable losses requires analysis of multiple factors, in some cases including judgment about the potential actions of third party claimants and courts. Therefore, actual losses in any future period are inherently uncertain. Currently, we do not believe that any of our pending legal proceedings or claims will have a material impact on our financial position or results of operations. However, if actual or estimated probable future losses exceed our recorded liability for such claims, we would record additional charges during the period in which the actual loss or change in estimate occurred.
Purchase of Form Athletics
On July 23, 2010, we entered into a Membership Interest Purchase Agreement (“Purchase Agreement”) with Form Athletics, LLC (“Form Athletics”) and its Members to purchase Form Athletics for $1,600,000 in cash. Pursuant to the Purchase Agreement, we are obligated to pay additional cash consideration to certain Members of Form Athletics in an amount equal to Form Athletics’ EBITDA for the twelve months ended December 31, 2012 (“Form CPP”). The purchase price of $1,600,000 and the net present value of the initial estimate of the Form CPP was capitalized. The fair value of the Form CPP will be determined each quarter based on the net present value of the current quarter’s projection of Form Athletics’ EBITDA for the twelve months ended December 31, 2012. Any subsequent changes to the Form CPP will be recognized as interest income or interest expense during the applicable quarter. Form Athletics was established in January 2010 and designs, develops and distributes apparel for mixed martial arts under the Form Athletics brand worldwide. The purchase of Form Athletics was part of an overall strategy to enter the action sports market.
30
Table of Contents
The acquisition of Form Athletics was recorded as a 100% purchase acquisition and the Form CPP liability was recognized and accordingly, the results of operations of the acquired business are included in the Company’s Consolidated Financial Statements from the date of acquisition. A trademark asset totaling $3,150,000 and goodwill of $539,000 have been recognized for the amount of the excess purchase price paid over fair market value of the net assets acquired. The amount of goodwill that is deductible for tax purposes is $507,000 and will be amortized over 15 years. At July 23, 2010, the acquired assets and liabilities assumed in the purchase of Form Athletics was as follows (in thousands):
| Balance at July 23, 2010 |
||||
| Inventory |
$ | 39 | ||
| Intangible assets |
3,689 | |||
| Total assets |
$ | 3,728 | ||
| Current liabilities |
$ | 18 | ||
| Form CPP |
2,110 | |||
| Total liabilities |
2,128 | |||
| Contribution by K•Swiss Inc. |
1,600 | |||
| Total stockholders’ equity |
1,600 | |||
| Total liabilities and stockholders’ equity |
$ | 3,728 | ||
Results of Operations
The following table sets forth, for the periods indicated, the percentage of certain items in the consolidated statements of earnings relative to revenues.
| Year ended December 31, | ||||||||||||
| 2010 | 2009 | 2008 | ||||||||||
| Revenues |
100.0 | % | 100.0 | % | 100.0 | % | ||||||
| Cost of goods sold |
60.8 | 64.2 | 59.7 | |||||||||
| Gross profit |
39.2 | 35.8 | 40.3 | |||||||||
| Selling, general and administrative expenses |
65.7 | 49.1 | 42.7 | |||||||||
| Impairment on intangibles and goodwill |
— | 2.0 | — | |||||||||
| Other (expense)/income |
(1.5 | ) | (0.5 | ) | 9.2 | |||||||
| Interest income, net |
0.2 | 0.4 | 2.5 | |||||||||
| (Loss)/Earnings before income taxes and discontinued operations |
(27.8 | ) | (15.4 | ) | 9.3 | |||||||
| Income tax expense/(benefit) |
3.6 | (4.0 | ) | 1.8 | ||||||||
| Loss from discontinued operations, net of income tax benefit |
— | (0.2 | ) | (1.1 | ) | |||||||
| Net (loss)/earnings |
(31.4 | )% | (11.6 | )% | 6.4 | % | ||||||
2010 Compared to 2009
Revenue and Gross Profit Margin
Total revenues decreased 9.9% to $216,987,000 in 2010 from $240,729,000 in 2009. This decrease was attributable to a decrease in the volume of footwear sold, offset by an increase in the average underlying wholesale price per pair. The volume of footwear sold decreased 24.7% to 6,732,000 pair in 2010 from 8,944,000 pair in 2009. The average wholesale price per pair was $28.76 in 2010 and $25.06 in 2009, an increase of 14.8%.
31
Table of Contents
Domestic revenues decreased 8.7% to $92,382,000 in 2010 from $101,181,000 in 2009. International product revenues decreased 12.4% in 2010 to $116,513,000 from $133,041,000 in 2009. Licensing and other fees earned by the Company on sales by foreign licensees and distributors were $8,092,000 for 2010 and $6,507,000 for 2009, an increase of 24.4%. International revenues, as a percentage of total revenues, decreased to 57.4% in 2010 from 58.0% in 2009.
K•Swiss brand revenues decreased 14.6% to $185,513,000 in 2010 from $217,181,000 in 2009. This decrease was the result of a decrease in the volume of footwear sold, offset by an increase in the average underlying wholesale price per pair. The volume of footwear sold decreased 29.2% to 5,947,000 pair in 2010 from 8,395,000 pair in 2009. The average wholesale price per pair was $27.34 in 2010 and $23.91 in 2009, an increase of 14.3%, which resulted from the product mix of sales, including a higher percentage of performance product sold in 2010, which generally sell at a higher price than lifestyle product, and a lower percentage of sales of closeout product in 2010.
Palladium brand revenues increased 32.7% to $31,253,000 in 2010 (14.0% of which were derived from domestic sales) compared to $23,548,000 in 2009 (2.7% of which were derived from domestic sales). The increase in Palladium sales in 2010 was due to the increase in worldwide sales in regions other than France. We began marketing and selling Palladium product in these regions beginning in the second half of 2009. The volume of footwear sold increased 43.0% to 785,000 pair in 2010 from 549,000 pair in 2009, due to an increase in sales in regions other than France, as discussed above. The average underlying wholesale price per pair was $39.57 in 2010 and $42.69 in 2009, a decrease of 7.3%, resulting from closeout product in France selling at lower prices in 2010 compared to 2009.
Form Athletics brand revenues were $221,000 in 2010 (92.3% of which were derived from domestic sales), representing approximately five months of activity.
We believe the athletic and casual footwear industry experiences seasonal fluctuations, due to increased sales during certain selling seasons, including Easter, back-to-school and the year-end holiday seasons. We present full-line offerings for the Easter season for delivery during the first and second quarters and back-to-school season for delivery during the third quarter, but only limited offerings for the year-end holiday season.
At December 31, 2010, domestic and international futures orders with start ship dates from January through June 2011 were approximately $45,216,000 and $47,688,000, respectively, 52.8% higher and 7.1% lower, respectively, than such orders were at December 31, 2009 for start ship dates of the comparable period of the prior year. These orders are not necessarily indicative of revenues for subsequent periods because: (1) the mix of “future” and “at-once” orders can vary significantly from quarter to quarter and year to year and (2) the rate of customer order cancellations can also vary from quarter to quarter and year to year.
Overall gross profit margin, as a percentage of revenues, was 39.2% in 2010, an increase from 35.8% in 2009. This increase was largely the result of the lower level of sales of closeout product in 2010 compared to 2009. K•Swiss brand gross profit margin, as a percentage of revenues, was 38.0% in 2010, an increase from 36.2% in 2009. This increase was the result of the lower level of sales of closeout product in 2010 compared to 2009. Palladium brand gross profit margin, as a percentage of revenues, was 40.6% in 2010, a decrease from 42.9% in 2009. This decrease in was a result of lower gross profit margins earned in 2010 on closeout product in France. Our gross margins may not be comparable to some of our competitors as we recognize warehousing costs within selling, general and administrative expenses. These warehousing costs were $13,610,000 and $13,489,000 for 2010 and 2009, respectively.
32
Table of Contents
Selling, General and Administrative Expenses
Overall selling, general and administrative expenses increased 20.4% to $142,474,000 (65.7% of revenues) in 2010 from $118,303,000 (49.1% of revenues) in 2009. The increase in selling, general and administrative expenses during 2010 was the result of increases in advertising expenses, offset by decreases in data processing expenses and compensation expenses. Advertising expenses increased 105.9% as a result of strategic efforts to drive revenue in both domestic and international markets. Data processing costs decreased 35.4% as a result of the decreases in on-going maintenance expense for our SAP computer software system due to the completion of the SAP implementation in certain international regions in the fourth quarter of 2008. Compensation expenses, which include commissions, bonus/incentive related expenses and employee recruiting and relocation expenses, decreased 5.3% mainly as a result of decreases in average headcount from 2009 and stock option compensation expenses. Corporate expenses of $17,222,000 and $18,766,000 for the years ended December 31, 2010 and 2009, respectively, are included in selling, general and administrative expenses. The decrease in corporate expenses for 2010 was a result of decreases in data processing expenses and compensation expenses, as discussed above.
Impairment on Intangibles and Goodwill
An impairment charge of $2,653,000 on the intangible assets related to the trademarks of the Palladium brand was recognized for 2009 as a result of the Company’s annual reassessment of impairment using the relief from royalty payment methodology, which uses current market discount rates and royalty rates.
Goodwill impairment of $2,177,000 was also recognized on the Palladium brand for 2009. As part of its annual reassessment of impairment, the Company determined the fair value of the reporting unit using both an income approach (i.e., “discounted cash flow” methodology) and a market approach (i.e., “guideline public company” and “guideline transactions” methodologies). As a result of the assessment, primarily based on deteriorating economic market conditions in 2009, it was determined that goodwill was impaired.
These impairment charges are included as corporate expenses for 2009.
Other Income, Interest and Taxes
Other expense for 2010 consists of the recognition of $3,320,000, which represents the net present value of the estimated CPP for Palladium, as discussed below. Other expense for 2009 includes a loss upon the purchase of the remaining 43% equity interest of Palladium of $2,616,000, offset by a gain on the sale of certain assets of the Royal Elastics brand of $1,367,000.
On May 1, 2010, we entered into Amendment No. 2 to the Share Purchase and Shareholders’ Rights Agreement, dated as of May 16, 2008, as amended by Amendment No. 1 dated June 2, 2009, by and among an individual, Palladium SAS and K•Swiss Inc., to revise the terms of the remaining future purchase price for Palladium payable in 2013. Pursuant to Amendment No. 2, the fair value of the future purchase price for Palladium, i.e. the CPP, will be equal to the net present value of €3,000,000 plus up to €500,000 based on an amount calculated in accordance with a formula driven by Palladium’s EBITDA for the twelve months ended December 31, 2012. The €500,000 CPP will be determined each quarter based on the current quarter’s projection of Palladium’s EBITDA for the twelve months ended December 31 of the current year. For 2010, the Company recognized the initial fair value of the CPP of $3,320,000 as other expense in the Company’s Consolidated Statement of Earnings/Loss, which represented the net present value of €3,000,000 at June 30, 2010. For 2010, interest expense of $369,000 was recognized for the change in the net present value of the CPP.
33
Table of Contents
On June 16, 2009, we purchased the remaining 43% equity interest in Palladium for €5,000,000 (or $7,034,000) and recognized a loss of $2,616,000 on the purchase. The loss was calculated as the difference between the purchase price and the recorded Mandatorily Redeemable Minority Interest (“MRMI”). We acquired the initial 57% equity interest in Palladium on July 1, 2008 and the acquisition of Palladium was recorded as a 100% purchase acquisition without reflecting any minority interest but recognizing the MRMI liability. For 2009, interest expense of $658,000 was recognized for the change in the net present value of the MRMI.
On April 30, 2009, we sold certain Royal Elastics assets, consisting of its inventory located in Taiwan and its intangible trademarks, with an approximate net book value of $1,043,000, to Royal Elastics Holdings Ltd. (“REH”), a third party, in an arm’s length transaction for $4,000,000. In respect to this sale, we received a $1,104,000 promissory note from REH and REH agreed to pay us the remaining $2,896,000 in cash by April 30, 2010. As of December 31, 2010, however, we only received approximately $2,438,000 in cash. The difference between what we expected to receive and what had been received by April 30, 2010 was added to the principal amount of the promissory note balance, such that as of December 31, 2010, we hold a promissory note in the principal amount of approximately $1,562,000 from REH. Interest on the promissory note is payable quarterly at an interest rate of Wall Street Journal Prime plus 1%. The principal balance is due on April 30, 2016. The pre-tax gain on sale was $1,367,000 for 2009 and was recorded in Other (expense)/income, net on the Consolidated Statement of Earnings/Loss.
Net interest income was $435,000 (0.2% of revenues) and $1,050,000 (0.4% of revenues) for 2010 and 2009, respectively. The decrease in net interest income for the 2010 was a result of lower average balances in cash and investments available for sale as well as lower interest rates, offset by a decrease in the amount recognized for the change in the fair value of the CPP (in 2010) or MRMI (in 2009) and a decrease in interest expense on Palladium debt.
Our income tax expense was $7,932,000 for 2010 and our income tax benefit was $9,663,000 for 2009. We did not recognize income tax benefit of options exercised during 2010 as a result of our net loss for the year. The $550,000 income tax benefit of options exercised during 2009 was credited to additional paid-in capital and therefore did not impact the effective tax rate.
We evaluate our deferred tax assets, including net operating losses and tax credits, to determine if a valuation allowance is required. We assess whether a valuation allowance should be established based on the consideration of all available evidence using a “more-likely-than-not” standard. In making such judgments, significant weight is given to evidence that can be objectively verified. A cumulative loss in recent years is significant negative evidence in considering whether deferred tax assets are realizable.
During the second quarter, we moved into a three year pre-tax cumulative loss but had sufficient objectively verifiable evidence to demonstrate that our U.S. deferred tax assets would be realized, such as strong earnings history, no evidence of tax losses expiring unused and the end of our aggressive advertising campaign during 2010. During the third quarter of 2010, we continued to have the significant weight of the three year pre-tax cumulative loss to overcome. In addition to other significant positive evidence considered in the prior quarter, we decided during the third quarter of 2010 to continue with our aggressive advertising campaign into 2011. As such, we could no longer rely on a decrease in advertising expenses during 2011 to support future profitability sufficient enough to realize our U.S deferred tax assets in the near future. Therefore, in 2010, we recorded a valuation allowance of $27,178,000 against our deferred tax assets.
34
Table of Contents
At December 31, 2010 we had a net deferred tax asset after valuation allowance of $3,913,000. The ultimate realization of this net deferred tax asset is dependent upon the generation of future taxable income outside of the U.S. during the periods in which those temporary differences become deductible. Changes in existing tax laws could also affect actual tax results and the valuation of deferred tax assets over time. The deferred tax assets for which valuation allowances were not established relate to foreign jurisdictions where we expect to realize these assets. The accounting for deferred taxes is based upon an estimate of future operating results. Differences between the anticipated and actual outcomes of these future tax consequences could have a material impact on our consolidated results of operations or financial position.
At December 31, 2010 uncertain tax positions and the related interest were $6,302,000 and $1,044,000, respectively, all of which would affect the income tax rate if reversed. During 2010, we recognized income tax expense related to uncertain tax positions of $137,000 and interest expense on uncertain tax positions of $141,000. During 2009, we recognized income tax expense related to uncertain tax positions of $45,000 and interest expense on uncertain tax positions of $147,000.
In 2010, we received a Notice of Proposed Adjustment from the Internal Revenue Service (“IRS”) for the tax years 2006 and 2007 of $7,114,000 (which includes $1,186,000 in penalties). Interest will be assessed, and at this time it is estimated at approximately $1,316,000. We sent a protest letter to the IRS in June 2010. The IRS examiner disagreed with our protest. This issue has been sent to the IRS Appeal’s office for further consideration. We do not agree with this adjustment and plan to vigorously defend our position. We do not believe that an additional tax accrual is required at this time.
The net loss for 2010 was $68,212,000, or $1.94 per share (diluted loss per share), compared to the net loss for 2009 of $27,962,000, or $0.80 per share (diluted loss per share). Net loss and diluted loss per share for 2010 included the pre-tax expense of $3,320,000 related to the net present value of the CPP, or $0.09 per diluted share (after tax). Net loss and diluted loss per share for 2009 included the pre-tax impairment charge on the goodwill and intangible assets related to the trademarks of the Palladium brand of $4,830,000 and the pre-tax loss of $2,616,000 from the purchase of the remaining 43% equity interest of Palladium, offset by the net pre-tax gain on the sale of certain Royal Elastics assets of $1,367,000, described above, or $0.18 per diluted share (after tax).
2009 Compared to 2008
Revenue and Gross Profit Margin
Total revenues decreased 26.5% to $240,729,000 in 2009 from $327,405,000 in 2008. This decrease was attributable to a decrease in the volume of footwear sold and a decrease in the average underlying wholesale price per pair. The volume of footwear sold decreased 21.4% to 8,944,000 pair in 2009 from 11,384,000 pair in 2008. The average wholesale price per pair was $25.06 in 2009 and $27.56 in 2008, a decrease of 9.1%.
Domestic revenues decreased 26.9% to $101,181,000 in 2009 from $138,390,000 in 2008. International product revenues decreased 26.7% in 2009 to $133,041,000 from $181,380,000 in 2008. Licensing and other fees earned by the Company on sales by foreign licensees and distributors were $6,507,000 for 2009 and $7,635,000 for 2008, a decrease of 14.8%. International revenues, as a percentage of total revenues, increased to 58.0% in 2009 from 57.7% in 2008.
K•Swiss brand revenues decreased 31.3% to $217,181,000 in 2009 from $315,913,000 in 2008. This decrease was the result of a decrease in the volume of footwear sold and a decrease in the average underlying wholesale price per pair. The volume of footwear sold decreased 25.0% to 8,395,000 pair in 2009 from 11,187,000 pair in 2008. The average wholesale price per pair was $23.91
35
Table of Contents
in 2009 and $27.02 in 2008, a decrease of 11.5%, which resulted from the product mix of sales, including a higher percentage of sales of closeout product, and from the geographic mix of sales, in which domestic sales generally sell at a lower price; and a general decline in worldwide selling prices.
Palladium brand revenues were $23,548,000 in 2009 (2.7% of which were derived from domestic sales) compared to $11,492,000 for the six month period ended December 31, 2008 (all of this revenue was derived from sales outside the U.S.). We purchased Palladium in July 2008. See Note P to our Consolidated Financial Statements for further discussion.
Overall gross profit margin, as a percentage of revenues, was 35.8% in 2009, a decrease from 40.3% in 2008. Gross profit margin was affected by product mix changes, including a higher percentage of closeout product sales, which carry a lower gross profit margin than our non-closeout product sales, geographic mix of sales and a general decline in sales prices. On August 5, 2009, the Company settled the underpayment of business taxes in a foreign jurisdiction for approximately $1,529,000 plus interest of approximately $1,185,000, with no penalties assessed. Warehousing costs were $13,489,000 and $16,537,000 for 2009 and 2008, respectively.
Selling, General and Administrative Expenses
Overall selling, general and administrative expenses decreased 15.4% to $118,303,000 (49.1% of revenues) in 2009 from $139,899,000 (42.7% of revenues) in 2008. The decrease in selling, general and administrative expenses during 2009 was the result of decreases in advertising expenses, data processing expenses, compensation expenses and legal expenses. Advertising expenses decreased 29.5% primarily due to decreases in both our domestic and international markets as part of an effort to reduce costs as our business declines. Data processing costs decreased 31.9% as a result of the decrease in on-going maintenance expense for our SAP computer software system, as discussed above. Compensation expenses, which includes commissions, bonus/incentive related expenses and employee recruiting and relocation expenses, decreased 6.7% as a result of decreases in headcount and other bonuses/incentive related expenses, offset by an increase in stock option compensation expenses. Legal expenses decreased 39.8% as a result of the decreased expenses incurred to defend our trademarks. Corporate expenses of $18,766,000 and $25,931,000 for the years ended December 31, 2009 and 2008, respectively, are included in selling, general and administrative expenses. The decrease in corporate expenses for 2009 was a result of decreases in data processing expenses, legal expenses and accounting expenses. The decrease in data processing expenses and legal expenses are due to the reasons discussed above. The decrease in accounting expense was a result of lower auditing fees for non-recurring 2008 events and a reduction of the outsourcing of certain accounting services.
Impairment on Intangibles and Goodwill
As discussed above, an intangible trademark asset impairment of $2,653,000 and goodwill impairment of $2,177,000 was recognized on the Palladium brand for 2009.
Other Income, Interest and Taxes
As discussed above, other expense for 2009 includes a loss upon the purchase of the remaining 43% equity interest of Palladium of $2,616,000, offset by a gain on the sale of certain assets of the Royal Elastics brand of $1,367,000.
Other income for the year ended December 31, 2008 consists of a $30,000,000 payment received as a result of a settlement agreement with Payless ShoeSource, Inc., a Missouri corporation and Payless ShoeSource Inc., a Delaware corporation (collectively, “Payless”) in connection with our 2004
36
Table of Contents
action filed against Payless in the United States District Court for the Central District of California (Western District), in which we alleged trademark and trade dress infringement, trademark dilution, unfair competition and breach of contract. The settlement agreement provided, among other things, that Payless would pay to us $30,000,000 in compensatory damages claimed by us from Payless’ advertising, promotion and sale of certain footwear.
Overall net interest income was $1,050,000 (0.4% of revenues) in 2009 compared to $8,216,000 (2.5% of revenues) in 2008. The decrease in net interest income for the year ended December 31, 2009 was the result of lower average cash balances, lower interest rates, interest expense incurred by Palladium on lines of credit and term loans, and recognition of the change in the fair value of the MRMI.
Our income tax benefit was $9,663,000 for 2009 and our income tax expense was $5,882,000 for 2008. The $550,000 and $823,000 income tax benefit of options exercised during 2009 and 2008, respectively, were credited to additional paid-in capital and therefore did not impact the effective tax rate.
At December 31, 2009, uncertain tax positions and the related interest were $6,165,000 and $903,000, respectively, all of which would affect the income tax rate if reversed. During 2009, we recognized income tax expense related to uncertain tax positions of $45,000 and interest expense on uncertain tax positions of $147,000. During 2008, we recognized income tax expense related to uncertain tax positions of $782,000 and interest expense on uncertain tax positions of $160,000.
The net loss for 2009 was $27,962,000, or $0.80 per share (diluted loss per share), compared to net earnings of $20,885,000, or $0.59 per share (diluted earnings per share), for 2008. Net loss and diluted loss per share for 2009 included the pre-tax impairment charge on the goodwill and intangible assets related to the trademarks of the Palladium brand of $4,830,000 and the pre-tax loss of $2,616,000 from the purchase of the remaining 43% equity interest of Palladium, offset by the net pre-tax gain on the sale of certain Royal Elastics assets of $1,367,000, described above, or $0.18 per diluted share (after tax). Net earnings and diluted earnings per share for 2008 included the pre-tax settlement of litigation of $30,000,000, described above, or $0.52 per diluted share (after tax).
Liquidity and Capital Resources
We experienced net cash used in operating activities from continuing operations of $46,735,000 and $22,476,000 during 2010 and 2009, respectively, and net cash provided by operating activities from continuing operations of $17,510,000 during 2008. The increase in cash used in operating activities during 2010 was due to the increase in net loss and differences in the amounts of changes in inventories, prepaid expenses and other assets, impairment of intangibles and goodwill and accounts receivable, offset by the differences in the amounts of changes in accounts payable and accrued liabilities, income taxes receivable, deferred income taxes and CPP/MRMI. The increase in cash used in operating activities during 2009 was due to the net loss in 2009 compared to net earnings in 2008 and differences in the amounts of changes in accounts payable and accrued liabilities, income taxes receivable and CPP/MRMI, offset by the differences in the amounts of changes in inventories, accounts receivable, impairment of intangibles and goodwill and deferred income taxes. The changes in inventory during 2010 and 2009 were due to the timing of sales to customers and purchases from suppliers and, starting in 2009, a focus on improving inventory management. The changes in accounts payable and accrued liabilities during 2010 and 2009 were due to the timing of payments to suppliers. The changes in accounts receivable during 2010 and 2009 were due to the timing of sales to customers and receipts from customers. The increase in prepaid expenses and other current assets during 2010 is due to an increase in prepaid royalties, endorsements and prepaid inventory. The changes in impairment of intangibles and goodwill was due to the recognition of impairment during
37
Table of Contents
2009. The changes in income taxes receivable was due to the recognition of a receivable in 2009 which was fully collected in 2010. The changes in the deferred income taxes is mainly due to the recognition of the tax valuation allowance in 2010 and timing of items recognized for income tax purposes. During 2010, we recognized the initial recording and subsequent valuation of the Palladium CPP, while in 2009 we purchased the remaining 43% of Palladium which reduced the MRMI balance to zero.
We experienced net cash used in investing activities of $40,401,000, $54,829,000 and $13,749,000 during 2010, 2009 and 2008, respectively. The decrease in cash used in investing activities during 2010 was mainly due to changes in restricted cash and cash equivalents and proceeds from the sale or maturity of investments held for sale, offset by an increase in purchases of investments available for sale and restricted investments available for sale and the purchase of Form Athletics. The increase in cash used in investing activities during 2009 was mainly due to changes in restricted cash and cash equivalents and the purchase of investments available for sale, offset by the purchase of intangible assets in 2008, the purchase of Palladium in 2008 and a decrease in the purchase of the property plant and equipment. The changes in restricted cash and cash equivalents, investments available for sale and restricted investments available for sale are partially due to the Company’s strategy to shift to higher yielding liquid investments or liquidation of investments into cash for operating activities.
We experienced net cash used in financing activities of $1,989,000 during 2010, net cash provided by financing activities of $207,000 during 2009 and net cash used in financing activities of $76,299,000 during 2008. The change in cash used in financing activities during 2010 was mainly due to an increase in net borrowings on Palladium lines of credit and long-term debt, based on cash needs. The change in cash provided by financing activities during 2009 was mainly due to a decrease in payment of cash dividends (which included our special cash dividend of $2.00 per share on December 24, 2008), a decrease in purchases of our outstanding stock under our then-current stock repurchase program, offset by an increase in net repayments on Palladium lines of credit and long-term debt, based on cash needs.
We anticipate future cash needs for repayments required pursuant to borrowings under Palladium’s lines of credit facilities and term loans. In addition, depending on our future operating results, additional funds may be required by operating activities. No other material capital commitments exist at December 31, 2010. With continued use of our revolving credit facilities (as discussed below), we believe our present and currently anticipated sources of capital are sufficient to sustain our anticipated capital needs for the remainder of 2011.
In November 2009, the Board of Directors approved a stock repurchase program to purchase through December 31, 2014 up to $70,000,000 of the Company’s Class A Common Stock. As of December 31, 2010, $70,000,000 is remaining in this program. We adopted the $70,000,000 program because we believed that depending upon the then-array of alternatives, repurchasing our shares could be a good use of excess cash. Currently, we have made purchases under all stock repurchase programs from August 1996 through February 16, 2011 (the day prior to the filing of this Form 10-K) of 25.5 million shares at an aggregate cost totaling approximately $166,759,000, at an average price of $6.55 per share. See “Part II – Item 5. Market for Registrant’s Common Equity, Related Stockholder Matters and Issuer Purchases of Equity Securities.”
At December 31, 2010 and 2009, we had debt outstanding of $970,000 and $4,207,000 (in each case attributable to outstanding borrowings by Palladium under its lines of credit facilities and term loans), respectively, (excluding outstanding letters of credit of $2,362,000 and $700,000 at December 31, 2010 and 2009, respectively).
38
Table of Contents
The terms of and current borrowings under our lines of credit with Bank of America, N.A. (the “Bank”) (not including borrowings by Palladium) as of December 31, 2010 are as follows (dollars in thousands):
| Amount Outstanding |
Outstanding Letters of Credit |
Unused Lines of Credit |
Total | Interest Rate |
Expiration Date | |||||||||||||
| $ — |
$ | 2,362 | $ | 18,638 | $ | 21,000 | Prime - 0.75%, or 2.50% | July 1, 2013 | ||||||||||
Pursuant to the Loan Agreement between us and the Bank (“Loan Agreement”), dated as of June 30, 2010, the Bank has agreed to provide us with a revolving line of credit in an aggregate principal amount not to exceed (i) $21,000,000 minus (ii) the aggregate amount of borrowings by certain foreign subsidiaries of the Company (the “Foreign Subsidiary Borrowers”) under credit facilities with the Bank or any affiliate of the Bank (such revolving line of credit, the “Facility”), with sublimits for letters of credit and bankers acceptances, in each case not to exceed $5,000,000. The Facility matures on July 1, 2013, unless earlier terminated pursuant to the terms of the Loan Agreement. At the Bank’s option, the availability of the Facility may be extended beyond July 1, 2013.
Interest under the Facility is payable on the first day of each month, commencing on July 1, 2010, at an annual rate of, at our option, (i) the Bank’s prime rate minus 0.75 percentage points, or (ii) IBOR plus 1.25 percentage points, subject to the terms specified in the Loan Agreement. The Facility carries an unused commitment fee of 0.125% per year, payable on the first day of each quarter, commencing on July 1, 2010.
Pursuant to the Loan Agreement, we have agreed to secure our obligations under the Facility with securities and other investment property owned by us in certain securities accounts (the “Collateral Accounts,” or our restricted cash and cash equivalents and restricted investments available for sale) and to guarantee the obligations of the Foreign Subsidiary Borrowers under their credit facilities with the Bank, or any affiliate of the Bank. The obligations of the Company under the Facility are guaranteed by our wholly owned subsidiary, K•Swiss Sales Corp.
The Loan Agreement contains covenants that prevent us from, among other things, incurring other indebtedness, granting liens, selling assets outside of the ordinary course of business, making other investments and engaging in any consolidation, merger or other combination.
The Loan Agreement contains certain events of default, including payment defaults, a cross-default upon a default under any credit facility extended by the Bank or any of its affiliates to a subsidiary of the Company, a defined change of control, certain bankruptcy and insolvency events and certain covenant defaults. If an event of default occurs, the Bank may stop making any additional credit available to us, require us to repay our entire debt under the Loan Agreement immediately and exercise remedies against any Collateral Account.
39
Table of Contents
The terms of and current borrowing under Palladium’s lines of credit facilities and term loans at December 31, 2010 was as follows (dollars in thousands):
| Amount Outstanding |
Outstanding Letters of Credit |
Unused Lines of Credit |
Total | Interest Rate at December 31, 2010 |
Expiration Date | |||||||||||||||||||
| Secured lines of credit (1) |
$ | 68 | $ | — | $ | 1,260 | $ | 1,328 |
|
Variable, 2.21% - 2.99% |
|
June 30, 2011 | ||||||||||||
| Secured line of credit |
205 | — | 5,109 | 5,314 | Variable, 1.69% | December 31, 2011 | ||||||||||||||||||
| Fixed rate loans |
689 | — | — | 689 | 5.42% - 5.84% | 2012 - 2013 | ||||||||||||||||||
| Accrued interest |
8 | — | — | 8 | ||||||||||||||||||||
| $ | 970 | $ | — | $ | 6,369 | $ | 7,339 | |||||||||||||||||
| (1) | Under these lines of credit, the facility amount available between July 1 through December 31, 2010 was €1,000 (or approximately $1,328). The credit facilities expiring on December 31, 2010 were renewed until June 30, 2011 and the maximum facility amount available between January 1 and June 30, 2011 ranges from €1,150 to €1,350 (or approximately $1,528 to $1,793). |
There were no letters of credit outstanding under these facilities at December 31, 2010 and 2009. Interest expense of $118,000 and $214,000 was incurred on Palladium’s bank loans and lines of credit during 2010 and 2009, respectively.
In accordance with these financing arrangements with the financial institutions, Palladium must meet minimum working capital requirements and is restricted as to the amount of dividends it can pay. At December 31, 2010, Palladium was in compliance with its debt covenants. See Note G to our Consolidated Financial Statements for further discussion.
Our working capital decreased $57,413,000 to $202,238,000 at December 31, 2010 from $259,651,000 at December 31, 2009. Working capital decreased during 2010 mainly due to decreases in cash and cash equivalents, income taxes receivable, accounts receivable and current deferred income taxes and increases in trade accounts payable, offset by increases in investments available for sale, inventory and prepaid expenses and other current assets and decreases bank lines of credit and current portion of long-term debt.
We have historically maintained higher levels of inventories relative to sales compared to our competitors because (1) we do not ship directly to our major domestic customers from our foreign contract manufacturers to the same extent as our larger competitors, which would reduce inventory levels and increase inventory turns, and (2) unlike many of our competitors, we designate certain shoes as core products whereby we commit to our retail customers that we will carry core products from season to season and, therefore, we attempt to maintain open-stock positions on our core products in our distribution facilities to meet at-once orders.
40
Table of Contents
Contractual Obligations
At December 31, 2010, our significant contractual obligations were as follows (in thousands):
| Payments due by period | ||||||||||||||||||||
| Total | Less than one year |
One to three years |
Three to five years |
More than five years |
||||||||||||||||
| Operating lease obligations |
$ | 21,366 | $ | 6,328 | $ | 8,568 | $ | 4,298 | $ | 2,172 | ||||||||||
| Endorsement obligations |
11,571 | 5,615 | 5,919 | 37 | — | |||||||||||||||
| Royalty obligations |
2,950 | 1,170 | 1,750 | 30 | — | |||||||||||||||
| Bank debt |
970 | 566 | 252 | 152 | — | |||||||||||||||
| Contingent purchase payments |
5,799 | — | 5,799 | — | — | |||||||||||||||
| Product purchase obligations (1) |
60,391 | 60,391 | — | — | — | |||||||||||||||
| Total |
$ | 103,047 | $ | 74,070 | $ | 22,288 | $ | 4,517 | $ | 2,172 | ||||||||||
| (1) | We generally order product four to five months in advance of sales based primarily on advance futures orders received from customers. The amounts listed for product purchase obligations represent open purchase orders to purchase products in the ordinary course of business that are enforceable and legally binding. |
Off-Balance Sheet Arrangements
We did not enter into any off-balance sheet arrangements during 2010 or 2009, nor did we have any off-balance sheet arrangements outstanding at December 31, 2010 or 2009.
Inflation
We believe that distributors of footwear in the higher priced end of the footwear market, including ours, are able to adjust their prices in response to an increase in direct and general and administrative expenses in order to partially or completely offset rising prices, without experiencing a significant loss in sales. Accordingly, to date, inflation and changing prices have not had a material adverse effect on our revenues or earnings. However, based on economic circumstances, especially in China, we may experience upward price pressure for product during 2011.
| Item 7A. | Quantitative and Qualitative Disclosures About Market Risk |
Market Risk
Market risk is the potential change in an instrument’s value caused by, for example, fluctuations in interest and currency exchange rates. Our primary market risk exposure is the risk of unfavorable movements in exchange rates between the U.S. dollar and the Euro, U.S. dollar and the Pound Sterling and between the Euro and the Pound Sterling. Monitoring and managing these risks is a continual process carried out by senior management, which reviews and approves our risk management policies. Market risk is managed based on an ongoing assessment of trends in foreign exchange rates and economic developments, giving consideration to possible effects on both total return and reported earnings.
Foreign Exchange Rate Risk
Sales denominated in currencies other than the U.S. dollar, which are primarily sales to customers in Europe, expose us to market risk from material movements in foreign exchange rates between the U.S. dollar and the foreign currency. Our primary risk exposures are from changes in the rates
41
Table of Contents
between the U.S. dollar and the Euro, U.S. dollar and the Pound Sterling and between the Euro and the Pound Sterling. In 2010 and 2009, we entered into forward foreign exchange contracts to exchange Euros for U.S. dollars and Pound Sterling for Euros, and also in 2009, Pound Sterling for U.S. dollars. The extent to which forward foreign exchange contracts are used is modified periodically in response to management’s estimate of market conditions and the terms and length of specific sales contracts.
We enter into forward foreign exchange contracts in order to reduce the impact of foreign currency fluctuations and not to engage in currency speculation. The use of derivative financial instruments allows us to reduce our exposure to the risk that the eventual net cash inflow resulting from the sale of products to foreign customers will be materially affected by changes in exchange rates. We do not hold or issue financial instruments for trading purposes. The forward foreign exchange contracts are designated for firmly committed or forecasted sales. These contracts settle in less than one year.
The forward foreign exchange contracts generally requires us to exchange Euros for U.S. dollars, Pound Sterling for U.S. dollars or Pound Sterling for Euros at maturity, at rates agreed upon at the inception of the contracts. Our counterparties to derivative transactions are major financial institutions with an investment grade or better credit rating; however, we are exposed to credit risk with these institutions. The credit risk is limited to the unrealized gains in such contracts should these counterparties fail to perform as contracted.
At December 31, 2010, forward foreign exchange contracts with a notional value of $21,990,000 were outstanding to exchange various currencies with maturities ranging from January 2011 to September 2011, to sell the equivalent of approximately $5,290,000 in foreign currencies at contracted rates and to buy approximately $16,700,000 in foreign currencies at contracted rates. These contracts have been designated as cash flow hedges. Realized losses of $326,000 for 2010, realized gains of $1,810,000 for 2009 and realized losses of $1,708,000 for 2008, from cash flow hedges were recorded in cost of goods sold. Realized gains of $81,000, $258,000 and $1,036,000 for 2010, 2009 and 2008, respectively, from cash flow hedges were recorded in selling, general and administrative expenses due to hedge ineffectiveness. Realized losses of $6,000 for 2009 and realized gains of $586,000 for 2008 from forward contracts not designated as hedging instruments were recorded in selling, general and administrative expenses. At December 31, 2010, we did not have any forward foreign exchange contracts that do not qualify as hedges.
We do not anticipate any material adverse effect on our operations or financial position relating to these forward foreign exchange contracts. Based on our overall currency rate exposure at December 31, 2010, a 1% change in currency rates would not have a material effect on the financial position, results of operations or cash flows of the Company.
Interest Rate Risk
We are exposed to changes in interest rates primarily as a result of our short-term borrowings on our working capital lines of credit. A 1% change in interest rates would not have a material effect on the financial position, results of operations or cash flows of the Company.
| Item 8. | Financial Statements and Supplementary Data |
The Consolidated Financial Statements required in response to this item are submitted as part of Item 15(a) of this Report.
42
Table of Contents
REPORT OF INDEPENDENT REGISTERED PUBLIC ACCOUNTING FIRM ON
INTERNAL CONTROL OVER FINANCIAL REPORTING
Board of Directors and Shareholders
K•Swiss Inc.
We have audited K•Swiss Inc.’s (a Delaware Corporation) internal control over financial reporting as of December 31, 2010, based on criteria established in Internal Control—Integrated Framework issued by the Committee of Sponsoring Organizations of the Treadway Commission (COSO). K•Swiss Inc.’s management is responsible for maintaining effective internal control over financial reporting and for its assessment of the effectiveness of internal control over financial reporting, included in the accompanying Management’s Report of Internal Control Over Financial Reporting. Our responsibility is to express an opinion on K•Swiss Inc.’s internal control over financial reporting based on our audit.
We conducted our audit in accordance with the standards of the Public Company Accounting Oversight Board (United States). Those standards require that we plan and perform the audit to obtain reasonable assurance about whether effective internal control over financial reporting was maintained in all material respects. Our audit included obtaining an understanding of internal control over financial reporting, assessing the risk that a material weakness exists, testing and evaluating the design and operating effectiveness of internal control based on the assessed risk, and performing such other procedures as we considered necessary in the circumstances. We believe that our audit provides a reasonable basis for our opinion.
A company’s internal control over financial reporting is a process designed to provide reasonable assurance regarding the reliability of financial reporting and the preparation of financial statements for external purposes in accordance with generally accepted accounting principles. A company’s internal control over financial reporting includes those policies and procedures that (1) pertain to the maintenance of records that, in reasonable detail, accurately and fairly reflect the transactions and dispositions of the assets of the company; (2) provide reasonable assurance that transactions are recorded as necessary to permit preparation of financial statements in accordance with generally accepted accounting principles, and that receipts and expenditures of the company are being made only in accordance with authorizations of management and directors of the company; and (3) provide reasonable assurance regarding prevention or timely detection of unauthorized acquisition, use, or disposition of the company’s assets that could have a material effect on the financial statements.
Because of its inherent limitations, internal control over financial reporting may not prevent or detect misstatements. Also, projections of any evaluation of effectiveness to future periods are subject to the risk that controls may become inadequate because of changes in conditions, or that the degree of compliance with the policies or procedures may deteriorate.
In our opinion, K•Swiss Inc. maintained, in all material respects, effective internal control over financial reporting as of December 31, 2010, based on criteria established in Internal Control—Integrated Framework issued by COSO.
We also have audited, in accordance with the standards of the Public Company Accounting Oversight Board (United States), the consolidated balance sheets of K•Swiss Inc. as of December 31, 2010 and 2009, and the related consolidated statements of earnings/loss and comprehensive earnings/loss, stockholders’ equity, and cash flows for each of the three years in the period ended December 31, 2010 and our report dated February 16, 2011 expressed an unqualified opinion on those financial statements.
/s/ GRANT THORNTON LLP
Los Angeles, California
February 16, 2011
43
Table of Contents
MANAGEMENT’S REPORT ON INTERNAL CONTROL OVER FINANCIAL REPORTING
Management of K•Swiss Inc. (the “Company”) is responsible for establishing and maintaining adequate internal control over financial reporting and for the assessment of the effectiveness of internal control over financial reporting. As defined by the Securities and Exchange Commission, internal control over financial reporting is a process designed by, or supervised by, the Company’s principal executive and principal financial officers, to provide reasonable assurance regarding the reliability of financial reporting and the preparation of financial statements in accordance with generally accepted accounting principles.
The Company’s internal control over financial reporting is supported by written policies and procedures, that (1) pertain to the maintenance of records that, in reasonable detail, accurately and fairly reflect the transactions and dispositions of the Company’s assets; (2) provide reasonable assurance that transactions are recorded as necessary to permit preparation of financial statements in accordance with generally accepted accounting principles, and that receipts and expenditures of the Company are being made only in accordance with authorizations of the Company’s management and directors; and (3) provide reasonable assurance regarding prevention or timely detection of unauthorized acquisition, use or disposition of the Company’s assets that could have a material effect on the financial statements.
Because of its inherent limitations, internal control over financial reporting may not prevent or detect misstatements. Projections of any evaluation of effectiveness to future periods are subject to the risk that controls may become inadequate because of changes in conditions, or that the degree of compliance with the policies or procedures may deteriorate.
In connection with the preparation of the Company’s annual financial statements, management of the Company has undertaken an assessment of the effectiveness of the Company’s internal control over financial reporting as of December 31, 2010 based on criteria established in Internal Control— Integrated Framework issued by the Committee of Sponsoring Organizations of the Treadway Commission. Management’s assessment included an evaluation of the design of the Company’s internal control over financial reporting and testing of the operational effectiveness of the Company’s internal control over financial reporting.
Based on this assessment, management did not identify any material weakness in the Company’s internal control, and management has concluded that the Company’s internal control over financial reporting was effective as of December 31, 2010.
Grant Thornton LLP, the registered public accounting firm that audited the Company’s financial statements, has issued a report on internal control over financial reporting, a copy of which is included in this annual report on Form 10-K.
February 16, 2011
44
Table of Contents
REPORT OF INDEPENDENT REGISTERED PUBLIC ACCOUNTING FIRM
Board of Directors and Shareholders
K•Swiss Inc.
We have audited the accompanying consolidated balance sheets of K•Swiss Inc. (a Delaware corporation) and subsidiaries as of December 31, 2010 and 2009, and the related consolidated statements of earnings/loss and comprehensive earnings/loss, stockholders’ equity, and cash flows for each of the three years in the period ended December 31, 2010. Our audits of the basic financial statements included Schedule II—Valuation and Qualifying Accounts. These financial statements and financial statement schedule are the responsibility of the Company’s management. Our responsibility is to express an opinion on these financial statements and financial statement schedule based on our audits.
We conducted our audits in accordance with the standards of the Public Company Accounting Oversight Board (United States). Those standards require that we plan and perform the audit to obtain reasonable assurance about whether the financial statements are free of material misstatement. An audit includes examining, on a test basis, evidence supporting the amounts and disclosures in the financial statements. An audit also includes assessing the accounting principles used and significant estimates made by management, as well as evaluating the overall financial statement presentation. We believe that our audits provide a reasonable basis for our opinion.
In our opinion, the financial statements referred to above present fairly, in all material respects, the financial position of K•Swiss Inc. as of December 31, 2010 and 2009, and the results of their operations and their cash flows for each of the three years in the period ended December 31, 2010 in conformity with accounting principles generally accepted in the United States of America. Also in our opinion, the related financial statement schedule, when considered in relation to the basic financial statements taken as a whole, presents fairly, in all material respects, the information set forth therein.
We also have audited, in accordance with the standards of the Public Company Accounting Oversight Board (United States), K•Swiss Inc.’s internal control over financial reporting as of December 31, 2010, based on criteria established in Internal Control—Integrated Framework issued by the Committee of Sponsoring Organizations of the Treadway Commission (COSO) and our report dated February 16, 2011 expressed an unqualified opinion thereon.
/s/ GRANT THORNTON LLP
Los Angeles, California
February 16, 2011
45
Table of Contents
CONSOLIDATED BALANCE SHEETS
December 31,
(Dollar amounts in thousands)
| 2010 | 2009 | |||||||
| A S S E T S | ||||||||
| CURRENT ASSETS |
||||||||
| Cash and cash equivalents (Note A4) |
$ | 49,164 | $ | 139,663 | ||||
| Restricted cash and cash equivalents and restricted investments available for sale |
22,918 | 22,270 | ||||||
| Investments available for sale (Note C) |
66,277 | 31,209 | ||||||
| Accounts receivable, less allowance for doubtful accounts of $1,780 and $2,162 |
24,040 | 27,487 | ||||||
| Inventories (Note A5) |
66,959 | 48,183 | ||||||
| Prepaid expenses and other current assets (Notes A12 and F) |
5,058 | 2,472 | ||||||
| Income taxes receivable (Notes A9 and J) |
770 | 13,821 | ||||||
| Deferred income taxes (Notes A9 and J) |
— | 2,881 | ||||||
| Total current assets |
235,186 | 287,986 | ||||||
| PROPERTY, PLANT AND EQUIPMENT, net (Notes A6, A7, D and O) |
20,695 | 22,053 | ||||||
| OTHER ASSETS |
||||||||
| Intangible assets (Notes A8 and E) |
18,212 | 15,259 | ||||||
| Deferred income taxes (Notes A9 and J) |
3,913 | 9,538 | ||||||
| Other |
10,159 | 9,314 | ||||||
| Total other assets |
32,284 | 34,111 | ||||||
| $ | 288,165 | $ | 344,150 | |||||
| L I A B I L I T I E S A N D S T O C K H O L D E R S’ E Q U I T Y | ||||||||
| CURRENT LIABILITIES |
||||||||
| Bank lines of credit and current portion of long-term debt (Note G) |
$ | 566 | $ | 3,463 | ||||
| Trade accounts payable |
19,111 | 11,639 | ||||||
| Accrued income taxes payable (Note A9) |
203 | 335 | ||||||
| Accrued liabilities (Notes A12, F and H) |
13,068 | 12,898 | ||||||
| Total current liabilities |
32,948 | 28,335 | ||||||
| OTHER LIABILITIES |
||||||||
| Long-term debt (Note G) |
404 | 744 | ||||||
| Contingent purchase price (Notes P and Q) |
5,799 | — | ||||||
| Other liabilities (Notes A9 and I) |
14,101 | 13,288 | ||||||
| Total other liabilities |
20,304 | 14,032 | ||||||
| COMMITMENTS AND CONTINGENCIES (Note K) |
||||||||
| STOCKHOLDERS’ EQUITY (Note M) |
||||||||
| Preferred Stock-authorized 2,000,000 shares of $0.01 par value; none issued and outstanding |
— | — | ||||||
| Common Stock: |
||||||||
| Class A–authorized 90,000,000 shares of $0.01 par value; 29,761,756 shares |
298 | 295 | ||||||
| Class B, convertible–authorized 18,000,000 shares of $0.01 par value; |
80 | 80 | ||||||
| Additional paid-in capital |
69,064 | 66,082 | ||||||
| Treasury Stock |
(58,190 | ) | (58,190 | ) | ||||
| Retained earnings |
220,174 | 288,386 | ||||||
| Accumulated other comprehensive earnings/(loss) – |
||||||||
| Foreign currency translation (Note A10) |
3,543 | 5,672 | ||||||
| Net loss on hedge derivatives (Notes A12 and F) |
(150 | ) | (566 | ) | ||||
| Net gain on investments available for sale and restricted investments available |
94 | 24 | ||||||
| Total stockholders’ equity |
234,913 | 301,783 | ||||||
| $ | 288,165 | $ | 344,150 | |||||
The accompanying notes are an integral part of these statements.
46
Table of Contents
CONSOLIDATED STATEMENTS OF EARNINGS/LOSS
AND COMPREHENSIVE EARNINGS/LOSS
Year Ended December 31,
(Dollar amounts and shares in thousands, except per share amounts)
| 2010 | 2009 | 2008 | ||||||||||
| Revenues (Notes A13, N and O) |
$ | 216,987 | $ | 240,729 | $ | 327,405 | ||||||
| Cost of goods sold (Notes A14, A18 and F) |
131,908 | 154,558 | 195,385 | |||||||||
| Gross profit |
85,079 | 86,171 | 132,020 | |||||||||
| Selling, general and administrative expenses (Notes A10, A13, A15, |
142,474 | 118,303 | 139,899 | |||||||||
| Impairment on intangibles and goodwill (Notes A8 and E) |
— | 4,830 | — | |||||||||
| Operating loss (Note O) |
(57,395 | ) | (36,962 | ) | (7,879 | ) | ||||||
| Other (expense)/income, net (Notes A19, P and R) |
(3,320 | ) | (1,249 | ) | 30,000 | |||||||
| Interest income, net (Notes O, P and Q) |
435 | 1,050 | 8,216 | |||||||||
| (Loss)/Earnings before income taxes and discontinued operations |
(60,280 | ) | (37,161 | ) | 30,337 | |||||||
| Income tax expense/(benefit) (Notes A9, J and O) |
7,932 | (9,663 | ) | 5,882 | ||||||||
| (Loss)/Earnings from continuing operations |
(68,212 | ) | (27,498 | ) | 24,455 | |||||||
| Loss from discontinued operations, less applicable income tax benefit |
— | (464 | ) | (3,570 | ) | |||||||
| NET (LOSS)/EARNINGS |
$ | (68,212 | ) | $ | (27,962 | ) | $ | 20,885 | ||||
| (Loss)/Earnings per common share (Notes A17 and M) |
||||||||||||
| Basic: |
||||||||||||
| (Loss)/Earnings from continuing operations |
$ | (1.94 | ) | $ | (0.79 | ) | $ | 0.70 | ||||
| Loss from discontinued operations |
— | (0.01 | ) | (0.10 | ) | |||||||
| Net (Loss)/Earnings |
$ | (1.94 | ) | $ | (0.80 | ) | $ | 0.60 | ||||
| Diluted: |
||||||||||||
| (Loss)/Earnings from continuing operations |
$ | (1.94 | ) | $ | (0.79 | ) | $ | 0.69 | ||||
| Loss from discontinued operations |
— | (0.01 | ) | (0.10 | ) | |||||||
| Net (Loss)/Earnings |
$ | (1.94 | ) | $ | (0.80 | ) | $ | 0.59 | ||||
| Weighted average number of shares outstanding (Note A17) |
||||||||||||
| Basic |
35,218 | 34,962 | 34,785 | |||||||||
| Diluted |
35,218 | 34,962 | 35,407 | |||||||||
| Dividends declared per common share (Note M) |
$ | — | $ | — | $ | 2.20 | ||||||
| Net (Loss)/Earnings |
$ | (68,212 | ) | $ | (27,962 | ) | $ | 20,885 | ||||
| Other comprehensive (loss)/earnings, net of tax— |
||||||||||||
| Foreign currency translation adjustments, net of income taxes of |
(2,129 | ) | 4,274 | (11,968 | ) | |||||||
| Change in deferred gain/(loss) on hedge derivatives, net of income |
416 | (3,987 | ) | 4,640 | ||||||||
| Change in deferred gain on investments available for sale and |
70 | 24 | — | |||||||||
| Comprehensive (Loss)/Earnings |
$ | (69,855 | ) | $ | (27,651 | ) | $ | 13,557 | ||||
The accompanying notes are an integral part of these statements.
47
Table of Contents
CONSOLIDATED STATEMENT OF STOCKHOLDERS’ EQUITY
Three years ended December 31, 2010
(Dollar amounts in thousands)
| Common Stock | Addi- tional paid-in capital |
Treasury Stock | Retained earnings |
Accumulated other comprehensive earnings |
Total | |||||||||||||||||||||||||||||||||||
| Class A | Class B | Class A | ||||||||||||||||||||||||||||||||||||||
| Shares | Amount | Shares | Amount | Shares | Amount | |||||||||||||||||||||||||||||||||||
| BALANCE AT JANUARY 1, 2008 |
28,970,733 | $ | 290 | 8,059,524 | $ | 81 | $ | 55,657 | 2,272,161 | $ | (56,070 | ) | $ | 372,128 | $ | 12,147 | $ | 384,233 | ||||||||||||||||||||||
| Exercise of options (Note M) |
247,659 | 2 | — | — | 1,619 | — | — | — | — | 1,621 | ||||||||||||||||||||||||||||||
| Excess income tax benefit of options exercised (Note M) |
— | — | — | — | 823 | — | — | — | — | 823 | ||||||||||||||||||||||||||||||
| Stock-based compensation (Notes A18 and M) |
— | — | — | — | 3,313 | — | — | — | — | 3,313 | ||||||||||||||||||||||||||||||
| Purchase of Treasury Stock |
— | — | — | — | — | 149,456 | (2,120 | ) | — | — | (2,120 | ) | ||||||||||||||||||||||||||||
| Dividends paid (Note M) |
— | — | — | — | — | — | — | (76,665 | ) | — | (76,665 | ) | ||||||||||||||||||||||||||||
| Net earnings for the year |
— | — | — | — | — | — | — | 20,885 | — | 20,885 | ||||||||||||||||||||||||||||||
| Foreign currency translation (Note A10) |
— | — | — | — | — | — | — | — | (11,968 | ) | (11,968 | ) | ||||||||||||||||||||||||||||
| Net gain on hedge derivatives (Notes A12 and F) |
— | — | — | — | — | — | — | — | 4,640 | 4,640 | ||||||||||||||||||||||||||||||
| BALANCE AT DECEMBER 31, 2008 |
29,218,392 | 292 | 8,059,524 | 81 | 61,412 | 2,421,617 | (58,190 | ) | 316,348 | 4,819 | 324,762 | |||||||||||||||||||||||||||||
| Conversion of shares (Note M) |
20,000 | 1 | (20,000 | ) | (1 | ) | — | — | — | — | — | — | ||||||||||||||||||||||||||||
| Exercise of options (Note M) |
281,365 | 2 | — | — | 929 | — | — | — | — | 931 | ||||||||||||||||||||||||||||||
| Excess income tax benefit of options exercised (Note M) |
— | — | — | — | 550 | — | — | — | — | 550 | ||||||||||||||||||||||||||||||
| Stock-based compensation (Notes A18 and M) |
— | — | — | — | 3,191 | — | — | — | — | 3,191 | ||||||||||||||||||||||||||||||
| Net loss for the year |
— | — | — | — | — | — | — | (27,962 | ) | — | (27,962 | ) | ||||||||||||||||||||||||||||
| Foreign currency translation (Note A10) |
— | — | — | — | — | — | — | — | 4,274 | 4,274 | ||||||||||||||||||||||||||||||
| Net loss on hedge derivatives (Notes A12 and F) |
— | — | — | — | — | — | — | — | (3,987 | ) | (3,987 | ) | ||||||||||||||||||||||||||||
| Net gain on investments available for sale (Note C) |
— | — | — | — | — | — | — | — | 24 | 24 | ||||||||||||||||||||||||||||||
| BALANCE AT DECEMBER 31, 2009 |
29,519,757 | 295 | 8,039,524 | 80 | 66,082 | 2,421,617 | (58,190 | ) | 288,386 | 5,130 | 301,783 | |||||||||||||||||||||||||||||
| Exercise of options (Note M) |
241,999 | 3 | — | — | 1,244 | — | — | — | — | 1,247 | ||||||||||||||||||||||||||||||
| Stock-based compensation (Notes A18 and M) |
— | — | — | — | 1,738 | — | — | — | — | 1,738 | ||||||||||||||||||||||||||||||
| Net loss for the year |
— | — | — | — | — | — | — | (68,212 | ) | — | (68,212 | ) | ||||||||||||||||||||||||||||
| Foreign currency translation (Note A10) |
— | — | — | — | — | — | — | — | (2,129 | ) | (2,129 | ) | ||||||||||||||||||||||||||||
| Net gain on hedge derivatives (Notes A12 and F) |
— | — | — | — | — | — | — | — | 416 | 416 | ||||||||||||||||||||||||||||||
| Net gain on investments available for sale and restricted investments available for sale (Notes B and C) |
— | — | — | — | — | — | — | — | 70 | 70 | ||||||||||||||||||||||||||||||
| BALANCE AT DECEMBER 31, 2010 |
29,761,756 | $ | 298 | 8,039,524 | $ | 80 | $ | 69,064 | 2,421,617 | $ | (58,190 | ) | $ | 220,174 | $ | 3,487 | $ | 234,913 | ||||||||||||||||||||||
The accompanying notes are an integral part of this statement.
48
Table of Contents
CONSOLIDATED STATEMENTS OF CASH FLOWS
Year ended December 31,
(Dollar amounts in thousands)
| 2010 | 2009 | 2008 | ||||||||||
| Cash flows from operating activities: |
||||||||||||
| Net (loss)/earnings from continuing operations |
$ | (68,212 | ) | $ | (27,498 | ) | $ | 24,455 | ||||
| Adjustments to reconcile net (loss)/earnings from continuing operations |
||||||||||||
| Depreciation and amortization (Note O) |
3,659 | 4,159 | 3,534 | |||||||||
| Impairment on intangibles and goodwill (Note E) |
— | 4,830 | — | |||||||||
| Change in contingent purchase price/mandatorily redeemable |
3,689 | (3,759 | ) | (490 | ) | |||||||
| Net loss on disposal of property, plant and equipment |
7 | 789 | 74 | |||||||||
| Deferred income taxes |
8,469 | (212 | ) | (1,823 | ) | |||||||
| Stock-based compensation |
1,738 | 3,191 | 3,313 | |||||||||
| Excess income tax benefit of stock-based compensation |
— | (550 | ) | (823 | ) | |||||||
| Decrease/(Increase) in accounts receivable |
3,485 | 6,523 | (4,409 | ) | ||||||||
| (Increase)/Decrease in inventories |
(18,060 | ) | 21,579 | (5,560 | ) | |||||||
| Decrease/(Increase) in income taxes receivable |
13,052 | (13,821 | ) | — | ||||||||
| (Increase)/Decrease in prepaid expenses and other assets |
(2,493 | ) | 3,255 | 3,031 | ||||||||
| Increase/(Decrease) in accounts payable and accrued liabilities |
7,931 | (20,962 | ) | (3,792 | ) | |||||||
| Net cash (used in)/provided by operating activities from continuing operations |
(46,735 | ) | (22,476 | ) | 17,510 | |||||||
| Net cash provided by/(used in) discontinued operations |
— | 4,945 | (1,222 | ) | ||||||||
| Net cash (used in)/provided by operating activities |
(46,735 | ) | (17,531 | ) | 16,288 | |||||||
| Cash flows from investing activities: |
||||||||||||
| Change in restricted cash and cash equivalents |
14,435 | (22,270 | ) | — | ||||||||
| Purchase of investments available for sale and restricted investments |
(87,961 | ) | (31,115 | ) | — | |||||||
| Proceeds from the maturity or sale of available for sale securities |
37,073 | — | — | |||||||||
| Purchase of Form Athletics and Palladium (Notes P and Q) |
(1,600 | ) | — | (2,684 | ) | |||||||
| Purchase of intangible assets |
— | — | (6,015 | ) | ||||||||
| Purchase of property, plant and equipment (Note O) |
(2,377 | ) | (1,444 | ) | (5,050 | ) | ||||||
| Proceeds from disposal of property, plant and equipment |
29 | — | — | |||||||||
| Net cash used in investing activities |
(40,401 | ) | (54,829 | ) | (13,749 | ) | ||||||
| Cash flows from financing activities: |
||||||||||||
| Borrowings under bank lines of credit |
42,875 | 49,674 | 27,287 | |||||||||
| Repayments on bank lines of credit and long-term debt |
(46,111 | ) | (50,948 | ) | (27,245 | ) | ||||||
| Repurchase of stock |
— | — | (2,120 | ) | ||||||||
| Payment of dividends |
— | — | (76,665 | ) | ||||||||
| Excess income tax benefit of stock-based compensation |
— | 550 | 823 | |||||||||
| Proceeds from stock options exercised |
1,247 | 931 | 1,621 | |||||||||
| Net cash (used in)/provided by financing activities |
(1,989 | ) | 207 | (76,299 | ) | |||||||
| Effect of exchange rate changes on cash |
(1,374 | ) | 4,393 | (10,052 | ) | |||||||
| Net decrease in cash and cash equivalents |
(90,499 | ) | (67,760 | ) | (83,812 | ) | ||||||
| Cash and cash equivalents at beginning of year |
139,663 | 207,423 | 291,235 | |||||||||
| Cash and cash equivalents at end of year |
$ | 49,164 | $ | 139,663 | $ | 207,423 | ||||||
| Supplemental disclosure of cash flow information: |
||||||||||||
| Non-cash investing activities: |
||||||||||||
| On July 23, 2010 and July 1, 2008, the Company purchased the capital |
||||||||||||
| Fair value of assets acquired |
$ | 39 | $ | 10,775 | ||||||||
| Fair value of liabilities assumed |
(18 | ) | (17,815 | ) | ||||||||
| Contingent purchase price/Mandatorily redeemable minority interest |
(2,110 | ) | (4,249 | ) | ||||||||
| Excess fair value over purchase price |
3,689 | 13,973 | ||||||||||
| Cash paid on acquisitions |
$ | 1,600 | $ | 2,684 | ||||||||
| Cash paid during the year for: |
||||||||||||
| Interest |
$ | 131 | $ | 261 | $ | 265 | ||||||
| Income taxes |
$ | 1,093 | $ | 710 | $ | 2,128 | ||||||
The accompanying notes are an integral part of these statements.
49
Table of Contents
NOTES TO CONSOLIDATED FINANCIAL STATEMENTS
December 31, 2010, 2009 and 2008
NOTE A—SUMMARY OF SIGNIFICANT ACCOUNTING POLICIES
| 1. | Nature of Operations |
K•Swiss Inc. (the “Company”) designs, develops and markets footwear, apparel and accessories for athletic, high performance sports and fitness activities and casual wear under the K•Swiss brand. Since July 2008 and July 2010, the Company also designs, develops and markets footwear for adventurers for all terrains under the Palladium brand and apparel for mixed martial arts under the Form Athletics brand, respectively. The Company operates in an industry dominated by a small number of very large competitors. The size of these competitors enables them to lead the product direction of the industry, and therefore, potentially diminish the value of the Company’s products. In addition to generally greater resources, these competitors spend substantially more money on advertising and promotion than the Company and therefore dominate market share. The Company’s market share is estimated at less than one percent. Lastly, due to the recent global economic crisis, the retail environment has been particularly challenging during the few several years, which could negatively impact the Company’s operations.
The Company purchases significantly all of its products from a small number of contract manufacturers in Asia. This concentration of suppliers in this location subjects the Company to the risk of interruptions of product flow for various reasons which could lead to possible loss of sales, which would adversely affect operating results. In addition, there are other risks associated with doing business in Asia, especially China, where the Company’s intellectual property rights may not be protected.
In November 2001, the Company acquired the worldwide rights and business of Royal Elastics, an Australian-based designer and manufacturer of elasticated footwear. On April 30, 2009, the Company sold certain Royal Elastics assets, consisting of its inventory located in Taiwan and its intangible trademarks to Royal Elastics Holdings Ltd., a third party, in an arm’s length transaction. Operations of the Royal Elastics brand have been accounted for and presented as a discontinued operation in the accompanying financial information. See further discussion in Note R.
In July 2008, the Company purchased a 57% equity interest in Palladium SAS (“Palladium”) for a total purchase price of €5,350,000, or approximately $8,448,000 (including a loan of €3,650,000, or approximately $5,764,000). In June 2009, the Company purchased the remaining 43% equity interest in Palladium for €5,000,000 (or $7,034,000) plus a variable future price, i.e. the Contingent Purchase Price (“CPP”), the terms of which were amended in May 2010. In May 2010, the Company revised the terms of the remaining future purchase price to be equal to the net present value of €3,000,000 plus up to €500,000 based on an amount calculated in accordance with a formula driven by Palladium’s EBITDA for the twelve months ended December 31, 2012. The €500,000 CPP will be determined each quarter based on the current quarter’s projection of Palladium’s EBITDA for the twelve months ended December 31 of the current year. Excluding the initial recognition of the CPP, any change in CPP is based on the change in net present value of the €3,000,000 and the current quarter’s EBITDA projection, and will be recognized as interest income or interest expense during the current quarter. The fair value of the CPP at December 31, 2010 was $3,689,000 (or €2,777,000). See further discussion in Note P.
In July 2010, the Company entered into a Membership Interest Purchase Agreement with Form Athletics, LLC (“Form Athletics”) and its Members to purchase Form Athletics for $1,600,000 in cash
50
Table of Contents
K•SWISS INC.
NOTES TO CONSOLIDATED FINANCIAL STATEMENTS
December 31, 2010, 2009 and 2008
NOTE A—SUMMARY OF SIGNIFICANT ACCOUNTING POLICIES—(Continued)
| 1. | Nature of Operations—(Continued) |
and additional cash consideration to certain Members of Form Athletics in an amount equal to Form Athletics’ EBITDA for the twelve months ended December 31, 2012 (“Form CPP”). The fair value of the Form CPP will be determined each quarter based on the net present value of the current quarter’s projection of Form Athletics’ EBITDA for the twelve months ended December 31, 2012. Any subsequent changes to the Form CPP will be recognized as interest income or interest expense during the applicable quarter. The fair value of the Form CPP at December 31, 2010 was $2,110,000. The acquisition of Form Athletics was recorded as a 100% purchase acquisition and the Form CPP liability was recognized and accordingly, the results of operations of the acquired business are included in the Consolidated Financial Statements from the date of acquisition. See further discussion in Note Q.
| 2. | Estimates in Financial Statements |
In preparing financial statements in conformity with generally accepted accounting principles, management is required to make estimates and assumptions that affect the reported amounts of assets and liabilities, the disclosure of contingent assets and liabilities at the date of the financial statements, and revenues and expenses during the reporting period. Actual results could differ from those estimates.
| 3. | Basis of Consolidation |
The consolidated financial statements include the accounts of the Company and its wholly-owned subsidiaries. All significant intercompany transactions and balances have been eliminated. Certain reclassifications have been made in the 2009 and 2008 presentation to conform to the 2010 presentation. These reclassifications had no impact on previously reported results of operations or stockholders’ equity and do not affect previously reported cash flows from operations, investing and financing activities or net change in cash and cash equivalents.
| 4. | Cash Equivalents |
For purposes of the statements of cash flows, the Company considers all highly liquid debt instruments purchased with an original maturity of three months or less to be cash equivalents. Included in cash and cash equivalents as of December 31, 2010 and 2009 is $26,503,000 and $36,369,000, respectively, of balances maintained in foreign bank accounts.
| 5. | Inventories |
Inventories, consisting of merchandise held for resale as finished goods, are stated at the lower of cost or market. Cost is determined using a moving average cost method. Management continually evaluates its inventory position and implements promotional or other plans to reduce inventories to appropriate levels relative to its sales estimates for particular product styles or lines. Estimated losses are recorded when such plans are implemented. It is at least reasonably possible that management’s plans to reduce inventory levels will be less than fully successful, and that such an outcome would result in a change in the inventory reserve in the near-term.
51
Table of Contents
K•SWISS INC.
NOTES TO CONSOLIDATED FINANCIAL STATEMENTS
December 31, 2010, 2009 and 2008
NOTE A—SUMMARY OF SIGNIFICANT ACCOUNTING POLICIES—(Continued)
| 6. | Property, Plant and Equipment |
Property, plant and equipment are carried at cost. For financial reporting and tax purposes, depreciation and amortization are calculated using straight-line and accelerated methods, respectively, over the estimated service lives of the depreciable assets. The service lives of the Company’s building and related improvements are 30 and 5 years, respectively. Information systems and equipment is depreciated from 3 to 10 years and leasehold improvements are amortized over the lives of the respective leases.
| 7. | Impairment of Long-Lived Assets |
When events or circumstances indicate the carrying value of a long-lived asset may be impaired, the Company estimates the future undiscounted cash flows to be derived from the asset to assess whether or not a potential impairment exists. If the carrying value exceeds the Company’s estimate of future undiscounted cash flows, the Company then calculates the impairment as the excess of the carrying value of the asset over the Company’s estimate of its fair market value.
| 8. | Goodwill and Intangible Assets |
Indefinite-lived intangible assets are evaluated for impairment at least annually, and more often when events indicate that an impairment exists. Intangible assets with finite lives are amortized over their useful lives.
Events or changes in circumstances that may trigger impairment reviews include among other factors, significant changes in business climate, operating results, planned investments, or an expectation that the carrying amount may not be recoverable. The test for impairment involves the use of estimates relating to the fair values of business operations with which the goodwill is associated and the fair values of intangible assets with indefinite lives.
The Company reviews goodwill for impairment in a two-step process. The first step is to determine whether there is potential impairment by comparing the estimated fair value of a reporting unit to its carrying value (which includes goodwill). If the fair value exceeds the carrying value, then goodwill is not considered impaired, however, if the carrying amount exceeds the fair value, then step two is performed to measure the amount of impairment loss, if any. The second step compares the implied fair value of the reporting unit goodwill with the carrying amount of that goodwill. The implied fair value of goodwill is determined by allocating fair value to all assets and liabilities. The excess, if any, is the implied fair value of goodwill. If the implied fair value of goodwill is less than the carrying amount of goodwill, then impairment is recognized.
The Company reviews intangible assets related to trademarks for impairment, by determining fair value using a “relief from royalty payments” methodology. This approach involves two steps: (i) estimating reasonable royalty rates for each trademark and (ii) applying these royalty rates to a net sales stream and discounting the resulting cash flows to determine fair value. If the fair value is less than the carrying value then impairment is recognized.
52
Table of Contents
K•SWISS INC.
NOTES TO CONSOLIDATED FINANCIAL STATEMENTS
December 31, 2010, 2009 and 2008
NOTE A—SUMMARY OF SIGNIFICANT ACCOUNTING POLICIES—(Continued)
| 8. | Goodwill and Intangible Assets—(Continued) |
Determining the fair value of goodwill and other intangible assets is highly subjective and requires the use of estimates and assumptions. The Company uses estimates including estimated future revenues, royalty rates and discount rates, among other factors. The Company also considers the following factors:
| • | the asset’s ability to continue to generate income from operations and positive cash flow in future periods; |
| • | changes in consumer demand or acceptance of the Company’s brands and products; and |
| • | other considerations that could affect fair value or otherwise indicate potential impairment. |
In addition, facts and circumstances could change, including further deterioration of general economic conditions, customers reducing orders in response to such conditions and increased competition. These and/or other factors could result in changes to the calculation of the fair value which could result in future impairment of the Company’s remaining goodwill and other intangible assets. Changes in any one or more of these estimates and assumptions could produce different financial results.
| 9. | Income Taxes |
The Company accounts for income taxes under an asset and liability approach that requires the recognition of deferred tax assets and liabilities for the expected future tax consequences of events that have been recognized in the Company’s financial statements or tax returns.
The Company has not recorded United States income tax expense on earnings of selected foreign subsidiary companies as these are intended to be permanently invested, thus reducing the Company’s overall income tax expense. The amount of earnings designated as permanently invested is based upon the Company’s expectations of the future cash needs of its subsidiaries. Income tax considerations are also a factor in determining the amount of earnings to be permanently invested. Because the declaration involves the Company’s future plans and expectations of future events, the possibility exists that amounts declared as permanently invested may ultimately be repatriated. This would result in additional income tax expense in the year the Company determines that amounts were no longer permanently invested.
On a quarterly basis, the Company estimates what its effective tax rate will be for the full calendar year by estimating pre-tax income, excluding significant or infrequently occurring items, and tax expense for the remaining quarterly periods of the year. The estimated annual effective tax rate is then applied to year-to-date pre-tax income to determine the estimated year-to-date and quarterly tax expense. The income tax effects of infrequent or unusual items are recognized in the quarterly period in which they occur. As the year progresses, the Company continually refines its estimate based upon actual events and earnings. This continual estimation process periodically results in a change to the Company’s expected annual effective tax rate. When this occurs, the Company adjusts the income tax provision during the quarter in which the change in estimate occurs so that the year-to-date income tax provision equals the estimated annual rate.
53
Table of Contents
K•SWISS INC.
NOTES TO CONSOLIDATED FINANCIAL STATEMENTS
December 31, 2010, 2009 and 2008
NOTE A—SUMMARY OF SIGNIFICANT ACCOUNTING POLICIES—(Continued)
| 9. | Income Taxes—(Continued) |
The Company evaluates the future realization of its deferred tax assets quarterly. The Company reviews each material tax jurisdiction for which a deferred tax asset has been recorded. The Company’s analysis includes a review of past results, future income, the tax life of net operating loss carryforwards and tax credits. The Company assesses whether a valuation allowance should be established based on the consideration of all available evidence using a “more-likely-than-not” standard. In making such judgments, significant weight is given to evidence that can be objectively verified. All evidence is evaluated in forming a conclusion whether a valuation allowance, if any, needs to be recorded. A cumulative loss in recent years is significant negative evidence in considering whether deferred tax assets are realizable.
The accounting for the uncertainty in income tax positions prescribes a minimum recognition threshold a tax position must meet before recognition in the financial statements. The evaluation of a tax position is a two-step process. The first step is a recognition process to determine whether it is more-likely-than-not that a tax position will be sustained upon examination, including resolution of any related appeals or litigation processes, based on the technical merits of the position. In evaluating whether a tax position has met the more-likely-than-not recognition threshold, it is presumed that the position will be examined by the appropriate taxing authority that has full knowledge of all relevant information. The second step is a measurement process whereby a tax position that meets the more-likely-than-not recognition threshold is calculated to determine the amount of benefit/expense to recognize in the financial statements. The tax position is measured at the largest amount of benefit/expense that is greater than 50% likely of being realized upon ultimate settlement.
Any tax position recognized would be an adjustment to the effective tax rate. The Company recognizes interest expense and penalties on income tax liabilities in income tax expense on its Consolidated Statement of Earnings/Loss. The Company recognizes its uncertain tax positions in either accrued income taxes, if determined to be short-term, or other liabilities if determined to be long-term, on its Consolidated Balance Sheet. For federal tax purposes, the Company’s 2007 through 2009 tax years remain open for examination by the tax authorities under the normal three year statute of limitations, however, the 2006 tax year remains open for examination for limited issues. Generally, for state tax purposes, the Company’s 2006 through 2009 tax years remain open for examination by the tax authorities under a four year statute of limitations.
| 10. | Foreign Currency Translation |
Assets and liabilities of certain foreign operations are translated into U.S. dollars at current exchange rates. Income and expenses are translated into U.S. dollars at average rates of exchange prevailing during the period. Adjustments resulting from translating foreign functional currency financial statements into U.S. dollars are taken directly to a separate component of stockholders’ equity. Foreign currency transaction gains and losses are generated by the effect of foreign exchange on recorded assets and liabilities denominated in a currency different from the functional currency of the applicable foreign operations and are included in selling, general and administrative expenses.
54
Table of Contents
K•SWISS INC.
NOTES TO CONSOLIDATED FINANCIAL STATEMENTS
December 31, 2010, 2009 and 2008
NOTE A—SUMMARY OF SIGNIFICANT ACCOUNTING POLICIES—(Continued)
| 11. | Fair Value of Financial Instruments |
For certain of the Company’s financial instruments, including cash and cash equivalents, accounts receivable, outstanding borrowings under the bank lines of credit and current portion of long-term debt, accounts payable and other accrued liabilities, the carrying amounts approximate fair value due to their short maturities. In addition, the Company has long-term debt with financial institutions. The fair value of long-term debt is measured by obtaining the current interest rate from the financial institutions and then comparing that to the actual interest rate owed on the debt. At December 31, 2010, the fair value of the long-term debt is estimated at $398,000.
During 2010, the Company adopted the Financial Accounting Standards Board (“FASB”) Accounting Standards Update (“ASU”) 2010-06, “Improving Disclosures about Fair Value Measurements,” which enhances the usefulness of fair value measurements. ASU 2010-06 requires both the disaggregation of information in certain existing disclosures, as well as the inclusion of more robust disclosures about valuation techniques and inputs to recurring and nonrecurring fair value measurements. It amends the disclosures about fair value measurements in FASB Accounting Standards Codification (“ASC”) 820, “Fair Value Measurements and Disclosures.” ASC No. 820 defines fair value, establishes a framework for measuring fair value, and expands disclosures about fair value measurements which increase the consistency and the comparability of fair value measurements in financial statement disclosures. ASC No. 820 applies in situations where other accounting pronouncements require or permit fair value measurements.
ASC No. 820 establishes a valuation hierarchy for disclosure of the inputs to valuation used to measure fair value. This hierarchy prioritizes the inputs into three broad levels. Level 1 inputs are quoted prices (unadjusted) in active markets for identical assets or liabilities. Level 2 inputs are quoted prices for similar assets and liabilities in active markets or inputs that are observable for the asset or liability, either directly or indirectly through market corroboration, for substantially the full term of the financial instrument. Level 3 inputs are unobservable inputs based on the Company’s own assumptions used to measure assets and liabilities at fair value. A financial asset or liability’s classification within the hierarchy is determined based on the lowest level input that is significant to the fair value measurement.
The following table provides the assets and liabilities carried at fair value measured on a recurring basis at December 31, 2010 (in thousands):
| Fair Value Measurements Using | ||||||||||||||||
| Total Carrying Value |
Quoted Prices in Active Markets (Level 1) |
Significant Other Observable Inputs (Level 2) |
Significant Unobservable Inputs (Level 3) |
|||||||||||||
| Restricted investments available for sale |
$ | 22,918 | $ | 22,918 | $ | — | $ | — | ||||||||
| Investments available for sale |
66,277 | 15,090 | 51,187 | — | ||||||||||||
| Forward exchange contracts—assets |
244 | — | 244 | — | ||||||||||||
| Forward exchange contracts—liabilities |
671 | — | 671 | — | ||||||||||||
| Contingent purchase price—Palladium (1) |
3,689 | — | — | 3,689 | ||||||||||||
| Contingent purchase price—Form Athletics (2) |
2,110 | — | — | 2,110 | ||||||||||||
| (1) | See Note P for further discussion on valuation. |
| (2) | See Note Q for further discussion on valuation. |
55
Table of Contents
K•SWISS INC.
NOTES TO CONSOLIDATED FINANCIAL STATEMENTS
December 31, 2010, 2009 and 2008
NOTE A—SUMMARY OF SIGNIFICANT ACCOUNTING POLICIES—(Continued)
| 11. | Fair Value of Financial Instruments—(Continued) |
The Company purchases its investments available for sale and restricted investments available for sale through several major financial institutions. These financial institutions have hired a third party to measure the fair value of these investments.
U.S. Treasury securities are measured at fair value by obtaining information from a number of live data sources including active market makers and inter-dealer brokers. These data sources are reviewed based on their historical accuracy for individual issues and maturity ranges.
U.S. Government Corporate and Agency securities and Corporate Notes and Bonds are measured at fair value by obtaining (a) a bullet (non-call) spread scale that is created for each issuer going out to forty years (these spreads represent credit risk and are obtained from the new issue market, secondary trading and dealer quotes), (b) an option adjusted spread model which is incorporated to adjust spreads of issues that have early redemption features and (c) final spreads are added to the U.S. Treasury curve and a special cash discounting yield/price routine calculates prices from final yields to accommodate odd coupon payment dates. Evaluators maintain quality by surveying the dealer community, obtaining benchmark quotes, incorporating relevant trade data and updating spreads daily.
The Company’s counterparty (“Counterparty”) to a majority of its forward exchange contracts is a major financial institution. These forward exchange contracts are measured at fair value by the Counterparty based on a variety of pricing factors, which include the market price of the derivative instrument available in the dealer-market.
During the year ended December 31, 2010, there were no transfers between Level 1, Level 2 and Level 3 measurements. In addition, there were no changes in the valuation technique of assets and liabilities measured on a recurring basis during the year ended December 31, 2010.
| 12. | Financial Risk Management and Derivatives |
Sales denominated in currencies other than the U.S. dollar, which are primarily sales to customers in Europe, expose the Company to market risk from material movements in foreign exchange rates between the U.S. dollar and the foreign currency. The Company’s primary risk exposures are from changes in the rates between the U.S. dollar and the Euro, U.S. dollar and the Pound Sterling and between the Euro and the Pound Sterling. In 2010 and 2009, the Company entered into forward foreign exchange contracts to exchange Euros for U.S. dollars and Pound Sterling for Euros, and also in 2009, Pound Sterling for U.S. dollars. The extent to which forward foreign exchange contracts are used is modified periodically in response to management’s estimate of market conditions and the terms and length of specific sales contracts.
The Company enters into forward foreign exchange contracts in order to reduce the impact of foreign currency fluctuations and not to engage in currency speculation. The use of derivative financial instruments allows the Company to reduce its exposure to the risk that the eventual net cash inflow resulting from the sale of products to foreign customers will be materially affected by changes in exchange rates. The Company does not hold or issue financial instruments for trading purposes. The forward foreign exchange contracts are designated for firmly committed or forecasted sales. These contracts settle in less than one year.
56
Table of Contents
K•SWISS INC.
NOTES TO CONSOLIDATED FINANCIAL STATEMENTS
December 31, 2010, 2009 and 2008
NOTE A—SUMMARY OF SIGNIFICANT ACCOUNTING POLICIES—(Continued)
| 12. | Financial Risk Management and Derivatives—(Continued) |
The forward foreign exchange contracts generally require the Company to exchange Euros for U.S. dollars, Pound Sterling for U.S. dollars or Pound Sterling for Euros at maturity, at rates agreed upon at the inception of the contracts. The Company’s counterparties to derivative transactions are major financial institutions with an investment grade or better credit rating; however, the Company is exposed to credit risk with these institutions. The credit risk is limited to the unrealized gains in such contracts should these counterparties fail to perform as contracted.
Cash flows from these forward foreign exchange contracts are classified in the same category as the cash flows from the items being hedged on the Consolidated Statements of Cash Flows.
| 13. | Recognition of Revenues and Accounts Receivable |
Sales are recognized when title passes and the risks and rewards of ownership have passed to the customer, based on the terms of sale. Title passes generally upon shipment. In some instances, product is shipped directly from the Company’s supplier to the customer. In these cases, the Company recognizes revenue when the product is delivered to the customer according to the terms of the order. Revenues may fluctuate in cases when customers delay accepting shipment of product for periods up to several weeks. Provisions for estimated sales returns and allowances are made at the time of sale based on historical rates of returns and allowances and specific identification of outstanding returns not yet received from customers. However, actual returns and allowances in any future period are inherently uncertain and thus may differ from these estimates. If actual or expected future returns and allowances were significantly greater or lower than established reserves, a reduction or increase to net revenues would be recorded in the period this determination was made. The Company does not offer any product warranties.
The Company maintains allowances for doubtful accounts for estimated losses resulting from the inability of its customers to make required payments. The Company estimates potential losses based on its knowledge of the financial condition of certain customers and historical level of credit losses, as well as an assessment of the overall retail conditions. Historically, losses have been within the Company’s expectations. If the financial condition of the Company’s customers were to change, adjustments may be required to these estimates. Furthermore, estimated losses are provided resulting from differences that arise from the gross carrying value of the Company’s receivables and the amounts which customers estimate are owed to the Company. The settlement or resolution of these differences could result in future changes to these estimates.
Licensing and other fees earned on sales by foreign licensees and distributors are included in revenues and recognized under the accrual basis of accounting and totaled $8,092,000, $6,507,000 and $7,635,000 during the years ended December 31, 2010, 2009 and 2008, respectively.
Shipping and handling costs billed to customers are included in sales and the related costs are included in selling, general and administrative expenses in the Consolidated Statements of Earnings/Loss. Shipping and handling costs included in selling, general and administrative expenses totaled $3,260,000, $3,093,000 and $3,460,000 for the years ended December 31, 2010, 2009 and 2008, respectively.
57
Table of Contents
K•SWISS INC.
NOTES TO CONSOLIDATED FINANCIAL STATEMENTS
December 31, 2010, 2009 and 2008
NOTE A—SUMMARY OF SIGNIFICANT ACCOUNTING POLICIES—(Continued)
| 14. | Cost of Goods Sold |
Cost of goods sold includes the landed cost of inventory (which includes procurement costs of the Company’s Asian purchasing office and factory inspections, inbound freight charges, broker and consolidation charges and duties), production mold expenses and inventory and royalty reserves. Cost of goods sold may not be comparable to those of other entities as a result of recognizing warehousing costs within selling, general and administrative expenses. These warehousing costs were $13,610,000, $13,489,000 and $16,537,000 for the years ending December 31, 2010, 2009 and 2008, respectively.
Included in cost of goods sold for the year ended December 31, 2008 is an additional accrual for an underpayment of certain business taxes in a foreign jurisdiction. Prior to the third quarter of 2008, the Company had accrued approximately $638,000 related to this issue. On August 5, 2009, the Company settled the underpayment of such business taxes for approximately $1,529,000 plus interest of approximately $1,185,000, with no penalties assessed.
| 15. | Selling, General and Administrative Expenses |
Selling, general and administrative expenses include salaries and benefits, advertising, commissions, travel expenses, bad debt expense, shipping and handling costs, data processing expenses, legal fees, professional fees, rent and other office expenses, product development activity expenses, depreciation and amortization, bank fees, utilities, repairs and maintenance expenses, gains/losses on foreign currency transactions/revaluations, gains/losses on ineffective hedges and other warehousing costs.
| 16. | Advertising Costs |
Advertising costs are generally expensed as incurred and are included in selling, general and administrative expenses. Advertising costs also include athlete endorsement fees, which are amortized over the contractual terms of the agreements. Advertising expenses amounted to $43,955,000, $19,148,000 and $33,107,000 for the years ended December 31, 2010, 2009 and 2008, respectively. The Company engages in cooperative advertising programs with its customers. The Company recognizes this expense, based on the expected usage of the programs, in advertising expense.
| 17. | Loss/Earnings per Share |
Basic earnings per share excludes dilution and is computed by dividing net (loss)/earnings available to common stockholders by the weighted average number of common shares outstanding for the period. Diluted earnings per share reflect the potential dilution that could occur if options to issue common stock were exercised.
The following is a reconciliation of the number of shares (denominator) used in the basic and diluted (loss)/earnings per share (“EPS”) computations (shares in thousands):
| 2010 | 2009 | 2008 | ||||||||||||||||||||||
| Shares | Per Share Amount |
Shares | Per Share Amount |
Shares | Per Share Amount |
|||||||||||||||||||
| Basic EPS |
35,218 | $ | (1.94 | ) | 34,962 | $ | (0.80 | ) | 34,785 | $ | 0.60 | |||||||||||||
| Effect of dilutive stock options |
— | — | — | — | 622 | (0.01 | ) | |||||||||||||||||
| Diluted EPS |
35,218 | $ | (1.94 | ) | 34,962 | $ | (0.80 | ) | 35,407 | $ | 0.59 | |||||||||||||
58
Table of Contents
K•SWISS INC.
NOTES TO CONSOLIDATED FINANCIAL STATEMENTS
December 31, 2010, 2009 and 2008
NOTE A—SUMMARY OF SIGNIFICANT ACCOUNTING POLICIES—(Continued)
| 17. | Loss/Earnings per Share—(Continued) |
Because the Company had a net loss for the years ended December 31, 2010 and 2009, the number of diluted shares is equal to the number of basic shares at December 31, 2010 and 2009, respectively. Outstanding stock options would have had an anti-dilutive effect on diluted EPS for the years ended December 31, 2010 and 2009. Outstanding stock options with exercise prices greater than the average market price of a share of the Company’s common stock also have an anti-dilutive effect on diluted EPS. The following options were not included in the computation of diluted EPS because of their anti-dilutive effect:
| 2010 | 2009 | 2008 | ||||
| Options to purchase shares of common stock (in thousands) |
1,154 | 1,127 | 222 | |||
| Exercise prices |
$11.64—$34.75 December 2012— |
$9.52—$34.75 May 2012— |
$15.62—$34.75 July 2013— | |||
| Expiration dates |
December 2020 | August 2019 | August 2018 |
| 18. | Stock-Based Compensation |
The Company measures the cost of employee services received in exchange for an award of equity instruments based on the grant-date fair value of the award. That cost is recognized over the period during which an employee is required to provide service in exchange for the award—the requisite service period. No compensation cost is recognized for equity instruments for which employees do not render the requisite service. The Company determines the grant-date fair value of employee stock options using the Black-Scholes option-pricing model adjusted for the unique characteristics of these options.
| 19. | Other Expense/Income |
Other expense for the year ended December 31, 2010 consists of the recognition of $3,320,000, which represents the net present value of the estimated CPP for Palladium, see Note P for further discussion.
Other expense for the year ended December 31, 2009 includes a loss upon purchase of the remaining 43% of Palladium of $2,616,000, see Note P for further discussion, offset by a gain on sale of certain assets of the Royal Elastics brand of $1,367,000, see Note R for further discussion.
Other income for the year ended December 31, 2008, consists of the recognition of a $30,000,000 payment as a result of a settlement agreement with Payless ShoeSource, Inc., a Missouri corporation and Payless ShoeSource Inc., a Delaware corporation (collectively, “Payless”) in connection with the Company’s 2004 action filed against Payless in the United States District Court for the Central District of California (Western District), in which the Company alleged trademark and trade dress infringement, trademark dilution, unfair competition and breach of contract. The settlement agreement provided, among other things, that Payless would pay the Company $30,000,000 in compensatory damages claimed by the Company from Payless’ advertising, promotion and sale of certain footwear.
59
Table of Contents
K•SWISS INC.
NOTES TO CONSOLIDATED FINANCIAL STATEMENTS
December 31, 2010, 2009 and 2008
NOTE B—RESTRICTED CASH AND CASH EQUIVALENTS AND RESTRICTED INVESTMENTS
AVAILABLE FOR SALE
The Company collateralizes its lines of credit (non-Palladium) with the following at December 31 (in thousands):
| 2010 | 2009 | |||||||
| Restricted cash and cash equivalents |
$ | 7,835 | $ | 22,270 | ||||
| Restricted investments available for sale: |
||||||||
| U.S. Treasury Notes |
15,055 | — | ||||||
| Accrued interest income on U.S. Treasury Notes |
28 | — | ||||||
| Total restricted investments available for sale |
15,083 | — | ||||||
| $ | 22,918 | $ | 22,270 | |||||
The restricted investments are classified as available for sale and are stated at fair value. At December 31, 2010, gross unrealized holding gains were $51,000. The change in net unrealized holding gains that are included in comprehensive income was $34,000 for the year ended December 31, 2010. The Company capitalizes any premiums paid or discounts received and amortizes the premiums or accretes the discounts on a straight-line basis over the remaining term of the security.
Investments by contractual maturities as of December 31, 2010 are as follows (in thousands):
| Within one year |
$ | 17,874 | ||
| After one year through five years |
5,044 | |||
| After five years through ten years |
— | |||
| After ten years |
— | |||
| $ | 22,918 | |||
NOTE C—INVESTMENTS AVAILABLE FOR SALE
The Company’s investments are classified as available for sale and are stated at fair value. The Company’s investments available for sale at December 31 are as follows (in thousands):
| 2010 | 2009 | |||||||
| U.S. Treasury Notes |
$ | 15,068 | $ | 15,048 | ||||
| U.S. Government Corporations and Agencies |
3,502 | 16,088 | ||||||
| Corporate Notes and Bonds |
47,005 | — | ||||||
| Accrued interest income |
702 | 73 | ||||||
| $ | 66,277 | $ | 31,209 | |||||
At December 31, 2010 and 2009, gross unrealized holding gains were $151,000 and $48,000, respectively, and gross unrealized holding losses were $60,000 and $12,000, respectively. The change in net unrealized holding gains that are included in comprehensive income is $36,000 and $24,000 for the years ended December 31, 2010 and 2009, respectively. The Company capitalizes any premiums paid or discounts received and amortizes the premiums or accretes the discounts on a straight-line basis over the remaining term of the security.
60
Table of Contents
K•SWISS INC.
NOTES TO CONSOLIDATED FINANCIAL STATEMENTS
December 31, 2010, 2009 and 2008
NOTE C—INVESTMENTS AVAILABLE FOR SALE—(Continued)
During the year ended December 31, 2010, the Company received proceeds from the sale of investments available for sale of $6,002,000 and the related gain on sale was not significant. There were no sales of investments available for sale during the year ended December 31, 2009. Realized gain and losses are recognized using the actual cost of the instrument.
Investments by contractual maturities as of December 31, 2010 are as follows (in thousands):
| Within one year |
$ | 41,943 | ||
| After one year through five years |
24,334 | |||
| After five years through ten years |
— | |||
| After ten years |
— | |||
| $ | 66,277 | |||
NOTE D—PROPERTY, PLANT AND EQUIPMENT
Property, plant and equipment as of December 31 consist of the following (in thousands):
| 2010 | 2009 | |||||||
| Building and improvements |
$ | 11,313 | $ | 11,246 | ||||
| Information systems |
22,727 | 22,273 | ||||||
| Furniture, machinery and equipment |
8,233 | 8,117 | ||||||
| 42,273 | 41,636 | |||||||
| Less accumulated depreciation and amortization |
(22,273 | ) | (20,278 | ) | ||||
| 20,000 | 21,358 | |||||||
| Land |
695 | 695 | ||||||
| $ | 20,695 | $ | 22,053 | |||||
NOTE E—INTANGIBLE ASSETS
Intangible assets as of December 31 consist of the following (in thousands):
| 2010 | 2009 | |||||||
| Goodwill |
$ | 5,150 | $ | 4,608 | ||||
| Trademarks |
15,742 | 13,331 | ||||||
| Less accumulated amortization |
(2,680 | ) | (2,680 | ) | ||||
| $ | 18,212 | $ | 15,259 | |||||
61
Table of Contents
K•SWISS INC.
NOTES TO CONSOLIDATED FINANCIAL STATEMENTS
December 31, 2010, 2009 and 2008
NOTE E—INTANGIBLE ASSETS—(Continued)
The change in the carrying amount of goodwill and intangible assets during year ended December 31, 2010 and 2009 is as follows (in thousands):
| 2010 | 2009 | |||||||
| Beginning Balance |
$ | 15,259 | $ | 22,776 | ||||
| Trademarks acquired (Note Q) |
3,150 | — | ||||||
| Goodwill acquired (Note Q) |
539 | — | ||||||
| Purchase accounting adjustments to goodwill (Note P) |
— | (3,077 | ) | |||||
| Impairment losses—goodwill |
— | (2,177 | ) | |||||
| Impairment losses—trademarks |
— | (2,653 | ) | |||||
| Foreign currency translation effects |
(736 | ) | 390 | |||||
| Ending Balance |
$ | 18,212 | $ | 15,259 | ||||
The Company has performed the annual reassessment and impairment test as of October 1, 2010 of its Palladium intangible assets related to trademarks and determined there was no impairment of its intangible assets. The Company performed the annual reassessment and impairment tests required as of October 1, 2009 of its Palladium goodwill and intangible assets and determined that goodwill related to Palladium was impaired by $2,177,000 (this represented a 100% impairment of this asset) and Palladium’s intangible assets related to trademarks were impaired by $2,653,000.
Impairment losses are included in the Corporate Expenses category for segment reporting purposes. See further discussion in Note O.
During the year ended December 31, 2010, the Company acquired trademarks of $3,150,000 and goodwill of $539,000 as a result of the acquisition of Form Athletics, see discussion in Note Q.
Other than goodwill, the Company’s other significant intangible assets are its trademarks. The Company’s trademark registrations are renewable every 10 years for minimal cost. The Company continually renews its trademark registrations and evidence supports it has the ability to continue to do so. The Company believes that its trademarks have an indefinite useful life because it intends to renew its trademarks indefinitely.
62
Table of Contents
K•SWISS INC.
NOTES TO CONSOLIDATED FINANCIAL STATEMENTS
December 31, 2010, 2009 and 2008
NOTE F—FINANCIAL RISK MANAGEMENT AND DERIVATIVES
At December 31, 2010, forward foreign exchange contracts with a notional value of $21,990,000 were outstanding to exchange various currencies with maturities ranging from January 2011 to September 2011, to sell the equivalent of approximately $5,290,000 in foreign currencies at contracted rates and to buy approximately $16,700,000 in foreign currencies at contracted rates. These contracts have been designated as cash flow hedges. At December 31, 2010 and 2009, the Company did not have any forward foreign exchange contracts that do not qualify as hedges.
The fair value of the Company’s derivatives as of December 31 is as follows (in thousands):
| Asset Derivatives |
Liability Derivatives | |||||||||||||||||||||
| Balance Sheet |
2010 | 2009 | Balance Sheet Location |
2010 | 2009 | |||||||||||||||||
| Fair Value |
Fair Value |
Fair Value |
Fair Value |
|||||||||||||||||||
| Derivatives Designated as Hedging Instruments |
||||||||||||||||||||||
| Foreign exchange contracts |
Prepaid expenses and other current assets | $ | 244 | $ | 184 | |
Accrued liabilities |
|
$ | 671 | $ | 351 | ||||||||||
The effect of the Company’s derivatives on its Consolidated Statements of Earnings/Loss for years ended December 31, 2010, 2009 and 2008 are as follows (in thousands):
| Derivatives in Cash |
Amount of Gain/(Loss) Recognized in Other Comprehensive Earnings (“OCE”) on Derivative (Effective Portion) |
Location of Gain/(Loss) Reclassified from OCE into Income (Effective Portion) |
Amount of Gain/(Loss) Reclassified from OCE into Income (Effective Portion) |
Location of Gain/(Loss) Recognized in Income on Derivative (Ineffective Portion and Amount Excluded from Effectiveness Testing) |
Amount of Gain/ (Loss) Recognized in Income on Derivative (Ineffective Portion and Amount Excluded from Effectiveness Testing) |
|||||||||||||||||||||||||||||||||||
| 2010 | 2009 | 2008 | 2010 | 2009 | 2008 | 2010 | 2009 | 2008 | ||||||||||||||||||||||||||||||||
| Foreign exchange contracts |
$ | 416 | $ | (3,987 | ) | $ | 4,640 | Cost of goods sold |
$ | (326 | ) | $ | 1,810 | $ | (1,708 | ) | Selling, general and administrative expenses |
$ | 81 | $ | 258 | $ | 1,036 | |||||||||||||||||
| Derivatives Not Designated as Hedging Instruments |
Location of Gain/(Loss) Recognized in Income on Derivative |
Amount of Gain/(Loss) Recognized in Income on Derivative |
||||||||||||
| 2010 | 2009 | 2008 | ||||||||||||
| Foreign exchange contracts |
Selling, general and administrative expenses | $ | — | $ | (6 | ) | $ | 568 | ||||||
63
Table of Contents
K•SWISS INC.
NOTES TO CONSOLIDATED FINANCIAL STATEMENTS
December 31, 2010, 2009 and 2008
NOTE G—BANK LINES OF CREDIT AND OTHER DEBT
At December 31, 2010 and 2009, the Company had debt outstanding of $970,000 and $4,207,000 (in each case attributable to outstanding borrowings by Palladium under its lines of credit facilities and term loans), respectively, (excluding outstanding letters of credit of $2,362,000 and $700,000 at December 31, 2010 and 2009, respectively).
The terms of and current borrowings under the Company’s lines of credit with Bank of America, N.A. (the “Bank”) (not including borrowings by Palladium) as of December 31, 2010 are as follows (dollars in thousands):
| Amount Outstanding |
Outstanding Letters of Credit |
Unused Lines of Credit |
Total | Interest Rate |
Expiration Date | |||||||||||
| $ — | $ | 2,362 | $ | 18,638 | $ | 21,000 | Prime - 0.75%, or 2.50% | July 1, 2013 | ||||||||
Pursuant to the Loan Agreement between the Company and the Bank (“Loan Agreement”), dated as of June 30, 2010, the Bank has agreed to provide the Company with a revolving line of credit in an aggregate principal amount not to exceed (i) $21,000,000 minus (ii) the aggregate amount of borrowings by certain foreign subsidiaries of the Company (the “Foreign Subsidiary Borrowers”) under credit facilities with the Bank or any affiliate of the Bank (such revolving line of credit, the “Facility”), with sublimits for letters of credit and bankers acceptances, in each case not to exceed $5,000,000. The Facility matures on July 1, 2013, unless earlier terminated pursuant to the terms of the Loan Agreement. At the Bank’s option, the availability of the Facility may be extended beyond July 1, 2013.
Interest under the Facility is payable on the first day of each month, commencing on July 1, 2010, at an annual rate of, at the Company’s option, (i) the Bank’s prime rate minus 0.75 percentage points, or (ii) IBOR plus 1.25 percentage points, subject to the terms specified in the Loan Agreement. The Facility carries an unused commitment fee of 0.125% per year, payable on the first day of each quarter, commencing on July 1, 2010.
Pursuant to the Loan Agreement, the Company has agreed to secure its obligations under the Facility with securities and other investment property owned by the Company in certain securities accounts (the “Collateral Accounts,” or the Company’s restricted cash and cash equivalents and restricted investments available for sale, see Note B) and to guarantee the obligations of the Foreign Subsidiary Borrowers under their credit facilities with the Bank, or any affiliate of the Bank. The obligations of the Company under the Facility are guaranteed by its wholly owned subsidiary, K•Swiss Sales Corp.
The Loan Agreement contains covenants that prevent the Company from, among other things, incurring other indebtedness, granting liens, selling assets outside of the ordinary course of business, making other investments and engaging in any consolidation, merger or other combination.
The Loan Agreement contains certain events of default, including payment defaults, a cross-default upon a default under any credit facility extended by the Bank or any of its affiliates to a subsidiary of the Company, a defined change of control, certain bankruptcy and insolvency events and certain covenant defaults. If an event of default occurs, the Bank may stop making any additional credit available to the Company, require the Company to repay its entire debt under the Loan Agreement immediately and exercise remedies against any Collateral Account.
64
Table of Contents
K•SWISS INC.
NOTES TO CONSOLIDATED FINANCIAL STATEMENTS
December 31, 2010, 2009 and 2008
NOTE G—BANK LINES OF CREDIT AND OTHER DEBT—(Continued)
At December 31, 2010 and 2009, Palladium debt outstanding under its lines of credit and term loans was $970,000 and $4,207,000, respectively. There were no letters of credit outstanding under these facilities at December 31, 2010 or 2009. The breakdown of the debt outstanding at December 31 is as follows (dollars and Euros in thousands):
| 2010 | 2009 | |||||||
| Secured Fixed Rate Term Loans with Financial Institutions of €1,320 (or approximately $1,754 and $1,892 at December 31, 2010 and 2009, respectively), at interest rates ranging from 5.42% to 5.84% at December 31, 2010 and 2009, due between February 2012 and February 2013 (1) |
$ | 689 | $ | 1,048 | ||||
| Secured Variable Rate Lines of Credit with Financial Institutions (1): |
||||||||
| Facility of €4,000 (or approximately $5,314 and $5,735 at December 31, 2010 and 2009, respectively) at approximately 1.69% and 1.37% at December 31, 2010 and 2009, respectively, due December 31, 2011 and 2010, respectively |
205 | — | ||||||
| Facilities of €1,000 and €2,400 (or approximately $1,328 and $3,441) at December 31, 2010 and 2009 respectively, at interest rates ranging from approximately 2.21% to 2.99% at December 31, 2010 and ranging from approximately 1.91% to 2.85% at December 31, 2009, due June 30, 2011 and 2010, respectively (2) |
68 | 3,145 | ||||||
| Accrued interest |
8 | 14 | ||||||
| Total |
$ | 970 | $ | 4,207 | ||||
| Short-term |
$ | 566 | $ | 3,463 | ||||
| Long-term |
$ | 404 | $ | 744 | ||||
| (1) | These are secured by Palladium’s assets including accounts receivable, inventory and/or intellectual property rights (i.e. trademarks), as well as Palladium common stock. |
| (2) | These lines of credit are renewable every six months. The amount available under these facilities was €1,000 (or approximately $1,328) during the six month period July 1 through December 31, 2010 and the amount available during the sixth month period July 1 through December 31, 2009 ranged from €1,700 to €2,400 (or approximately $2,437 to $3,441), depending on Palladium’s cash needs. The lines of credit facility amounts in the table above are the maximum amounts that could be borrowed upon at December 31, 2010 and 2009. Subsequent to December 31, 2010 and 2009, these lines of credit were renewed until June 30, 2011 and 2010, respectively, and the maximum facility amount available between January 1 through June 30, 2011 and 2010 range from €1,150 to €1,350 (or approximately $1,528 to $1,793) and €1,600 to €2,400 (or approximately $2,294 to $3,441), respectively. |
Amounts due under Palladium’s lines of credit and term loans as of December 31, 2010 are as follows (in thousands):
| Year ending December 31, |
||||
| 2011 |
$ | 566 | ||
| 2012 |
252 | |||
| 2013 |
152 | |||
| 2014 |
— | |||
| Thereafter |
— | |||
| $ | 970 | |||
65
Table of Contents
K•SWISS INC.
NOTES TO CONSOLIDATED FINANCIAL STATEMENTS
December 31, 2010, 2009 and 2008
NOTE G—BANK LINES OF CREDIT AND OTHER DEBT—(Continued)
In accordance with these financing arrangements with the financial institutions, Palladium must meet minimum working capital requirements and is restricted as to the amount of dividends it can pay. At December 31, 2010, Palladium was in compliance with its debt covenants.
Interest expense of $118,000 and $214,000 was incurred on the Company’s bank loans and lines of credit during the years ended December 31, 2010 and 2009, respectively.
NOTE H—ACCRUED LIABILITIES
Accrued liabilities as of December 31 consist of the following (in thousands):
| 2010 | 2009 | |||||||
| Compensation |
$ | 3,205 | $ | 3,548 | ||||
| Advertising |
3,566 | 1,736 | ||||||
| Legal |
2,130 | 1,058 | ||||||
| Production molds |
847 | 1,735 | ||||||
| Other |
3,320 | 4,821 | ||||||
| $ | 13,068 | $ | 12,898 | |||||
NOTE I—OTHER LIABILITIES
Other liabilities as of December 31 consist of the following (in thousands):
| 2010 | 2009 | |||||||
| Deferred compensation |
$ | 7,297 | $ | 6,736 | ||||
| Uncertain tax positions, net of federal benefit of $542 and $516, for 2010 and 2009, respectively (Note J) |
6,804 | 6,552 | ||||||
| $ | 14,101 | $ | 13,288 | |||||
NOTE J—INCOME TAXES
The provision for income tax expense/(benefit) includes the following for the years ended December 31 (in thousands):
| 2010 | 2009 | 2008 | ||||||||||
| Current: |
||||||||||||
| United States |
||||||||||||
| Federal |
$ | (699 | ) | $ | (10,681 | ) | $ | 6,786 | ||||
| State |
74 | 339 | (146 | ) | ||||||||
| Foreign |
565 | 664 | 707 | |||||||||
| Deferred: |
||||||||||||
| United States |
||||||||||||
| Federal |
6,156 | 2,178 | (1,022 | ) | ||||||||
| State |
1,967 | (1,062 | ) | (132 | ) | |||||||
| Foreign |
(131 | ) | (1,101 | ) | (311 | ) | ||||||
| $ | 7,932 | $ | (9,663 | ) | $ | 5,882 | ||||||
66
Table of Contents
K•SWISS INC.
NOTES TO CONSOLIDATED FINANCIAL STATEMENTS
December 31, 2010, 2009 and 2008
NOTE J—INCOME TAXES—(Continued)
The deferred income tax expense of $7,992,000 for the year ended December 31, 2010 includes the change in the valuation allowance of $27,178,000 during 2010.
A reconciliation from the U.S. federal statutory income tax rate to the effective tax rate for the years ended December 31 is as follows:
| 2010 | 2009 | 2008 | ||||||||||
| U.S. Federal statutory rate |
35.0 | % | (35.0 | )% | 34.0 | % | ||||||
| State income taxes |
3.9 | (2.0 | ) | 4.4 | ||||||||
| Net results of foreign subsidiaries |
(6.2 | ) | 4.0 | (17.2 | ) | |||||||
| Valuation allowance |
(45.1 | ) | — | — | ||||||||
| Goodwill impairment |
— | 4.3 | — | |||||||||
| Other |
(0.8 | ) | 2.7 | (1.8 | ) | |||||||
| (13.2 | )% | (26.0 | )% | 19.4 | % | |||||||
At any point in time, many tax years are subject to audit by various taxing jurisdictions. The results of these audits and negotiations with tax authorities may affect tax positions taken by the Company. Additionally, the Company’s effective tax rate in a given financial statement period may be materially impacted by changes in the geographic mix or level of earnings.
The federal income tax returns for 2006, 2007 and 2008, certain state returns for 2007 and 2008 and certain foreign income tax returns for 2005 through 2007 are currently under various stages of audit by the applicable taxing authorities. The Company received a Notice of Proposed Adjustment from the Internal Revenue Service (“IRS”) for tax years 2006 and 2007 of $7,114,000 (which includes $1,186,000 in penalties). Interest will be assessed, and at this time it is estimated at approximately $1,316,000. This issue has been sent to the IRS Appeal’s office for further consideration. The Company does not agree with this adjustment and plans to vigorously defend its position. The Company does not believe that an additional tax accrual is required at this time. The amounts ultimately paid, if any, upon resolution of the issues raised by the taxing authorities may differ materially from the amounts accrued for each year. The Company’s material tax jurisdiction is the United States.
At December 31, 2010, the Company had a net deferred tax asset after valuation allowance of $3,913,000. The ultimate realization of this net deferred tax asset is dependent upon the generation of future taxable income outside of the U.S. during the periods in which those temporary differences become deductible. Changes in existing tax laws could also affect actual tax results and the valuation of deferred tax assets over time. The deferred tax assets for which valuation allowances were not established relate to foreign jurisdictions where the Company expects to realize these assets. The accounting for deferred taxes is based upon an estimate of future operating results. Differences between the anticipated and actual outcomes of these future tax consequences could have a material impact on the Company’s consolidated results of operations or financial position.
Deferred income taxes are determined based on the estimated future tax effects of differences between the financial statement and the tax basis of assets and liabilities given the provisions of the
67
Table of Contents
K•SWISS INC.
NOTES TO CONSOLIDATED FINANCIAL STATEMENTS
December 31, 2010, 2009 and 2008
NOTE J—INCOME TAXES—(Continued)
enacted tax laws. The net current and non-current components of deferred income taxes recognized in the balance sheets are as follows as of December 31 (in thousands):
| 2010 | 2009 | |||||||
| Net current deferred income tax assets |
$ | — | $ | 2,881 | ||||
| Net non-current deferred income tax assets |
3,913 | 9,538 | ||||||
| Net deferred income tax asset |
$ | 3,913 | $ | 12,419 | ||||
Significant components of the Company’s deferred tax assets and liabilities are as follows as of December 31 (in thousands):
| 2010 | 2009 | |||||||
| Assets |
||||||||
| State taxes |
$ | 3,465 | $ | 671 | ||||
| Bad debts reserve |
359 | 396 | ||||||
| Inventory reserve and capitalized costs |
1,982 | 2,132 | ||||||
| Sales return reserve |
289 | 238 | ||||||
| Deferred compensation plan |
2,845 | 2,602 | ||||||
| Stock-based compensation |
3,545 | 3,012 | ||||||
| Foreign research and development credit |
291 | 180 | ||||||
| Alternative minimum tax credit and U.S. foreign tax credit |
2,409 | 1,548 | ||||||
| Palladium Contingent Purchase Price |
116 | — | ||||||
| Federal net operating losses |
15,467 | — | ||||||
| Foreign net operating losses |
3,179 | 4,079 | ||||||
| Other |
1,644 | 1,022 | ||||||
| Gross deferred tax assets |
35,591 | 15,880 | ||||||
| Liabilities |
||||||||
| Contingent purchase payments |
(156 | ) | (154 | ) | ||||
| Depreciation |
(4,163 | ) | (3,295 | ) | ||||
| Other |
(181 | ) | (12 | ) | ||||
| Gross deferred tax liabilities |
(4,500 | ) | (3,461 | ) | ||||
| Valuation allowance |
||||||||
| United States |
(26,717 | ) | — | |||||
| Foreign |
(461 | ) | — | |||||
| Valuation allowance |
(27,178 | ) | — | |||||
| Net deferred tax asset |
$ | 3,913 | $ | 12,419 | ||||
During 2010, the Company moved into a three year pre-tax cumulative loss position. In addition, the Company decided during the third quarter of 2010 to continue with its aggressive advertising campaign into 2011. As such, the Company could no longer rely on a decrease in advertising expenses during 2011 to support future profitability sufficient enough to realize its deferred tax assets in the near future and recorded a valuation allowance of $27,178,000 in 2010. For 2010, the Company has recorded an income tax receivable of $770,000 for U.S. tax losses that will be carried back to the 2008 tax year. At December 31, 2010, the Company has a U.S. alternative minimum tax credit
68
Table of Contents
K•SWISS INC.
NOTES TO CONSOLIDATED FINANCIAL STATEMENTS
December 31, 2010, 2009 and 2008
NOTE J—INCOME TAXES—(Continued)
carryforward of approximately $655,000, which does not expire and a U.S. foreign tax credit carryforward of approximately $1,754,000 which will begin to expire in 2019. The Company has foreign net operating losses of $3,179,000 at December 31, 2010, which are primarily related to the pre-acquisition losses of Palladium, a French company. The carryforward period in France is unlimited. The Company has not recorded a valuation allowance against certain foreign net operating losses as the Company believes it is more-likely-than-not that the loss carryforwards will be utilized. This assessment could change in future periods if the Company does not achieve taxable income in these foreign tax jurisdictions or projections of future taxable income decline. If an increase in the valuation allowance in future periods is required, this would result in an increase in the Company’s income tax expense and could materially impact the effective income tax rate in the period recorded.
The Company did not record any valuation allowances against deferred tax assets at December 31, 2009. For 2009, the Company had a U.S. tax loss of $13,821,000, which was recorded as Income Taxes Receivable on the Consolidated Balance Sheet. The refund was received during the fourth quarter of 2010. The entire loss was carried back to the 2004 and 2005 tax years and fully realized. In addition, at December 31, 2009, the Company had a U.S. alternative minimum tax credit carryforward of approximately $655,000, which does not expire and a U.S. foreign tax credit carryforward of approximately $893,000 which will begin to expire in 2019. The Company has foreign net operating losses of $4,079,000 at December 31, 2009, which are primarily related to the pre-acquisition losses of Palladium, as discussed above.
The Company’s recognized uncertain tax positions at December 31 are as follows (in thousands):
| 2010 | 2009 | |||||||
| Uncertain tax positions |
$ | 6,302 | $ | 6,165 | ||||
| Interest on uncertain tax positions |
1,044 | 903 | ||||||
| Total uncertain tax positions, gross |
7,346 | 7,068 | ||||||
| Less federal income tax benefit |
(542 | ) | (516 | ) | ||||
| Total uncertain tax positions, net |
$ | 6,804 | $ | 6,552 | ||||
During the years ended December 31, 2010, 2009 and 2008 the Company recognized income tax expense related to uncertain tax positions of $137,000, $45,000 and $782,000, respectively, and interest expense on uncertain tax positions of $141,000, $147,000 and $160,000, respectively. The Company did not recognize any related penalties for uncertain tax positions for the years ended December 31, 2010, 2009 and 2008.
The Company does not expect its uncertain tax positions to change significantly over the next twelve months. A reconciliation of the beginning and ending amount of the Company’s uncertain tax positions, gross, at December 31 is as follows (in thousands):
| 2010 | 2009 | |||||||
| Beginning balance |
$ | 7,068 | $ | 6,876 | ||||
| Additions for uncertain tax positions |
922 | 1,107 | ||||||
| Reductions for uncertain tax positions: |
||||||||
| Expiration of statute of limitations |
(644 | ) | (858 | ) | ||||
| Other |
— | (57 | ) | |||||
| Ending balance |
$ | 7,346 | $ | 7,068 | ||||
69
Table of Contents
K•SWISS INC.
NOTES TO CONSOLIDATED FINANCIAL STATEMENTS
December 31, 2010, 2009 and 2008
NOTE K—COMMITMENTS AND CONTINGENCIES
The Company leases its principal warehouse facility through January 2015. In addition, certain property and equipment is leased primarily on a month-to-month basis. Rent expense for operating leases was approximately $6,581,000, $5,724,000 and $5,098,000 for the years ended December 31, 2010, 2009 and 2008, respectively.
The Company has entered into endorsement agreements with athletes that are sponsored by the Company through April 2014. The Company has entered into licensing agreements which require the Company to pay minimum royalties through June 2014.
Future minimum rental payments under leases, future minimum endorsement fees under endorsement agreements and future minimum royalties under licensing agreements at December 31, 2010 are as follows (in thousands):
| Year ending December 31, | ||||||||||||||||||||||||
| 2011 | 2012 | 2013 | 2014 | Thereafter | Total | |||||||||||||||||||
| Rental payments |
$ | 6,328 | $ | 5,095 | $ | 3,473 | $ | 2,862 | $ | 3,608 | $ | 21,366 | ||||||||||||
| Endorsement fees |
5,615 | 3,534 | 2,385 | 37 | — | 11,571 | ||||||||||||||||||
| Royalty fees |
1,170 | 1,190 | 560 | 30 | — | 2,950 | ||||||||||||||||||
| $ | 13,113 | $ | 9,819 | $ | 6,418 | $ | 2,929 | $ | 3,608 | $ | 35,887 | |||||||||||||
The Company has product purchase obligations of approximately $60,391,000 at December 31, 2010. The Company generally orders product four to five months in advance of sales based primarily on advance futures orders received from customers. Product purchase obligations represent open purchase orders to purchase products in the ordinary course of business that are enforceable and legally binding.
The Company has outstanding letters of credit totaling approximately $2,362,000 at December 31, 2010. These letters of credit collateralize the Company’s obligations to third parties for the purchase of inventory. The letters of credit outstanding at December 31, 2010 have original terms from one to thirteen months. The fair value of these letters of credit approximates the fees currently charged for similar agreements and is not significant at December 31, 2010 and 2009.
The Company may owe a CPP, that is equal to €3,000,000 plus up to €500,000 based on an amount calculated in accordance with a formula driven by Palladium’s EBITDA for the twelve months ended December 31, 2012. At December 31, 2010, the CPP calculated in accordance with this formula was $3,689,000 (or approximately €2,777,000), which approximated the fair value of this liability.
The Company may owe a Form CPP in an amount equal to Form Athletics’ EBITDA for the twelve months ended December 31, 2012. At December 31, 2010, the Form CPP calculated in accordance with this formula was $2,110,000, which approximated the fair value of this liability.
The Company is, from time to time, a party to litigation which arises in the normal course of its business operations. The Company does not believe that it is presently a party to litigation which will have a material adverse effect on its business or operations.
70
Table of Contents
K•SWISS INC.
NOTES TO CONSOLIDATED FINANCIAL STATEMENTS
December 31, 2010, 2009 and 2008
NOTE L—EMPLOYEE BENEFIT PLANS
In 1988, the Company adopted a domestic discretionary contribution profit sharing plan covering all employees meeting certain eligibility requirements. In 1993, the plan was amended to include a 401(k) plan. The Company contribution into this plan was approximately $30,000, $30,000 and $36,000 for the years ended December 31, 2010, 2009 and 2008, respectively.
NOTE M—STOCKHOLDERS’ EQUITY
Each share of Class B Common Stock is freely convertible into one share of Class A Common Stock at the option of the Class B stockholder. Holders of Class A Common Stock are entitled to one vote per share and holders of Class B Common Stock are entitled to ten votes per share for all matters submitted to a vote of the stockholders of the Company, other than the election of directors. Holders of Class A Common Stock are initially entitled to elect two directors and holders of Class B Common Stock are entitled to elect all directors other than directors that the holders of Class A Common Stock are entitled to elect. If the number of members of the Company’s Board of Directors is increased to not less than eleven and not greater than fifteen (excluding directors representing holders of Preferred Stock, if any), holders of Class A Common Stock will be entitled to elect three directors. If the number of members of the Company’s Board of Directors is increased to a number greater than fifteen (excluding directors representing holders of Preferred Stock, if any), holders of Class A Common Stock will be entitled to elect four directors.
In 1999, the Company adopted the 1999 Stock Incentive Plan under which it was authorized to award up to 2,400,000 shares or options to employees and directors of the Company. As amended, the number of options or awards available for issuance under the 1999 Stock Incentive Plan was 4,600,000 shares of Class A Common Stock. The awards have a term of ten years and generally become fully vested between the grant date and the ninth year following the grant date. At December 31, 2010, there were no awards available under the 1999 Stock Incentive Plan for future grants.
In 2009, the Company adopted the 2009 Stock Incentive Plan under which it is authorized to award up to 3,000,000 shares or options of the Company’s Class A Common Stock to employees and directors of the Company. The awards have a term of ten years and generally become fully vested between the third and fifth years following the grant date. At December 31, 2010, 2,595,000 awards remain available for grant under the 2009 Stock Incentive Plan.
The following table summarizes compensation costs related to the Company’s stock-based compensation plans (in thousands) for the year ended December 31:
| 2010 | 2009 | 2008 | ||||||||||
| Cost of sales |
$ | 146 | $ | 210 | $ | 241 | ||||||
| Selling, general and administrative |
1,592 | 2,981 | 3,072 | |||||||||
| Pre-tax stock-based compensation expenses |
1,738 | 3,191 | 3,313 | |||||||||
| Income tax benefit |
65 | 1,080 | 1,157 | |||||||||
| Total stock-based compensation expense |
$ | 1,673 | $ | 2,111 | $ | 2,156 | ||||||
71
Table of Contents
K•SWISS INC.
NOTES TO CONSOLIDATED FINANCIAL STATEMENTS
December 31, 2010, 2009 and 2008
NOTE M—STOCKHOLDERS’ EQUITY—(Continued)
There were no capitalized stock-based compensation costs during the years ended December 31, 2010, 2009 and 2008. The Company recognizes stock-based compensation expense using the graded-vesting attribution method. The remaining unrecognized compensation expense related to unvested awards at December 31, 2010 is $4,583,000 and the weighted-average period of time over which this expense will be recognized is approximately 1.9 years. This amount does not include the cost of any additional options that may be granted in future periods nor any changes in the Company’s forfeiture rate. In connection with the exercise of options, the Company realized income tax benefits in the years ended December 31, 2009 and 2008 that have been credited to additional paid-in capital.
On March 4, 2008, the Board of Directors unilaterally acted to amend certain outstanding options to purchase shares of the Company’s Class A Common Stock (the “Eligible Options”) held by eligible participants, to reduce the exercise price of such Eligible Options to $14.19 per share, the closing price of the Company’s Common Stock on the NASDAQ stock market on March 4, 2008. This was approved by the Company’s stockholders at the May 20, 2008 Annual Meeting. The number of stock options repriced was 459,391 to 96 employees, with a weighted average exercise price prior to repricing of $24.33 and an average remaining contractual life of 7.1 years. The compensation cost recognized during 2008 relating to this repricing was $373,000 and it is expected to result in non-cash expense of approximately $477,000 over the next six years.
On November 12, 2008, the Board of Directors approved a special dividend of $2.00 per share payable on December 24, 2008 to stockholders of record on December 10, 2008. Section 7 of the Company’s 1999 Stock Incentive Plan provides that under certain circumstances, the Board of Directors may make appropriate and proportionate adjustments in (a) the number of shares that may be acquired upon exercise, and (b) the exercise prices of such options to reflect the payment of a special cash dividend to stockholders. On November 12, 2008, the Board of Directors approved a reduction to the exercise price on all of the Company’s outstanding stock options by $2.00 per share under the terms of the anti-dilution provisions of the Company’s 1999 Stock Incentive Plan. The number of stock options repriced was 2,036,966 to 121 employees, with a weighted average exercise price prior to repricing of $11.46 and an average remaining contractual life of 5.1 years. The compensation cost recognized during 2008 relating to this repricing was $1,249,000 and it is expected to result in non-cash expense of approximately $488,000 over the next seven years. There were no modifications to stock option awards during 2010 or 2009.
The fair value of stock options at date of grant was estimated using the Black-Scholes model. The expected life of employee stock options is determined using historical data of employee exercises and represents the period of time that stock options are expected to be outstanding. The risk-free interest rate is based on the U.S. Treasury constant maturity for the expected life of the stock option. Expected volatility is based on the historical volatilities of the Company’s Class A Common Stock. The Black-Scholes model was used with the following assumptions:
| 2010 | 2009 | 2008 | ||||||||||
| Expected life (years) |
6 | 5 | 7 | |||||||||
| Risk-free interest rate |
2.4 | % | 2.0 | % | 3.0 | % | ||||||
| Expected volatility |
46.0 | % | 45.5 | % | 40.8 | % | ||||||
| Expected dividend yield |
— | — | 1.2 | % | ||||||||
72
Table of Contents
K•SWISS INC.
NOTES TO CONSOLIDATED FINANCIAL STATEMENTS
December 31, 2010, 2009 and 2008
NOTE M—STOCKHOLDERS’ EQUITY—(Continued)
The following table summarizes the stock option transactions for 2010, 2009 and 2008:
| Shares | Weighted average exercise price |
Weighted average remaining contractual life (in years) |
Aggregate intrinsic value |
|||||||||||||
| Options outstanding January 1, 2008 |
2,051,572 | $ | 12.52 | |||||||||||||
| Granted |
548,500 | 13.47 | ||||||||||||||
| Repriced |
2,496,357 | 10.33 | ||||||||||||||
| Exercised |
(247,659 | ) | 6.55 | |||||||||||||
| Canceled |
(2,672,425 | ) | 13.79 | |||||||||||||
| Options outstanding December 31, 2008 |
2,176,345 | 9.37 | ||||||||||||||
| Granted |
995,165 | 6.96 | ||||||||||||||
| Exercised |
(281,365 | ) | 3.31 | |||||||||||||
| Canceled |
(118,080 | ) | 12.59 | |||||||||||||
| Options outstanding December 31, 2009 |
2,772,065 | 8.98 | ||||||||||||||
| Granted |
318,300 | 11.21 | ||||||||||||||
| Exercised |
(241,999 | ) | 5.15 | |||||||||||||
| Canceled |
(89,471 | ) | 9.95 | |||||||||||||
| Options outstanding December 31, 2010 |
2,758,895 | $ | 9.54 | 6.07 | $ | 9,078,000 | ||||||||||
| Options exercisable December 31, 2010 |
1,297,454 | $ | 9.18 | 4.17 | $ | 5,112,000 | ||||||||||
Options exercisable at December 31, 2009 and 2008 were 1,321,720 and 972,292, respectively. The weighted-average grant-date fair value of stock options granted during 2010, 2009 and 2008 was $5.35, $2.82 and $6.35, respectively.
The Company reflects income tax benefits resulting from tax deductions in excess of expense as a financing cash flow in its consolidated statement of cash flows. Cash proceeds, income tax benefit and intrinsic value of related stock options exercised during the years ended December 31, 2010, 2009 and 2008 are as follows (in thousands):
| 2010 | 2009 | 2008 | ||||||||||
| Proceeds from stock options exercised |
$ | 1,247 | $ | 931 | $ | 1,621 | ||||||
| Income tax benefit related to stock options exercised |
$ | — | $ | 730 | $ | 844 | ||||||
| Intrinsic value of stock options exercised |
$ | 1,681 | $ | 1,946 | $ | 2,570 | ||||||
The Company issues new shares of Class A Common Stock to satisfy stock option exercises. Shares that are repurchased under the Company’s current stock repurchase programs will reduce the dilutive impact of the Company’s share-based compensation plans. Under its stock repurchase programs, the Company did not purchase shares of Class A Common Stock during the year ended December 31, 2010.
73
Table of Contents
K•SWISS INC.
NOTES TO CONSOLIDATED FINANCIAL STATEMENTS
December 31, 2010, 2009 and 2008
NOTE N—CONCENTRATIONS OF CREDIT RISK
Financial instruments that potentially subject the Company to significant concentrations of credit risk consist principally of cash and cash equivalents, trade accounts receivable and financial
instruments used in hedging activities. The Company maintains cash and cash equivalents at financial institutions in excess of the amount insured by the Federal Deposit Insurance Corporation. For forward exchange contracts, the credit risk the Company is exposed to is limited to the unrealized gains in these contracts should the counterparties fail to perform. As part of its cash and risk management processes, the Company performs periodic evaluations of the relative credit standing of these financial institutions.
During the years ended December 31, 2010, 2009 and 2008, there were no customers that accounted for more than 10% of total revenues. At December 31, 2010 and 2009, approximately 39% and 38%, respectively, of accounts receivable were from six customers. Credit risk with respect to other trade accounts receivable is generally diversified due to the large number of entities comprising the Company’s customer base and their dispersion across many geographies. The Company controls credit risk through credit approvals, credit limits and monitoring procedures, and for international receivables from distributors, the use of letters of credit and letters of guarantee.
NOTE O—SEGMENT INFORMATION
The Company’s predominant business is the design, development and distribution of athletic footwear. The Company has identified its footwear products business to be its only segment as substantially all of the Company’s revenues are from the sales of footwear products. The Company is organized into three geographic regions: the United States, Europe, Middle East and Africa (“EMEA”) and Other International operations. The Company’s Other International geographic region includes the Company’s operations in Asia. The following tables summarize information by geographic region of the Company’s footwear segment (in thousands):
| Year ended December 31, | ||||||||||||
| 2010 | 2009 | 2008 | ||||||||||
| Revenues from unrelated entities (1): |
||||||||||||
| United States |
$ | 92,382 | $ | 101,181 | $ | 138,390 | ||||||
| EMEA |
71,730 | 91,719 | 129,313 | |||||||||
| Other International |
52,875 | 47,829 | 59,702 | |||||||||
| $ | 216,987 | $ | 240,729 | $ | 327,405 | |||||||
| Inter-geographic revenues: |
||||||||||||
| United States |
$ | 4,290 | $ | 4,796 | $ | 6,629 | ||||||
| EMEA |
6 | 12 | 10 | |||||||||
| Other International |
132 | 105 | 33,410 | |||||||||
| $ | 4,428 | $ | 4,913 | $ | 40,049 | |||||||
| Total revenues: |
||||||||||||
| United States |
$ | 96,672 | $ | 105,977 | $ | 145,019 | ||||||
| EMEA |
71,736 | 91,731 | 129,323 | |||||||||
| Other International |
53,007 | 47,934 | 93,112 | |||||||||
| Less inter-geographic revenues |
(4,428 | ) | (4,913 | ) | (40,049 | ) | ||||||
| $ | 216,987 | $ | 240,729 | $ | 327,405 | |||||||
74
Table of Contents
K•SWISS INC.
NOTES TO CONSOLIDATED FINANCIAL STATEMENTS
December 31, 2010, 2009 and 2008
NOTE O—SEGMENT INFORMATION—(Continued)
| Year ended December 31, | ||||||||||||
| 2010 | 2009 | 2008 | ||||||||||
| Operating (loss)/profit: |
||||||||||||
| United States |
$ | (36,288 | ) | $ | (13,337 | ) | $ | (3,907 | ) | |||
| EMEA |
(10,942 | ) | (3,044 | ) | 13,660 | |||||||
| Other International |
5,327 | 5,573 | 10,038 | |||||||||
| Less corporate expenses (2) |
(17,222 | ) | (23,596 | ) | (25,931 | ) | ||||||
| Eliminations |
1,730 | (2,558 | ) | (1,739 | ) | |||||||
| $ | (57,395 | ) | $ | (36,962 | ) | $ | (7,879 | ) | ||||
| Interest income: |
||||||||||||
| United States |
$ | 859 | $ | 1,932 | $ | 7,271 | ||||||
| EMEA |
16 | 16 | 624 | |||||||||
| Other International |
56 | 58 | 537 | |||||||||
| Total interest income |
931 | 2,006 | 8,432 | |||||||||
| Interest expense: |
||||||||||||
| United States |
369 | 665 | 24 | |||||||||
| EMEA |
127 | 274 | 192 | |||||||||
| Other International |
— | 17 | — | |||||||||
| Total interest expense |
496 | 956 | 216 | |||||||||
| Interest income, net |
$ | 435 | $ | 1,050 | $ | 8,216 | ||||||
| Income tax expense/(benefit): |
||||||||||||
| United States |
$ | 7,497 | $ | (9,227 | ) | $ | 5,486 | |||||
| EMEA |
182 | (142 | ) | 371 | ||||||||
| Other International |
253 | (294 | ) | 25 | ||||||||
| $ | 7,932 | $ | (9,663 | ) | $ | 5,882 | ||||||
| Provision for depreciation and amortization: |
||||||||||||
| United States |
$ | 2,547 | $ | 3,100 | $ | 2,748 | ||||||
| EMEA |
553 | 885 | 610 | |||||||||
| Other International |
559 | 174 | 176 | |||||||||
| $ | 3,659 | $ | 4,159 | $ | 3,534 | |||||||
| Capital expenditures: |
||||||||||||
| United States |
$ | 853 | $ | 421 | $ | 3,325 | ||||||
| EMEA |
503 | 810 | 1,253 | |||||||||
| Other International |
1,021 | 213 | 472 | |||||||||
| $ | 2,377 | $ | 1,444 | $ | 5,050 | |||||||
75
Table of Contents
K•SWISS INC.
NOTES TO CONSOLIDATED FINANCIAL STATEMENTS
December 31, 2010, 2009 and 2008
NOTE O—SEGMENT INFORMATION—(Continued)
| December 31, | ||||||||
| 2010 | 2009 | |||||||
| Long-lived assets (3): |
||||||||
| United States |
$ | 18,271 | $ | 19,967 | ||||
| EMEA |
993 | 886 | ||||||
| Other International |
1,431 | 1,200 | ||||||
| $ | 20,695 | $ | 22,053 | |||||
| (1) | Revenue is attributable to geographic regions based on the location of the Company subsidiary. |
| (2) | Corporate expenses include expenses such as salaries and related expenses for executive management and support departments such as accounting and treasury, information technology and legal which benefit the entire corporation and are not segment/region specific. The decrease in corporate expenses for the year ended December 31, 2010 compared to the year ended December 31, 2009 was a result of decreased data processing expenses and compensation expenses. The decrease in data processing expense was a result of decreases in on-going maintenance expense for the Company’s SAP computer software system due to the completion of the SAP implementation in certain international regions in the fourth quarter of 2008. The decrease in compensation expenses, which include bonus/incentive related expenses and employee recruiting and relocation expenses, resulted primarily from a decrease in stock option compensation expenses. In addition, there was no impairment charge recognized during the year ended December 31, 2010, whereas for the year ended December 31, 2009, an impairment charge on the goodwill and intangible assets related to Palladium was recognized. The decrease of corporate expenses during the year ended December 31, 2009 compared to the year ended December 31, 2008 was a result of decreases in data processing expenses, legal expenses and accounting expenses offset by an impairment charge on the goodwill and intangible assets related to Palladium, as discussed above. The decrease in data processing expenses was a result of a decrease in on-going maintenance expenses for the Company’s SAP computer software system, as discussed above. The decrease in legal expenses was a result of a decrease in expenses incurred to defend the Company’s trademarks. The decrease in accounting expenses was a result of lower auditing fees for non-recurring 2008 events and a reduction of the outsourcing of certain accounting services. |
| (3) | Long-lived assets consist of property, plant and equipment, net. |
NOTE P—PALLADIUM
On May 16, 2008, the Company entered into a Share Purchase and Shareholders’ Rights Agreement (the “Agreement”) by and among an individual, Palladium and the Company providing for the purchase of a 57% equity interest in Palladium from its shareholders for a total purchase price of €5,350,000, or approximately $8,448,000 (including a loan of €3,650,000, or approximately $5,764,000). Pursuant to the terms of the Agreement, the Company also agreed to acquire the remaining 43% equity interest in Palladium, subject to certain conditions set forth in the Agreement, which would occur in the first half of 2013, except in certain circumstances. If the purchase occurred in the first half of 2013, then the purchase price would be equal to an amount calculated in accordance with a formula driven by Palladium’s EBITDA for the twelve months ended December 31, 2012 plus
76
Table of Contents
K•SWISS INC.
NOTES TO CONSOLIDATED FINANCIAL STATEMENTS
December 31, 2010, 2009 and 2008
NOTE P—PALLADIUM—(Continued)
€1,700,000. Otherwise the purchase price would be equal to €1,700,000 plus an amount calculated in accordance with a formula driven by Palladium’s EBITDA for the twelve months ended (i) December 31 of the year preceding the purchase (or September 30, 2008 if the purchase occurred prior to December 31, 2009) or (ii) December 31, 2012, at the option of the seller. At December 31, 2008, the fair value of this liability was approximately $3,759,000, which was subject to final determination at the time of purchase in accordance with the Agreement. Closing of the 57% equity purchase occurred on July 1, 2008. As discussed in more detail below, the acquisition of Palladium was recorded as a 100% purchase acquisition and accordingly, the results of operations of the acquired business are included in the Consolidated Financial Statements from the date of acquisition. In addition, as discussed in more detail below, the Company purchased the remaining 43% equity interest in Palladium on June 2, 2009.
Upon the initial purchase of the 57% equity interest, the Company determined that the mandatory redemption provisions of the Agreement required the Company to purchase the remaining 43% equity interest as a single unit and that there were no substantive conditions to the future purchase of this remaining 43% equity interest that would reasonably change the redemption conditions from mandatory to contingent. As such, at July 1, 2008, the Company recorded a liability, Mandatorily Redeemable Minority Interest (“MRMI”) on its balance sheet at fair value, or $4,249,000. Subsequent changes to the fair value of the MRMI will be recorded as interest income or interest expense. The fair value of the MRMI will be determined each quarter based on the current quarter’s projection of EBITDA for the twelve months ended December 31 of the current year, but not less than the amount determined at the previous twelve month measurement date per the Agreement. The change in MRMI is based on the current quarter’s EBITDA projection and will be recognized as interest income or interest expense during the current quarter.
On June 2, 2009, the Company entered into Amendment No. 1 to the Share Purchase and Shareholders’ Rights Agreement by and among an individual, Palladium and the Company providing for the purchase of the remaining 43% equity interest in Palladium for €5,000,000 plus a variable future price (see discussion below). The payment of the €5,000,000 (or $7,034,000) was paid on June 16, 2009. The future purchase price is equal to an amount calculated in accordance with a formula driven by Palladium’s EBITDA for the twelve months ended December 31, 2012 less €3,300,000, but not to exceed €6,700,000. The fair value of this new liability, or the CPP, will be determined each quarter based on the current quarter’s projection of Palladium’s EBITDA for the twelve months ended December 31 of the current year, less €3,300,000, but not less than zero. The change in CPP is based on the current quarter’s EBITDA projection and will be recognized as interest income or interest expense during the current quarter. As a result of purchasing the remaining 43% equity interest, the Company recognized a loss of $2,616,000 on the purchase, which is recorded in Other (Expense)/Income, net on the Consolidated Statement of Earnings/Loss. The loss was calculated as the difference between the purchase price and its MRMI. The fair value of the CPP at December 31, 2009 was zero. The Company did not recognize interest income or interest expense as a result of changes in CPP during 2009.
On May 1, 2010, the Company entered into Amendment No. 2 to the Share Purchase and Shareholders’ Rights Agreement to revise the terms of the remaining future purchase price for Palladium payable in 2013. Pursuant to Amendment No. 2, the fair value of the future purchase price for Palladium, i.e. the CPP, will be equal to the net present value of €3,000,000 plus up to €500,000 based on an amount calculated in accordance with a formula driven by Palladium’s EBITDA for the
77
Table of Contents
K•SWISS INC.
NOTES TO CONSOLIDATED FINANCIAL STATEMENTS
December 31, 2010, 2009 and 2008
NOTE P—PALLADIUM—(Continued)
twelve months ended December 31, 2012. The €500,000 CPP will be determined each quarter based on the current quarter’s projection of Palladium’s EBITDA for the twelve months ended December 31 of the current year. Excluding the initial recognition of the CPP, any change in CPP is based on the change in net present value of the €3,000,000 and the current quarter’s EBITDA projection, and will be recognized as interest income or interest expense during the current quarter. During the second quarter of 2010, the Company recognized the initial fair value of the CPP of $3,320,000, which is recorded in Other (expense)/income, net on its Consolidated Statements of Earnings/Loss.
In addition during 2009, certain adjustments were made to goodwill to finalize the purchase accounting for the acquisition of Palladium. Goodwill was reduced by $3,077,000 and a deferred tax asset was created. The deferred tax asset recognized represents Palladium’s pre-acquisition net operating losses. The Company believes that these net operating losses will be utilized in the future which is based on anticipated future taxable income sufficient to utilize these losses and the indefinite carryforward of net operating losses allowed for under local tax law.
The change in the CPP or the change in the fair value of MRMI during the years ended December 31, 2010, 2009 and 2008 is as follows (in thousands):
| 2010 | 2009 | 2008 | ||||||||||
| Beginning Balance |
$ | — | $ | 3,759 | $ | — | ||||||
| Initial valuation of CPP/MRMI |
3,320 | — | 4,249 | |||||||||
| Change in the net present value of the CPP and/or change in EBITDA projection |
369 | 658 | (490 | ) | ||||||||
| Purchase of remaining 43% of Palladium |
— | (4,417 | ) | — | ||||||||
| Ending Balance |
$ | 3,689 | $ | — | $ | 3,759 | ||||||
Palladium designs, develops and markets footwear under the Palladium brand worldwide except for Canada and the U.S., where the Company holds the exclusive rights to market footwear under the Palladium brand. The purchase of Palladium was part of an overall strategy to own the worldwide rights of the Palladium trademark. Prior to July 1, 2008, the Company owned only the United States and Canada trademarks, as discussed below.
78
Table of Contents
K•SWISS INC.
NOTES TO CONSOLIDATED FINANCIAL STATEMENTS
December 31, 2010, 2009 and 2008
NOTE P—PALLADIUM—(Continued)
The acquisition of Palladium on July 1, 2008 was recorded as a 100% purchase acquisition without reflecting any minority interest but recognizing the MRMI liability and accordingly, the results of operations of the acquired business are included in the Consolidated Financial Statements from the date of acquisition. A trademark asset totaling $8,688,000 and goodwill of $5,285,000, have been recognized for the amount of the excess of the purchase price paid over the fair market value of the net assets acquired. At July 1, 2008, the acquired assets and liabilities assumed in the purchase of Palladium is as follows (in thousands):
| Balance at July 1, 2008 |
||||
| Accounts receivable |
$ | 3,060 | ||
| Inventory |
5,751 | |||
| Other current assets |
930 | |||
| Intangible assets |
13,973 | |||
| Other assets |
1,034 | |||
| Total assets |
$ | 24,748 | ||
| Current liabilities, excluding third party debt |
$ | 11,784 | ||
| Lines of credit |
4,853 | |||
| MRMI |
4,249 | |||
| Long-term debt |
1,178 | |||
| Total liabilities |
22,064 | |||
| Contribution by K•Swiss Inc. |
2,684 | |||
| Total stockholders’ equity |
2,684 | |||
| Total liabilities and stockholders’ equity |
$ | 24,748 | ||
The lines of credit of approximately $4,853,000 include amounts outstanding under Palladium’s bank lines of credit and the current portion of long-term debt with financial institutions. The loans are paid either on a monthly or quarterly basis and have maturity dates ranging from February 2012 to February 2013. See Note G for further discussion. On a pro forma basis, as if Palladium had been acquired at the beginning of 2008, consolidated revenues, earnings from continuing operations, net earnings and earnings per diluted common share would have been as follows for the year ended December 31, 2008 (dollar amounts in thousands):
| Unaudited Pro Forma 2008 |
||||
| Revenues |
$ | 337,900 | ||
| Earnings from continuing operations |
$ | 23,492 | ||
| Net Earnings |
$ | 19,922 | ||
| Earnings per diluted common share: |
||||
| Earnings from continuing operations |
$ | 0.66 | ||
| Net earnings |
$ | 0.56 | ||
79
Table of Contents
K•SWISS INC.
NOTES TO CONSOLIDATED FINANCIAL STATEMENTS
December 31, 2010, 2009 and 2008
NOTE P—PALLADIUM—(Continued)
In addition, in a separate transaction on March 28, 2008, the Company entered into an Assignment and Assumption Agreement (the “Assignment Agreement”) with Palladium. The Assignment Agreement provided for the Company’s assumption of Palladium’s rights and obligations under a certain intellectual property purchase and sale agreement by and between Palladium and Consolidated Shoe Company pursuant to which Palladium agreed to acquire certain intellectual property from Consolidated Shoe Company for a purchase price of $6,000,000.
These intangible assets are accounted for at the lower of carrying value or fair value. These indefinite-lived assets will be evaluated for impairment at least annually, and more often when events indicate that an impairment exists. See Note E.
NOTE Q—FORM ATHLETICS
On July 23, 2010, the Company entered into a Membership Interest Purchase Agreement (“Purchase Agreement”) with Form Athletics and its Members to purchase Form Athletics for $1,600,000 in cash. Pursuant to the Purchase Agreement, the Company is obligated to pay additional cash consideration to certain Members of Form Athletics in an amount equal to Form Athletics’ EBITDA for the twelve months ended December 31, 2012, or the Form CPP. The purchase price of $1,600,000 and the net present value of the initial estimate of the Form CPP was capitalized. The fair value of the Form CPP will be determined each quarter based on the net present value of the current quarter’s projection of Form Athletics’ EBITDA for the twelve months ended December 31, 2012. Any subsequent changes to the Form CPP will be recognized as interest income or interest expense during the applicable quarter.
The acquisition of Form Athletics was recorded as a 100% purchase acquisition and the Form CPP liability was recognized and accordingly, the results of operations of the acquired business are included in the Company’s Consolidated Financial Statements from the date of acquisition. A trademark asset totaling $3,150,000 and goodwill of $539,000 have been recognized for the amount of the excess purchase price paid over fair market value of the net assets acquired. The amount of goodwill that is deductible for tax purposes is $507,000 and will be amortized over 15 years. At July 23, 2010, the acquired assets and liabilities assumed in the purchase of Form Athletics is as follows (in thousands):
| Balance at July 23, 2010 |
||||
| Inventory |
$ | 39 | ||
| Intangible assets |
3,689 | |||
| Total assets |
$ | 3,728 | ||
| Current liabilities |
$ | 18 | ||
| Form CPP |
2,110 | |||
| Total liabilities |
2,128 | |||
| Contribution by K•Swiss Inc. |
1,600 | |||
| Total stockholders’ equity |
1,600 | |||
| Total liabilities and stockholders’ equity |
$ | 3,728 | ||
80
Table of Contents
K•SWISS INC.
NOTES TO CONSOLIDATED FINANCIAL STATEMENTS
December 31, 2010, 2009 and 2008
NOTE Q—FORM ATHLETICS—(Continued)
The change in the Form CPP for the year ended December 31, 2010 is as follows (in thousands):
| Beginning balance |
$ | — | ||
| Initial recognition of the net present value of the Form CPP |
2,110 | |||
| Ending balance |
$ | 2,110 | ||
Form Athletics was established in January 2010 and designs, develops and distributes apparel for mixed martial arts under the Form Athletics brand worldwide. The purchase of Form Athletics was part of an overall strategy to enter the action sports market. Since Form Athletics began operating in early 2010, operating results prior to the Company’s purchase of Form Athletics were not significant and pro forma information would not be materially different than what is reported on the Company’s Consolidated Financial Statements.
The intangible assets are accounted for at the lower of carrying value or fair value. These indefinite-lived assets will be evaluated for impairment at least annually, and more often when events indicate that impairment exists.
NOTE R—SALE OF ROYAL ELASTICS
On April 30, 2009, the Company sold certain Royal Elastics assets, consisting of its inventory located in Taiwan and its intangible trademarks, with an approximate net book value of $1,043,000, to Royal Elastics Holdings Ltd. (“REH”), a third party, in an arm’s length transaction for $4,000,000. In respect to this sale, the Company received a $1,104,000 promissory note from REH and REH agreed to pay the company $2,896,000 in cash by April 30, 2010. As of December 31, 2010, however the Company only received approximately $2,438,000 in cash. The difference between what the Company expected to receive and what had been received by April 30, 2010 was added to the principal amount of the promissory note balance such that as of December 31, 2010, the Company holds a promissory note in the principal amount of approximately $1,562,000 from REH. Interest on the promissory note is payable quarterly at an interest rate of Wall Street Journal Prime plus 1%. The principal balance is due on April 30, 2016. The pre-tax gain on sale of $1,367,000 for the year ended December 31, 2009 was recorded in Other (Expense)/Income, net on the Consolidated Statement of Earnings/Loss. Operations of the Royal Elastics brand have been accounted for and presented as a discontinued operation in the accompanying financial statements. The operations of Royal Elastics for year ended December 31 is as follows (in thousands):
| 2009 | 2008 | |||||||
| Revenues |
$ | 5,339 | $ | 12,755 | ||||
| Cost of goods sold |
3,708 | 9,416 | ||||||
| Gross profit |
1,631 | 3,339 | ||||||
| Selling, general and administrative expenses |
1,814 | 7,970 | ||||||
| Operating loss |
(183 | ) | (4,631 | ) | ||||
| Interest expense, net |
(929 | ) | (1,251 | ) | ||||
| Loss before income taxes |
(1,112 | ) | (5,882 | ) | ||||
| Income tax benefit |
(648 | ) | (2,312 | ) | ||||
| Net loss from discontinued operations |
$ | (464 | ) | $ | (3,570 | ) | ||
81
Table of Contents
K•SWISS INC.
NOTES TO CONSOLIDATED FINANCIAL STATEMENTS
December 31, 2010, 2009 and 2008
NOTE S—QUARTERLY FINANCIAL DATA (Unaudited)
Summarized quarterly financial data for 2010 and 2009 follows (in thousands except for per share amounts):
| First Quarter |
Second Quarter |
Third Quarter |
Fourth Quarter |
Year | ||||||||||||||||
| 2010 |
||||||||||||||||||||
| Revenues |
$ | 65,870 | $ | 46,831 | $ | 61,621 | $ | 42,665 | $ | 216,987 | ||||||||||
| Gross profit |
28,646 | 17,526 | 25,102 | 13,805 | 85,079 | |||||||||||||||
| Net loss |
(4,698 | ) | (14,545 | ) | (28,334 | ) | (20,635 | ) | (68,212 | ) | ||||||||||
| Loss per share |
||||||||||||||||||||
| Basic and Diluted Net loss |
$ | (0.13 | ) | $ | (0.41 | ) | $ | (0.80 | ) | $ | (0.58 | ) | $ | (1.94 | ) | |||||
| 2009 |
||||||||||||||||||||
| Revenues |
$ | 74,044 | $ | 54,032 | $ | 70,633 | $ | 42,020 | $ | 240,729 | ||||||||||
| Gross profit |
28,292 | 16,260 | 26,292 | 15,327 | 86,171 | |||||||||||||||
| Loss from continuing operations |
(1,605 | ) | (11,065 | ) | (2,588 | ) | (12,240 | ) | (27,498 | ) | ||||||||||
| (Loss)/Earnings from discontinued operations |
512 | (432 | ) | (296 | ) | (248 | ) | (464 | ) | |||||||||||
| Net loss |
(1,093 | ) | (11,497 | ) | (2,884 | ) | (12,488 | ) | (27,962 | ) | ||||||||||
| Loss per share |
||||||||||||||||||||
| Basic and Diluted |
||||||||||||||||||||
| Loss from continuing operations |
$ | (0.04 | ) | $ | (0.32 | ) | $ | (0.07 | ) | $ | (0.35 | ) | $ | (0.79 | ) | |||||
| (Loss)/Earnings from discontinued operations |
0.01 | (0.01 | ) | (0.01 | ) | (0.01 | ) | (0.01 | ) | |||||||||||
| Net loss |
(0.03 | ) | (0.33 | ) | (0.08 | ) | (0.36 | ) | (0.80 | ) | ||||||||||
NOTE T—SUBSEQUENT EVENT
In January 2011, the Company and one of its international distributors entered into a settlement and termination agreement. The Company agreed to an early termination of this distributor’s contracts for an amount equal to $3,000,000. This amount was received on February 8, 2011 and will be classified as Other Income on the Company’s Consolidated Financial Statements for the quarter ended March 31, 2011.
82
Table of Contents
| Item 9. | Changes in and Disagreements with Accountants on Accounting and Financial Disclosure |
None.
| Item 9A. | Controls and Procedures |
Disclosure Controls and Procedures
The Company’s management carried out an evaluation, under the supervision and with the participation of the Company’s President and Chief Executive Officer and Vice President of Finance and Chief Financial Officer, of the effectiveness of the design and operation of the Company’s disclosure controls and procedures (as such term is defined in Rules 13a-15(e) and 15d-15(e) under the Exchange Act) as of December 31, 2010, pursuant to Exchange Act Rule 13a-15. Based upon that evaluation, the Company’s President and Chief Executive Officer along with the Company’s Vice President of Finance and Chief Financial Officer concluded that the Company’s disclosure controls and procedures as of December 31, 2010 are effective in ensuring that (i) information required to be disclosed by the Company in the reports that it files or submits under the Exchange Act is recorded, processed, summarized and reported, within the time periods specified in the S.E.C.’s rules and forms and (ii) information required to be disclosed by the Company in the reports that it files or submits under the Exchange Act is accumulated and communicated to the Company’s management, including its principal executive and principal financial officers, or persons performing similar functions, as appropriate to allow timely decisions regarding required disclosure.
Internal Control Over Financial Reporting
No changes in the Company’s internal control over financial reporting were identified in connection with the evaluation required by Exchange Act Rule 13a-15(d) or 15d-15(d) during the three months ended December 31, 2010 that have materially affected, or are reasonably likely to materially affect, the Company’s internal control over financial reporting. See “Report of Independent Registered Public Accounting Firm on Internal Control Over Financial Reporting” and “Management’s Report on Internal Control Over Financial Reporting” on pages 43 and 44, respectively.
| Item 9B. | Other Information |
None.
83
Table of Contents
PART III
| Item 10. | Directors, Executive Officers and Corporate Governance |
Except for the information disclosed in Part I under the heading “Executive Officers of the Registrant,” the information required by this item will be contained in the Company’s Proxy Statement for its Annual Stockholders Meeting to be held June 1, 2011 to be filed with the S.E.C. within 120 days after December 31, 2010 and is incorporated herein by reference.
| Item 11. | Executive Compensation |
The information required by this item will be contained in the Company’s Proxy Statement for its Annual Stockholders Meeting to be held June 1, 2011 to be filed with the S.E.C. within 120 days after December 31, 2010 and is incorporated herein by reference.
| Item 12. | Security Ownership of Certain Beneficial Owners and Management and Related Stockholder Matters |
The information required by this item will be contained in the Company’s Proxy Statement for its Annual Stockholders Meeting to be held June 1, 2011 to be filed with the S.E.C. within 120 days after December 31, 2010 and is incorporated herein by reference.
| Item 13. | Certain Relationships and Related Transactions, and Director Independence |
The information required by this item will be contained in the Company’s Proxy Statement for its Annual Stockholders Meeting to be held June 1, 2011 to be filed with the S.E.C. within 120 days after December 31, 2010 and is incorporated herein by reference.
| Item 14. | Principal Accountant Fees and Services |
The information required by this item will be contained in the Company’s Proxy Statement for its Annual Stockholders Meeting to be held June 1, 2011 to be filed with the S.E.C. within 120 days after December 31, 2010 and is incorporated herein by reference.
84
Table of Contents
PART IV
| Item 15. | Exhibits and Financial Statement Schedules |
(a) Financial Statements
(b) Exhibits
| 3.1 | Second Amended and Restated Bylaws of K•Swiss Inc. (incorporated by reference to exhibit 3.1 to the Registrant’s Form 8-K filed with the S.E.C. on March 27, 2009) | |
| 3.2 | Amended and Restated Certificate of Incorporation of K•Swiss Inc. (incorporated by reference to exhibit 3.2 to the Registrant’s Form 10-K for fiscal year ended December 31, 2004) | |
| 4.1 | Certificate of Designations of Class A Common Stock of K•Swiss Inc. (incorporated by reference to exhibit 3.2 to the Registrant’s Form S-1 Registration Statement No. 33-34369) | |
| 4.2 | Certificate of Designations of Class B Common Stock of K•Swiss Inc. (incorporated by reference to exhibit 3.3 to the Registrant’s Form S-1 Registration Statement No. 33-34369) | |
| 4.3 | Specimen K•Swiss Inc. Class A Common Stock Certificate (incorporated by reference to exhibit 4.1 to the Registrant’s Form S-1 Registration Statement No. 33-34369) | |
| 4.4 | Specimen K•Swiss Inc. Class B Common Stock Certificate (incorporated by reference to exhibit 4.2 to the Registrant’s Form S-1 Registration Statement No. 33-34369) | |
| 10.1 | K•Swiss Inc. 1990 Stock Incentive Plan, as amended through October 28, 2002 (incorporated by reference to exhibit 10.1 to the Registrant’s Form 10-K for the year ended December 31, 2002) | |
| 10.2 | Form of Amendment No. 1 to K•Swiss Inc. Employee Stock Option Agreement Pursuant to the 1990 Stock Incentive Plan (incorporated by reference to exhibit 10.2 to the Registrant’s Form 10-K for the year ended December 31, 2002) | |
| 10.3 | K•Swiss Inc. 1999 Stock Incentive Plan, as amended through October 26, 2004 (incorporated by reference to exhibit 4.1 to the Registrant’s Form S-8 filed with the S.E.C. on February 23, 2005) | |
85
Table of Contents
| 10.4 | Form of Amendment No. 1 to K•Swiss Inc. Employee Stock Option Agreement Pursuant to the 1999 Stock Incentive Plan (incorporated by reference to exhibit 10.4 to the Registrant’s Form 10-K for the year ended December 31, 2002) | |
| 10.5 | K•Swiss Inc. 2009 Stock Incentive Plan (incorporated by reference to exhibit 99.1 to the Registrant’s Registration Statement on Form S-8 filed with the S.E.C. on May 22, 2009) | |
| 10.6 | K•Swiss Inc. Employee Stock Option Agreement (Officers) Pursuant to the 2009 Stock Incentive Plan (incorporated by reference to exhibit 10.2 to the Registrant’s Form 8-K filed with the S.E.C. on May 22, 2009) | |
| 10.7 | K•Swiss Inc. Non-Employee Director Stock Option Agreement Pursuant to the 2009 Stock Incentive Plan (incorporated by reference to exhibit 10.3 to the Registrant’s Form 8-K filed with the S.E.C. on May 22, 2009) | |
| 10.8 | K•Swiss Inc. Profit Sharing Plan, as amended (incorporated by reference to exhibit 10.3 to the Registrant’s Form S-1 Registration Statement No. 33-34369) | |
| 10.9 | Amendment to K•Swiss Inc. 401(k) and Profit Sharing Plan (incorporated by reference to exhibit 10.35 to the Registrant’s Form 10-K for the year ended December 31, 1993) | |
| 10.10 | Amendment to K•Swiss Inc. 401(k) and Profit Sharing Plan dated May 26, 1994 (incorporated by reference to exhibit 10.32 to the Registrant’s Form 10-K for the year ended December 31, 1994) | |
| 10.11 | Amendment to K•Swiss Inc. 401(k) and Profit Sharing Plan dated January 1, 2000 (incorporated by reference to exhibit 10.30 to the Registrant’s Form 10-K for the year ended December 31, 1999) | |
| 10.12 | Amendment to K•Swiss Inc. 401(k) and Profit Sharing Plan dated January 23, 2002 (incorporated by reference to exhibit 10 to the Registrant’s Form 10-Q for the quarter ended March 31, 2002) | |
| 10.13 | Amendment to K•Swiss Inc. 401(k) and Profit Sharing Plan dated January 10, 2003 (incorporated by reference to exhibit 10.23 to the Registrant’s Form 10-Q for the quarter ended June 30, 2003) | |
| 10.14 | Amendment to K•Swiss Inc. 401(k) and Profit Sharing Plan dated October 9, 2003 (incorporated by reference to exhibit 10.11 to the Registrant’s Form 10-Q for the quarter ended June 30, 2004) | |
| 10.15 | Amendment to K•Swiss Inc. 401(k) and Profit Sharing Plan dated May 23, 2005 (incorporated by reference to exhibit 10.12 to the Registrant’s Form 10-Q for the quarter ended June 30, 2005) | |
| 10.16 | Amendment to K•Swiss Inc. 401(k) and Profit Sharing Plan dated June 1, 2005 (incorporated by reference to exhibit 10.13 to the Registrant’s Form 10-Q for the quarter ended June 30, 2005) | |
| 10.17 | Amendment to K•Swiss Inc. 401(k) and Profit Sharing Plan dated January 1, 2007 (incorporated by reference to exhibit 10.14 to the Registrant’s Form 10-Q for the quarter ended March 31, 2007) | |
| 10.18 | Amendment to K•Swiss Inc. 401(k) and Profit Sharing Plan dated December 31, 2007 (incorporated by reference to exhibit 10.15 to the Registrant’s Form 10-K for the year ended December 31, 2007) | |
| 10.19 | Amendment to K•Swiss Inc. 401(k) and Profit Sharing Plan dated August 1, 2009 (incorporated by reference to exhibit 10.19 to the Registrant’s Form 10-Q for the quarter ended September 30, 2009) | |
86
Table of Contents
| 10.20 | Form of Indemnity Agreement entered into by and between K•Swiss Inc. and directors (incorporated by reference to exhibit 10.4 to the Registrant’s Form S-1 Registration Statement No. 33-34369) | |
| 10.21 | Employment Agreement between the Registrant and Steven B. Nichols dated as of December 22, 2010 (incorporated by reference to exhibit 10.1 to the Registrant’s Form 8-K filed with the S.E.C. on December 23, 2010) | |
| 10.22 | Lease Agreement dated March 11, 1997 by and between K•Swiss Inc. and Space Center Mira Loma, Inc. (incorporated by reference to exhibit 10 to the Registrant’s Form 10-Q for the quarter ended March 31, 1997) | |
| 10.23 | Amendment No. 2 to Lease Agreement entered into on March 11, 1997 between K•Swiss Inc. and Space Center Mira Loma, Inc. dated July 1, 2008 (incorporated by reference to exhibit 10.19
to the Registrant’s Form 10-Q for the quarter ended June 30, 2008) | |
| 10.24 | Loan Agreement dated June 30, 2010, between the Company and Bank of America, N.A. (incorporated by reference to exhibit 10.1 to the Registrant’s Form 8-K filed with the S.E.C. on July 2, 2010) | |
| 10.25 | K•Swiss Inc. Deferred Compensation Plan, Master Plan Document (incorporated by reference to exhibit 10.1 to the Registrant’s Form 10-Q for the quarter ended March 31, 1998) | |
| 10.26 | K•Swiss Inc. Deferred Compensation Plan, Master Trust Agreement (incorporated by reference to exhibit 10.2 to the Registrant’s Form 10-Q for the quarter ended March 31, 1998) | |
| 10.27 | K•Swiss Inc. Directors’ Deferred Compensation Plan effective December 31, 2007 (incorporated by reference to exhibit 10.24 to the Registrant’s Form 10-K for the year ended December 31, 2007) | |
| 10.28 | Share Purchase and Shareholders’ Rights Agreement, dated as of May 16, 2008 by and among Christophe Mortemousque, Palladium SAS and K•Swiss Inc. (incorporated by reference to exhibit 10.1 to the Registrant’s Form 8-K filed with the S.E.C. on May 22, 2008) | |
| 10.29 | Assignment and Assumption Agreement, dated as of March 28, 2008, by and between Palladium SAS and K•Swiss Inc. (incorporated by reference to exhibit 10.2 to the Registrant’s Form 8-K filed with the S.E.C. on May 22, 2008) | |
| 10.30 | Amendment No. 1 to Share Purchase and Shareholders’ Rights Agreement, dated June 2, 2009 by and among Christophe Mortemousque, Palladium SAS and K•Swiss Inc. (incorporated by reference to exhibit 10.1 to the Registrant’s Form 8-K filed with the S.E.C. on June 4, 2009) | |
| 10.31 | Amendment No. 2 to Share Purchase and Shareholders’ Rights Agreement, dated May 1, 2010 by and among Christophe Mortemousque, Palladium SAS and K•Swiss Inc. (incorporated by reference to exhibit 10.35 to the Registrant’s Form 10-Q for the quarter ended March 31, 2010) | |
| 14.1 | K•Swiss Inc. Code of Ethics for the Chief Executive Officer, Senior Financial Officers and Board of Directors (incorporated by reference to exhibit 14 to the Registrant’s Form 10-K for the year ended December 31, 2003) | |
| 14.2 | K•Swiss Inc. Code of Ethics for Directors, Officers and Employees (incorporated by reference to exhibit 14.2 to the Registrant’s Form 10-Q for the quarter ended March 31, 2004) | |
| 21 | Subsidiaries of K•Swiss Inc. | |
87
Table of Contents
| 23 | Consent of Grant Thornton LLP | |
| 31.1 | Certification of President and Chief Executive Officer Pursuant to Exchange Act Rule 13a-14 | |
| 31.2 | Certification of Chief Financial Officer Pursuant to Exchange Act Rule 13a-14 | |
| 32 | Certification Pursuant to 18 U.S.C. Section 1350, as Adopted Pursuant to Section 906 of the Sarbanes-Oxley Act of 2002 | |
(c) Schedules
| Page | ||||
| Financial Statement Schedules: |
||||
| 90 | ||||
| All supplemental schedules other than as set forth above are omitted as inapplicable or because the required information is included in the Consolidated Financial Statements or the Notes to the Consolidated Financial Statements. |
||||
88
Table of Contents
Pursuant to the requirements of Section 13 or 15(d) of the Securities Exchange Act of 1934, the Registrant has duly caused this Form 10-K to be signed on its behalf by the undersigned, thereunto duly authorized.
| K•Swiss Inc. | ||
| By |
/s/ GEORGE POWLICK | |
| George Powlick, Vice President of Finance, Chief Administrative Officer, Chief Financial Officer and Secretary | ||
| February 16, 2011 | ||
Pursuant to the requirements of the Securities Exchange Act of 1934, this report has been signed below by the following persons on behalf of the Registrant and in the capacities and on the dates indicated.
| Signature |
Title |
Date | ||||
| /s/ |
STEVEN NICHOLS Steven Nichols |
Chairman of the Board, |
February 16, 2011 | |||
| /s/ |
GEORGE POWLICK George Powlick |
Vice President of Finance, Chief Administrative Officer, Chief Financial Officer, Principal Accounting Officer, Secretary and Director |
February 16, 2011 | |||
| /s/ |
LAWRENCE FELDMAN |
Director |
February 16, 2011 | |||
| Lawrence Feldman | ||||||
| /s/ |
STEPHEN FINE |
Director |
February 16, 2011 | |||
| Stephen Fine | ||||||
| /s/ |
MARK LOUIE |
Director |
February 16, 2011 | |||
| Mark Louie | ||||||
89
Table of Contents
VALUATION AND QUALIFYING ACCOUNTS
(Amounts in thousands)
| Column A |
Column B | Column C | Column D | Column E | ||||||||||||||||||||
| Additions | ||||||||||||||||||||||||
| Description |
(1) Balance at Beginning of Period |
(1) Charged to Costs and Expenses |
(2) Charged to Other Accounts |
(1) Write-offs and Deductions, Net |
(1) Balance at End of Period |
|||||||||||||||||||
| Allowance for bad debts |
(2010 | ) | $ | 2,162 | $ | 691 | $ | — | $ | (1,073 | ) | $ | 1,780 | |||||||||||
| (2009 | ) | 2,897 | (257 | ) | — | (478 | ) | 2,162 | ||||||||||||||||
| (2008 | ) | 2,941 | (158 | ) | 378 | (264 | ) | 2,897 | ||||||||||||||||
| Allowance for inventories |
(2010 | ) | $ | 4,859 | $ | 3,028 | $ | — | $ | (3,140 | ) | $ | 4,747 | |||||||||||
| (2009 | ) | 12,718 | 6,949 | — | (14,808 | ) | 4,859 | |||||||||||||||||
| (2008 | ) | 7,187 | 10,991 | 77 | (5,537 | ) | 12,718 | |||||||||||||||||
| Allowance for sales returns |
(2010 | ) | $ | 1,198 | $ | 6,760 | $ | — | $ | (6,570 | ) | $ | 1,388 | |||||||||||
| (2009 | ) | 1,305 | 4,121 | — | (4,228 | ) | 1,198 | |||||||||||||||||
| (2008 | ) | 3,084 | 8,164 | 53 | (9,996 | ) | 1,305 | |||||||||||||||||
| (1) | Includes activity related to the Royal Elastics brand for 2008 and 2009. |
| (2) | Acquired from the purchase of Palladium. |
90
Table of Contents
EXHIBIT INDEX
| Exhibit |
||
| 21 | Subsidiaries of K•Swiss Inc. | |
| 23 | Consent of Grant Thornton LLP | |
| 31.1 | Certification of President and Chief Executive Officer Pursuant to Exchange Act Rule 13a-14 | |
| 31.2 | Certification of Chief Financial Officer Pursuant to Exchange Act Rule 13a-14 | |
| 32 | Certification Pursuant to 18 U.S.C. Section 1350, as Adopted Pursuant to Section 906 of the Sarbanes-Oxley Act of 2002 | |