Attached files
| file | filename |
|---|---|
| 8-K - FORM 8-K - BANCORP RHODE ISLAND INC | form8k21711.htm |
1
Sterne Agee
Financial Institutions Investor Conference
February 17, 2011

2
Certain statements contained in this presentation are “Forward Looking
Statements” within the meaning of the Private Securities Litigation
Reform Act of 1995. Forward Looking Statements may be identified by
the use of forward looking terminology such as “may,” “believes,”
“intends,” “expects,” and “anticipates” or similar terms or variations of
these terms. Actual results could differ materially from those set forth in
Forward Looking Statements due to a variety of factors including, without
limitation, competition, interest rate risk, credit risk, political and economic
conditions and regulatory issues. Further information on these risk
factors is included in our Annual Report on Form 10-K and other filings
with the Securities and Exchange Commission.
3
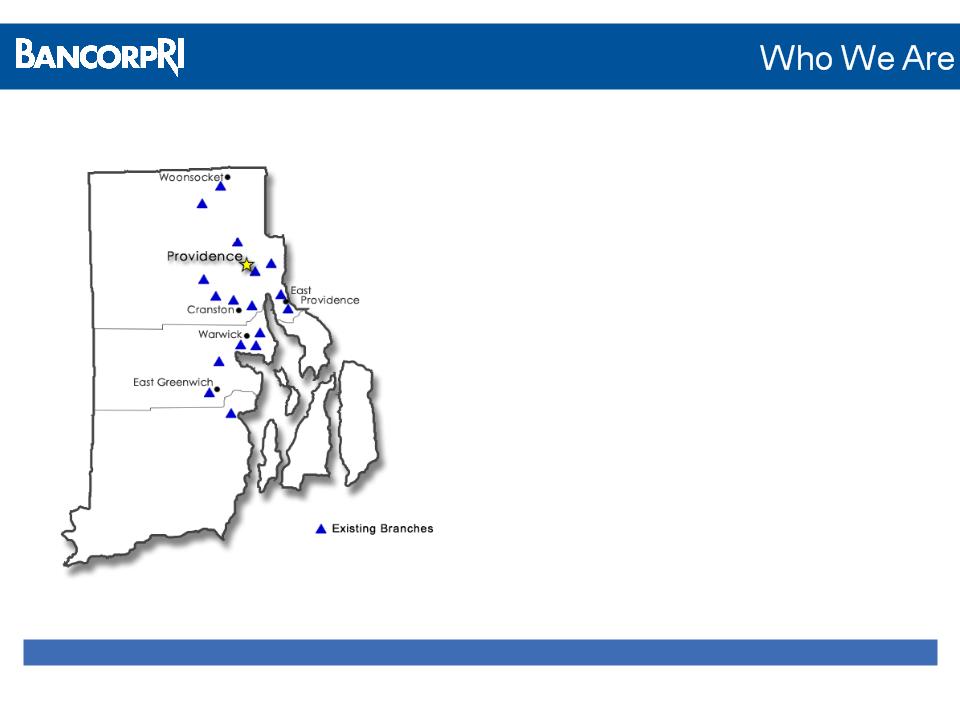
• Cities/Towns
Profile:
§ Formed in March 1996
§ $1.6 billion commercial bank
§ NASDAQ listed: BARI
§ 17 branches in Greater Providence area
§ Approximately 75% of RI’s population, jobs
and businesses are located in Greater
Providence area
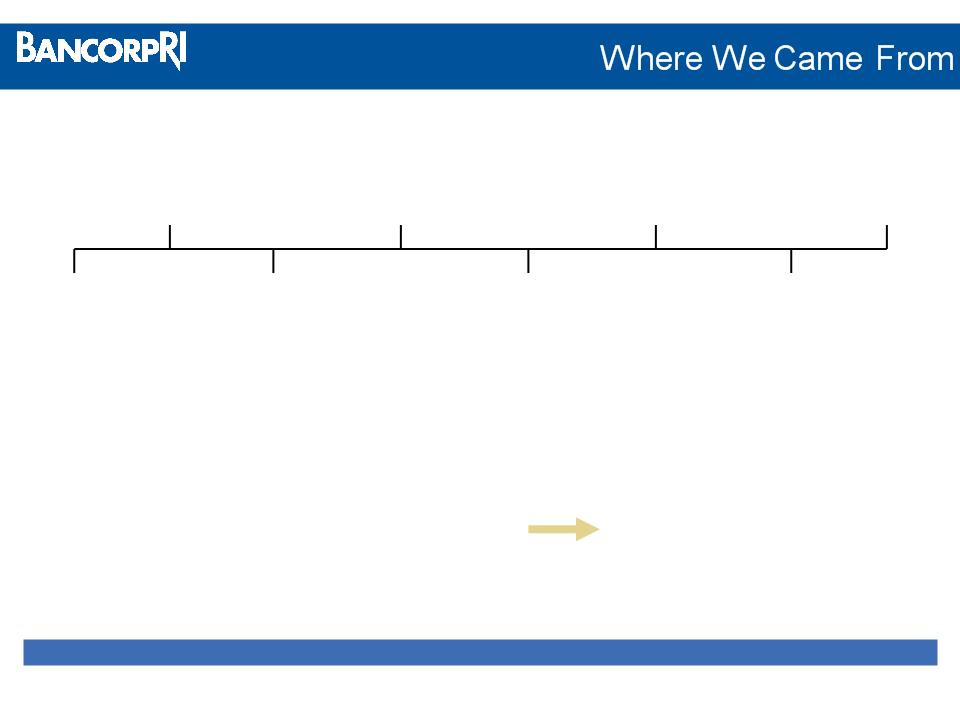
4
Oct
1995
Sep
2010
2010
Agreement to
purchase RI
branches of
Shawmut
purchase RI
branches of
Shawmut
BankRI
opened
opened
Mar
1996
1996
Jun
2009
2009
May
2005
2005
Nov
2002
2002
Mar
1998
1998
Sep
2009
2009
Secondary
offering;
NASDAQ listed:
offering;
NASDAQ listed:
BARI
Reached $1.0B
in assets
in assets
Acquired
Macrolease
Listed on Russell
3000 Index
3000 Index
#1 SBA lender
in RI
#1 SBA lender
in RI
Total Assets
Total Deposits
# of Branches
# of Employees
$465 million
$421 million
12
150
$1.6 billion
$1.1 billion
17
274
Mar 1996
Dec 2010
Profitable in every year since inception
5
§ Strong financial performance in a difficult environment
§ Credit quality consistently sound
§ Capital position well above regulatory thresholds
§ Experienced management team
§ Attentive to shareholder returns
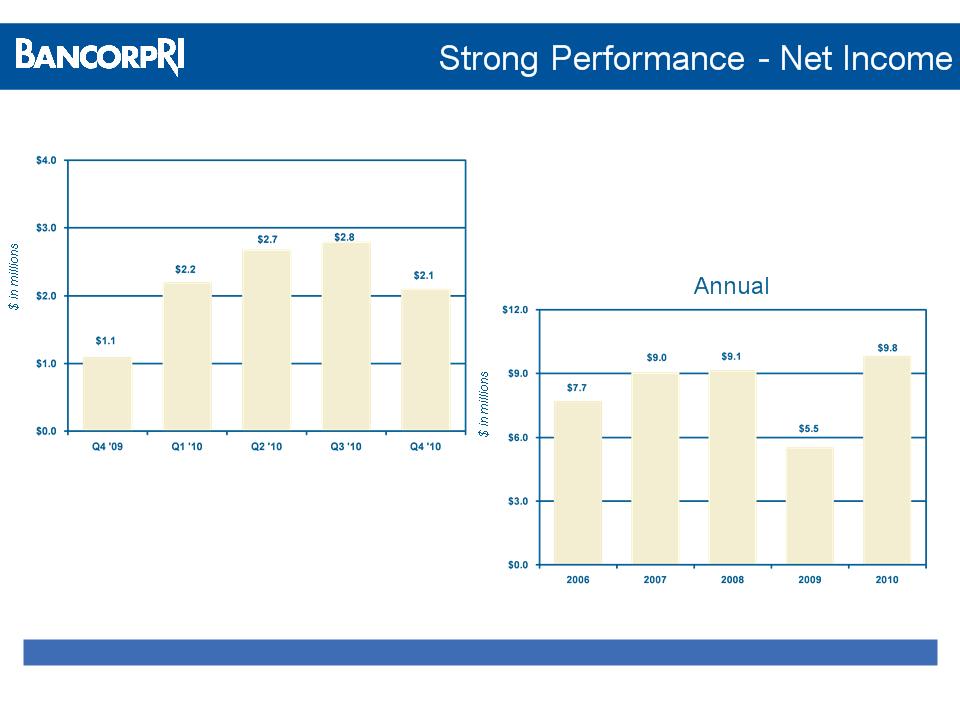
6
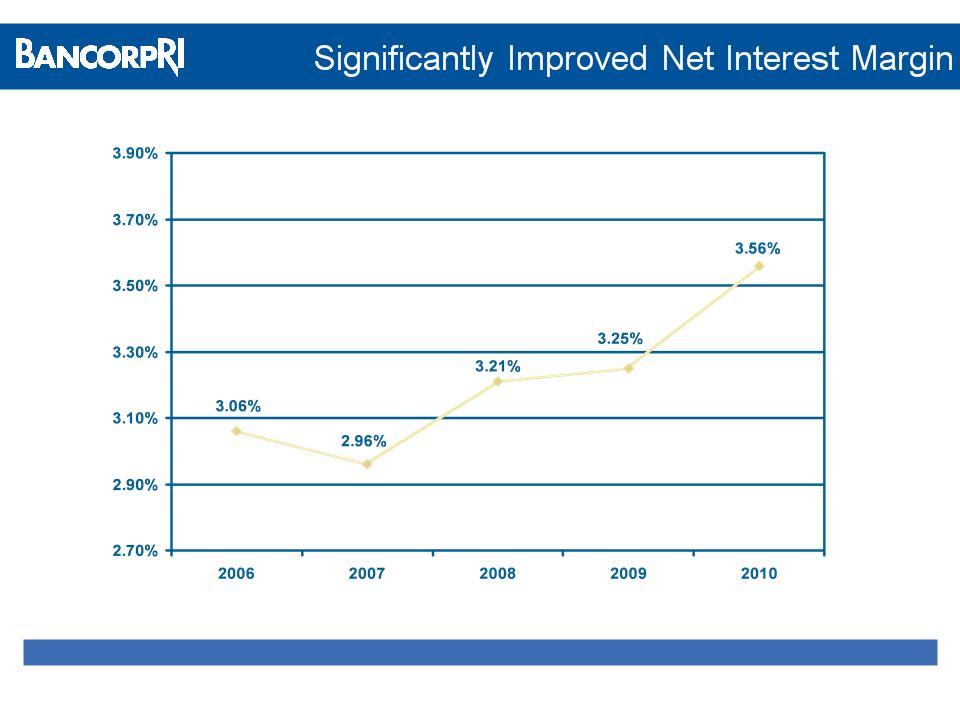
Quarterly
7
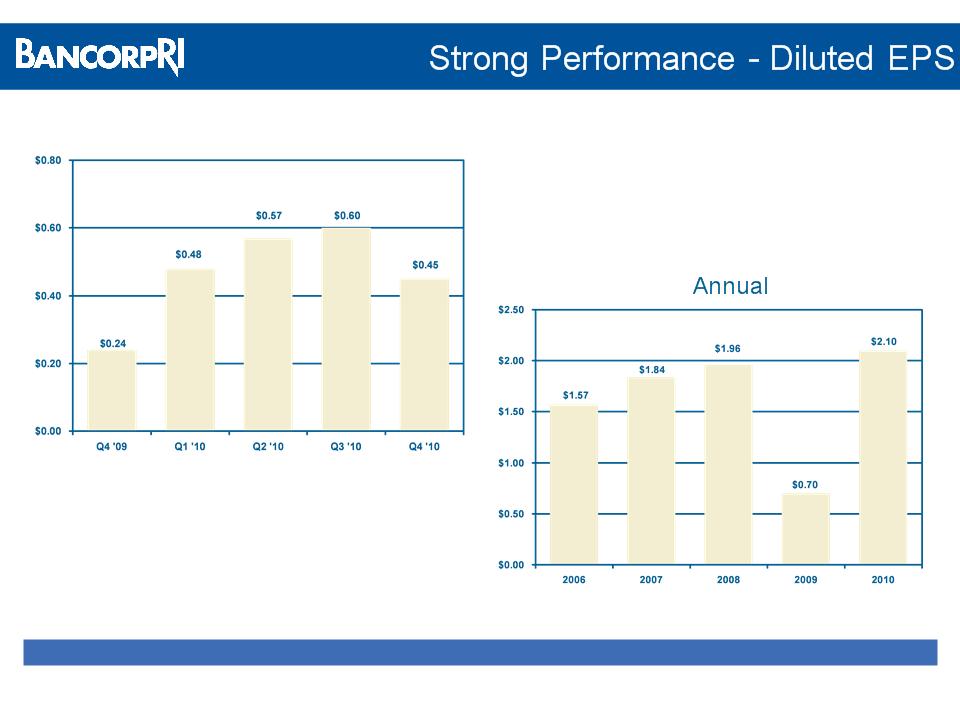
Quarterly
* Diluted EPS after preferred stock dividends and discount accretion related to TARP
*
*
8
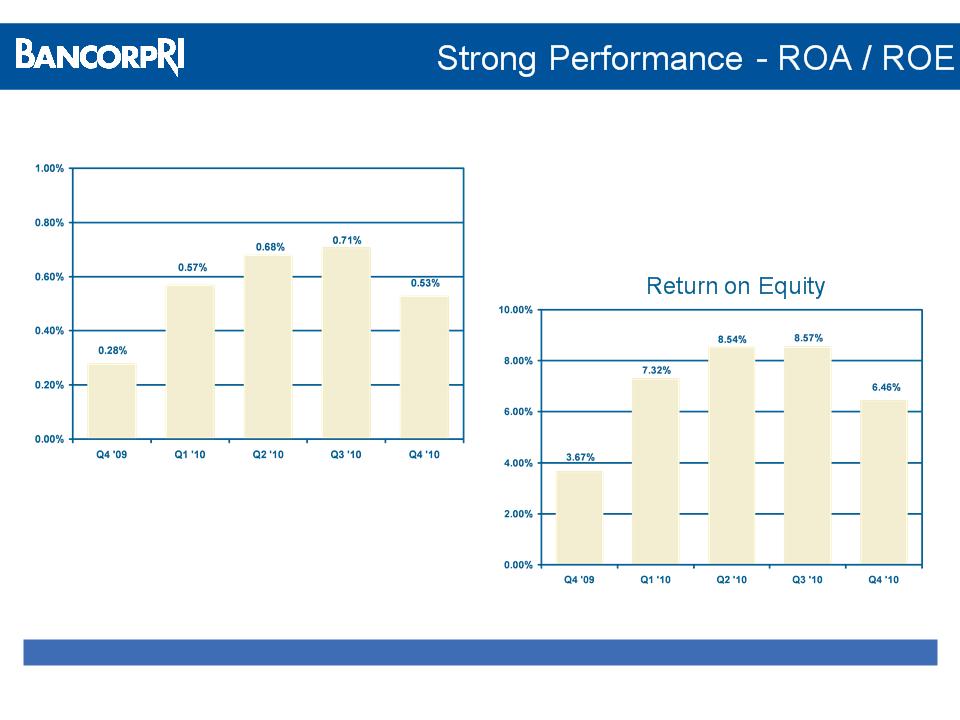
Return on Assets
9
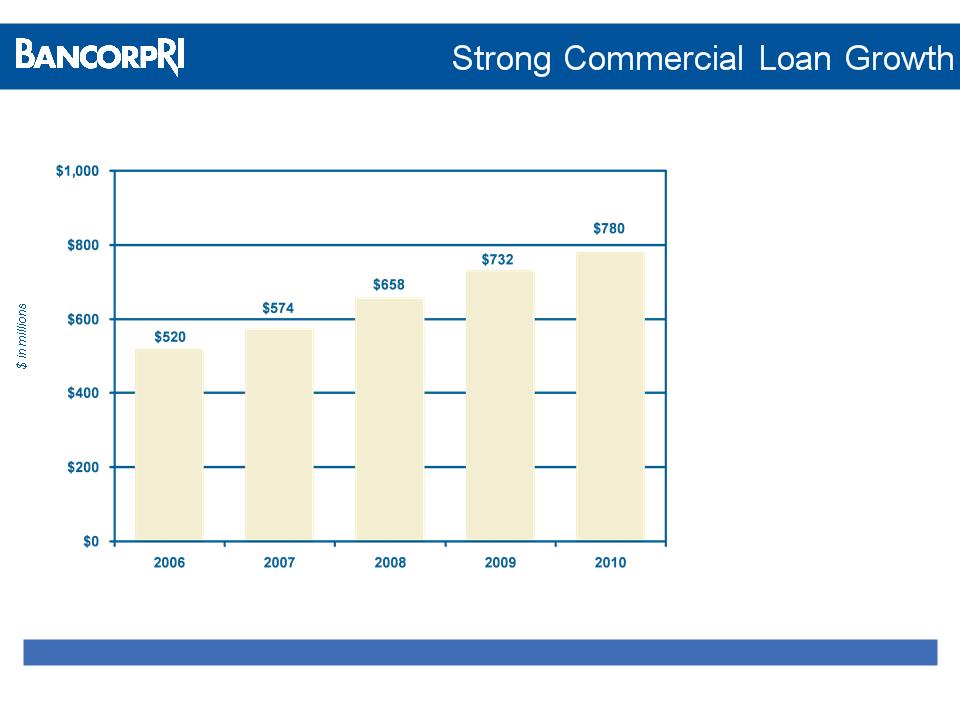
§ Commercial loan growth
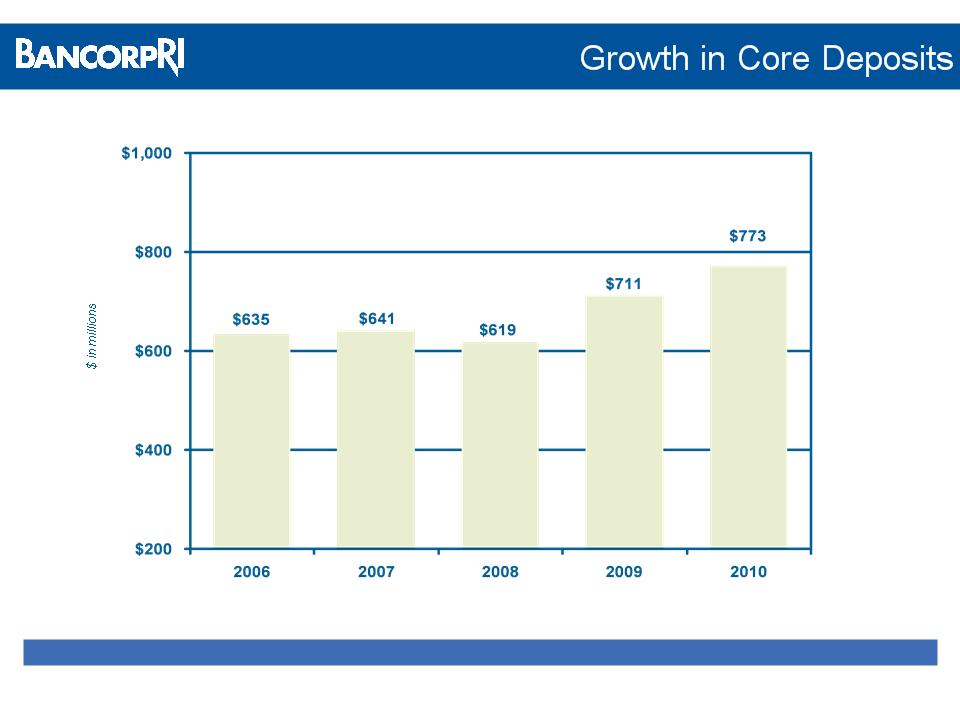
§ Low-cost core deposit growth
§ Treasury management sophistication
§ Modest credit costs
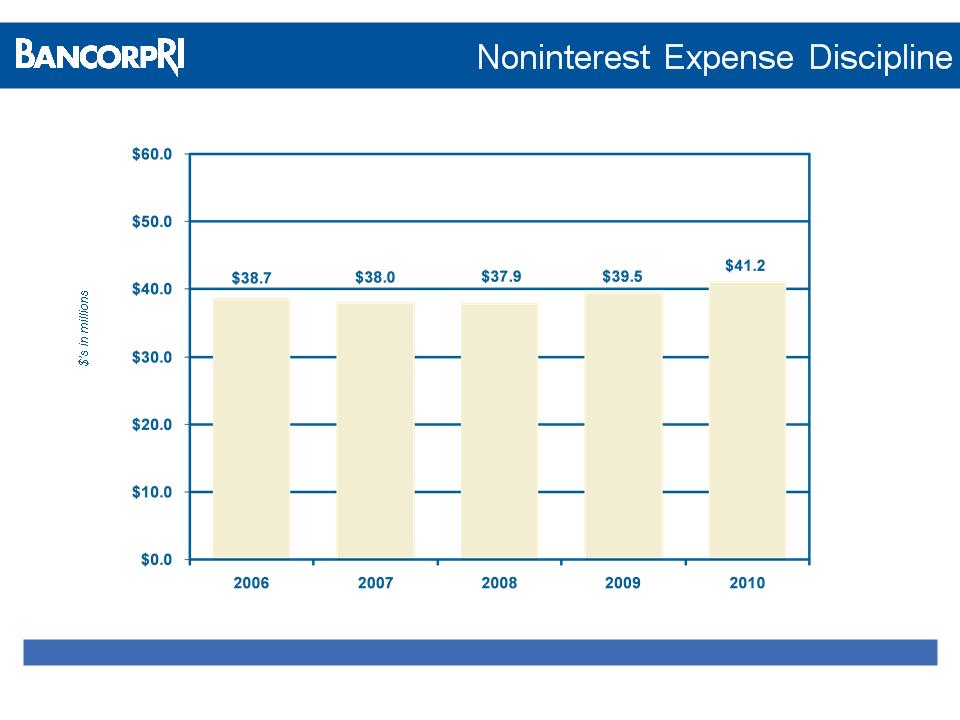
§ Disciplined expense management
10
• Double digit growth from
2006 - 2009
2006 - 2009
• Drives low-cost core
deposit growth
deposit growth
• Grew from 41% of total
loans to 68% over past
10 years
loans to 68% over past
10 years
11
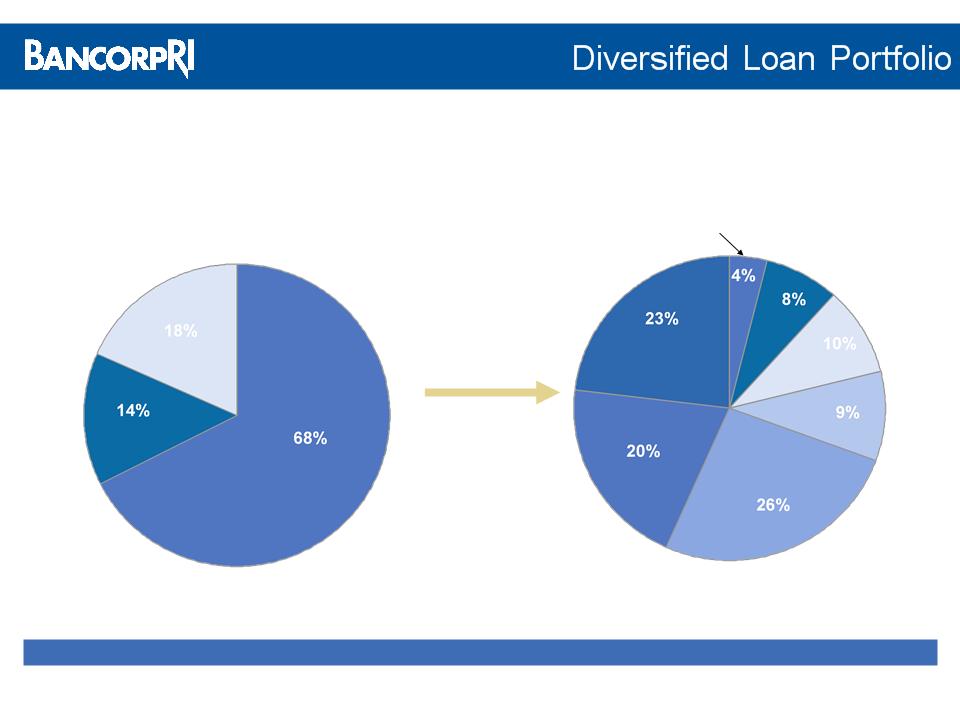
Commercial
Loans
Residential
Mortgages
Consumer/
Other
Total loan portfolio - $1.16 billion as of 12/31/10
Small
Business
Business
Commercial
and
Industrial
Construction
Lease and
Other
Other
CRE
(owner
occupied)
Multi-Family
CRE
(non-owner
occupied)
occupied)
Breakdown of Commercial
Loan Portfolio
Loan Portfolio
Total Loan Portfolio
12
Core deposits are defined as DDA, NOW, money market and savings accounts
62% 63% 59% 65% 69%
% of
total
deposits
total
deposits
13
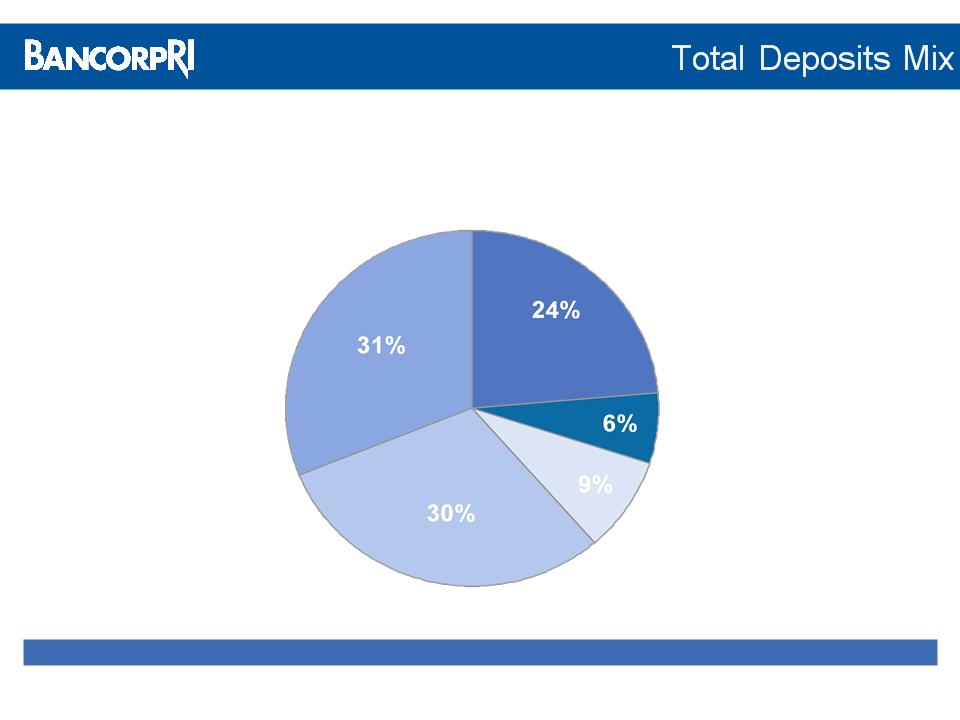
Money
Market
Certificate of
Deposits
Demand
Deposits
Core Deposits - 69% of total deposits as of 12/31/10
NOW
Savings
Total deposits - $1.12 billion as of 12/31/10
14
15
§ Conservative credit culture
§ Significant credit and credit management expertise
§ Extensive portfolio monitoring processes
§ Relatively low level of net charge-offs despite:
− Double-digit commercial loan growth
− Recessionary environment
16
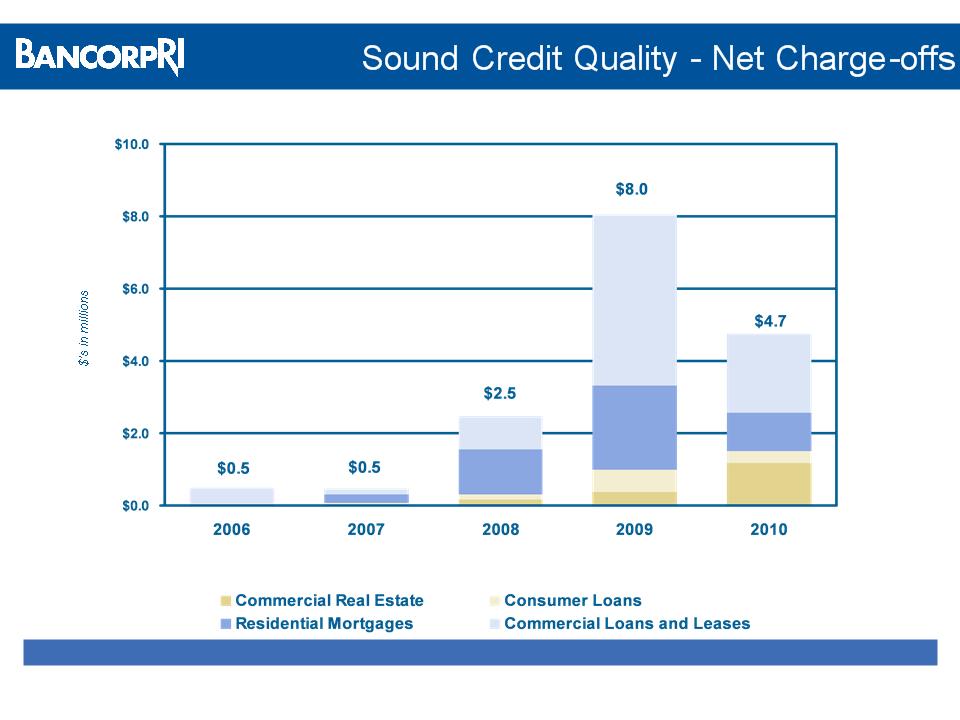
0.05% 0.05% 0.24% 0.73% 0.42%
% of avg. loans
and leases
and leases
17
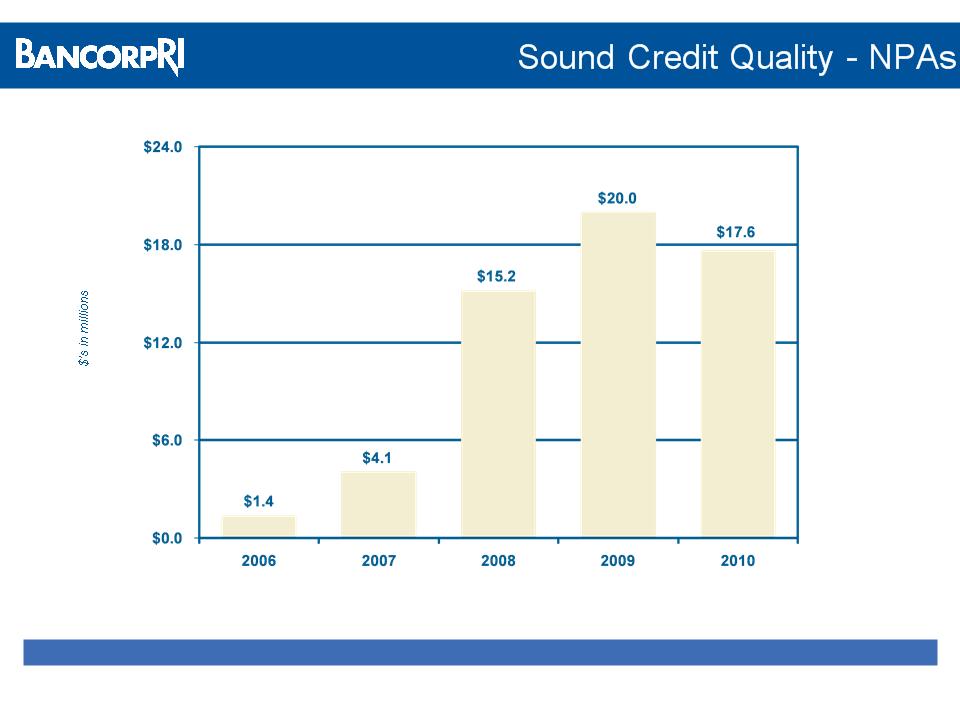
0.10% 0.28% 1.00% 1.26% 1.10%
% of
total
assets
total
assets
18
19
Capital ratios well above regulatory thresholds
As of
Tier 1 Capital Ratio
8.10%
Total Risk-Based Capital Ratio
12.53%
Tangible Common Equity Ratio
7.31%
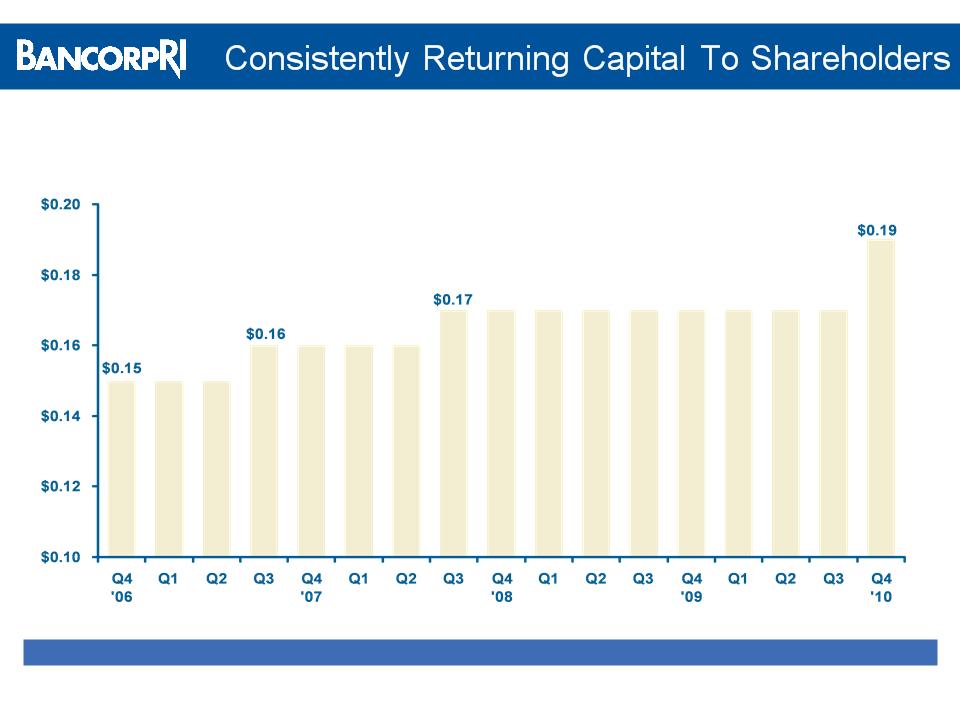
20
Dividend Track Record
12% increase approved in Q4 ‘10
21
§ Commercial banking is a sustainable, attractive market niche for
community banks
community banks
− Ability to differentiate from major competitors
• Responsive / accessible
• Local decision-making / policy setting
• High touch retail network with solid branch footprint
− Dense, urban market well-suited for business generation
− Generates higher yielding assets, lower cost deposits and fee
income
income
− Forms leverageable platform
22
§ Attractive franchise
− One of the few sizeable independent franchises in New England
§ Solid credit quality and capital position
§ Proven track record for delivering results
§ Strong management team
§ Positioned to grow franchise
§ Attentive to shareholder returns
§ Market Valuations (as of 1/31/11)
− 121% of tangible book value
− 14.3x of earnings (TTM)
23
NASDAQ: BARI