Attached files
| file | filename |
|---|---|
| 8-K - NORANDA ALUMINUM HOLDING CORPORATION 8-K - Noranda Aluminum Holding CORP | a6613813.htm |
| EX-99.1 - EXHIBIT 99.1 - Noranda Aluminum Holding CORP | a6613813ex99-1.htm |
Exhibit 99.2
TM FOURTH QUARTER RESULTS CONFERENCE CALL Noranda Aluminum Holding Corp February 16, 2011 10:00 AM Eastern / 9:00 AM Central
The following information contains, or may be deemed to contain, "forward-looking statements" (as defined in the U.S. Private Securities Litigation Reform Act of 1995). By their nature, forward-looking statements involve risks and uncertainties because they relate to events and depend on circumstances that future Forward Looking Statements may or may not occur in the future. The future results of Noranda may vary from the results expressed in, or implied by, the following forward looking statements, possibly to a material degree. For a discussion of some of the important factors that could cause Noranda’s results to differ from those expressed in, or implied by, the following forward-looking statements, please refer to Noranda’s filings with the SEC, including the annual report on Form 10-K. NORANDA ALUMINUM HOLDING CORPORATION
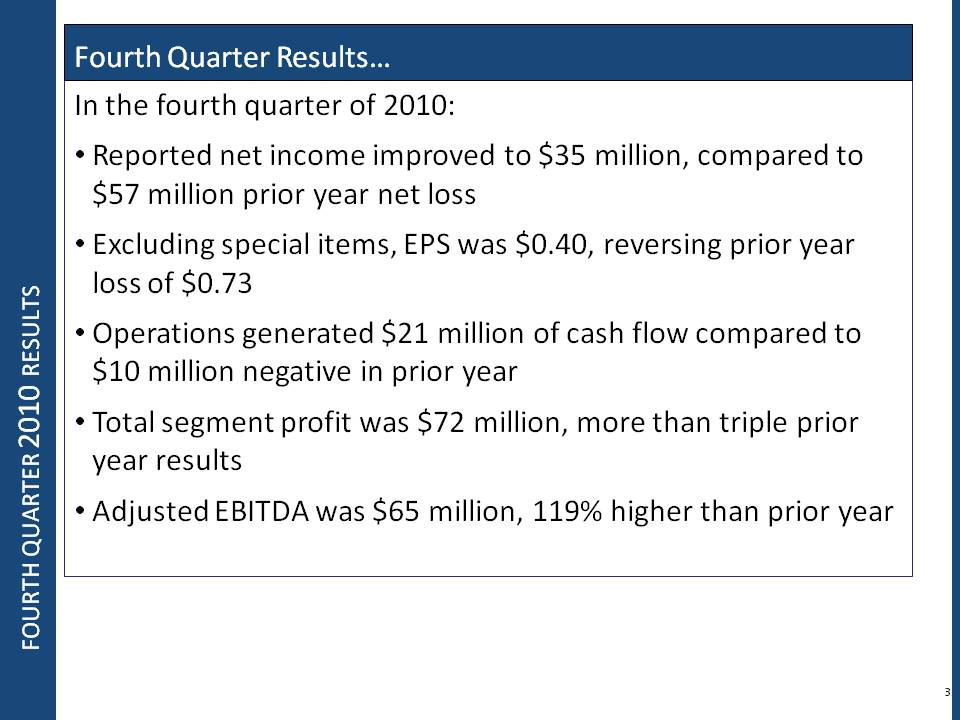
In the fourth quarter of 2010: Reported net income improved to $35 million, compared to $57 million prior year net loss Excluding special items, EPS was $0.40, reversing prior year loss of $0.73 Operations generated $21 million of cash flow compared to $ 10 million negative in prior year Fourth Quarter Results FOURTH QUARTER 2010 RESULTS 3 Total segment profit was $72 million, more than triple prior year results Adjusted EBITDA was $65 million, 119% higher than prior year
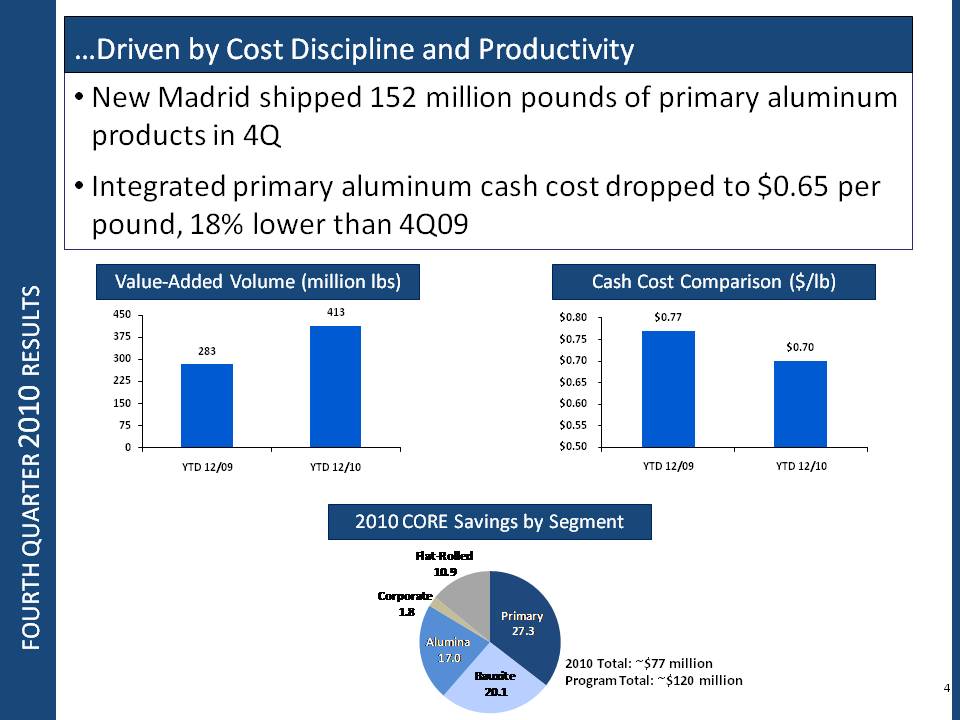
FOURTH QUARTER 2010 RESULTS …Driven by Cost Discipline and Productivity New Madrid shipped 152 million pounds of primary aluminum products in 4Q Integrated primary aluminum cash cost dropped to $0.65 per pound, 18% lower than 4Q09 Value-Added Volume (million lbs) 0 75 150 225 300 375 450 YTD 12/09 YTD 12/10 283 413 Cash Cost Comparison ($/lb) $0.50 $0.55 $0.60 YTD 12/09 YTD 12/10 $0.77 $0.70 2010 CORE Savings by Segment Flat-Rolled 10.9 Corporate 1.8 Alumina 17.0 Bauxite 20.1 Primary 27.3 2010 Total: ~$77 million Program Total: ~$120 million
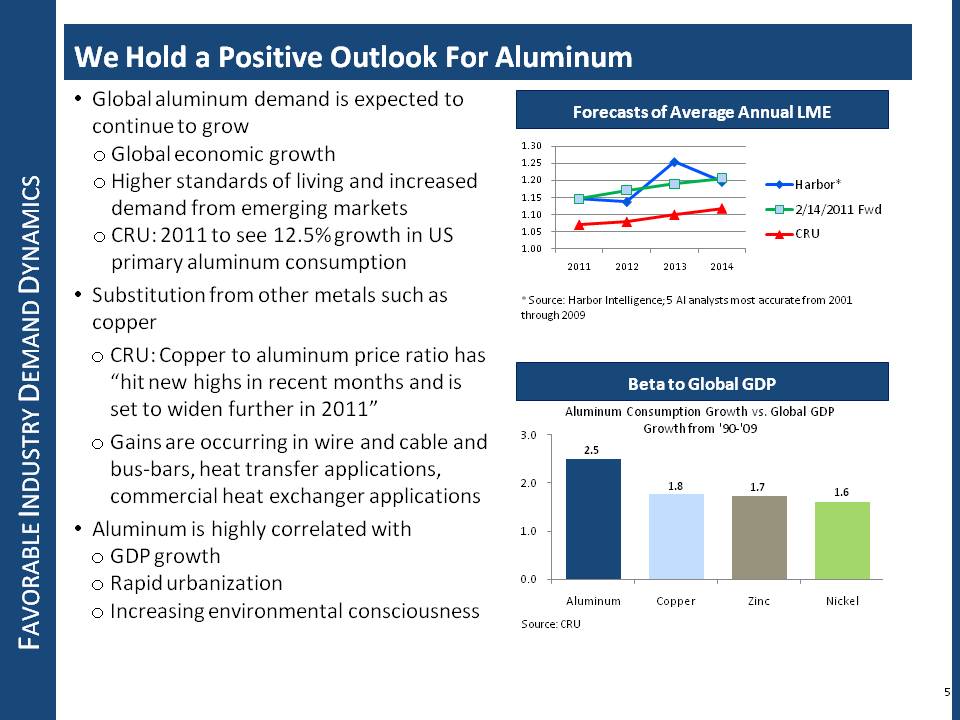
FAVORABLE INDUSTRY DEMAND DYNAMICS We Hold a Positive Outlook For Aluminum Global aluminum demand is expected to continue to grow o Global economic growth o Higher standards of living and increased demand from emerging markets o CRU: 2011 to see 12.5% growth in US primary aluminum consumption o Substitution from other metals such as copper o CRU: Copper to aluminum price ratio has “hit new highs in recent months and is set to widen further in 2011” o Gains are occurring in wire and cable and bus-bars, heat transfer applications, commercial heat exchanger applications o Aluminum is highly correlated with o GDP growth o Rapid urbanization o Increasing environmental consciousness Forecasts of Average Annual LME 1.00 1.05 1.10 1.15 1.20 1.25 1.30 2011 2012 2013 2014 Harbor* 2/14/2011 Fwd CRU * Source: Harbor Intelligence; 5 Al analysts most accurate from 2001 through 2009 Beta to Global GDP Source: CRU
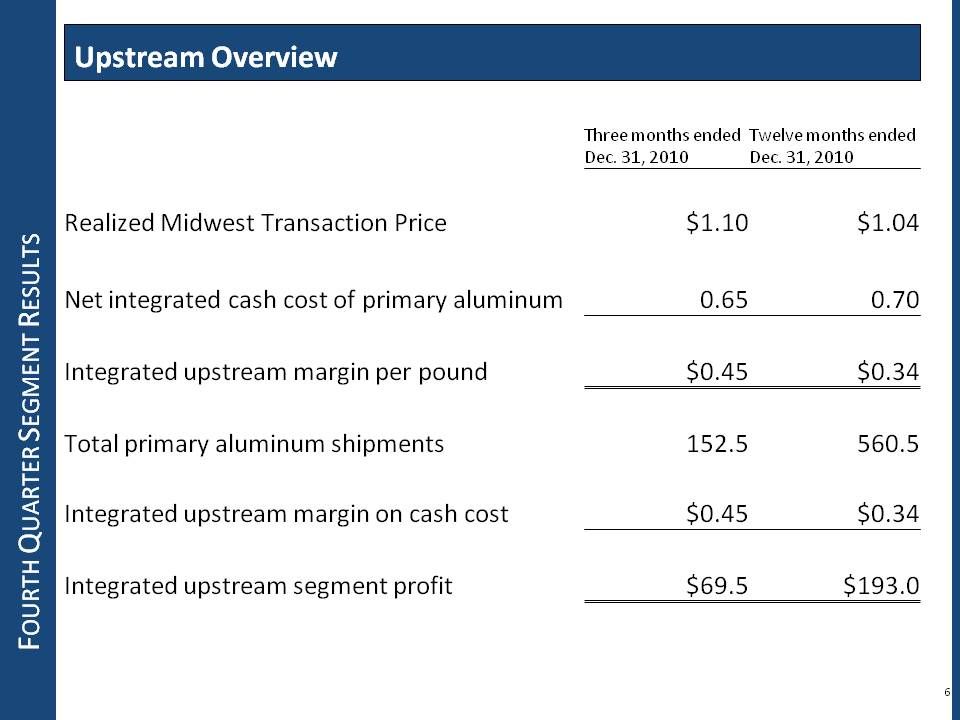
FOURTH QUARTER SEGMENT RESULTS Upstream Overview Three months ended Dec. 31, 2010 Twelve months ended Dec. 31, 2010 Realized Midwest Transaction Price $1.10 $1.04 Net integrated cash cost of primary aluminum 0.65 0.70 Integrated upstream margin per pound $0.45 $0.34 Total primary aluminum shipments 152.5 560.5 Integrated upstream margin on cash cost $0.45 $0.34 Integrated upstream segment profit $69.5 $193.0
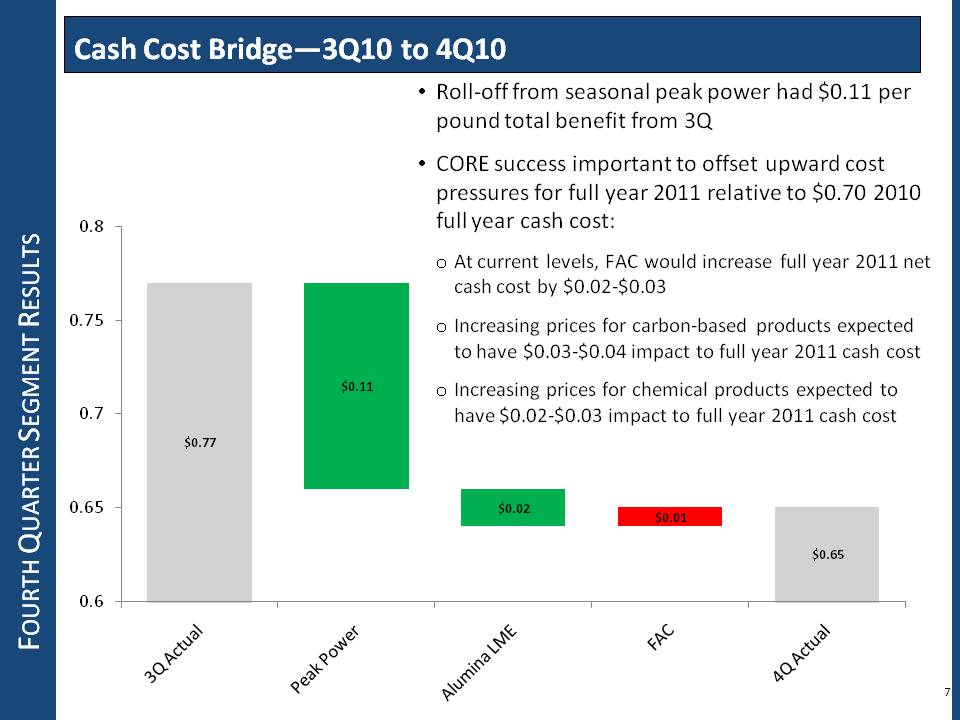
FOURTH QUARTER SEGMENT RESULTS Cash Cost Bridge—3Q10 to 4Q10 o Roll-off from seasonal peak power had $0.11 per pound total benefit from 3Q o CORE success important to offset upward cost pressures for full year 2011 relative to $0.70 2010 full year cash cost: o At current levels, FAC would increase full year 2011 net cash cost by $0.02-$0.03 o Increasing prices for carbon-based products expected to have $0.03-$0.04 impact to full year 2011 cash cost o Increasing prices for chemical products expected to have $0.02-$0.03 impact to full year 2011 cash cost 0.6 0.65 0.7 0.75 0.8 $0.77 $0.11 $0.02 $0.01 $0.65 3Q Actual Peak Power Alumina LME FAC 4Q Actual
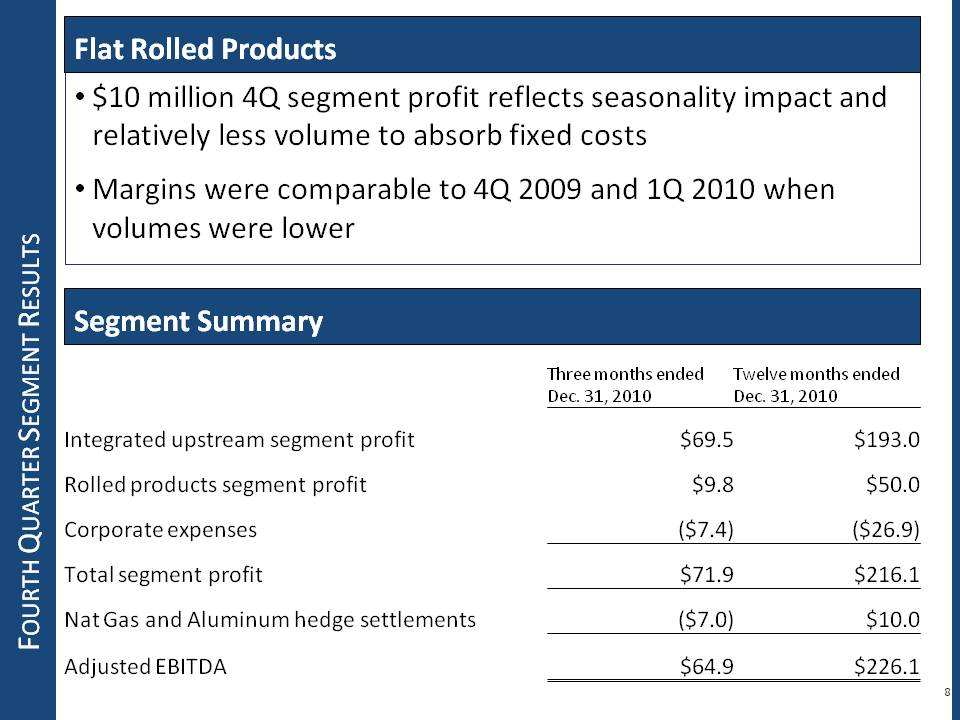
FOURTH QUARTER SEGMEN NT RESULTS Flat Rolled Products o $10 million 4Q segment profit reflects seasonality impact and relatively less volume to absorb fixed costs o Margins were comparable to 4Q 2009 and 1Q 2010 when volumes were lower Segment Summary Three months ended Dec. 31, 2010 Twelve months ended Dec. 31, 2010 Integrated upstream segment profit $69.5 $193.0 Rolled products segment profit $9.8 $50.0 Corporate expenses ($7.4) ($26.9) Total segment profit $71.9 $216.1 Nat Gas and Aluminum hedge settlements ($7.0) $10.0 Adjusted EBITDA $64.9 $226.1
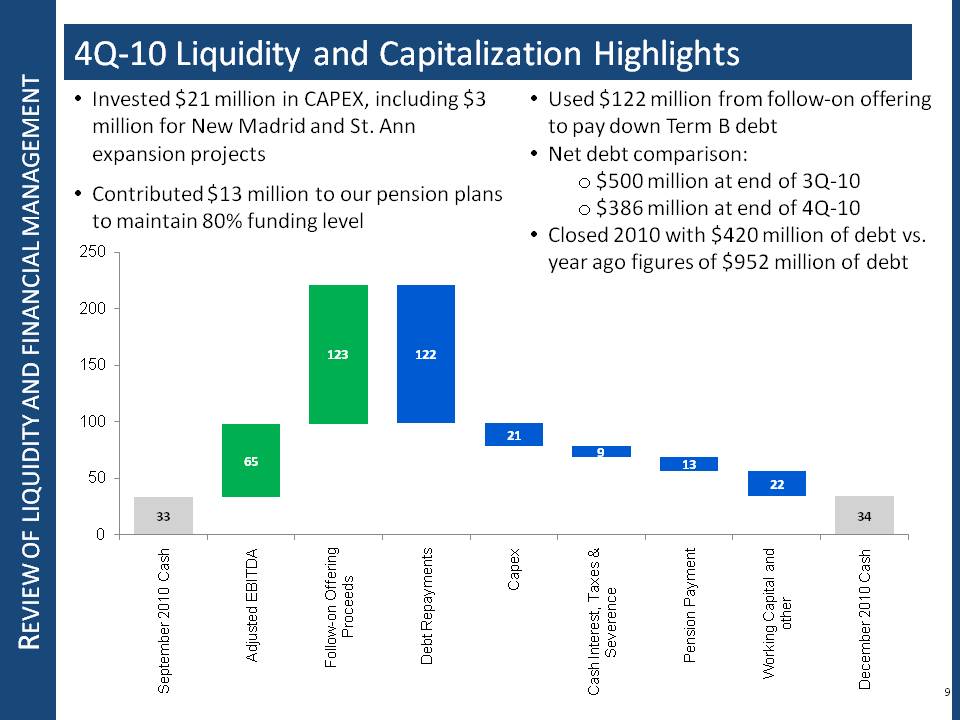
REVIEW OF LIQUIDITY AND FINANCIAL MANAGEMENT 4Q-10 Liquidity and Capitalization Highlights o Invested $21 million in CAPEX, including $3 million for New Madrid and St. Ann expansion projects o Contributed $13 million to our pension plans to maintain 80% funding level o Used $122 million from follow-on offering to pay down Term B debt o Net debt comparison: o $500 million at end of 3Q-10 o $386 million at end of 4Q-10 Closed 2010 with $420 million of debt vs. year ago figures of $952 million of debt 0 50 100 150 200 250 33 65 123 122 21 9 13 22 34 September 2010 Cash Adjusted EBITDA Follow-on Offering Proceeds Debt Repayments Capex Cash Interest, Taxes & Severence Pension Payment Working Capital and other December 2010 Cash
NORANDA ALUMINUM HOLDING CORPORATION Key Fourth Quarter and Year-to-Date Takeaways o Growth and productivity o Achieved record fourth quarter production in New Madrid o Made progress on New Madrid and St. Ann expansion projects o Continued successful CORE cost discipline—two year total savings to $120 million o Reduced integrated primary cash cost by 9% in 2010 o Cash and financial management o Used proceeds of fourth quarter follow on $122 million of debt o Achieved 56% debt reduction in 2010 o Environmental health and safety o Fourth quarter represented best safety EH&S results of 2010 o Process improvement and employee engagement o Process improvement supported ability to meet demand in 4Q o Aligned management structure around upstream and downstream business units and six sustainable goal categories
DISCLAIMER Non-GAAP Financial Measures This presentation contains non-GAAP financial measures as defined by SEC rules. We think that these measures are helpful to investors in measuring our financial performance and comparing our performance to our peers. However, our non-GAAP financial measures may not be comparable to similarly titled non-GAAP financial measures used by other companies. These non-GAAP financial measures have limitations as an analytical tool and should not be considered in isolation or as a substitute for GAAP financial measures. To the extent we discuss any non-GAAP financial measures on the earnings call, a reconciliation of each measure to the most directly comparable GAAP measure will be available in the earnings release filed as an Exhibit 99 to our Current Report on Form 8-K furnished to the SEC concurrent with the use of this presentation.
APPENDICES Non-GAAP Measure: Adjusted EBITDA As used herein, “Adjusted EBITDA” (which is defined as “EBITDA” in the debt agreements) means net income before income taxes, net interest expense and depreciation and amortization, adjusted to eliminate related party management fees, business optimization expenses and restructuring charges, certain charges resulting from the use of purchase accounting and other specified items of income or expense. Adjusted EBITDA is not a measure of financial performance under U.S. GAAP, and may not be comparable to similarly titled measures used by other companies. Adjusted EBITDA should not be considered in isolation from or as an alternative to net income, income from continuing operations, operating income or any other performance measures derived in accordance with U.S. GAAP. Adjusted EBITDA has limitations as an analytical tool and you should not consider it in isolation or as a substitute for analysis of results as reported under U.S. GAAP. For example, Adjusted EBITDA excludes certain tax payments that may represent a reduction in cash available to us; does not reflect any cash requirements for the assets being depreciated and amortized that may have to be replaced in the future; does not reflect capital cash expenditures, future requirements for capital expenditures or contractual commitments; does not reflect changes in, or cash requirements for, working capital needs; and does not reflect the significant interest expense, or the cash requirements necessary to service interest or principal payments, on indebtedness. Adjusted EBITDA also includes incremental stand-alone costs and adds back non-cash hedging gains and losses, and certain other non-cash charges that are deducted in calculating net income. However, these are expenses that may recur, vary greatly and are difficult to predict. In addition, certain of these expenses can represent the reduction of cash that could be used for other corporate purposes. You should not consider Adjusted EBITDA as an alternative to operating or net income, determined in accordance with U.S. GAAP, as an indicator of operating performance, or as an alternative to cash flows from operating activities, determined in accordance with U.S. GAAP, as an indicator of cash flows or as a measure of liquidity.
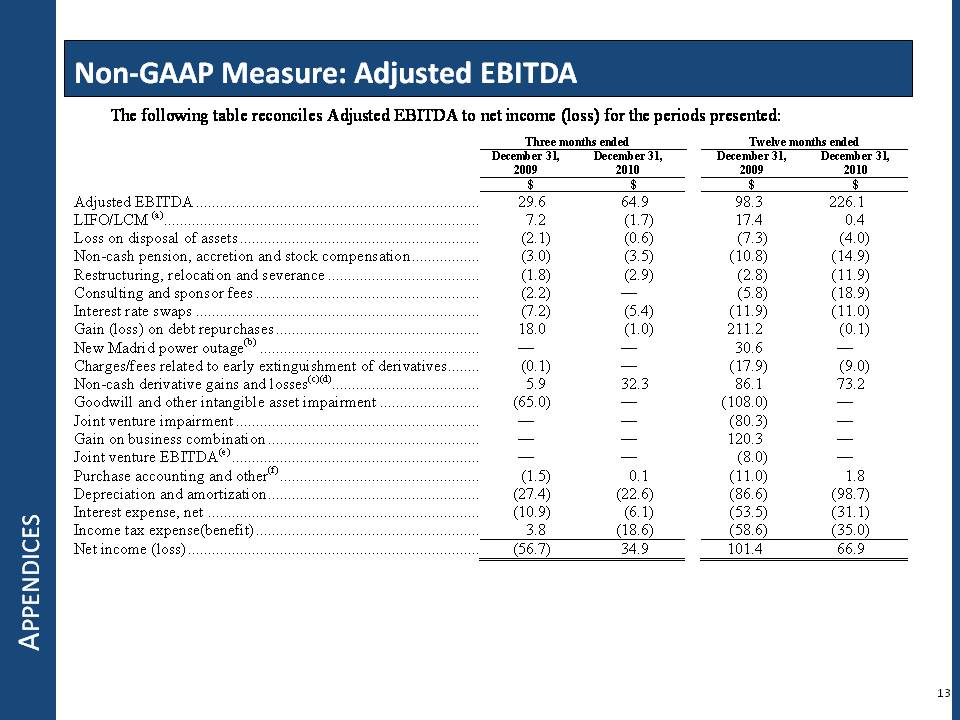
APPENDICES Non-GAAP Measure: Adjusted EBITDA The following table reconciles Adjusted EBITDA to net income (loss) for the periods presented: Three months ended Twelve months ended December 31, 2009 December 31, 2010 December 31, 2009 December 31, 2010 $ $ $ $ Adjusted EBITDA 29.6 64.9 98.3 226.1 LIFO/LCM (a) 7.2 (1.7) 17.4 0.4 Loss on disposal of assets (2.1) (0.6) (7.3) (4.0) Non-cash pension, accretion and stock compensation (3.0) (3.5) (10.8) (14.9) Restructuring, relocation and severance (1.8) (2.9) (2.8) (11.9) Consulting and sponsor fees (2.2) — (5.8) (18.9) Interest rate swaps (7.2) (5.4) (11.9) (11.0) Gain (loss) on debt repurchases 18.0 (1.0) 211.2 (0.1) New Madrid power outage(b)— — 30.6 — Charges/fees related to early extinguishment of derivatives 0.1) — 17.9) 9.0) Non-cash derivative gains and losses(c)(d) 5.9 32.3 86.1 73.2 Goodwill and other intangible asset impairment (65.0) — (108.0) — Joint venture impairment— — (80.3) — Gain on business combination— — 120.3 — Joint venture EBITDA(e)— — (8.0) — Purchase accounting and other(f) (1.5) 0.1 (11.0) 1.8 Depreciation and amortization (27.4) (22.6) (86.6) (98.7) Interest expense, net (10.9) (6.1) (53.5) (31.1) Income tax expense(benefit) 3.8 (18.6) (58.6) (35.0) Net income (loss) (56.7) 34.9 101.4 66.9
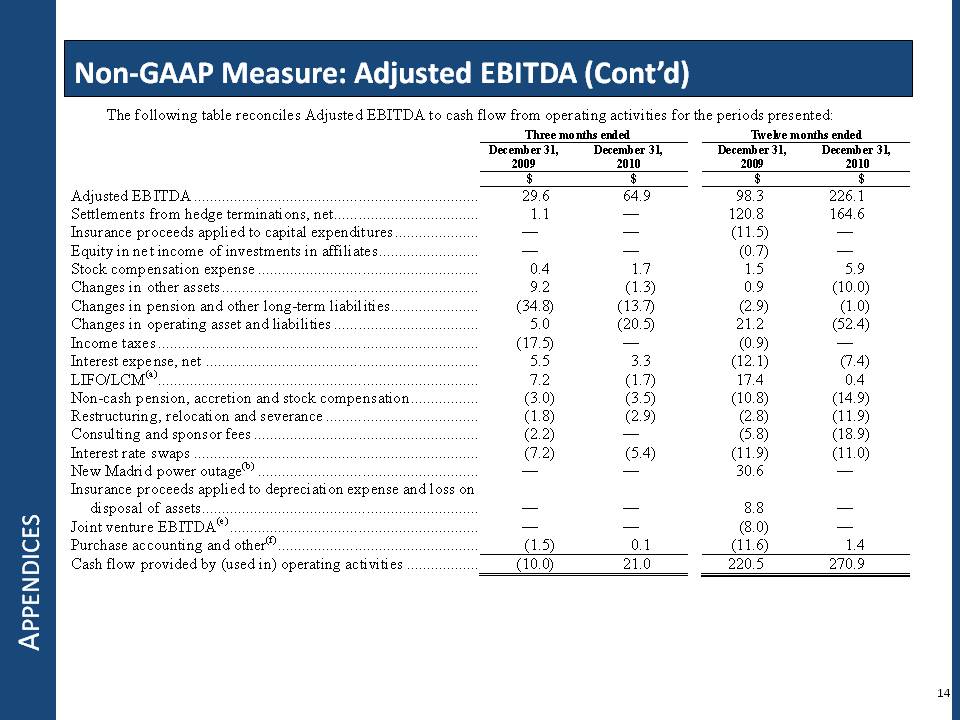
APPENDICES Non-GAAP Measure: Adjusted EBITDA (Cont’d) The following table reconciles Adjusted EBITDA to cash flow from operating activities for the periods presented: Three months ended Twelve months ended December 31, 2009 December 31, 2010 December 31, 2009 December 31, 2010 $ $ $ $ Adjusted EBITDA 29.6 64.9 98.3 226.1 Settlements from hedge terminations, net 1.1 — 120.8 164.6 Insurance proceeds applied to capital expenditures — — (11.5) — Equity in net income of investments in affiliates— — (0.7) — Stock compensation expense 0.4 1.7 1.5 5.9 Changes in other assets 9.2 (1.3) 0.9 (10.0) Changes in pension and other long-term liabilities (34.8) (13.7) (2.9) (1.0) Changes in operating asset and liabilities 5.0 (20.5) 21.2 (52.4) Income taxes (17.5) — (0.9) — Interest expense net 5 5 3 3 (12 1) (7 4) LIFO/LCM(a) 7.2 (1.7) 17.4 0.4 Non-cash pension, accretion and stock compensation (3.0) (3.5) (10.8) (14.9) Restructuring, relocation and severance (1.8) (2.9) (2.8) (11.9) Consulting and sponsor fees (2.2) — (5.8) (18.9) Interest rate swaps (7.2) (5.4) (11.9) (11.0) New Madrid power outage(b)— — 30.6 — Insurance proceeds applied to depreciation expense and loss on disposal of assets— — 8.8 — Joint venture EBITDA(e)— — (8.0) — Purchase accounting and other(f) (1.5) 0.1 (11.6) 1.4 Cash flow provided by (used in) operating activities (10.0) 21.0 220.5 270.9
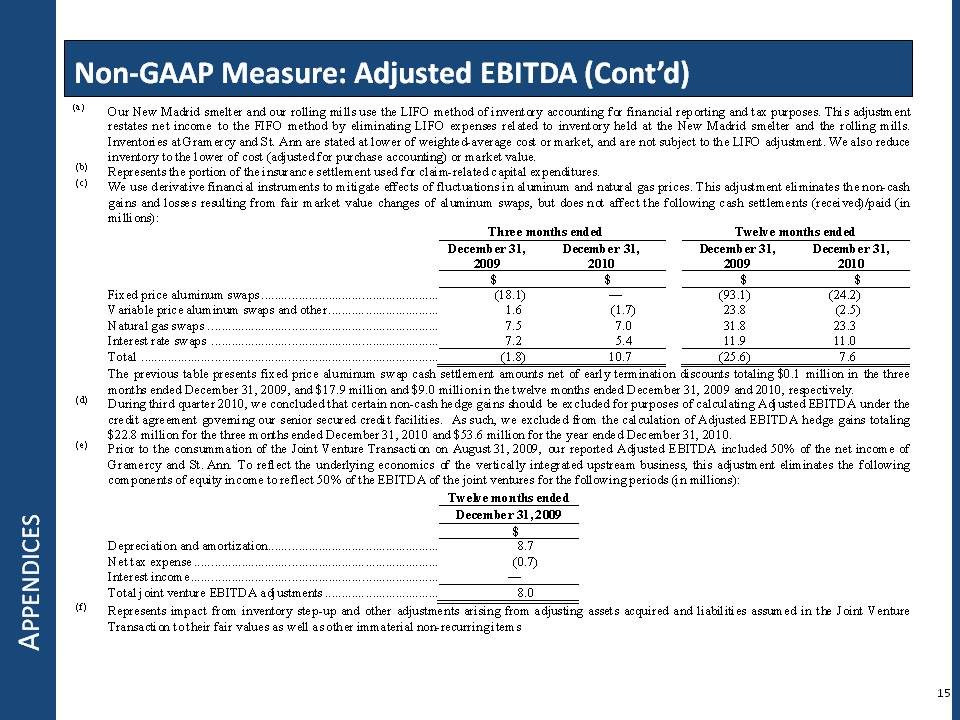
APPENDICES Non-GAAP Measure: Adjusted EBITDA (Cont’d) (a) Our New Madrid smelter and our rolling mills use the LIFO method of inventory accounting for financial reporting and tax purposes. This adjustment restates net income to the FIFO method by eliminating LIFO expenses related to inventory held at the New Madrid smelter and the rolling mills. Inventories at Gramercy and St. Ann are stated at lower of weighted-average cost or market, and are not subject to the LIFO adjustment. We also reduce inventory to the lower of cost (adjusted for purchase accounting) or market value. (b) Represents the portion of the insurance settlement used for claim-related capital expenditures. (c) We use derivative financial instruments to mitigate effects of fluctuations in aluminum and natural gas prices. This adjustment eliminates the non-cash gains and losses resulting from fair market value changes of aluminum swaps, but does not affect the following cash settlements (received)/paid (in millions): Three months ended Twelve months ended December 31, 2009 December 31, 2010 December 31, 2009 December 31, 2010 $ $ $ $ Fixed price aluminum swaps (18.1) — (93.1) (24.2) Variable price aluminum swaps and other 1.6 (1.7) 23.8 (2.5) Natural gas swaps 7.5 7.0 31.8 23.3 Interest rate swaps 7.2 5.4 11.9 11.0 Total (1.8) 10.7 (25.6) 7.6 The previous table presents fixed price aluminum swap cash settlement amounts net of early termination discounts totaling $0.1 million in the three months ended December 31, 2009, and $17.9 million and $9.0 million in the twelve months ended December 31, 2009 and 2010, respectively. (d) During third quarter 2010, we concluded that certain non-cash hedge gains should be excluded for purposes of calculating Adjusted EBITDA under the credit agreement governing our senior secured credit facilities. As such, we excluded from the calculation of Adjusted EBITDA hedge gains totaling $22.8 million for the three months ended December 31, 2010 and $53.6 million for the year ended December 31, 2010. (e) Prior to the consummation of the Joint Venture Transaction on August 31, 2009, our reported Adjusted EBITDA included 50% of the net income of Gramercy and St. Ann. To reflect the underlying economics of the vertically integrated upstream business, this adjustment eliminates the following components of equity income to reflect 50% of the EBITDA of the joint ventures for the following periods (in millions): Twelve months ended December 31, 2009 $ Depreciation and amortization . 8.7 Net tax expense (0.7) Interest income .— Total joint venture EBITDA adjustments 8.0 (f) Represents impact from inventory step-up and other adjustments arising from adjusting assets acquired and liabilities assumed in the Joint Venture Transaction to their fair values as well as other immaterial non-recurring items
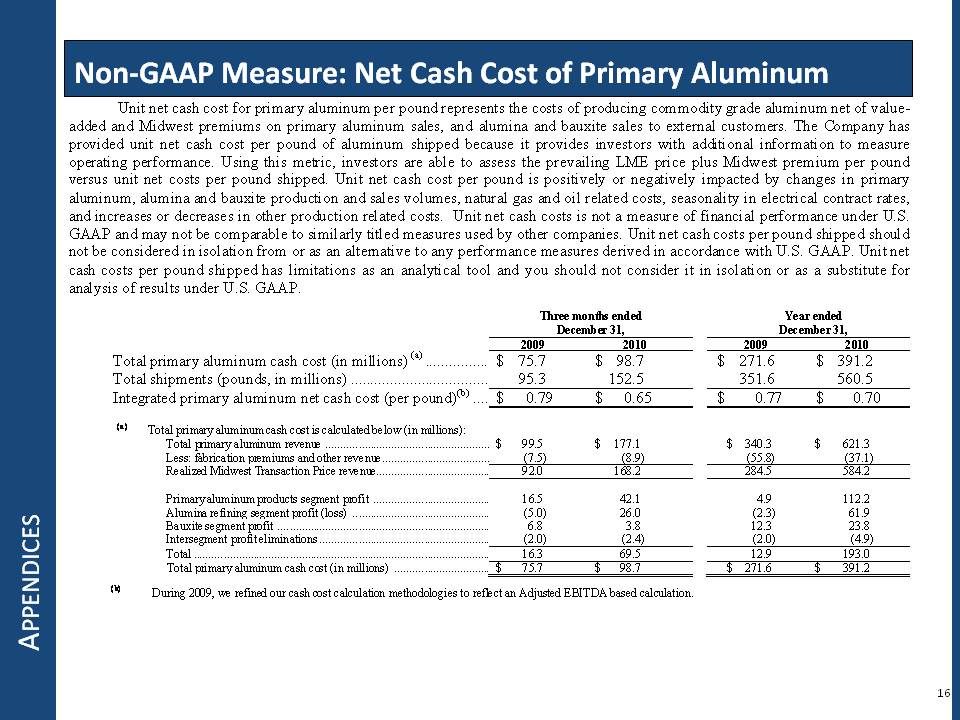
APPENDICES Non-GAAP Measure: Net Cash Cost of Primary Aluminum Unit net cash cost for primary aluminum per pound represents the costs of producing commodity grade aluminum net of value added and Midwest premiums on primary aluminum sales, and alumina and bauxite sales to external customers. The Company has provided unit net cash cost per pound of aluminum shipped because it provides investors with additional information to measure operating performance. Using this metric, investors are able to assess the prevailing LME price plus Midwest premium per pound versus unit net costs per pound shipped. Unit net cash cost per pound is positively or negatively impacted by changes in primary aluminum, alumina and bauxite production and sales volumes, natural gas and oil related costs, seasonality in electrical contract rates, and increases or decreases in other production related costs. Unit net cash costs is not a measure of financial performance under U.S. GAAP and may not be comparable to similarly titled measures used by other companies. Unit net cash costs per pound shipped should not be considered in isolation from or as an alternative to any performance measures derived in accordance with U.S. GAAP. Unit net cash costs per pound shipped has limitations as an analytical tool and you should not consider it in isolation or as a substitute for analysis of results under U.S. GAAP. Three months ended December 31, Year ended December 31, 2009 2010 2009 2010 Total primary aluminum cash cost (in millions) ( a) $ 75 7 $ 98 7 $ 271 6 $ 391 2 Total shipments (pounds, in millions) 95.3 152.5 351.6 560.5 Integrated primary aluminum net cash cost (per pound)(b) .... $ 0.79 $ 0.65 $ 0.77 $ 0.70 (a) Total primary aluminum cash cost is calculated below (in millions): Total primary aluminum revenue $ 99.5 $ 177.1 $ 340.3 6 $ 621.3 Less: fabrication premiums and other revenue (7.5) (8.9) (55.8) (37.1) Realized Midwest Transaction Price revenue 92.0 168.2 284.5 584.2 Primary aluminum products segment profit 16.5 42.1 4.9 112.2 Alumina refining segment profit (loss) (5.0) 26.0 (2.3) 61.9 Bauxite segment profit 6.8 3.8 12.3 23.8 Intersegment profit eliminations (2.0) (2.4) (2.0) (4.9) Total 16.3 69.5 12.9 193.0 Total primary aluminum cash cost (in millions) $ 75.7 $ 98.7 $ 271.6 $ 391.2 (b) During 2009, we refined our cash cost calculation methodologies to reflect an Adjusted EBITDA based calculation.
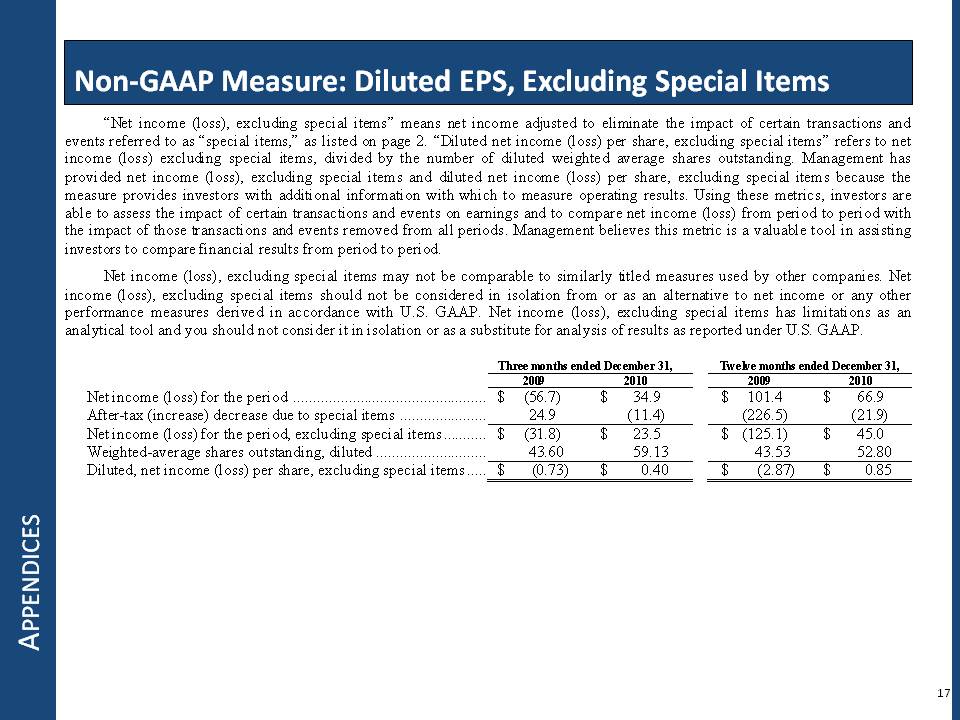
APPENDICES Non-GAAP Measure: Diluted EPS, Excluding Special Items “Net income (loss), excluding special items” means net income adjusted to eliminate the impact of certain transactions and events referred to as “special items,” as listed on page 2. “Diluted net income (loss) per share, excluding special items” refers to net income (loss) excluding special items, divided by the number of diluted weighted average shares outstanding. Management has provided net income (loss), excluding special items and diluted net income (loss) per share, excluding special items because the measure provides investors with additional information with which to measure operating results. Using these metrics, investors are able to assess the impact of certain transactions and events on earnings and to compare net income (loss) from period to period with the impact of those transactions and events removed from all periods. Management believes this metric is a valuable tool in assisting investors to compare financial results from period to period. Net income (loss), excluding special items may not be comparable to similarly titled measures used by other companies. Net income (loss), excluding special items should not be considered in isolation from or as an alternative to net income or any other performance measures derived in accordance with U.S. GAAP. Net income (loss), excluding special items has limitations as an analytical tool and you should not consider it in isolation or as a substitute for analysis of results as reported under U.S. GAAP. Three months ended December 31, Twelve months ended December 31, 2009 2010 2009 2010 Net income (loss) for the period $ (56.7) $ 34.9 $ 101.4 $ 66.9 After-tax (increase) decrease due to special items 24.9 (11.4) (226.5) (21.9) Net income (loss) for the period, excluding special items $ (31.8) $ 23.5 $ (125.1) $ 45.0 Weighted-average shares outstanding, diluted 43.60 59.13 43.53 52.80 Diluted, net income (loss) per share, excluding special items $ (0.73) $ 0.40 $ (2.87) $ 0.85
NORANDA ALUMINUM HOLDING CORPORATION NORNADA ™