Attached files
UNITED STATES
SECURITIES AND EXCHANGE COMMISSION
Washington D.C. 20549
FORM 10-K
(Mark One)
|
x
|
ANNUAL REPORT PURSUANT TO SECTION 13 OR 15(d) OF THE SECURITIES EXCHANGE ACT OF 1934
|
For the fiscal year ended December 31, 2010
OR
|
¨
|
TRANSITION REPORT PURSUANT TO SECTION 13 OR 15(d) OF THE SECURITIES EXCHANGE ACT OF 1934
|
For the Transition Period from to
Commission File Number: 000-50838
NETLOGIC MICROSYSTEMS, INC.
(Exact name of registrant as specified in its charter)
|
Delaware
|
77-0455244
|
|
|
(State or Other Jurisdiction of Incorporation)
|
(I.R.S. Employer Identification No.)
|
|
|
3975 Freedom Circle, Santa Clara,, California
|
95054
|
|
|
(Address of principal executive office)
|
(Zip Code)
|
|
(408) 454-3000
(Registrant’s telephone number, including area code)
Securities registered pursuant to Section 12(b) of the Act:
| Title of each class | Name of each exchange on which registered | |
|
Common Stock, $0.01 par value per share
|
The NASDAQ Stock Market LLC
|
Securities registered pursuant to Section 12(g) of the Act: None
Indicate by check mark if the registrant is a well-known seasoned issuer, as defined in Rule 405 of the Securities Act. Yes x No ¨
Indicate by check mark if the registrant is not required to file reports pursuant to Section 13 or Section 15(d) of the Act. Yes ¨ No x
Indicate by check mark whether the registrant (1) has filed all reports required to be filed by Section 13 or 15(d) of the Securities Exchange Act of 1934 during the preceding 12 months (or for such shorter period that the registrant was required to file such reports), and (2) has been subject to such filing requirements for the past 90 days. Yes x No ¨
Indicate by check mark whether the registrant has submitted electronically and posted on its corporate Web site, if any, every Interactive Data File required to be submitted and posted pursuant to Rule 405 of Regulation S-T (§232.405 of this chapter) during the preceding 12 months (or for such shorter period that the registrant was required to submit and post such files). Yes ¨ No ¨
Indicate by check mark if disclosure of delinquent filers pursuant to Item 405 of Regulation S-K is not contained herein, and will not be contained, to the best of registrant’s knowledge, in definitive proxy or information statements incorporated by reference in Part III of this Form 10-K or any amendment to this Form 10-K. ¨
Indicate by check mark whether the registrant is a large accelerated filer, an accelerated filer, or a non-accelerated filer. See definition of "large accelerated filer", "accelerated filer" and "smaller reporting company" in Rule 12b-2 of the Exchange Act. (Check one.)
Large accelerated filer x Accelerated filer ¨ Non-accelerated filer (Do not check if a smaller reporting company) ¨
Smaller reporting company ¨
Indicate by check mark whether the registrant is a shell company (as defined in Rule 12b-2 of the Exchange Act.): Yes ¨ No x
The aggregate market value of the voting stock held by non-affiliates of the registrant as of June 30, 2010, the last business day of the registrant’s most recently completed second fiscal quarter, was approximately $1,577,392,512 (based on the last reported sale price of $27.20 on June 30, 2010).
67,666,718 shares of the Registrant’s common stock, par value $0.01 per share, were outstanding as of January 31, 2011.
DOCUMENTS INCORPORATED BY REFERENCE
Portions registrant’s proxy statement to be delivered to stockholders in connection with the registrant’s 2011 Annual Meeting of Stockholders to be held on or about May 20, 2011 are incorporated by reference into Part III of this Form 10-K. The registrant intends to file its proxy statement within 120 days after its fiscal year end.
NETLOGIC MICROSYSTEMS, INC.
FISCAL 2010 FORM 10-K
|
|
|
Page
|
||
|
|
|
|||
|
|
|
1
|
||
|
|
|
10
|
||
|
|
|
21
|
||
|
|
|
21
|
||
|
|
|
21
|
||
|
|
|
21
|
||
|
|
|
|||
|
|
|
22
|
||
|
|
|
24
|
||
|
|
|
25
|
||
|
|
|
37
|
||
|
|
|
38
|
||
|
|
|
74
|
||
|
|
|
74
|
||
|
|
|
74
|
||
|
|
|
|||
|
|
|
75
|
||
|
|
|
75
|
||
|
|
|
75
|
||
|
|
|
75
|
||
|
|
|
75
|
||
|
|
|
|||
|
|
|
76
|
||
|
|
80
|
|||
This report contains forward-looking statements within the meaning of Section 27A of the Securities Act of 1933, as amended, and Section 21E of the Securities Exchange Act of 1934, as amended, which include, without limitation, statements about our future business operations and results, the market for our technology, our strategy and competition. Such statements are based upon current expectations that involve risks and uncertainties. Any statements contained herein that are not statements of historical fact may be deemed forward-looking statements. For example, the words "believes", "anticipates", "plans", "expects", "intends" and similar expressions are intended to identify forward-looking statements. Our actual results and the timing of certain events may differ significantly from the results discussed in the forward-looking statements. Factors that might cause such a discrepancy include, but are not limited to, those discussed in "Business", "Risks Factors", "Management's Discussion and Analysis of Financial Condition and Results of Operations" and "Quantitative and Qualitative Disclosures About Market Risk" below. All forward-looking statements in this report are based on information available to us as of the date of this report, and we assume no obligation to update any such forward-looking statements. The information contained in this report should be read in conjunction with our condensed financial statements and the accompanying notes contained in this report. Unless expressly stated or the context otherwise requires, the terms "we", "our", "us" and "NetLogic Microsystems" refer to NetLogic Microsystems, Inc.
|
BUSINESS.
|
Overview
We are a leading fabless semiconductor company that designs, develops and sells proprietary high-performance processors and high-speed integrated circuits that are used to enhance the performance, functionality and energy efficiency of advanced mobile wireless infrastructure, data center, enterprise, metro Ethernet, edge and core infrastructure networks. Our market-leading product portfolio includes high-performance multi-core communications processors, knowledge-based processors, high-speed 10/40/100 Gigabit Ethernet (GE) physical layer (PHY) devices, network search engines, and ultra low-power embedded processors. These products are designed into high-performance systems such as switches, routers, wireless base stations, access aggregation, radio network controllers, security appliances, networked storage appliances, service gateways and connected media devices offered by leading original equipment manufacturers (OEMs) such as Alcatel-Lucent, Brocade Communications Systems, Inc., Cisco Systems, Inc., Dell Inc., Ericsson, Finisar Corporation, Hewlett Packard Corporation, Huawei Technologies Co., Ltd., Juniper Networks, Inc., McAfee, Inc., Motorola, Inc., Nokia Siemens Networks, Tellabs, Inc., and ZTE Corporation.
The products and technologies we have developed and acquired are targeted to enable our customers to develop systems that support the increasing speeds and complexity of Internet Protocol (IP) networks. We believe there is a growing need to include high-performance multi-core processors, knowledge-based processors, and high speed physical layer devices in equipment as networks transition to all Internet Protocol packet processing at increasing speeds and complexity.
In 2009, we broadened our customer base and product portfolio, and strengthened our competitive positioning and research and development capabilities through the acquisitions of the network search engine business from (NSE) Integrated Device Technology (IDT) in July 2009, and the acquisition of RMI Corporation (RMI) in October 2009, which added high-performance and low-power multi-core, multi-threaded processors to our product offering. In connection with our acquisition of RMI, we issued approximately 9.9 million shares of our common stock and paid $12.6 million cash to the former stockholders of RMI as merger consideration. Approximately 10% of the shares of our common stock were held in escrow as security for claims and expenses that might arise during the first 12 months following the closing date and were subsequently released to the former holders of RMI capital stock in October 2010. Additionally, in December 2010 we issued approximately 2.4 million additional shares of our common stock and paid an additional $11.5 million cash to the former RMI stockholders as earn-out consideration based upon the achievement of specified percentages of revenue targets for the 12-month period from November 1, 2009 through October 31, 2010 with respect to sales of RMI products.
In 2010, we focused on strategically investing in our product development, scaling our business operations to support our growth, and continuing to successfully integrate the IDT NSE business and RMI. In product development, we introduced new products in each of our primary product families, including our XLP multi-core, multi-threaded communications processor, new members of our NL10000 and NL11000 knowledge-based processor families, and our NLP1342 PHY product. We also continued our efforts to transition our product portfolio of multi-core processing, knowledge-based processing and physical layer solutions to the advanced 40 nanometer (nm) process node. In order to support our growing business operations, we increased our worldwide hiring by adding 95 new employees and improving our processes and systems related to management information and enterprise resource planning systems to keep in pace with our breadth and scale of business while maintaining regulatory compliance. Our integration of the IDT NSE business and RMI included the continued assimilation of employees, retention of key personnel and existing customers and acquisition of new customers.
Our Markets
Networking Systems. We sell our products primarily to OEMs that supply networking equipment for the Internet infrastructure, which consists of various networking systems that process packets of information to enable communication between the networking systems. This networking equipment includes routers, switches, application acceleration equipment, network security appliances, network access equipment and networked storage devices that are utilized by networking systems such as:
|
•
|
core networks, for long-distance city-to-city communications which may span hundreds or thousands of miles;
|
|
•
|
enterprise networks, for internal corporate communications, including access to storage environments;
|
|
•
|
data center networks, for high-density server farms;
|
|
•
|
metro networks, for intra-city communications which may span several miles;
|
|
•
|
edge networks, which link core, metro, enterprise and access networks; and
|
|
•
|
access networks, which connect individual users to the edge network.
|
Applications. Sales of IP-based networking equipment continue to increase, as the usage of the Internet has continued to grow and evolve to accommodate the continued growth in the amount of digital media content available and provide converged support for the quad-play applications of voice, data, video and mobility over a single unified IP infrastructure. These applications include:
|
•
|
Mobile Internet services (delivery of data, voice and video to mobile devices);
|
|
•
|
cloud computing and data center virtualization;
|
|
•
|
Internet Protocol television, or IPTV;
|
|
•
|
video on demand, or VoD;
|
|
•
|
voice transmission over the Internet, or VoIP;
|
|
•
|
on-line gaming;
|
|
•
|
filtering of malware (e.g., virus, spyware and spam) and intrusion attempts;
|
|
•
|
email communications;
|
|
•
|
e-commerce;
|
|
•
|
music, picture and video file downloading and sharing to mobile devices such as cell phones and portable music/video devices; and
|
|
•
|
Internet browsing and video portal viewing delivered over the IP infrastructure to cell phones and other mobile devices.
|
Network Awareness and Content Awareness. Due to the increased number of the connected Internet devices, the growth of Internet services and applications, and as well as the greater complexity of the Internet-based infrastructure to support quad-play applications, OEM systems must increasingly process complex video, peer-to-peer, audio and data traffic that traverses the network more intelligently, more securely and at faster speeds using knowledge about the overall network. Such knowledge includes the method and manner in which networking systems are interconnected, as well as traffic patterns and congestion points, connection availability, user-based privileges, priorities and other attributes. These OEM systems also need knowledge about the content carried by the network and the applications that use the network. Using this knowledge of the network to make complex decisions about individual packets of information involves network awareness, while using knowledge of packet content to make complex decisions about individual packets of information involves content awareness, also known as deep-packet inspection. Network awareness and content awareness include the following:
|
•
|
preferential transmission of packets based upon assigned priority;
|
|
•
|
restrictions on access based upon security designations;
|
|
•
|
changes to packet forwarding destinations based upon traffic patterns and bandwidth availability, or packet content; and
|
|
•
|
addition or deletion of information about networks and users and applications.
|
Moreover, network and content awareness in advanced systems require multiple classes of packet processing, in addition to forwarding packets in the network. These additional classes of processing include access control for network security and prioritization of packets to maintain quality of service (QoS) of internet traffic for transaction billing. Compared with the basic processing task of forwarding, these additional classes of packet processing require a significantly higher degree of processing of IP packets to enable network and content awareness, which we describe as network-aware and content-aware processing. Thus, networking equipment OEMs increasingly seek third party providers of advanced processing solutions that complement their core competencies to enable network and content awareness within their systems and meet their escalating performance requirements for rapid processing speeds, complex decision-processing capabilities, low power dissipation, small form factor and rapid time-to-market. These trends are driving the need for higher performance and more advanced knowledge-based processors, multi-core processors and PHY solutions that enable carriers and enterprises to upgrade their networks in a seamless manner.
Our Strategy
Our objectives are to be the leading provider of network-aware and content-aware knowledge-based processing solutions, high-performance multi-core, multi-threaded communications processors, and high performance PHY layer solutions, to networking OEMs and to expand into new markets and applications. To achieve these goals, we are pursuing the following strategies:
Maintain and Extend our Market and Technology Leadership Positions. We intend to expand our market and technology leadership positions by continuing to invest in the development of successive generations of our knowledge-based processors, multi-core communications processors, 10/40/100 Gigabit PHYs and our other products to meet the increasingly high performance needs of networking OEMs, and as well as acquiring such capabilities through strategic partnerships and purchases of other businesses when we encounter favorable opportunities. We intend to leverage our engineering capabilities and continue to invest significant resources in recruiting and developing additional expertise in the areas of high performance circuit design, high-performance processor design, custom circuit layout, high performance Input/Output interfaces, and applications engineering. By utilizing our proprietary design methodologies, we intend to continue to target the most demanding, advanced applications for our products.
Focus on Long-Term Relationships with Industry-Leading OEM Customers. The design and product life cycles of our OEM customers' products have traditionally been lengthy, and we work with our OEM customers at the pre-design and design stages. As a result, our sales process typically requires us to maintain a long-term commitment and close working relationship with our existing and potential OEM customers. This process involves significant collaboration between our engineering teams and theirs, and often involves the concurrent development of our products and theirs. We intend to continue to focus on building long-term relationships with industry-leading networking OEMs to facilitate the adoption of our products and to gain greater insight into the needs of our OEM customers.
Leverage Technologies to Create New Products and Pursue New Market Opportunities. We intend to leverage our core design expertise to develop our products for a broader range of applications to further expand our market opportunities. We plan to address new market segments that are increasingly adopting intelligent and secure network processing, such as corporate storage networks that use IP-based packet-switching networking protocols. By utilizing our proprietary design methodologies, we intend to continue to target the most demanding, advanced applications for our products.
Capitalize on Highly Focused Business Model. We are a fabless semiconductor company, utilizing third parties to manufacture, assemble and test our products. This approach reduces our capital and operating requirements and enables us to focus greater resources on product development. We work closely with our wafer foundries to incorporate advanced process technologies in our solutions to achieve higher levels of performance and to reduce costs. These technologies include advanced 130, 110, 90, 80, 55, 40 and 28 nm complementary metal oxide semiconductor (CMOS) processing nodes with up to ten layers of copper interconnect and 300 millimeter wafer sizes. Our business model allows us to benefit from the large manufacturing investment of our wafer foundries which are able to leverage their investment across many markets.
Expand International Presence. We sell our products on a worldwide basis and utilize a network of direct sales, independent sales representatives and distributors in the U.S., Europe and Asia. We intend to continue to expand our sales and technical support organization to broaden our global customer reach. We believe that Asia, in particular China, and Europe, where we have already established customer relationships, provides the potential for significant additional long-term growth for our products. Given the continued globalization of OEM supply chains, particularly with respect to design and manufacturing, we believe that having a global presence will become increasingly important for securing new customers and design wins and to support OEMs in bringing their products to markets.
Our Products
Our products include high-performance knowledge-based processors, multi-core communications processors, NETLite™ processors, network search engines, 10/40/100 GE PHY products, and ultra low-power Alchemy® processors.
Knowledge-based Processors
Knowledge-based processors are integrated circuits that employ an advanced processor architecture and a large knowledge or signature database containing information on the network, as well as applications and content that run on the network, to make complex decisions about individual packets of information traveling through the network. Our knowledge-based processors significantly enhance the ability of networking OEMs to supply network service providers with systems offering more advanced functionality for the Internet, such as support for Internet Protocol Version 6 (IPv6) networking, IPTV, VoIP, unified threat management (UTM), malware inspection, virtual private networks (VPNs), rich content delivery over mobile wireless networks, and streaming video and audio.
Our knowledge-based processors incorporate advanced technologies that enable rapid processing, such as a superscalar architecture, which uses parallel-processing techniques, and deep pipelining, which segments processing tasks into smaller sub-tasks, for higher decision throughput. These technologies enable wireline and wireless networking systems to perform a broad range of network-aware and content-aware processing functions, such as application-based routing, UTM network security, intrusion detection and prevention, virus inspection, access control for network security, prioritization of traffic flow to maintain quality of service and statistical measurement of Internet traffic for transaction billing.
Layer 3-4 Knowledge-based Processors. Layers 3 and 4 refer to the data and transport layers, respectively, of the Open Systems Interconnection (OSI) reference model. For networking infrastructure that supports Layer 3-4 routing, decisions on how to handle IP packets are made using the data that is contained in the packet header. The packet header information consists of key data regarding the packet, including the IP address of the system that generated the packet, referred to as the source IP address, and the IP address of the device to which the packet is to be transmitted, referred to as the destination IP address. Our proprietary NL5000, NL6000, NL7000, NL8000 NL9000, NL10000 and NL11000 families of knowledge-based processors operate in conjunction with an OEM-developed custom application-specific integrated circuits (ASIC), programmable logic devices, and one or more network processing units (NPUs), and advanced interface technology to enable networking OEMs to meet their system performance requirements for Layer 3-4 processing. We also provide unique customized versions of our proprietary interface knowledge-based processors that work with proprietary custom integrated circuits and application software developed by or in collaboration directly with our customers. We offer knowledge-based processors with a range of knowledge database sizes, and all of our knowledge-based processors are designed to be connected in groups to increase the knowledge database available for processing.
In 2010, we collaborated with one of our long-time foundry partners Taiwan Semiconductor Manufacturing Company (TSMC) to migrate our knowledge-based processor family to the 40 nm process node. As part of this migration, we announced new members of our NL10000 and NL11000 knowledge-based processor families fabricated on TSMC's 40 nm process node, each of which includes enhanced knowledge-based processing cores capable of achieving 1.6 billion decisions per second (BDPS). The NL11000 family integrates our serializer-deserializer (SerDes) technology from our PHY products to provide a serial interface that delivers 225 Gigabits per second (Gbps) of chip-to-chip interconnect bandwidth. This high performance input/output (I/O) bandwidth is particularly useful in processing IPv6. Both the NL10000 and NL11000 knowledge-based processors are optimized for IPv6 processing, and the NL10000 family maintains compatibility with previous generations of knowledge-based processors to allow OEMs to leverage existing software and ASIC investments while upgrading to IPv6.
NETL7™ Layer 7 Knowledge-based Processors. For networking infrastructure that supports Layer 7 routing, decisions on how to handle IP packets are made using the information that is contained in the packet payload or packet content. The packet content contains the actual data being transmitted between applications using the network. Layer 7 of the OSI reference model, known as the application layer, facilitates communication between software applications and lower-layer network services. Our NETL7™ knowledge-based processors are designed to accelerate Layer 7 content processing and signature recognition tasks for enterprise and carrier-class networks.
NETLite™ Processors and Network Search Engines
Our NETLite™ processor family is specifically designed for cost-sensitive, high-volume applications such as entry-level switches, routers and access equipment. The NETLite processor family leverages circuit techniques developed and refined during the design of our knowledge-based processor families, and benefits from die size optimization, lower power dissipation and redundant computing techniques. In addition, the NETLite processors utilize a simplified pipeline architecture, as compared to our knowledge based processors, that allows for lower cost manufacturing and assembly in less expensive packages, and allows for lower cost system designs. As such, the NETLite processors are ideal for entry-level systems that do not require the advanced parallel processing and deep pipelining performance of our high-end knowledge-based processors.
We also continue to provide network search engine products including those we acquired from IDT in July 2009, the TCAM2 products we purchased from Cypress Semiconductor Corporation in August 2007, and our legacy network search engines. We introduced our network search engine products between 1998 and 2001. These products are fabricated by IDT, UMC or TSMC using a range of process technologies from 0.35 micron to 0.15 micron.
Multi-Core Communications Processors
We offer a range of high performance, highly integrated, feature-rich XLP™, XLR® and XLS® multi-core, multi-threaded communications processor solutions that provide high throughput, power efficiency, application and content awareness and security for the evolving global IP network. Each core in the multi-core processors operates as an independent central processing unit. These processors serve infrastructure equipment, enterprise systems and network storage markets within the global IP network with a wide range of features and performance configurations. Our multi-core, multi-threaded communications processors can replace a number of single-function semiconductors through a highly integrated processing solution that provides customers with greater ease of design and faster time-to-market for their products.
Our multi-core processors offer up to four-way multi-threading cores that allow each thread to act as a virtual central processing unit, or NXCPU ™ , thereby making each processor core capable of much higher throughput than a non-threaded core. The proprietary processor architecture also implements a high-speed Memory Distributed Interconnect ® network, consisting of a Fast Messaging Network ® and point-to-point interconnects, enabling high-speed communication between cores, accelerators and network interfaces and more efficient memory access. The processors also include Autonomous Acceleration Engines ® that enable them to offload computationally intensive software code from the processing cores to an on-chip hardware component for faster and more power-efficient execution. As a result, our processors can perform multiple complex and specialized tasks such as network traffic prioritization and application and content inspection without utilizing processor core resources. In addition, all of our processors incorporate security processing engines or algorithms for secure connectivity and communications.
In the communications equipment market, our processor architecture integrates network accelerators, memory access accelerators, compression and decompression engines, and high performance network interconnects. This allows our customers to develop systems with fewer semiconductor components as well as systems that perform a broader range of functions. This level of integration eliminates the need for separate co-processors and digital signal processors and the associated complexity of software for each additional processing component.
XLP™ Processor Family. In 2010, we shipped to our customers first samples of our XLP multi-core, multi-threaded communications processor. Designed on TSMC’s 40 nm process node, the XLP processor family offers scalability to 128 NXCPUs, each operating at up to 2.0 Giga Hertz (GHz) and over 160 programmable processing engines to deliver 160Gbps throughput and 240 million packets-per-second (Mpps) of intelligent application performance over the high-speed Inter-chip Coherency Interface™ (ICI) that offers cache and memory coherency to enable software applications to seamlessly run in Symmetric Multi Processing (SMP) or Asymmetric Multi Processing (AMP) modes.
XLR® Processor Family. Our multi-core, multi-threaded XLR processor family is a high throughput, feature-rich processor solution for a wide variety of high-performance infrastructure equipment, enterprise networking, security and storage systems. The XLR processors enable applications, such as integrated security, convergence of voice, data and video applications (i.e., "triple play applications"), virtualized storage, load balancing and server offload, as well as content and application aware, multi-service routing and switching. All XLR processors are software- and pin-compatible and available in a variety of power options, enabling scalable system designs within a single platform.
XLS® Processor Family. Our XLS processor family offers mid- to entry-level derivative versions of our XLR's multi-core, multi-threaded architecture. The XLS processors leverage the XLR's performance, scalability and technology and incorporate additional advanced innovations. XLS processors address applications that demand smaller form factors and lower power consumption. Our XLS processors are pin compatible within each series and software compatible across all XLS and XLR processor families.
10-100 Gigabit Ethernet Physical Layer Products
Our PHY family of products provides high-performance, single, dual and quad-channel low-power interface technology for high-density data communication and storage systems, and offers comprehensive support for multiple 10/40/100 GE standards. The PHY products also integrate advanced electronic dispersion compensation technology. We expect our PHY family of products to benefit from the same market drivers as our knowledge-based processors and multi-core communications processors, including growth in 10 GE ports in switches and routers, data center servers, upgrades of the telecom infrastructure to support IPTV, and the deployment of the 10/40/100 GE IP-backbone for advanced mobile wireless networks. In 2010, we announced the availability of the industry’s lowest power 10/40/100 GE PHY solution, the NLP1342, and the industry’s first dual-mode quad-port 10GBASE-KR and 40GBASE-KR4 backplane device, the NLP3342, that includes Energy Efficient Ethernet (EEE).
Ultra Low-Power Processor Family
Alchemy® Ultra-Low Power Embedded Processors. Our Alchemy® processor family consists of our industry leading embedded processors that deliver the powerful processing performance, ultra low-power functionality and market specific integration required for next-generation products like enterprise thin clients, automotive infotainment, telematics, and other media-rich embedded applications. Our ultra low-power embedded Alchemy processor cores are based on the standard MIPS® processor instruction set. We utilize very low power microprocessor design techniques and utilize low voltage and low leakage cell libraries, which allow us to incorporate high power efficient cores in our chips.
Customers
The markets for networking, communications infrastructure, security and storage systems utilizing our products and services are mainly served by large OEMs, such as Alcatel-Lucent, Brocade Communications Systems, Inc., Cisco Systems, Inc., Dell Inc., Ericsson, Finisar Corporation, Hewlett Packard Corporation, Huawei Technologies Co., Ltd., Juniper Networks, Inc., McAfee, Inc., Motorola, Inc., Nokia Siemens Networks, Tellabs, Inc., and ZTE Corporation.
We work with these and other OEMs to understand their requirements, and provide them with solutions that they then qualify and, in some cases, specify for use within their systems. While we sell directly to some OEMs, we also provide our products and services indirectly to other OEMs through their contract manufacturers, who in turn assemble our products into systems for delivery to our OEM customers. Sales to contract manufacturers accounted for 44%, 43%, and 41% of total revenue in 2010, 2009, and 2008, respectively. Sales of our products are generally made under short-term, cancelable purchase orders. As a result, our ability to predict future sales in any given period is limited and subject to change based on demand for our OEM customers' systems and their supply chain decisions.
We also provide our products and services indirectly to our OEM customers or their contract manufacturers through our international stocking sales representatives. Our stocking sales representatives are independent entities that assist us in identifying and servicing foreign networking OEMs and generally purchase our products directly from us for resale to OEMs or contract manufacturers located outside the U.S. In general, these international stocking sales representatives generally exclusively service a particular foreign region or customer base, and purchase our products pursuant to cancelable and re-schedulable purchase orders containing our standard warranty provisions for defects in materials, workmanship and product performance. At our option, defective products may be returned for their purchase price or for replacement. To date, our international stocking sales representatives have returned a small number of defective products to us. Our international stocking sales representatives may also act as a sales representative and receive commissions on sales of our products. Sales through our international stocking sales representatives accounted for 6%, 6%, and 10% of total revenue in 2010, 2009, and 2008, respectively. While we have purchase agreements with our international stocking sales representatives, they do not have long-term contracts with any of our OEM customers that use our products and services.
We also use distributors to provide valuable assistance to end-users in delivery of our products and related services. Our distributors are used to support our international sales logistic principally in Asia. In accordance with standard market practice, our distributor agreements generally limit the distributor's ability to return product up to a portion of its purchases in the preceding quarter and limit price protection for inventory on-hand if it subsequently lowers prices on our products. We recognize sales through distributors at the time of shipment to end customers as reported by our distributors.
For 2010, 2009 and 2008, our top five customers in terms of revenue accounted for approximately 58%, 68% and 68%, respectively, of total product revenue. Although we believe our revenues will continue to be concentrated among our largest customers, we expect that continued favorable market trends, such as the increasing number of 10 Gigabit ports resulting as enterprises and datacenters upgrade their legacy networks to better accommodate the proliferation of video and virtualization applications, and the growing mobile wireless infrastructure and IPTV markets, will enable us to broaden our customer base. Additionally, we believe that our expanding product portfolio will also help us to further diversify our customer and product revenues further, as well as expand our offerings to our existing customers.
We maintain inventory, or “hubbing”, arrangements with certain customers, including our largest customer, Cisco and its supplier, Wintec Industries. Pursuant to these arrangements, we deliver products to a customer, an intermediary or a designated third party warehouse based upon the customer’s projected needs, but do not recognize product revenue unless and until the customer, intermediary or third-party warehouse reports that it has removed, or pulled, our product from the warehouse to be incorporated into the customers’ end products. Historically, we have had reasonable visibility of these customers’ requirements within a quarter, and we typically commit resources and incur expenses based on our projections. Therefore, if a customer that uses a hubbing arrangement does not take delivery of products in accordance with the schedule it originally provided to us, our predicted future revenue stream may vary substantially from our forecasts, and our results of operations could be materially and adversely affected because we typically commit resources and incur expenses based on our projections. In addition, although we own the inventory physically located at these hubs, our ability to effectively manage inventory levels may be restricted, causing our total inventory levels to increase. This, in turn, could increase our expenses associated with excess and obsolete product and negatively impact our cash flows.
In the normal course of business, we have agreed to indemnify our customers with respect to liabilities associated with the infringement of other parties’ technology based upon their products. The duration of such indemnification obligations varies and, in certain cases, is indefinite. We have undertaken specified obligations in the event of an epidemic product failure under master purchase agreements with certain customers. In the event of an epidemic product failure, our obligations under these arrangements may have a material impact on our results of operations or financial condition.
Sales, Marketing and Distribution
Our sales and marketing strategy is to achieve design wins with leaders and emerging participants in the networking, communications infrastructure, data center, storage and security systems market and to maintain these design wins primarily by offering leading-edge products and superior customer service. We focus our marketing and sales efforts at a high organizational level of our potential customers to access key decision makers. In addition, as many targeted OEMs design custom integrated circuits to interface to our products, we believe that applications support at the early stages of design is critical to reducing time-to-market and minimizing costly redesigns for our customers.
Our product sales cycles can take over 24 months to complete, requiring a significant investment in time, resources and engineering before realization of income from product sales, if at all. Such long sales cycles mean that OEM customers' vendor selections, once made, are normally difficult to change. As a result, a design loss to the competition can negatively impact our financial results for several years. Similarly, design wins can result in an extended period of revenue opportunities with that customer.
We market and sell our products through our direct sales force, distributors, and through independent sales representatives throughout the world. Our direct sales force is dedicated to enhancing relationships with our customers. We supplement our direct sales force with independent sales representatives, who have been selected based on their understanding of our targeted customers' systems market and their level of penetration at our target OEM customers. We also use application engineers to provide technical support and design assistance to existing and potential customers.
Our marketing group is responsible for market and competitive analyses and defining our product roadmaps and specifications to take advantage of market opportunities. This group works closely with our research and development group to align development programs and product launches with our OEM customers' schedules. Additionally, this group develops and maintains marketing materials, training programs and our web site to convey our benefits to our targeted OEMs.
We operate in one business segment and primarily sell our products directly to customers in the United States, Asia and Europe. Sales for the geographic regions reported below are based upon the location to which we ship. The following is a summary of the geographic information related to revenues for the years ended December 31, 2010, 2009 and 2008:
|
Year ended December 31,
|
||||||||||||
|
2010
|
2009
|
2008
|
||||||||||
|
Revenue:
|
||||||||||||
|
United States
|
18 | % | 25 | % | 33 | % | ||||||
|
China
|
38 | % | 27 | % | 22 | % | ||||||
|
Malaysia
|
26 | % | 31 | % | 30 | % | ||||||
|
Other
|
18 | % | 17 | % | 15 | % | ||||||
|
Total
|
100 | % | 100 | % | 100 | % | ||||||
Research and Development
We devote substantial resources to the development of new products, improvement of existing products and support of the emerging requirements of our targeted customers. We have assembled a team of product designers possessing extensive experience in system architecture, analog and digital circuit design, hardware reference board design, software architecture and driver design and advanced fabrication process technologies. Our engineering design teams are located in Santa Clara, California, Austin, Texas, Beijing, China and Bangalore and Mumbai, India. As of December 31, 2010, we had approximately 393 employees engaged in research and development worldwide. Our research and development expenses were $127.7 million, $73.6 million, and $51.6 million for the years ended December 31, 2010, 2009, and 2008, respectively.
We use a number of standard design tools in the design, manufacture and verification of our products. Due to the highly complex design requirements of our products, we typically supplement these standard tools with our own tools to create a proprietary design method that allows us to optimize the performance of our products at the circuit-level.
Manufacturing and Materials
We design and develop all of our products and electronically transfer our proprietary designs to third party wafer foundries to manufacture our products. Wafers processed by these foundries are shipped to our subcontractors, where they are assembled into finished products and electronically tested before delivery to our customers. We believe that this manufacturing model significantly reduces our capital requirements and allows us to focus our resources on the design, development and marketing of our products.
Our principal wafer foundry is TSMC in Taiwan. We are actively involved with product development on next-generation processes, and are designing products on TSMC's most advanced logic processes. The latest generation of our products employs up to ten layers of copper interconnect and 300 millimeter wafer sizes.
Our products are designed to use industry standard packages and be tested using widely available automatic test equipment. We develop and control product test programs used by our subcontractors based on our product specifications. We principally rely on Amkor Technology, Inc. in Korea, Philippines, and Taiwan, Advanced Semiconductor Engineering, Inc. in Taiwan, and King Yuan Electronics Co., Ltd. in Taiwan to assemble and test our products. We also rely on JSI Shipping to provide certain logistics management services. We also have an office in Taiwan that employs local personnel to work directly with our Asian wafer manufacturers and assembly and test houses to facilitate manufacturing operations.
We have designed and implemented an ISO9001-certified quality management system that provides the framework for continual improvement of our products, processes and customer service. We apply well-established design rules and practices for CMOS devices through standard design, layout and test processes. We also rely on in-depth simulation studies, testing and practical application testing to validate and verify our products. We emphasize a strong supplier quality management practice in which our manufacturing suppliers are pre-qualified by our operations and quality teams. To ensure consistent product quality, reliability and yield, we closely monitor the production cycle by reviewing electrical, parametric and manufacturing process data from each of our wafer foundries and assembly subcontractors.
We currently do not have long-term supply contracts with any of our significant third party manufacturing service providers. We generally place purchase orders with these providers according to terms and conditions of sales which specify price and 30-day payment terms and which limit the providers' liability.
Competition
The markets for our products are highly competitive. We believe that the principal bases of competition are:
|
•
|
processing speed and performance;
|
|
•
|
power dissipation;
|
|
•
|
capacity of the knowledge or signature database that can be processed;
|
|
•
|
advanced product features allowing OEM and system customer product differentiation;
|
|
•
|
price;
|
|
•
|
product availability and reliability;
|
|
•
|
customer support and responsiveness;
|
|
•
|
timeliness of new product introductions; and
|
|
•
|
credibility in designing and manufacturing products.
|
We believe that we compete favorably on each of the bases identified above. However, some of our competitors have greater financial resources and a longer track record as a semiconductor supplier than we do. We anticipate that the market for our products will be subject to rapid technological change. As we enter new markets and pursue additional applications for our products, we expect to face competition from a larger number of competitors. Within our Layer 2-4 knowledge-based processor, NETLite and network search engine markets, we primarily compete with Renesas Technology, Corp. In the Layer 7 knowledge-based processor market, we primarily compete with certain divisions of LSI Corporation and Cavium Networks, Inc. In the 10-Gigabit Ethernet physical layer market, we primarily compete with certain divisions of Applied Micro Circuits Corporation, Broadcom Corporation, Marvell Technology Group Ltd., Cortina Systems, Inc. and Vitesse Semiconductor Corporation. In the multi-core communications processor market, we primarily compete with Applied Micro Circuits Corporation, Advanced Micro Devices, Inc., Cavium Networks, Inc., Freescale Semiconductor, Inc., Intel Corporation, LSI Corporation, Marvell Technology Group Ltd., and PMC-Sierra, Inc. We expect to face competition in the future from our current competitors, other manufacturers and designers of semiconductors, including large integrated device manufacturers, and innovative start-up semiconductor design companies.
Intellectual Property
Our success and future growth will depend, in part, on our ability to protect our intellectual property. We rely primarily on patent, copyright, trademark and trade secret laws to protect our intellectual property. We also attempt to protect our trade secrets and other proprietary information through agreements with our customers, suppliers, employees and consultants and through security protection of our computer network and physical premises. However, these measures may not provide meaningful protection for our intellectual property. While our patents and other intellectual property rights are important, we believe that our technical expertise and ability to introduce new products in a timely manner will also be important factors in maintaining our competitive position.
As of February 1, 2011, we held 500 issued patents comprising 482 issued U.S. patents and 18 issued foreign patents with expiration dates ranging from 2014 to 2030. We also have numerous patent applications pending in the U.S. and abroad. We may not receive any additional patents as a result of these applications or future applications. Nonetheless, we continue to pursue the filing of additional patent applications. Any rights granted under any of our existing or future patents may not provide meaningful protection or any commercial advantage to us.
Many participants in the semiconductor industry have a significant number of patents and have frequently demonstrated a willingness to commence litigation based on allegations of patent and other intellectual property infringement. From time to time, we have received, and expect to continue to receive, notices of claims of infringement or misappropriation of other parties' proprietary rights. In the event any such claims result in legal actions, we cannot assure you that we will prevail in these actions, or that other actions alleging infringement by us of third party intellectual property rights, misappropriation or misuse by us of third party trade secrets, or invalidity or unenforceability of our patents will not be asserted against us or that any assertions of infringement, misappropriation, misuse, invalidity or unenforceability will not materially and adversely affect our business, financial condition and results of operations.
We intend to protect our rights vigorously, but there can be no assurance that our efforts will be successful. Thus, despite our precautions, a third party may copy or otherwise obtain and use our products, services or technology without authorization, develop similar technology independently or design around our patents. In addition, effective patent, copyright, trademark and trade secret protection may be unavailable or limited in certain foreign countries. Moreover, we often incorporate the intellectual property of third parties into our designs, which is subject to certain obligations with respect to the non-use and non-disclosure of such intellectual property. We cannot assure you that the steps we have taken to prevent infringement, misappropriation or misuse of our intellectual property or the intellectual property of third parties will be successful. Furthermore, enforcement of our intellectual property rights may divert the efforts and attention of our management team and may be costly to us.
In addition to our own intellectual property, we also rely on third-party technologies for the development of our products. We license certain technology from MIPS Technologies, Inc., pursuant to a license agreement entered into in July 2003 wherein RMI was granted a non-exclusive, worldwide license to MIPS Technologies' micro-processor core technology to develop, implement and use in its products. The term of the agreement will expire in July 2017. The agreement permits us to continue selling in perpetuity products developed during the term of the agreement containing the licensed technology.
Employees
As of December 31, 2010, we had 645 employees worldwide, including 393 in research and development, 77 in operations, 126 in sales and marketing and 49 in general and administrative. None of our employees are covered by collective bargaining agreements. We believe our relations with our employees are good.
Available Information
We organized our business in 1995 as a California limited liability company and incorporated in Delaware in 2000. Our Web site address is www.netlogicmicro.com. The information on our Web site is not incorporated by reference into this report. Through a link on the Investor Relations section of our Web site, we make available our annual report on Form 10-K, quarterly reports on Form 10-Q, current reports on Form 8-K, and any amendments to those reports filed or furnished pursuant to Section 13(a) or 15(d) of the Securities Exchange Act of 1934 as soon as reasonably practicable after they are filed with, or furnished to, the Securities and Exchange Commission.
|
RISK FACTORS.
|
If any of the following risks actually occur, our business, results of operations, financial condition or stock price could suffer significantly.
We derive most of our revenue from sales of products for use predominantly in networking systems, and if demand for these products does not grow, we may not achieve our growth and strategic objectives.
Our products are used primarily in networking systems, including routers, switches, network access equipment and networked storage devices. We believe our future business and financial success depends on continued market acceptance and increasing sales of our knowledge-based and communication processors. In order to meet our growth and strategic objectives, networking and communications infrastructure OEMs must continue to incorporate, and increase the incorporation of, our products into their systems as their preferred means of enabling network-aware processing of IP packets, and the demand for their systems must grow as well. We cannot provide assurance that sales of products will increase substantially in the future or that the demand for our customers' systems will increase as well. Our future revenues from these products may not increase in accordance with our growth and strategic objectives if the OEM customers modify their current product designs or select products sold by our competitors instead. Thus, the future success of this part of our business depends in large part on factors outside our control, and sales of our products may not meet our revenue growth and strategic objectives. Additionally, due to the high concentration of our sales with a small number of OEMs, we cannot guarantee that the demand for the systems offered by these customers will increase or that our sales will increase outside this core customer base, and, accordingly, prior quarterly or annual results may not be an indication of our future revenue growth or financial results.
Because we rely on a small number of customers for a significant portion of our total revenue, the loss of, or a significant reduction in, orders for our products from these customers would negatively affect our total revenue and business.
To date, we have been dependent on sales to a limited number of customers, including Cisco, for most of our total revenue. During the years ended December 31, 2010, 2009 and 2008, our top five customers accounted for 58%, 68% and 68% of our total revenue, respectively. Also, within those revenues, during the years ended December 31, 2010, 2009, and 2008 Cisco and its contract manufacturers accounted for 27%, 35% and 38% of our total revenue, respectively. We expect that our future financial performance will continue to depend in large part upon our relationship with Cisco and several other large OEMs.
We cannot assure you that existing or potential customers will not develop their own solutions, purchase competitive products or acquire companies that use alternative methods in their systems. We do not have long-term purchase commitments from any of our OEM customers or their contract manufacturers. Although we entered into master purchase agreements with certain significant customers including Cisco, these agreements do not include any long-term purchase commitments. Our customers generally only place with us short-term purchase orders, which often are cancelable prior to shipment. The loss of orders for our products from major customers would have a significant negative impact on our business.
We face additional risks to our business success and financial condition because of our dependence on a small number of customers for sales of our products.
Our dependence on a small number of customers, for most of our revenue in the foreseeable future creates additional risks for our business, including the following:
|
•
|
we may face increased pressure to reduce the average selling prices of our products;
|
|
•
|
we may find it difficult to pass through increases in our manufacturing and other direct costs;
|
|
•
|
the reputation of our products in the marketplace may be affected adversely if any of our large OEM customers that represent a significant percentage of our sales of products reduce or cease their use of our products; and
|
|
•
|
we may face problems in collecting a substantial portion of our accounts receivable if any of these companies faces financial difficulties or dispute payments.
|
While we have generated significant cash flows from operations, we reported net losses in 2010 and 2009 and had a history of net losses prior to 2005. We may incur significant net losses in the future and may not be able to sustain profitability.
We reported a net loss of $66.4 million and $47.2 million during 2010 and 2009, respectively. We reported net income of $3.6 million and $2.6 million during 2008 and 2007, respectively and recorded net losses in years prior to 2005. At December 31, 2010, we had an accumulated deficit of approximately $189.5 million. To regain profitability, we will have to continue to generate greater total revenue and control costs and expenses. We cannot assure you that we will be able to generate greater total revenue, or limit our costs and expenses, sufficiently to sustain profitability on a quarterly or annual basis. We have used a substantial part of our cash flows from operations, and other sources of capital, to make acquisitions, with respect to which we have incurred substantial charges for amortization of intangibles, changes in contingent earn-out liability, fair value inventory adjustments and increased stock-based compensation expenses. Due to these items we have reported net losses under U.S. generally accepted accounting principles in 2010 and 2009 and significantly lower profit than would otherwise have been the case. If we continue to make acquisitions and other transactions that generate substantial expenses related to acquired intangible assets, fair value adjustments to acquired inventory and other acquisition-related items, we may not become profitable in the near term even though we otherwise meet our growth and operating objectives.
Because we sell our products on a purchase order basis and rely on estimated forecasts of our customers' needs, inaccurate forecasts could adversely affect our business.
We sell our products pursuant to individual purchase orders (subject to the terms of a master purchase agreement where applicable), and not pursuant to long-term purchase commitments. Therefore, we rely on estimated demand forecasts, based upon input from our customers, to determine how much product to manufacture. Because our sales are based on purchase orders, our customers may cancel, delay or otherwise modify their purchase commitments with little or no consequence to them and with little or no notice to us. For these reasons, we generally have limited visibility regarding our customers' product needs. We cannot provide assurance as to the quantities or timing required by our customers for our products. We cannot assure you that we will not experience subsequent substantial warranty claims or that warranty claims will not result in cancellation of existing orders or reluctance of customers to place future orders. In addition, the product design cycle for networking OEMs is lengthy, and it may be difficult for us to accurately anticipate when they will commence commercial shipments of products that include our products. Whether in response to changes affecting the industry or a customer's specific business pressures, any cancellation, delay or other modification in our customers' orders could significantly reduce our revenue, cause our operating results to fluctuate from period to period and make it more difficult for us to predict our revenue. In the event of a cancellation or reduction of an order, we may not have enough time to reduce operating expenses to minimize the effect of the lost revenue on our business, and we may purchase too much inventory and spend more capital than expected.
If we overestimate customer demand for our products, we may purchase products from manufacturers that we may not be able to sell. Conversely, if we underestimate customer demand or if sufficient manufacturing capacity were unavailable, we would forego revenue opportunities and could lose market share in the markets served by our products. In addition, our inability to meet customer requirements for our products could lead to delays in product shipments, force customers to identify alternative sources and otherwise adversely affect our ongoing relationships with our customers.
We are dependent on contract manufacturers for a significant portion of our revenue.
Many of our OEM customers, including Cisco, use third party contract manufacturers to manufacture their systems. These contract manufacturers represented 44%, 43% and 41% of our total revenue for 2010, 2009 and 2008, respectively. Contract manufacturers purchase our products directly from us on behalf of OEMs. Although we work with our OEM customers in the design and development phases of their systems, these OEM customers are gradually giving contract manufacturers more authority in product purchasing decisions. As a result, we depend on a concentrated group of contract manufacturers for a substantial portion of our revenue. If we cannot compete effectively for the business of these contract manufacturers or if any of the contract manufacturers, which work with our OEM customers, experience financial or other difficulties in their businesses, our revenue and our business could be adversely affected. In particular, if one of our OEM customer's contract manufacturer becomes subject to bankruptcy proceedings, neither we nor our OEM customer may be able to obtain any of our products held by the contract manufacturer. In addition, we may not be able to recover any payments owed to us by the contract manufacturer for products already delivered or recover the products held in the contract manufacturer's inventory when the bankruptcy proceeding is initiated. If we are unable to deliver our products to our OEM customers in a timely manner, our business would be adversely affected.
The average selling prices of our products may decline, which could reduce our revenue and gross margin.
In our experience, the average selling prices of our products have declined over the course of their commercial lives, principally due to the supply of competing products, pressure from customers to reduce prices and product cycle changes; we expect these trends to continue. Declining average selling prices can adversely affect our future operating results. To maintain acceptable operating results, we will need to develop and introduce new products and product enhancements on a timely basis while retaining cost competitiveness. If we are unable to offset any reductions in our average selling prices by increasing our sales volumes and achieving corresponding production cost reductions, or if we fail to develop and introduce new products and enhancements on a timely basis, our revenue and operating results will suffer.
We rely on third parties for the manufacture of our products, and a significant increase in wafer pricing or our failure to secure sufficient capacity could limit our growth and adversely affect our operating results.
As a fabless semiconductor company, we rely on third-party wafer foundries to manufacture our products. We currently do not have long-term supply contracts with any of the wafer foundries, including TSMC, and United Microelectronics Corporation, or UMC. Neither TSMC nor UMC is obligated to perform services or supply products to us for any specific period, in any specific quantities or at any specific price, except as may be provided in a particular purchase order. As a result, there are numerous risks associated with our reliance on these wafer foundries, including the possibilities that TSMC or UMC may give higher priority to their other customers or that our relationships with either wafer foundry may deteriorate. We cannot assure you that TSMC and UMC will continue to provide us with our products at acceptable yields or in sufficient quantities, for reasonable costs and on a timely basis to meet our customers' needs. A failure to ensure the timely fabrication of our products could cause us to lose customers and could have a material adverse effect on our operating results.
If either wafer foundry, and in particular TSMC, ceases to provide us with required production capacity with respect to our products, we cannot assure you that we will be able to obtain manufacturing capacity from other wafer foundries on commercially reasonable terms or that these arrangements, if established, will result in the successful manufacturing of our products. These arrangements might require us to share our technology and might be subject to unilateral termination by the wafer foundries. Even if such capacity is available from another manufacturer, we would need to convert the production of our integrated circuits to a new fabrication process and qualify the other manufacturer. Qualification of a new fabrication process or foundry could take nine months or longer. Furthermore, we may not be able to identify or qualify manufacturing sources that would be able to produce wafers with acceptable manufacturing yields.
Additionally, some of the network search engine products we acquired from IDT are manufactured for us by IDT at their wafer fabrication facilities. While IDT is contractually obligated to manufacture for us certain quantities of these products, we cannot assure you that IDT will continue to honor these commitments, that IDT's fabrication facility will remain in business or that IDT will be able to always meet our production demands which may adversely impact our operating results.
We also rely on third parties for other products and services, including the assembly, testing and packing of our products, and engineering services, and any failure by third parties to provide the tools and services we require could limit our growth and adversely affect our future operating results.
Our products are assembled and tested by third-party vendors that require the use of high performance assembly and test equipment. In addition, in connection with the design of our products, we use software tools, which we obtain from third party software vendors, for simulation, layout and other design purposes. Our reliance on independent assembly, testing, software and other vendors involves a number of risks, including reduced control over delivery schedules, quality assurance and costs. We currently do not have long-term supply contracts with any of these third party vendors. As a result, most of these third party vendors are not obligated to provide products or perform services to us for any specific period, in any specific quantities or at any specific price, except as may be provided in a particular purchase order. The inability of these third party vendors to deliver high performance products or services of acceptable quality and in a timely manner, could lengthen our design cycle, result in the loss of our customers and reduce our revenue.
We also rely on third party component suppliers to provide custom designed integrated circuit packages for our products. In some instances, these package designs are provided by a single supplier. Our reliance on these suppliers involves a number of risks, including reduced control over delivery schedules, quality assurance and costs. We currently do not have long-term supply contracts with any of these package vendors. As a result, most of these third party vendors are not obligated to provide products or perform services to us for any specific period, in any specific quantities or at any specific price, except as may be provided in a particular purchase order. The inability of these third party vendors to deliver packages of acceptable quality and in a timely manner, particularly the sole source vendors, could adversely affect our delivery commitments and adversely affect our operating results or cause them to fluctuate more than anticipated. Additionally, these packages may require specialized or high-performance component parts that may not be available in quantities or in time frames that meet our requirements or the anticipated requirement of our customers.
In connection with the design of our products, we have and may license third party intellectual property, and use third party engineering services. Our reliance on these third party intellectual property and engineering services providers involves a number of risks, including reduced control over and quality of the intellectual property and service deliverables, quality and costs. The inability of these third party providers to deliver high performance products or services of acceptable quality and in a timely manner, could lengthen our design cycle, result in the loss of our customers and reduce our revenue.
Our costs may increase substantially if the wafer foundries, assembly and test vendors that supply and test our products do not achieve satisfactory product yields, reliability or quality.
The wafer fabrication process is an extremely complicated process where the slightest changes in the design, specifications or materials can result in material decreases in manufacturing yields or even the suspension of production. From time to time, we and our wafer foundries have experienced, and are likely to continue to experience manufacturing defects and reduced manufacturing yields related to errors or problems in our wafer foundries' manufacturing processes or the interrelationship of their processes with our designs. In some cases, our wafer foundries may not be able to detect these defects early in the fabrication process or determine the cause of such defects in a timely manner, which may affect the quality or reliability of our products. We may incur substantial research and development expense for prototype or development stage products as we qualify the products for production.
Generally, in pricing our products, we assume that manufacturing, assembly and test yields will continue to increase, even as the complexity of our products increases. Once our products are initially qualified with our wafer foundries, minimum acceptable yields are established. We are responsible for the costs of the wafers if the actual yield is above the minimum. If actual yields are below the minimum, we are not required to purchase the wafers. The minimum acceptable yields for our new products are generally lower at first and increase as we achieve full production. Whether as a result of a design defect or manufacturing, assembly or test error, unacceptably low product yields or other product manufacturing, assembly or test problems could substantially increase the overall production time and costs and adversely impact our operating results on sales of our products. Product yield losses will increase our costs and reduce our gross margin. In addition to significantly harming our operating results and cash flow, poor yields may delay shipment of our products and harm our relationships with existing and potential customers.
To be successful we must continue to develop and have manufactured for us, innovative products to meet the evolving requirements of networking OEMs.
To remain competitive, we devote substantial resources to research and development, both to improve our existing technology and to develop new technology. We also seek to improve the manufacturing processes for our products, including the use of smaller process geometries, which we believe is important for our products to serve our OEM customers' requirements for enhanced processing. Our failure to migrate our products to processes at smaller process geometries could substantially reduce the future competitiveness of our products. In addition, from time to time, we may have to redesign some of our products or modify the manufacturing process for them. We cannot give you any assurance that we will be able to improve our existing technology or develop and integrate new technology into our products. Even if we design better products, we may encounter problems during the manufacturing or assembly process, including reduced manufacturing yields, production delays and increased expenses, all of which could adversely affect our business and results of operations.
In addition, given the highly complex nature of these products, even the slightest change or adjustment to our integrated circuit designs could require substantial resources to implement them. We may not be able to make these changes or adjustments to our products or correct any errors or defects arising from their implementation. Failure to make these changes or adjustments or correct these errors or defects during the product development stages, or any resulting delays, could severely harm our existing and potential customer relationships and could likely increase our development costs, adversely affecting our operating results. If these changes, adjustments, errors or defects are not identified or requested until after commercial production has begun or after products have been delivered to customers, we may be required to re-test existing inventory, replace products already shipped or re-design the products, all of which would likely result in significant time delays and additional costs and expenses.
We have sustained substantial losses from low production yields in the past and may incur such losses in the future.
Designing and manufacturing integrated circuits is a difficult, complex and costly process. Once research and development has been completed and the foundry begins to produce commercial volumes of the new integrated circuit, products still may contain errors or defects that could adversely affect product quality and reliability. We have experienced low yields and have incurred substantial research and development expenses in the design and initial production phases of all of our products. We cannot assure you that we will not experience low yields, substantial research and development expenses, product quality, reliability or design problems, or other material problems with our products that we have shipped or may ship in the future.
If we fail to retain key personnel and hire additional personnel, our business and growth could be negatively affected.
Our business has been dependent to a significant degree upon the services of a small number of executive officers and technical employees. We generally do not have non-competition agreements or term employment agreements with any of our executive officers, whom we generally employ at will. We do not maintain key-man life insurance on the lives of any of our key personnel. The loss of any of these individuals could negatively impact our technology development efforts and our ability to service our existing customers and obtain new customers.
Our future growth will also depend, in part, upon our ability to recruit and retain other qualified managers, engineers and sales and marketing personnel. There is intense competition for these individuals in our industry, and we cannot assure you that we will be successful in recruiting and retaining these individuals. If we are unable to recruit and retain these individuals, our technology development and sales and marketing efforts could be negatively impacted.
If we fail to maintain competitive equity compensation packages for our employees, or if our stock price declines materially for a protracted period of time, we might have difficulty retaining our employees and our business may be harmed.
In today's competitive technology industry, employment decisions of highly skilled personnel are influenced by equity compensation packages, which offer incentives above traditional compensation only where there is a consistent, long-term upward trend over time of a company's stock price. If our stock price declines due to market conditions, investors' perceptions of the technology industry or managerial or performance problems we have, our equity compensation incentives, especially stock awards may lose value to key employees, and we may lose these employees or be forced to grant additional equity compensation incentives to retain them. This in turn could result in:
|
•
|
immediate and substantial dilution to investors resulting from the grant of additional equity awards necessary to retain employees; and
|
|
•
|
potential compensation charges against the company, which could negatively impact our operating results.
|
Additionally, if we fail to provide an adequate amount of equity consideration to new and existing employees we may be unable to compete for new talent and retain our existing talent. Also, we have a limited number of shares available for grant under our Amended and Restated 2004 Equity Incentive Plan and it may not be adequate to enable us to continue to competitively compensate our employees in the future, which may prevent us from retaining our employees and could significantly impact our operating results.
A failure to successfully address the potential difficulties associated with international business could reduce our growth, increase our operating costs and negatively impact our business.
We conduct a significant amount of our business with companies that operate primarily outside of the United States, and intend to increase sales to companies operating outside of the United States. For example, our customers based outside the United States accounted for 82%, 75% and 67% of our total revenue during 2010, 2009 and 2008, respectively. Not only are many of our customers located abroad, but our wafer foundries are predominantly located in Taiwan, and we outsource the assembly and testing of our products to companies based principally in Taiwan. We face a variety of challenges in doing business internationally, including:
|
•
|
foreign currency exchange fluctuations;
|
|
•
|
compliance with local laws and regulations that we not be familiar with;
|
|
•
|
unanticipated changes in local regulations;
|
|
•
|
potentially adverse tax consequences, such as withholding taxes;
|
|
•
|
timing and availability of export and import licenses;
|
|
•
|
political and economic instability;
|
|
•
|
reduced or limited protection of our intellectual property;
|
|
•
|
additional resources and management time required to manage relationships with international distributors and other international sales channels that may be unfamiliar with our operating and disclosure practices and procedures and the requirements of our system of internal control;
|
|
•
|
protectionist laws and business practices that favor local competition; and
|
|
•
|
additional financial risks, such as potentially longer and more difficult collection periods.
|
Because we anticipate that we will continue to rely heavily on foreign based customers for our future growth, the occurrence of any of the circumstances identified above could significantly increase our operating costs, delay the timing of our revenue and harm our business and financial condition.
We must design our products to meet the needs of our OEM customers and convince them to use our products, or our revenue will be adversely affected.
In general, our OEM customers design our products into their equipment during the early stages of their development after an in-depth technical evaluation of both our and our competitors' products. These design wins are critical to the success of our business. In competing for design wins, if a competitor's product is already designed into the product offering of a potential customer, it becomes very difficult for us to sell our products to that customer. Changing suppliers involves additional cost, time, effort and risk for the customer. In addition, our products must comply with the continually evolving specifications of our OEMs. Our ability to compete in the future will depend, in large part, on our ability to comply with these specifications. As a result, we expect to invest significant time and effort and to incur significant expense to design our products to ensure compliance with relevant specifications. Even if an OEM designs our products into its systems, we cannot assure you that its systems will be commercially successful or that we will receive significant revenue from sales of our products for those systems.
Factors that negatively affect the businesses of our targeted OEMs that use or could use our products could negatively impact our total revenue.
The timing and amount of our revenue depend on the ability of our targeted OEMs who use our products to market, produce and ship systems incorporating our technology. Factors that negatively affect a significant customer or group of customers could negatively affect our results of operations and financial condition. Many issues beyond our control influence the success of our targeted OEMs that use our products, including, for example, the highly competitive environment in which they operate, the strength of the markets for their products, their engineering capabilities, their ability or inability to obtain other components from other suppliers, the compatibility of any of their other components with our products, the impact of a worldwide recession on their capital spending and sales of their equipment, and their financial and other resources. Likewise, we have no control over their product development or pricing strategies, which directly affect sales of their products and, in turn, our revenue. A decline in sales of our OEM customers' systems that use our products would reduce our revenue. In addition, seasonal and other fluctuations in demand for their products could cause our operating results to fluctuate, which could cause our stock price to fall.
We have a lengthy sales cycle, which may result in significant expenses that do not generate significant revenue or delayed revenue generation from our selling efforts and limits our ability to forecast our revenue.
We expect that our product sales cycle, which results in our products being designed into our customers' products, could take over 24 months. It can take an additional nine months to reach volume production of these products. A number of factors can contribute to the length of the sales cycle, including technical evaluations of our products by our OEMs, the design process required to integrate our products into our OEM customers' products and the timing of our OEMs' new product announcements. In anticipation of product orders, we may incur substantial costs before the sales cycle is complete and before we receive any customer payments. As a result, in the event that a sale is not completed or is cancelled or delayed, we may have incurred substantial expenses, making it more difficult for us to become profitable or otherwise negatively impacting our financial results. Furthermore, because of our lengthy sales cycle, our receipt of revenue from our selling efforts may be substantially delayed, our ability to forecast our future revenue may be more limited and our revenue may fluctuate significantly from quarter to quarter.
Our operating results could be adversely affected if we have to satisfy product warranty or liability claims.
If our products are defective or malfunction, we could be subject to product warranty or product liability claims that could have significant related warranty charges or warranty reserves in our financial statements. Further, we may spend significant resources investigating potential product design, quality and reliability claims, which could result in additional charges in our financial statements until such claims are resolved. We cannot guarantee that warranty reserves will either increase or decrease in future periods. Further, in connection with master purchase agreements that we entered into with certain large OEM customers, we agreed to provide varying product warranty periods and to indemnify customers for costs incurred in rectifying epidemic failures. If we are required to make payments under this indemnity, our operating results may be adversely affected. Moreover, these claims in the future, regardless of their outcome, could adversely affect our business.
Our revenue and operating results may fluctuate significantly from period to period, on a quarterly or annual basis, causing volatility in our stock price.
Our total revenue and operating results have fluctuated from quarter-to-quarter in the past and are expected to continue to do so in the future. As a result, you should not rely on quarter-to-quarter comparisons of our operating results as an indication of our future performance. Fluctuations in our total revenue and operating results could negatively affect the trading price of our stock. In addition, our total revenue and results of operations may, in the future, be below the expectations set by us or of analysts and investors, which could cause our stock price to decline. Factors that are likely to cause our revenue and operating results to fluctuate include, for example, the periodic costs associated with the generation of mask sets for new products and product improvements and the risk factors discussed throughout this section. Additional factors that could cause our revenue and operating results to fluctuate from period to period include:
|
•
|
foreign currency exchange fluctuations;
|
|
•
|
the timing and volume of orders received from our customers;
|
|
•
|
market demand for, and changes in the average selling prices of, our products;
|
|
•
|
the rate of qualification and adoption of our products by networking OEMs;
|
|
•
|
fluctuating demand for, and lengthy life cycles of, the products and systems that incorporate our products;
|
|
•
|
the market success of the OEM systems that incorporate our products;
|
|
•
|
the ability of our wafer foundries to supply us with production capacity and finished products to sell to our customers;
|
|
•
|
changes in the level of our costs and operating expenses;
|
|
•
|
our ability to receive our manufactured products from our wafer foundries and ship them within a particular reporting period;
|
|
•
|
deferrals or cancellations of customer orders in anticipation of the development and commercialization of new technologies or for other reasons;
|
|
•
|
changes in our product lines and revenue mix;
|
|
•
|
the timing of the introduction by others of competing, replacement or substitute products technologies;
|
|
•
|
our ability or the ability of our customers that use our products to procure required components or fluctuations in the cost of such components;
|
|
•
|
cyclical fluctuations in semiconductor or networking markets; and
|
|
•
|
general economic conditions that may affect end-user demand for products that use our products.
|
The cyclical nature of the semiconductor industry and the networking markets could adversely affect our operating results and our business.
We expect our business to be subject to the cyclicality of the semiconductor industry, especially the market for communications integrated circuits. Historically, there have been significant downturns in this industry segment, characterized by reduced demand for integrated circuits and accelerated erosion of average selling prices. At times, these downturns have lasted for prolonged periods of time. Furthermore, from time to time, the semiconductor industry also has experienced periods of increased demand and production constraints, in which event we may not be able to have our products produced in sufficient quantities, if at all, to satisfy our customers' needs. It is likely that the communications integrated circuit business will experience similar downturns in the future and that, during such times, our business could be affected adversely. It is also likely that the semiconductor industry will experience periods of strong demand. We may have difficulty in obtaining enough products to sell to our customers or may face substantial increases in the wafer prices charged by our foundries.
In addition, the networking industry from time to time has experienced and may experience a pronounced downturn. To respond to a downturn, many networking service providers may be required to slow their research and development activities, cancel or delay new product developments, reduce their workforces and inventories and take a cautious approach to acquiring new equipment and technologies from networking OEMs, which would have a significant negative impact on our business. In the future, a downturn in the networking industry may cause our operating results to fluctuate significantly from year to year, which also may tend to increase the volatility of the price of our common stock.
We may not be able to protect and enforce our intellectual property rights, which could impair our ability to compete and reduce the value of our technology.
Our success and future revenue growth depend, in part, on our ability to protect our intellectual property. We rely primarily on patent, copyright, trademark and trade secret laws, as well as confidentiality procedures, to protect our proprietary technologies and processes. However, these measures may not provide meaningful protection for our intellectual property.
We cannot assure you that any patents will issue from any of our pending applications. Any rights granted under any of our existing or future patents may not provide meaningful protection or any commercial advantage to us. For example, such patents could be challenged or circumvented by our competitors or declared invalid or unenforceable in judicial or administrative proceedings. The failure of any patents to adequately protect our technology would make it easier for our competitors to offer similar products. We do not have foreign patents or pending applications corresponding to many of our U.S. patents and patent applications, including in some foreign countries where our products are sold or may be sold in the future. Even if foreign patents are granted, effective enforcement in foreign countries may not be available.
With respect to our other proprietary rights, it may be possible for third parties to copy or otherwise obtain and use our proprietary technology or marks without authorization or to develop similar technology independently. Monitoring unauthorized use of our proprietary technology or marks is difficult and costly, and we cannot be certain that the steps we have taken will prevent misappropriation or unauthorized use of our technology or marks. In addition, effective patent, copyright, trademark and trade secret protection may not be available or may be limited in certain foreign countries. Many companies based in the U.S. have encountered substantial infringement problems in foreign countries, including countries in which we sell products. Our failure to effectively protect our intellectual property could reduce the value of our technology and could harm our business, financial condition and operating results.
Furthermore, we have in the past and may in the future initiate claims or litigation against third parties to determine the validity and scope of proprietary rights of others. In addition, we may in the future initiate litigation to enforce our intellectual property rights or the rights of our customers or to protect our trade secrets. Litigation by us could result in significant expense and divert the efforts of our technical and management personnel and could materially and adversely affect our business, whether or not such litigation results in a determination favorable to us.
Any claim that our products or our proprietary technology infringe third party intellectual property rights could increase our costs of operation, and distract management, and could result in expensive settlement costs.
The semiconductor industry is characterized by vigorous protection and pursuit of intellectual property rights or positions, which have resulted in often protracted and expensive litigation. From time to time, we are involved in litigation relating to intellectual property rights. In addition, we have received notices from time to time that claim we have infringed upon or misappropriated intellectual property rights owned by others. We typically respond when appropriate and as advised by legal counsel. We cannot assure you that parties will not pursue litigation with respect to those allegations. We may, in the future, receive similar notices, any of which could lead to litigation against us. For example, parties may initiate litigation based on allegations that we have infringed their intellectual property rights or misappropriated or misused their trade secrets, or may seek to invalidate or otherwise render unenforceable one or more of our patents. Litigation against us can result in significant expense and divert the efforts of our management, technical, marketing and other personnel, whether or not the litigation results in a determination adverse to us. We cannot assure you that we will be able to prevail or settle any such claims or that we will be able to do so at a reasonable cost. In the event of an adverse result in any such litigation, we could be required to pay substantial damages for past infringement and royalties for any future use of the technology. In addition, we may be required to cease the sale of certain products, recall certain products from the market, redesign certain products offered for sale or under development or cease the use of certain marks or names. We cannot assure you that we will be able to successfully redesign our products or do so at a reasonable cost. Additionally, we have in the past sought and may in the future seek to obtain a license to a third party's intellectual rights and have granted and may in the future grant a license to certain of our intellectual property rights to a third party in connection with a cross-license agreement or a settlement of claims or actions asserted against us. However, we cannot assure you that we would be able to obtain a license on commercially reasonable terms, or at all.
Our customers could also become the target of litigation relating to the patent and other intellectual property rights of others. This could trigger technical support and indemnification obligations in some of our license or customer agreements. These obligations could result in substantial expenses, including the payment by us of costs and damages related to claims of patent infringement. In addition to the time and expense required for us to provide support or indemnification to our customers, any such litigation could disrupt the businesses of our customers, which in turn could hurt our relations with our customers and cause the sale of our products to decrease. We cannot assure you that claims for indemnification will not be made or that if made, such claims would not have a material adverse effect on our business, operating results or financial condition. We do not have any insurance coverage for intellectual property infringement claims for which we may be obligated to provide indemnification. If we are obligated to pay damages in excess of, or otherwise outside of, our insurance coverage, or if we have to settle these claims, our operating results could be adversely affected.
If we are unable to compete effectively, our revenue and market share may be reduced.
Our business is extremely competitive, especially during the design-in phase of our customers' design cycles. We compete with large semiconductor manufacturers, many of which have more established reputations, more diverse customer bases and greater financial and other resources than we do. In addition, our OEM customers may design their own integrated circuits to address their system needs. As we develop new applications for our products and expand into new markets, we expect to face even greater competition. Our present and future competitors may be able to better anticipate customer and industry demands and to respond more quickly and efficiently to those demands, such as with product offerings, financial discounts or other incentives. Furthermore, our OEM customers may be able develop or acquire integrated circuits that satisfy their needs faster or most cost effectively than we can. We cannot assure you that we will be able to compete effectively against these and our other competitors. If we do not compete effectively, our revenue and market share may decline.
Our success may depend on our ability to comply with new or evolving industry standards applicable to our products or our business.
Our ability to compete in the future may depend on our ability to ensure that our products comply with evolving industry standards affecting our customers' equipment and other markets in which we compete. In addition, from time to time, new industry standards may emerge which could render our products incompatible with the products of our customers or suppliers. In order to ensure compliance with the relevant standards, we may be required to devote significant time, capital and other resources to modify or redesign our existing products or to develop new products. We cannot assure you that we will be able to develop products which comply with prevailing standards. If we are unable to develop these products in a timely manner, we may miss significant business opportunities, and our revenue and operating results could suffer.
If an earthquake or other natural disaster disrupts the operations of our third party wafer foundries or other vendors located in high risk regions, we could experience significant delays in the production or shipment of our products.
TSMC and UMC, which manufacture our products, along with most of our vendors who handle the assembly and testing of our products, are located in Asia. The risk of an earthquake in the Pacific Rim region is significant due to the proximity of major earthquake fault lines. In September 1999, a major earthquake in Taiwan affected the facilities of several of these third party vendors, as well as other providers of these services. As a result of this earthquake, these vendors suffered power outages and disruptions that impaired their production capacity. In March 2002 and September 2003, additional earthquakes occurred in Taiwan. The occurrence of additional earthquakes or other natural disasters could result in the disruption of the wafer foundry or assembly and test capacity of the third parties that supply these services to us. We may not be able to obtain alternate capacity on favorable terms, if at all.
Any future acquisitions we make could disrupt our business, and harm our financial condition and dilute our stockholders.
In the future, we may consider additional opportunities to acquire other businesses or technologies that would complement our current offerings, expand the breadth of our markets or enhance our technical capabilities. Acquisitions present a significant number of potential challenges that could, if not met, disrupt our business operations, increase our operating costs, reduce the value to us of the acquired company or business, including:
|
•
|
integration of the acquired employees, operations, technologies and products with our existing business and products;
|
|
•
|
focusing management's time and attention on our existing core business;
|
|
•
|
retention of business relationships with suppliers and customers of the acquired company;
|
|
•
|
entering markets in which we may lack prior experience;
|
|
•
|
retention of key employees of the acquired company or business;
|
|
•
|
amortization of intangible assets, write-offs, fair market value adjustments for acquired inventory, changes in contingent earn-out liability, stock-based compensation and other charges relating to the acquired business and our acquisition costs; and
|
|
•
|
dilution to our existing stockholders from the issuance of additional shares of common stock or reduction of earnings per outstanding share in connection with an acquisition that fails to increase the value of our company.
|
We cannot provide assurances, however, that this acquisition or future acquisitions that we might make will achieve our business objectives or increase our value or the price of our common stock.
We expect to rely on third-party technologies for the development of our products, and our inability to use these technologies in the future could harm our ability to compete in the markets for these products.
We rely on third parties for technologies that are integrated into a number of our products, such as wafer fabrication and assembly and test technologies used by its contract manufacturers, as well as licensed MIPS architecture technologies. If we are unable to continue to use or license these technologies on reasonable terms, or if these technologies fail to operate properly following the acquisition, we may not be able to secure alternatives in a timely manner, and our ability to remain competitive in the markets served by these products would be harmed. In addition, the MIPS license requires that certain improvements be made available to the community of all of MIPS' licensees, which could conceivably reduce the proprietary advantage that we will have with this architecture. If we are unable to license technology from third parties on commercially reasonable terms in order to continue to develop current products or to develop future products for the markets served by the RMI products, we may not be able to develop these products in a timely manner or at all.
We are exposed to potential impairment charges on certain assets.
Over the past several years, we have made several acquisitions. As a result of these acquisitions, we had approximately $112.7 million of goodwill, $180.8 million of intangible assets and other long-lived assets on our balance sheet as of December 31, 2010. Under GAAP, we are required to review our intangible assets for impairment whenever events or changes in circumstances indicate that the carrying value of these assets may not be recoverable. We perform an assessment of long-lived assets annually and on an interim basis whenever events or changes in circumstances indicate that the carrying value of such assets may not be recoverable. If the businesses acquired fail to meet the expectations we established at the time of the acquisition, or if our market capitalization adjusted for control premiums and other factors declines to below our carrying value, we could incur significant goodwill or intangible impairment charges, which could negatively impact our results of operations. In addition, from time to time, we have made investments in other companies which are privately held. If such companies are unable to execute their business plans and succeed in their respective markets, we may not benefit from the investments, and may incur a loss on them. We evaluate our investment portfolio on a regular basis to determine if impairments have occurred. Impairment charges could have a material impact on our results of operations in any period.
We may be required to record additional income tax provision which could negatively affect our results of operations and financial position.
Our income tax provision reflects judgment and estimation regarding the allocation of profits between taxing jurisdictions and the application of complex tax laws throughout the jurisdictions where we operate. These calculations of income taxes are based on our legal and factual interpretations of applicable tax laws in the jurisdictions in which we file returns and involve judgment and taking positions in matters of uncertainty. Although we believe our tax estimates are reasonable, the ultimate tax outcome which may arise from an examination of our income tax returns by the Internal Revenue Services in the U.S. or other tax authorities, may materially differ from the tax amounts recorded in our consolidated financial statements and may cause a higher effective tax rate that could materially affect our income tax provision, results of operations or cash flows in the period or periods for which such determination is made. We believe that we have provided sufficient tax provisions for all open tax years and the ultimate outcome from any tax audits will not have a material adverse impact on our financial position or results of operations in future periods. Potential changes to tax laws include, but are not limited to changes in corporate tax rates, curbing the deferral of U.S. taxation of certain foreign earnings, and limiting the ability to use research and development and foreign tax credits. However, we cannot predict with certainty how these matters which could change as a result of new legislature, evolution of regulation and court rulings, or an unexpected audit or litigation outcome will ultimately be resolved and whether we will be required to make additional tax payments.
Furthermore, our provision for income tax could increase as we expand our international operations, adopt new products, implement changes to our operating structure or undertake intercompany transactions in light of acquisitions, changing tax laws, expiring rulings, and our current and anticipated business and operational requirements.
We are subject to governmental export and import controls that could subject us to liability or impair our ability to compete in foreign markets.
Because we incorporate encryption technology into our communication processors, some of these products are subject to United States export controls and may be exported outside the United States only with the required level of export license or through an export license exception. In addition, various countries regulate the import of certain encryption technology and have enacted laws that could limit our ability to introduce products or could limit our customers' ability to implement our products in those countries. Changes in our products or changes in export and import regulations may create delays in the introduction of our products in international markets, prevent our customers with international operations from deploying our products throughout their global systems or, in some cases, prevent the export or import of our products to certain countries altogether. Any change in export or import regulations or related legislation, shift in approach to the enforcement or scope of existing regulations, or change in the countries, persons or technologies targeted by such regulations, could result in decreased use of our products by, or an inability to export or sell our products to, existing or prospective customers with international operations and harm our business.
RISKS RELATING TO OUR COMMON STOCK
Our stock price could drop, and there could be significantly less trading activity in our stock, if securities or industry analysts downgrade our stock or do not publish research or reports about our business.
Our stock price and the trading market for our stock are likely to be affected significantly by the research and reports concerning our company and our business which are published by industry and securities analysts. We do not have any influence or control over these analysts, their reports or their recommendations. Our stock price and the trading market for our stock could be negatively affected if any analyst downgrades our stock, publishes a report which is critical of our business, or discontinues coverage of us.
Our common stock has experienced substantial price volatility.
Our common stock has experienced substantial price volatility. Such volatility may occur in the future, particularly because of quarter-to-quarter variations in our actual or anticipated financial results, or the reported financial results of other semiconductor companies or our customers. Stock price volatility may also result from product announcements by us or our competitors, or from changes in perceptions about the various types of products we manufacture and sell. In addition, our stock price may fluctuate due to price and volume fluctuations in the stock market, especially in the technology sector.
Provisions of our certificate of incorporation and bylaws, Delaware law and customer agreements might delay or prevent a change of control transaction and depress the market price of our stock.
Various provisions of our certificate of incorporation and bylaws might have the effect of making it more difficult for a third party to acquire, or discouraging a third party from attempting to acquire, control of us. These provisions could limit the price that certain investors might be willing to pay in the future for shares of our common stock. Certain of these provisions eliminate cumulative voting in the election of directors, limit the right of stockholders to call special meetings and establish specific procedures for director nominations by stockholders and the submission of other proposals for consideration at stockholder meetings.
We are also subject to provisions of Delaware law which could delay or make more difficult a merger, tender offer or proxy contest involving us. In particular, Section 203 of the Delaware General Corporation Law prohibits a Delaware corporation from engaging in any business combination with any interested stockholder for a period of three years unless specific conditions are met. Any of these provisions could have the effect of delaying, deferring or preventing a change in control, including, without limitation, discouraging a proxy contest or making more difficult the acquisition of a substantial block of our common stock.
Our board of directors might issue up to 50,000,000 shares of preferred stock without stockholder approval on such terms as the board might determine. The rights of the holders of common stock will be subject to, and might be adversely affected by, the rights of the holders of any preferred stock that might be issued in the future.
Under our master purchase agreements with large OEMs, certain customers may exercise rights to purchase our products directly from our manufacturers under certain circumstances. This provision may discourage or complicate attempts by some third parties to acquire us.
Our stockholder rights plan could prevent stockholders from receiving a premium over the market price for their shares from a potential acquirer.
We adopted a stockholder rights plan that generally entitles our stockholders to rights to acquire additional shares of our common stock when a third party acquires 15.0% of our common stock or commences or announces its intent to commence a tender offer for at least 15.0% of our common stock, other than for certain stockholders that were stockholders prior to our initial public offering as to whom this threshold is 20.0%. This plan could delay, deter or prevent an investor from acquiring us in a transaction that could otherwise result in stockholders receiving a premium over the market price for their shares of common stock.
We may need to obtain financing in order to fund our growth strategy.
We believe that we have or will have access to capital sufficient to satisfy our working capital requirements for at least the next 12 months. However, it may become necessary for us to raise additional funds to support our growth. We cannot assure you that we will be able to obtain financing when needed or that, if available to us, the terms will be acceptable to us. If we issue equity securities in any financing, the new securities may have rights and preferences senior to our shares of common stock, and the ownership interest in us of our current stockholders will be proportionately reduced. If we issued debt securities, they will rank senior to all equity securities. If we are unable to raise additional capital, we may not be able to implement our growth strategy, and our business could be harmed significantly. Our future capital requirements will depend on many factors, including the amount of revenue we generate, the timing and extent of spending to support product development efforts, the expansion of sales and marketing activities, the timing of introductions of new products, the costs to ensure access to adequate manufacturing capacity, and the continuing market acceptance of our products, and any future business acquisitions that we might undertake. However, if we do not meet our plan, we could be required, or might elect, to seek additional funding through public or private equity or debt financing and additional funds may not be available on terms acceptable to us or at all. We also might decide to raise additional capital at such times and upon such terms as management considers favorable and in the interests of the Company. We may sell up to approximately an additional $120 million of our debt and/or equity securities (before reductions for expenses, underwriting discounts and commissions) under our existing shelf registration statement on Form S-3 which may result in an increase in the number of shares and decline in earnings per share. We may also sell securities pursuant to one ore more automatic shelf registration statements that become effective automatically upon filing with the Securities and Exchange Commission, provided we continue to meet the eligibility requirements for this form. We may sell these securities under these registration statements from time-to-time without prior announcement.
Executive Officers of the Registrant
The following table provides the names, ages and offices of each of our current executive officers:
|
Title
|
Age
|
Position
|
|||
|
Ronald Jankov
|
52 |
Director, Chief Executive Officer and President
|
|||
|
Behrooz Abdi
|
49 |
Executive Vice President and General Manager
|
|||
|
Michael Tate
|
44 |
Vice President and Chief Financial Officer
|
|||
|
Marcia Zander
|
48 |
Senior Vice President of Worldwide Sales
|
|||
|
Varadarajan Srinivasan
|
60 |
Vice President of Product Development and Chief Technical Officer
|
|||
|
Dimitrios Dimitrelis
|
53 |
Vice President of Engineering
|
|||
|
Mozafar Maghsoudnia
|
45 |
Vice President of Worldwide Manufacturing
|
|||
|
Ibrahim Korgav
|
62 |
Senior Vice President of Worldwide Business Operations
|
|||
|
Chris O'Reilly
|
38 |
Vice President of Marketing
|
|||
|
Roland Cortes
|
45 |
Vice President, General Counsel and Secretary
|
|||
Ronald Jankov has served as our President, Chief Executive Officer and as a member of our board of directors since April 2000. Prior to joining us, Mr. Jankov served as Senior Vice President at NeoMagic Corp. through its IPO in 1997, and Vice President of Cyrix Corporation through its IPO in 1993. Mr. Jankov began his career with various engineering and management positions at Texas Instruments and LSI Logic Corp.
Behrooz Abdi has served as our Executive Vice President and General Manager since he joined us in November 2009 as part of our acquisition of RMI Corporation. From November 2007 to October 2009, Mr. Abdi was President and Chief Executive Officer of RMI. From March 2004 to November 2007, Mr. Abdi was Senior Vice President and General Manager of Qualcomm CDMA Technologies at Qualcomm, Inc., a provider of integrated circuit products. Prior to Qualcomm, Mr. Abdi held leadership and engineering positions at Motorola in its Semiconductor Products Sector, now Freescale Semiconductor, Inc. His last role at Motorola was Vice President and General Manager for the Radio Products Division from July 1985 to December 2003.
Michael Tate has served as our Vice President of Finance and Chief Financial Officer since July 2007. Prior to joining us, Mr. Tate was interim chief financial officer, vice president, corporate controller, and treasurer at Marvell Technology Group Ltd., a semiconductor integrated circuit company. He joined Marvell in January 2001 as part of Marvell's acquisition of Galileo Technology Ltd. Prior to joining Marvell, from 1997 to 2001, he served in various senior financial management roles at Galileo Technology Ltd., including vice president of finance and chief financial officer. From 1994 to 1997, Mr. Tate held various senior financial management positions at S3 Incorporated. In addition, he served for more than five years at Deloitte & Touche LLP.
Marcia Zander has served as our Senior Vice President of Worldwide Sales since January 2006 and Vice President of Sales since July 1999. Prior to joining us, Ms. Zander was a top performer in semiconductor sales and sales management for QuadRep, Inc., a leading manufacturers representative firm. Before joining QuadRep, Ms. Zander held sales and sales management positions at AVX Corporation and Corning Electronics.
Varadarajan Srinivasan has served as our Vice President of Product Development since March 1996, as our Chief Technical Officer since August 2000. Dr. Varad Srinivasan co-founded us and is the principal designer of a number of our product architectures. Prior to co-founding us, Dr. Srinivasan was director of design at Quality Semiconductor. Before joining Quality in 1989, he designed the world's fastest bipolar PLD at Aspen Semiconductor. Before Aspen, Dr. Srinivasan was a design engineer at IDT, where he was a principal designer of the company's SRAMs, specialty and multi-port memories. He also designed DRAM and SRAM products at Fairchild Semiconductor.
Dimitrios Dimitrelis has served as our Vice President of Engineering since July 2002. From July 1999 to March 2002, Mr. Dimitrelis was Director of Engineering for Vitesse Semiconductor Corp., a communications integrated circuit company, where he was primarily responsible for the development of a 10G network processor. Before joining Vitesse, Dr. Dimitrelis spent 11 years at VLSI Technology where his last assignment was the management of the ARM peripherals development group. In this role, he managed teams responsible for development of ARM peripheral IP components and for the integration of ARM processors into VLSI's product portfolio.
Mozafar Maghsoudnia has served as our Vice President of Worldwide Manufacturing since January 2007, as Vice President of Manufacturing since August 2006, and Director of Technology since June 2003. From June 1988 to June 2003, Mr. Maghsoudnia was employed by Analog Devices, Inc., where he was responsible for wafer fabrication and technology in his last assignment.
Ibrahim Korgav has served as our Senior Vice President of Worldwide Business Operations since January 2007 and as our Senior Vice President of Manufacturing and Business Operations from March 2002 to January 2007. Prior to joining us, Mr. Korgav was a member of venture capital firm Global Catalyst Partners as an entrepreneur-in-residence. Prior to joining Global Catalyst Partners, he was at Zaffire, an optical transport systems company, as senior vice president of operations. Previously, Mr. Korgav was with NeoMagic as vice president of manufacturing operations from its early start-up stage and helped build it into a successful public company with more than $250 million in sales. Before NeoMagic, he co-founded Micro Linear and also worked at Seeq, Synertek, AMD and Siliconix in various manufacturing engineering and operations positions.
Chris O'Reilly has served as our Vice President of Marketing since August 2007. Prior to August 2007, Mr. O'Reilly served as our senior director of marketing, director of sales for the Asia Pacific region and senior marketing manager since 1999. Prior to joining us, Mr. O’Reilly was product marketing manager at Hitachi where he was responsible for the ASIC, microprocessors and microcontrollers product lines.
Roland Cortes has served as our Vice President, General Counsel and Secretary since April 2007. Prior to April 2007, Mr. Cortes served as our Secretary since May 2004, as our Senior Director of Legal Affairs and IP Management since July 2002, and as our Director of Legal Affairs and IP Management since April 1999. From December 1995 to April 1999, Mr. Cortes was an intellectual property attorney with Blakely, Sokoloff, Taylor & Zafman LLP, and from 1989 to 1995 held various engineering positions at semiconductor technology companies in San Jose, California.
|
UNRESOLVED STAFF COMMENTS.
|
Not applicable.
|
PROPERTIES.
|
The following table sets forth the location, and approximate square footage of each of the principal properties used by us during 2010. All properties are leased under operating leases which expire at various times through 2018.
|
Location
|
Approximate
Square Footage
|
|||
|
Santa Clara, California, USA
|
105,930 | |||
|
Austin, Texas, USA
|
15,630 | |||
|
Bangalore, India
|
20,860 | |||
In addition, we lease office spaces located at Toulouse in France, Beijing, Shanghai, Nanjing, and Shenzhen in China, Taipei and Hsinchu in Taiwan, Seoul in Korea, Tokyo in Japan, and Mumbai in India. We believe that these facilities are adequate for our current needs and that suitable additional or substitute space will be available as needed to accommodate foreseeable expansion of our operations.
|
LEGAL PROCEEDINGS.
|
We are not involved in any legal proceedings that management believes will have a material adverse effect our business, results of operations, financial position or cash flows.
|
Removed and Reserved.
|
Not applicable.
|
MARKET FOR REGISTRANT'S COMMON EQUITY, RELATED STOCKHOLDER MATTERS AND ISSUER PURCHASES OF EQUITY SECURITIES.
|
Market Information for Common Stock
Our common stock is traded on the Global Select Market of the NASDAQ Stock Market under the symbol "NETL". The following table sets forth, for the periods indicated, the intra-day high and low per share sale prices of our common stock, as reported on the Global Select Market.*
|
Price Range Per Share
|
||||||||
|
High
|
Low
|
|||||||
|
Fiscal 2010
|
||||||||
|
Fourth quarter
|
$ | 34.35 | $ | 25.12 | ||||
|
Third quarter
|
$ | 34.50 | $ | 22.94 | ||||
|
Second quarter
|
$ | 35.00 | $ | 25.29 | ||||
|
First quarter
|
$ | 31.49 | $ | 20.40 | ||||
|
Fiscal 2009
|
||||||||
|
Fourth quarter
|
$ | 24.00 | $ | 18.44 | ||||
|
Third quarter
|
$ | 23.40 | $ | 16.18 | ||||
|
Second quarter
|
$ | 19.25 | $ | 13.39 | ||||
|
First quarter
|
$ | 14.29 | $ | 9.84 | ||||
* Share price data have been retroactively adjusted as appropriate to reflect the two-for-one stock dividend we paid on March 19, 2010.
Holders
As of January 31, 2011, there were approximately 111 holders of record (not including beneficial holders of stock held in street names) of our common stock.
Dividend Policy
We have not declared or paid cash dividends on our common stock and do not anticipate paying any cash dividends in the foreseeable future. We expect to retain future earnings, if any, to fund the development and growth of our business. Our board of directors will determine future dividends, if any.
On February 16, 2010, the Board of Directors approved a two-for-one stock split of our common stock, to be effected pursuant to the issuance of additional shares as a stock dividend. The stock dividend was paid on March 19, 2010 to stockholders of record as of March 5, 2010. All share and per share amounts in this Form 10-K have been retroactively adjusted to reflect the stock split for all periods presented.
Securities Authorized for Issuance Under Equity Compensation Plans
See Item 12 of Part III of this Report regarding information about securities authorized for issuance under our equity compensation plans.
Performance Graph
The following graph shows the 5 years cumulative total stockholder return (change in stock price plus reinvested dividends) assuming the investment of $100 on December 31, 2005 in each of the Company's common stock, the S&P 500 Index and the Philadelphia Semiconductor Index. The comparisons in the table are required by the SEC and are not intended to forecast or be indicative of possible future performance of the Company's common stock.
COMPARISON OF 5 YEARS CUMULATIVE TOTAL RETURN
Among NetLogic Microsystems, Inc., the S&P 500 Index
and the Philadelphia Semiconductor Index
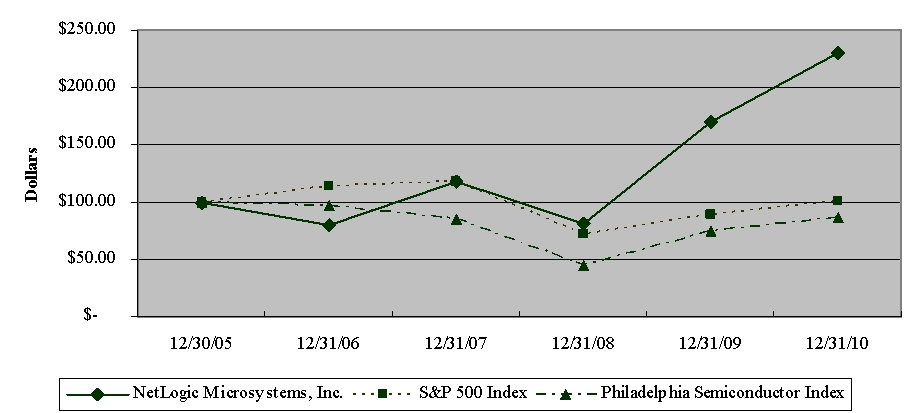
|
Cumulative Total Returns
|
||||||||||||||||||||||||
|
12/31/2005
|
12/31/2006
|
12/31/2007
|
12/31/2008
|
12/31/2009
|
12/31/2010
|
|||||||||||||||||||
|
NetLogic Micrsosystems, Inc.
|
$ | 100.00 | $ | 79.66 | $ | 118.21 | $ | 80.84 | $ | 169.82 | $ | 230.62 | ||||||||||||
|
S&P 500 Index
|
$ | 100.00 | $ | 113.62 | $ | 117.63 | $ | 72.36 | $ | 89.33 | $ | 100.75 | ||||||||||||
|
Philadelphia Semiconductor Index
|
$ | 100.00 | $ | 97.40 | $ | 85.10 | $ | 44.25 | $ | 75.06 | $ | 85.89 | ||||||||||||
Recent Sales of Unregistered Securities
During the fourth quarter of fiscal 2010, pursuant to the terms of the merger agreement for the RMI acquisition completed in October 30, 2009, we issued 2,400,000 shares of common stock as earn-out consideration to former stockholders of RMI upon the achievement of earn-out milestones for revenues generated from the products acquired from RMI during a 12-month period following the closing date of the acquisition from the products acquired from RMI. No underwriters were involved in the transaction. We issued these shares in a private offering exempt from the registration requirements under section 5 of the Securities Act of 1933 pursuant to Section 4(2) and Rule 506 under Regulation D.
|
SELECTED CONSOLIDATED FINANCIAL DATA.
|
The following selected consolidated financial data are qualified by reference to, and should be read in conjunction with, "Management's Discussion and Analysis of Financial Condition and Results of Operations" and the Financial Statements and related Notes included in Item 8 of this report, which discusses factors affecting the comparability of such financial data.
The selected balance sheet data as of December 31, 2010 and 2009 and selected statements of operations data for the years ended December 31, 2010, 2009 and 2008 are derived from our audited financial statements included elsewhere in this report. The selected balance sheet data as of December 31, 2008, 2007 and 2006 and the selected statements of operations data for the years ended December 31, 2007 and 2006 were derived from financial statements not included in this report. Our historical results are not necessarily indicative of our future results. All share and per share amounts presented below have been retroactively adjusted to reflect the 2-for-1 stock split of our common stock that was paid on March 19, 2010 to stockholders of record as of March 5, 2010.
|
Year Ended December 31,
|
||||||||||||||||||||
|
2010
|
2009
|
2008
|
2007
|
2006
|
||||||||||||||||
|
(in thousands, except per share data)
|
||||||||||||||||||||
|
Statements of Operations Data:
|
||||||||||||||||||||
|
Revenue
|
$ | 381,745 | $ | 174,689 | $ | 139,927 | $ | 109,033 | $ | 96,806 | ||||||||||
|
Cost of revenue
|
173,427 | 99,251 | 61,616 | 44,732 | 36,762 | |||||||||||||||
|
Gross profit
|
208,318 | 75,438 | 78,311 | 64,301 | 60,044 | |||||||||||||||
|
Operating expenses:
|
||||||||||||||||||||
|
Research and development
|
127,697 | 73,631 | 51,607 | 45,175 | 36,578 | |||||||||||||||
|
In-process research and development
|
- | - | - | 1,610 | 10,700 | |||||||||||||||
|
Selling, general and administrative
|
78,879 | 43,931 | 26,567 | 19,672 | 15,455 | |||||||||||||||
|
Change in contingent earn-out liability
|
71,725 | 2,008 | - | - | - | |||||||||||||||
|
Acquisition-related costs
|
735 | 5,412 | - | - | - | |||||||||||||||
|
Total operating expenses
|
279,036 | 124,982 | 78,174 | 66,457 | 62,733 | |||||||||||||||
|
Income (loss) from operations
|
(70,718 | ) | (49,544 | ) | 137 | (2,156 | ) | (2,689 | ) | |||||||||||
|
Interest and other income (expense), net:
|
||||||||||||||||||||
|
Interest income
|
409 | 992 | 1,595 | 4,431 | 3,737 | |||||||||||||||
|
Interest expense
|
(480 | ) | (1,666 | ) | (33 | ) | - | - | ||||||||||||
|
Other income (expense), net
|
(54 | ) | (4 | ) | (59 | ) | 32 | 3 | ||||||||||||
|
Total interest and other income (expense), net
|
(125 | ) | (678 | ) | 1,503 | 4,463 | 3,740 | |||||||||||||
|
Income (loss) before income taxes
|
(70,843 | ) | (50,222 | ) | 1,640 | 2,307 | 1,051 | |||||||||||||
|
Provision for (benefit from) income taxes
|
(4,472 | ) | (3,060 | ) | (1,937 | ) | (288 | ) | 459 | |||||||||||
|
Net income (loss)
|
$ | (66,371 | ) | $ | (47,162 | ) | $ | 3,577 | $ | 2,595 | $ | 592 | ||||||||
|
Net income (loss) per share - basic
|
$ | (1.10 | ) | $ | (1.02 | ) | $ | 0.08 | $ | 0.06 | $ | 0.01 | ||||||||
|
Net income (loss) per share - diluted
|
$ | (1.10 | ) | $ | (1.02 | ) | $ | 0.08 | $ | 0.06 | $ | 0.01 | ||||||||
|
Shares used in calculation - basic
|
60,426 | 46,182 | 42,944 | 41,494 | 39,516 | |||||||||||||||
|
Shares used in calculation - diluted
|
60,426 | 46,182 | 44,628 | 43,876 | 42,214 | |||||||||||||||
|
December 31,
|
||||||||||||||||||||
| 2010 | 2009 | 2008 | 2007 | 2006 | ||||||||||||||||
|
(in thousands)
|
||||||||||||||||||||
|
Balance Sheet Data:
|
||||||||||||||||||||
|
Cash and cash equivalents and short-term investments
|
$ | 256,167 | $ | 44,278 | $ | 96,541 | $ | 50,689 | $ | 89,879 | ||||||||||
|
Working capital
|
278,311 | 67,008 | 87,853 | 63,956 | 95,986 | |||||||||||||||
|
Total assets
|
712,589 | 531,872 | 245,771 | 203,151 | 157,769 | |||||||||||||||
|
Software licenses and other obligations
|
6,547 | 5,446 | 1,219 | 2,528 | 2,625 | |||||||||||||||
|
Stockholders' equity
|
618,913 | 425,955 | 200,267 | 171,888 | 142,524 | |||||||||||||||
The selected consolidated financial data presents financial information in the relevant periods for the acquisition of the IDT NSE business in July 2009, the acquisition of RMI Corporation completed in late October 2009, the acquisition of the TCAM2 and TCAM-CR network search engine products and certain related assets from Cypress Semiconductor Corporation in August 2007, the acquisition of Aeluros, Inc. completed in late October 2007, and the acquisition of NSE Business from Cypress Semiconductor Corporation completed in February 2006. See Note 2 of Notes to Consolidated Financial Statements under Item 8 of this Annual Report on Form 10-K for further discussion of recent acquisitions. The comparability of the data in the table above is also affected by our adoption of various new accounting guidance in the periods presented, specifically, those related to business combinations in 2009 and income taxes in 2007.
|
MANAGEMENT'S DISCUSSION AND ANALYSIS OF FINANCIAL CONDITION AND RESULTS OF OPERATIONS.
|
Overview
We are a leading fabless semiconductor company that designs, develops and sells proprietary high-performance processors and high speed integrated circuits that are used to enhance the performance, functionality and energy efficiency of advanced mobile wireless infrastructure, data center, enterprise, metro Ethernet, edge and core infrastructure networks. Our market-leading product portfolio includes high-performance multi-core communications processors, knowledge-based processors, high-speed 10/40/100 Gigabit Ethernet physical layer devices, network search engines, and ultra low-power embedded processors. These products are designed into high-performance systems such as switches, routers, wireless base stations, access aggregation, radio network controllers, security appliances, networked storage appliances, service gateways and connected media devices offered by leading original equipment manufacturers (OEMs) such as Alcatel-Lucent, Brocade Communications Systems, Cisco Systems, Dell Inc., Ericsson, Finisar Corporation, Hewlett-Packard, Huawei Technologies Co. Ltd, Juniper Networks, Inc., McAfee, Inc., Motorola, Inc., Nokia Siemens Networks, Tellabs, Inc., and ZTE Corporation.
The products and technologies we have developed and acquired are targeted to enable our customers to develop systems that support the increasing speeds and complexity of Internet Protocol (IP) networks. We believe there is a growing need to include high-performance multi-core processors, knowledge-based processors and high speed physical layer devices in a larger number of IP equipment as networks transition to all Internet Protocol packet processing at increasing speeds and complexity.
The equipment and systems that use our products are technically complex. As a result, the time from our initial customer engagement design activity to volume production can be lengthy and may require considerable support from our design engineering, research and development, sales, and marketing personnel in order to secure the engagement and commence product sales to the customer. Once the customer’s equipment is in volume production, however, it generally has a life cycle of three to five years and requires less ongoing support.
We derive revenue primarily from sales of semiconductor products to OEM and their contract manufacturers, and to our distributors and international sales representatives. Usually, we initially sell product for a new design directly to OEM customers. Once their design enters production, the OEM customers frequently outsource their manufacturing to contract manufacturers that purchase our products directly from us or from our distributors and international sales representatives. We maintain inventory, or “hubbing”, arrangements with some of these customers, including our largest customer, Cisco and its supplier, Wintec Industries. Pursuant to these arrangements, we deliver products to a customer, an intermediary or a designated third party warehouse based upon the customer’s projected needs, but do not recognize product revenue unless and until the customer, intermediary or third-party warehouse reports it has removed, or pulled, our product from the warehouse to be incorporated into the customers’ end products.
We also use distributors to provide valuable assistance to end-users in delivery of our products and related services. Our distributors are used to support our international sales logistic principally in Asia. In accordance with standard market practice, our distributor agreements generally limit the distributor’s ability to return product up to a portion of purchases in the preceding quarter and limit price protection for inventory on-hand if it subsequently lowers prices on our products. We recognize revenue from sales through distributors at the time of shipment to end customers reported by our distributors.
As a fabless semiconductor company, our business is less capital intensive than others because we rely on third parties to manufacture, assemble, and test our products. In general, we do not anticipate making significant capital expenditures aside from business acquisitions that we might make from time to time. In the future, as we launch new products or expand our operations, however, we may require additional funds to procure product mask sets, order elevated quantities of wafers from our foundry partners, perform qualification testing and assemble and test those products.
Because we purchase all wafers from suppliers with fabrication facilities and outsource the assembly and testing to third party vendors, a significant portion of our cost of revenue consists of payments to third party vendors.
Recent Acquisitions
On October 30, 2009, we completed our acquisition of RMI Corporation (RMI), a provider of high-performance and low-power communication, multi-threaded processors and delivered merger consideration of approximately 9.9 million shares of the our common stock (valued at $188.5 million) and $12.6 million cash to the paying agent for distribution to the former holders of RMI capital stock. Additionally, in December 2010 we issued approximately 2.4 million shares of our common stock and paid $11.5 million cash to the former holders of RMI capital stock as earn-out consideration based upon achievement of 95.3% of revenue targets for the 12-month period from November 1, 2009 through October 31, 2010.
On July 17, 2009, we completed the IDT NSE acquisition. The acquisition was accounted for as a business combination during the third quarter of 2009. As purchase consideration we paid $98.2 million in cash, net of a price adjustment based on a determination of the actual amount of inventory received.
On October 24, 2007, we completed the acquisition of Aeluros, Inc. which was accounted for as a business combination during the fourth quarter of 2007. We paid $57.1 million in cash upon the closing of the transaction. Under the terms of the definitive agreement, we paid additional $15.5 million cash in February 2009 based on the attainment of revenue performance milestones for the acquired business during the one year period following the close of the transaction.
Our results of operations for the year ended December 31, 2008 and 2009 did not include revenues and costs associated with the RMI and IDT NSE acquisitions prior to their respective acquisition dates of October 30, 2009 and July 17, 2009 whereas the results of operations in 2010 reflect revenues and costs attributable to the combined company and consequently are substantially higher than the results in 2008 and 2009.
Outlook and Challenges
Our year-over-year net revenue increased from $174.7 million for the year ended December 31, 2009 to $381.7 million for the year ended December 31, 2010 as a result of our RMI and IDT acquisitions, and also due the improved demand of all of our products due to the continued growth for demand of products that enable the build out of the wireless Internet infrastructure. In order to support our growing business operations we increased our worldwide hiring by adding 95 new employees and improving our processes and systems related to our management information and enterprise resource planning systems to keep in pace with our breadth and scale of business while maintaining regulatory compliance. Our integration of the IDT NSE business and RMI included the continued assimilation of employees, retention of key personnel and existing customers, and acquitision of new customers.
Our product revenue is concentrated among a small number of large customers. For the year ended December 31, 2010, our top five customers in terms of revenue accounted for approximately 58% of total product revenue. Although we believe our revenues will continue to be concentrated among our largest customers, because of concentration in the networking equipment business, we expect that continued favorable market trends, such as the increasing number of 10 Gigabit ports as enterprises and datacenters upgrade their legacy networks to better accommodate the proliferation of video and virtualization applications, and the growing mobile wireless infrastructure and IPTV markets, will enable us to broaden our customer base. Additionally, our expanding product portfolio will also help us further diversify our customer and product revenues as well as expand our offerings to our existing customers.
For 2010, 30% of our product revenue was realized through inventory, or “hubbing”, arrangements with certain customers, including our largest customer, Cisco and its supplier, Wintec Industries. We expect more of our larger customers to adopt these hubbing arrangements in the future. Pursuant to these arrangements, we deliver products to a customer, an intermediary or a designated third party warehouse based upon the customer’s projected needs, but do not recognize product revenue unless and until the customer, intermediary or third-party warehouse reports it has removed, or pulled, our product from the warehouse to be incorporated into the customers’ end products. Historically, we have had reasonable visibility of our customers’ requirements within a quarter, and typically commit resources and incur expense based on our projections. However, if a customer that uses a hubbing arrangement does not take delivery of products in accordance with the schedule it originally provided to us, our predicted future revenue stream could vary substantially from our forecasts, and our results of operations could be materially and adversely affected. In addition, although we own the inventory physically located at these hubs, our ability to effectively manage inventory levels may be restricted, causing our total inventory levels to increase. This, in turn, could increase our expenses associated with excess and obsolete product and negatively impact our cash flows.
Critical Accounting Policies and Estimates
The preparation of financial statements and related disclosures in conformity with accounting principles generally accepted in the U.S. requires management to make fair and reasonable estimates and assumptions that affect reported amounts of assets, liabilities and operating expenses during the period reported. The following accounting policies require management to make estimates and assumptions. These estimates and assumptions are reviewed periodically and the effects of revisions are reflected in the period they are determined to be necessary. If actual results differ significantly from management's estimates, our financial statements could be materially impacted. Our estimates are guided by observing the following critical accounting policies.
Revenue Recognition. We derive our revenue primarily from sales of semiconductor products. We recognize revenue when all of the following criteria have been met: (i) persuasive evidence of a binding arrangement exists, (ii) delivery has occurred, (iii) the price is deemed fixed or determinable and free of contingencies and significant uncertainties, and (iv) collection is probable. The price is considered fixed or determinable at the execution of an agreement, based on specific products and quantities to be delivered at specified prices, which is often memorialized with a customer purchase order. We assess the ability to collect from our customers based on a number of factors, including credit worthiness and any past transaction history of the customer.
Shipping charges billed to customers are included in product revenue and the related shipping costs are included in cost of revenue. Revenue consists primarily of sales of our products to OEM customers and their contract manufacturers, and to our distributors and international sales representatives. Initial sales of our products for a new design are usually made directly to OEM customers as they design and develop their product. Once their design enters production, they often outsource their manufacturing to contract manufacturers that purchase our products directly from us or from our distributors and international sales representatives.
We generally recognize revenue at the time of shipment to OEM customers and their contract manufacturers and our international sales representatives. Product revenue and costs relating to sales made through distributors with rights of return and price credits are deferred until the distributors sell the product to end customers because the selling price is not fixed and determinable and we are not able to estimate future returns. Revenue recognition depends on notification from the distributor that product has been sold to an end customers. On each reporting date we record a reduction in accounts receivable and deferred revenue based on our estimate of the margin to be ultimately recognized upon sale of the product to end customers.
We deliver and maintain inventory, or “hubbing” arrangements with certain customers, including our largest customer, Cisco and its supplier, Wintec Industries, as described above. We generally recognize revenue when the customer, intermediary or third-party warehouse reports it has removed, or pulled, our product from the warehouse to be incorporated into the customers’ end products.
We have also entered into licensing agreements with some of our customers. For these license arrangements we recognize revenue under the proportionate performance method provided that fees are fixed or determinable and collectability is probable. When such license arrangements contain multiple elements (e.g., license grants and services), we review each element to determine the separate units of accounting that exist within the agreement. If more than one unit of accounting exists, we generally allocate consideration payable to us under the agreement to each unit of accounting using the relative fair value method. We recognize revenue for each unit of accounting when the revenue recognition criteria have been met for that unit of accounting.
Inventory Valuation and Adverse Purchase Commitments. We value our inventories at the lower of cost or market. We record inventory reserves for estimated obsolescence or unmarketable inventories based upon assumptions about future demand and market conditions. These estimates are generally based on a 12-month forecast prepared by management. Once a reserve is established, it is maintained until the product to which it relates is sold or otherwise disposed of. If actual market conditions are less favorable than those expected by management, additional adjustment to inventory valuation may be required. The carrying value of inventory and the determination of possible adverse purchase commitments are dependent on our estimate of the yield that will be achieved, or the percent of good products identified when the product is tested.
Warranty Accrual. We provide a limited warranty on our products for a period ranging from one to five years from the date of sale. We accrue for the estimated future costs of repair or replacement when revenue is recognized for products sold. The warranty accrual is estimated based on historical claims compared to actual revenue.
Allowance for Doubtful Accounts. In order to determine the collectability of our accounts receivable, we continually assess factors such as previous customer transactions and the credit-worthiness of the customer. To date, our accounts receivable write-offs have been immaterial. We maintain allowances for doubtful accounts for estimated losses resulting from the inability of certain customers to make required payments. In general, we establish allowances for accounts aged over 90 days from the invoice date, unless specific circumstances indicate that the balance is collectible.
Accounting for Income Taxes. We account for income taxes under an asset and liability approach that requires the recognition of deferred tax liabilities and assets for the expected future tax consequences of timing differences between the carrying amounts and the tax bases of assets and liabilities. Valuation allowances are established when necessary to reduce deferred tax assets to amounts expected to be realized.
We also recognize liabilities for uncertain tax positions based on a two-step process prescribed in Accounting Standards Code (“ASC”) 740-10, Income Taxes. The first step is to evaluate the tax position for recognition by determining if the weight of available evidence indicates that it is more likely than not that the position will be sustained on audit, including resolution of related appeals or litigation processes, if any. The second step requires us to estimate and measure the tax benefit as the largest amount that is more than 50% likely to be realized upon ultimate settlement. It is inherently difficult and subjective to estimate such amounts, as we have to determine the probability of various possible outcomes. We reevaluate these uncertain tax positions on a quarterly basis. This evaluation is based on many factors, including, but not limited to, changes in facts or circumstances, changes in tax law, effectively settled issues under audit, and new audit activity. Such a change in recognition or measurement would result in the recognition of a tax benefit or an additional charge to the tax provision.
Cash, Cash Equivalents and Marketable Securities. We consider all highly liquid investments purchased with a remaining maturity of three months or less at the date of purchase to be cash equivalents. We diversify our deposits with high credit quality financial institutions. Deposits held in money market funds are stated at cost, which approximates market value. Money market deposits are readily convertible to cash and are classified as cash equivalents. Marketable securities held by us, which are all available-for-sale investments and carried at fair value, consist of U.S. government agency securities and U.S. treasury securities. The cost of securities sold is accounted for based on the specific identification method. Marketable securities with remaining contractual maturities on the date of purchase greater than 90 days are classified as short-term even though the contractual maturities may be greater than one year because such investments, which are highly liquid, represent funds available for use in current operations. These investments are monitored for impairment periodically and reductions in carrying value are recorded against earnings when the declines are determined to be other-than-temporary.
Long-term Investments. From time to time we make debt and equity investments in non-publicly traded companies where we are not the primary beneficiary. These investments are included in “Other assets” on our Consolidated Balance Sheets. Debt investments are available-for-sale investments and are carried at fair value. Equity investments are accounted for under the cost method as we do not have the ability to exercise significant influence over the respective investee’s operating and financial policies. We monitor our available-for-sale debt investments and cost-method equity investments in non-publicly traded companies for impairment on a quarterly basis and record appropriate reductions in carrying values against earnings when such impairments are determined to be other-than-temporary. Factors considered in determining an impairment include, but are not limited to, the current business environment including competition and uncertainty of financial condition, going concern considerations such as the rate at which the investee company utilizes cash and the investee company’s ability to obtain additional private financing to fulfill its stated business plan, the need for changes to the investee company’s existing business model due to changing business environments and its ability to successfully implement necessary changes, and comparable valuations. If an investment is determined to be impaired, a further assessment is made as to whether such impairment is other-than-temporary.
Long-lived Assets and Intangible Assets. We assess the impairment of long-lived assets and intangible assets whenever events or changes in circumstances indicate that the carrying value of such assets may not be recoverable. Whenever events or changes in circumstances suggest that the carrying amount of long-lived assets may not be recoverable, we estimate the future cash flows expected to be generated by the asset from its use or eventual disposition. If the sum of the expected future cash flows, which includes revenue, is less than the carrying amount of those assets, we recognize an impairment loss based on the excess of the carrying amount over the fair value of the assets. Significant management judgment is required in the forecasts of future operating results that are used in the discounted cash flow method of valuation.
Goodwill. Goodwill is recorded as the difference, if any, between the aggregate consideration paid for an acquisition and the fair value of the net tangible and intangible assets acquired and liabilities assumed. We evaluate goodwill for impairment at least on an annual basis or whenever events and changes in circumstances suggest that the carrying amount may not be recoverable from its estimated future cash flow. We perform goodwill impairment test for each reporting unit. If the fair value of the reporting unit exceeds the carrying value of the reporting unit, goodwill is not impaired. We perform our goodwill impairment assessment at the Company level, which is our sole reporting unit. We performed our annual goodwill impairment test in the fourth quarter and concluded there was no impairment of goodwill during the years ended December 31, 2010, 2009 and 2008.
Stock-based Compensation. We estimate the fair value of stock options and employee stock purchase plan awards using the Black-Scholes-Merton valuation model which requires the input of highly subjective assumptions, including the option's expected life, the price volatility of the underlying stock, future forfeitures and related tax effects. When establishing the expected life assumption, we review on a semi-annual basis the historical employee exercise behavior with respect to grants and awards with similar vesting periods. The expected stock price volatility assumption was determined using a combination of the historical and implied volatility of the Company's common stock. Changes in the subjective assumptions required in the valuation models may significantly affect the estimated value of the awards, the related stock-based compensation expense and, consequently, our results of operations.
Results of Operations
Comparison of Year Ended December 31, 2010 to Year Ended December 31, 2009
Revenue, cost of revenue and gross profit
The table below sets forth the fluctuations in revenue, cost of revenue and gross profit data for the years ended December 31, 2010 and 2009 (in thousands, except percentage data):
|
Year ended
December 31,
2010
|
Percentage
of
Revenue
|
Year ended
December 31,
2009
|
Percentage
of
Revenue
|
Year-to-Year
Change
|
Percentage
Change
|
|||||||||||||||||||
|
Revenue
|
$ | 381,745 | 100.0 | % | $ | 174,689 | 100.0 | % | $ | 207,056 | 118.5 | % | ||||||||||||
|
Cost of revenue
|
173,427 | 45.4 | % | 99,251 | 56.8 | % | 74,176 | 74.7 | % | |||||||||||||||
|
Gross profit
|
$ | 208,318 | 54.6 | % | $ | 75,438 | 43.2 | % | $ | 132,880 | 176.1 | % | ||||||||||||
Revenue. Revenue for the year ended December 31, 2010 increased by $207.1 million compared with that of the year ended December 31, 2009. Revenue from sales to Wintec, Cisco and Cisco's contract manufacturers (collectively "Cisco") represented $102.6 million of our total revenue for the year ended December 31, 2010, compared with $61.7 million during the year ended December 31, 2009. The increase in sales to Cisco was primarily due to an increase of $24.1 million from sales of knowledge based processors, $13.8 million in revenue from sales of NetLite processors and network search engine products, and $3.0 million in revenue from sales of communication processors. Revenue from non-Cisco customers represented $279.2 million of total revenue for the year ended December 31, 2010 compared with $113.0 million during the year end December 31, 2009. Increased revenues from sales of our products to non-Cisco customers primarily consisted of $70.9 million from communication processors, $16.5 million from physical layer products, $29.8 million from NetLite processors and network search engine products, $25.5 million from knowledge based processors, and $23.1 million from ultra low-power embedded processors. During the year ended December 31, 2010, Alcatel-Lucent accounted for 10% of our total revenue compared with 13% in 2009, and Huawei accounted for 12% of our total revenue compared with 10% in 2009. The IDT NSE acquisition which closed in July 2009 added products to our existing networks search engine solutions while the RMI acquisition which closed in October 2009 broadened our product offerings to include communication processors and ultra-low power embedded processors. Of the 119% increase in revenue in the year ended December 31, 2010 over the same period in 2009, 70% was represented by revenue from products that we acquired in the IDT NSE and RMI acquisitions.
Cost of Revenue/Gross Profit/Gross Margin. Cost of revenue for the year ended December 31, 2010 increased by $74.2 million compared with that of the year ended December 31, 2009. Cost of revenue increased primarily due to the increase in product sales, an increase in the provision for excess/obsolete inventory, an increase in amortization of intangible assets, and a decrease in fair value adjustments related to acquired inventory. As a result of IDT NSE and RMI acquisitions during 2009, amortization of intangible assets increased from $18.9 million for the year ended December 31, 2009 to $39.5 million for the year ended December 31, 2010. Due to the depletion of acquired inventory, fair market value adjustments for acquired inventory decreased from $20.4 million for the year ended December 31, 2009 to $16.0 million for the year ended December 31, 2010. In addition, provision for excess/obsolete inventory increased from $1.9 million for the year ended December 31, 2009 to $6.1 million for the year ended December 31, 2010. Gross margin for the year ended December 31, 2010 increased to 54.6% compared with 43.2% for the year ended December 31, 2009, primarily due to higher sales levels to absorb charges such as amortization of intangible assets and fair value adjustments related to acquired inventory, and a favorable change in product mix.
Operating expenses
The table below sets forth operating expense data for the years ended December 31, 2010 and 2009 (in thousands, except percentage data):
|
Year ended
December 31,
2010
|
Percentage
of
Revenue
|
Year ended
December 31,
2009
|
Percentage
of
Revenue
|
Year-to-Year
Change
|
Percentage
Change
|
|||||||||||||||||||
|
Operating expenses:
|
||||||||||||||||||||||||
|
Research and development
|
$ | 127,697 | 33.5 | % | $ | 73,631 | 42.1 | % | $ | 54,066 | 73.4 | % | ||||||||||||
|
Selling, general and administrative
|
78,879 | 20.7 | % | 43,931 | 25.1 | % | 34,948 | 79.6 | % | |||||||||||||||
|
Change in contingent earn-out liability
|
71,725 | 18.8 | % | 2,008 | 1.1 | % | 69,717 | - | ||||||||||||||||
|
Acquisition-related costs
|
735 | 0.2 | % | 5,412 | 3.1 | % | (4,677 | ) | - | |||||||||||||||
|
Total operating expenses
|
$ | 279,036 | 73.1 | % | $ | 124,982 | 71.5 | % | $ | 154,054 | 123.3 | % | ||||||||||||
Research and Development Expenses. Research and development expenses increased during the year ended December 31, 2010, as compared with the same period in 2009, primarily due to increases in payroll and payroll related expenses of $20.8 million, stock-based compensation expenses of $4.2 million, infrastructure expenses of $5.1 million, product development and qualification expenses of $9.4 million, software licenses expenses of $3.8 million, consulting services of $6.0 million, depreciation expenses of $3.4 million, and travel expenses of $1.0 million. The increase in payroll and payroll related expenses, infrastructure expenses, travel expenses and stock-based compensation expenses was primarily due to increases in engineering headcount to support our new product development efforts, and as a result of the RMI acquisition in October 2009. The increase in product development and qualification expense, and consulting services was primarily due to the production qualification and characterization of new products submitted for tape-out. The increase in software licenses expenses and depreciation expenses was primarily due to increased activity levels in research and development projects. The remainder of the increase in research and development expenses was caused by individually minor items. We expect the amount of research and development expenses to increase in total and may increase as a percentage of revenues in 2011 due to additional hiring, training and systems support for the development of new products and improvement of existing products.
Selling, General and Administrative Expenses. Selling, general and administrative expenses increased during the year ended December 31, 2010, as compared with the same period in fiscal 2009, primarily due to increases in payroll and payroll related expenses of $14.1 million, stock-based compensation expenses of $3.3 million, infrastructure expenses of $2.2 million, consulting services of $4.1 million, legal expenses of $2.8 million, marketing and commission expenses of $3.4 million, and travel expenses of $1.7 million. The increase in payroll and payroll related expenses, stock-based compensation expenses and travel expenses resulted primarily from increases in headcount to support our growing operations in the sales and marketing areas, and as a result of the RMI acquisition in October 2009. The increase in consulting expenses, and marketing and commission expenses was primarily due to increased level of selling and marketing activity, including activities to support the acquired RMI products. Legal expenses increased primarily for additional patent prosecution work. Selling, general and administrative expenses also included $3.7 million of amortization expense for intangible assets comprised of customer contracts and relationships, tradenames and trademarks, and non-competition agreements intangible assets for the year ended December 31, 2010, compared with $1.8 million in the same period in 2009. The remainder of the fluctuation in selling, general and administrative expenses was caused by individually minor items We expect that selling, general and administrative expenses to will increase in dollar amount and may increase as a percentage of revenues in 2011 because we expect to continue to invest in hiring and training additional employees and making other additional investments required to support our growing sales and marketing activities resulting from our expanded product portfolio.
Change in contingent earn-out liability. The change in contingent earn-out liability payable to the former holders of RMI capital stock was due to an increase in the market price of our common stock as well as the actual achievement of revenue earn-out target of approximately 95.3% at October 31, 2010, compared to our stock price and our estimated earn-our achievement of approximately 80% at December 31, 2009. The total earn-out payment for the RMI acquisition was accrued and paid in 2010 and will not recur in 2011. There may be similar charges in 2011 if we complete any acquisitions that involve deferred, contingent payments of this nature, however.
Acquisition-Related Costs. Acquisition and integration related costs associated with our IDT NSE and RMI acquisitions declined from $5.4 million for the year ended December 31, 2009 to $0.7 million for the same period in 2010. The savings primarily related to $1.9 million of reduced legal expenses, $0.9 million of reduced severance expenses, and reduced fees for various consulting, outside vendor services, and other professional services.
Other items
The tables below set forth other items for the years ended December 31, 2010 and 2009 (in thousands, except percentage data):
|
Year ended
December 31,
2010
|
Percentage
of
Revenue
|
Year ended
December 31,
2009
|
Percentage
of
Revenue
|
Year-to-Year
Change
|
Percentage
Change
|
|||||||||||||||||||
|
Interest and other income (expense), net:
|
||||||||||||||||||||||||
|
Interest income
|
$ | 409 | 0.1 | % | $ | 992 | 0.6 | % | $ | (583 | ) | -58.8 | % | |||||||||||
|
Interest expense
|
(480 | ) | -0.1 | % | (1,666 | ) | -1.0 | % | 1,186 | -71.2 | % | |||||||||||||
|
Other income (expense), net
|
(54 | ) | 0.0 | % | (4 | ) | 0.0 | % | (50 | ) | - | |||||||||||||
|
Total interest and other income (expense), net
|
$ | (125 | ) | -0.1 | % | $ | (678 | ) | -0.4 | % | $ | 553 | -81.6 | % | ||||||||||
Interest Income. Interest income decreased during the year ended December 31, 2010, as compared with fiscal 2009, primarily due to the absence of interest income from an RMI bridge loan which was extinguished in October 2009.
Interest Expense. Interest expense decreased during the year ended December 31, 2010, as compared with fiscal 2009, primarily due to the absence of interest costs associated with servicing outstanding line of credit and term notes during 2009. The line of credit and term notes were fully repaid in December 2009.
Other Income (Expense), net. Other income and (expense), net during the year ended December 31, 2010 did not fluctuate significantly from fiscal 2009.
|
Year ended
December 31,
2010
|
Percentage
of
Pre-Tax Income
|
Year ended
December 31,
2009
|
Percentage
of
Pre-Tax Income
|
Year-to-Year
Change
|
Percentage
Change
|
|||||||||||||||||||
|
Benefit from income taxes
|
$ | (4,472 | ) | 6.3 | % | $ | (3,060 | ) | 6.1 | % | $ | (1,412 | ) | 46.1 | % | |||||||||
Benefit from income taxes. During the year ended December 31, 2010, we recorded an income tax benefit of $4.5 million. Our effective tax rate of 6.3% for the year ended December 31, 2010 was primarily driven by a research and development tax credits, book losses generated in the United States, and the tax impact of non-deductible expenses such as stock-based compensation expenses and acquisition related expenses.
Results of Operations
Comparison of Year Ended December 31, 2009 to Year Ended December 31, 2008
Revenue, cost of revenue and gross profit
The table below sets forth the fluctuations in revenue, cost of revenue and gross profit data for the years ended December 31, 2009 and 2008 (in thousands, except percentage data):
|
Year ended
December 31,
2009
|
Percentage
of
Revenue
|
Year ended
December 31,
2008
|
Percentage
of
Revenue
|
Year-to-Year
Change
|
Percentage
Change
|
|||||||||||||||||||
|
Revenue
|
$ | 174,689 | 100.0 | % | $ | 139,927 | 100.0 | % | $ | 34,762 | 24.8 | % | ||||||||||||
|
Cost of revenue
|
99,251 | 56.8 | % | 61,616 | 44.0 | % | 37,635 | 61.1 | % | |||||||||||||||
|
Gross profit
|
$ | 75,438 | 43.2 | % | $ | 78,311 | 56.0 | % | $ | (2,873 | ) | -3.7 | % | |||||||||||
Revenue. Revenue for the year ended December 31, 2009 increased by $34.8 million compared with the year ended December 31, 2008. Revenue from sales to Cisco represented $61.7 million of our total revenue for the year ended December 31, 2009, compared to $52.7 million during the year ended December 31, 2008. The increase in sales to Cisco was primarily due to an increase of $8.5 million in revenue from network search engine products from our IDT NSE acquisition, $1.1 million from communication processors from our RMI acquisition, and $9.0 million in revenue from sales of our new knowledge-based processors to Cisco, including the NL7000 and NL8000. The increase was partially offset by a decrease of $10.4 million in sales of our NL5000 and network search engine products. Revenue from non-Cisco customers represented $113.0 million of total revenue for the year ended December 31, 2009 compared with $87.2 million during the year end December 31, 2008. The increase in sales to non-Cisco customers was primarily due to an increase of $7.8 million in revenue from network search engine products we acquired in the IDT NSE acquisition, $13.3 million from communication and ultra low-power embedded processors we acquired in the RMI acquisition, and $16.2 million in revenue from sales of our new knowledge based processors, including the NL7000 and NL9000. This increase was partially offset by a decrease of $13.3 million in sales of our NL5000, network search engine products and physical layer products. During the year ended December 31, 2009 and 2008, Alcatel-Lucent accounted for 13% of our total revenue compared with 12% in 2008, and Huawei accounted for 10% of our total revenue and was below 10% in 2008. Of the 25% increase in revenue in the year ended December 31, 2010 over the same period in 2009, 22% was represented by revenue from products that we acquired in the IDT NSE and RMI acquisitions.
Cost of Revenue/Gross Profit/Gross Margin. Cost of revenue for the year ended December 31, 2009 increased by $37.6 million compared with the year ended December 31, 2008. Cost of revenue increased primarily due to the increase in product sales, amortization of intangible assets, and fair value adjustments related to acquired inventory. The increases in amortization of intangible assets and fair value adjustments related to acquired inventory were attributable to the IDT NSE and RMI acquisitions. Cost of revenue for the years ended December 31, 2009 and 2008, respectively, included $18.9 million and $11.9 million of amortization of intangible assets expense, $1.9 million and $2.4 million of a provision for excess and obsolete inventory, and $20.4 million and $1.5 million of a fair value adjustment related to acquired inventory. Gross margin for the year ended December 31, 2009 decreased by 12.8% compared with 2008, primarily due to increases in amortization of intangible assets and fair value adjustments related to acquired inventory.
Operating expenses
The table below sets forth operating expense data for the years ended December 31, 2009 and 2008 (in thousands, except percentage data):
|
Year ended
December 31,
2009
|
Percentage
of
Revenue
|
Year ended
December 31,
2008
|
Percentage
of
Revenue
|
Year-to-Year
Change
|
Percentage
Change
|
|||||||||||||||||||
|
Operating expenses:
|
||||||||||||||||||||||||
|
Research and development
|
$ | 73,631 | 42.1 | % | $ | 51,607 | 36.9 | % | $ | 22,024 | 42.7 | % | ||||||||||||
|
Selling, general and administrative
|
43,931 | 25.1 | % | 26,567 | 19.0 | % | 17,364 | 65.4 | % | |||||||||||||||
|
Change in contingent earn-out liability
|
2,008 | 1.1 | % | - | - | 2,008 | - | |||||||||||||||||
|
Acquisition-related costs
|
5,412 | 3.1 | % | - | - | 5,412 | - | |||||||||||||||||
|
Total operating expenses
|
$ | 124,982 | 71.5 | % | $ | 78,174 | 55.9 | % | $ | 46,808 | 59.9 | % | ||||||||||||
Research and Development Expenses. Research and development expenses increased during the year ended December 31, 2009, as compared with fiscal 2008, primarily due to increases in payroll and payroll related expenses of $6.3 million, stock-based compensation expenses of $12.1 million, product development and qualification expenses of $2.8 million, and software licenses expenses of $2.1 million. The increases were partially offset by decreases in consulting and outside vendor expenses of $1.6 million. The increase in payroll and payroll related expenses and stock-based compensation expenses were primarily due to increases in engineering headcount to support our new product development efforts, and as a result of the RMI acquisition. The increase in product development and qualification expense was primarily due to the production qualification and characterization of our processors. Product development and qualification expenses vary from period to period depending on the timing of development and tape-out of various products. The increase in software licenses expenses was primarily due to amortization of software licenses used for our internal research and development projects. The remainder of the increase in research and development expenses was caused by individually minor items.
Selling, General and Administrative Expenses. Selling, general and administrative expenses increased during the year ended December 31, 2009, as compared with fiscal 2008, primarily due to increases in payroll and payroll related expenses of $4.5 million, stock-based compensation expenses of $12.6 million, legal expenses of $0.7 million. The increases were offset partially by decreases in commission expense of $0.3 million, consulting and outside vendor services expenses of $0.4 million, and other professional services expenses of $0.1 million. The increase in payroll and payroll related expenses and stock-based compensation expenses resulted primarily from increases in headcount to support our growing operations in the sales and marketing areas, and as a result of the RMI acquisition. Selling, general and administrative expenses also included $1.8 million of amortization expense for the customer contracts and relationships, tradenames and trademarks, and non-competition agreements intangible assets for the year ended December 31, 2009. The remainder of the fluctuation in selling, general and administrative expenses was caused by individually minor items.
Change in contingent earn-out liability. The change in contingent earn-out liability was $2.0 million for the year ended December 31, 2009. The change in the estimated fair value of the contingent earn-out liability to be paid out to the former holders of RMI capital stock was due to an increase in the market price of our common stock.
Acquisition-Related Costs. Acquisition-related costs were $5.4 million for the year ended December 31, 2009 primarily due to legal expenses of $3.1 million, severance expenses of $0.9 million, consulting and outside vendor services of $0.7 million, and other professional service of $0.5 million, related to the IDT NSE and RMI acquisitions.
Other items
The tables below set forth other items for the years ended December 31, 2009 and 2008 (in thousands, except percentage data):
|
Year ended
December 31,
2009
|
Percentage
of
Revenue
|
Year ended
December 31,
2008
|
Percentage
of
Revenue
|
Year-to-Year
Change
|
Percentage
Change
|
|||||||||||||||||||
|
Interest and other income (expense), net:
|
||||||||||||||||||||||||
|
Interest income
|
$ | 992 | 0.6 | % | $ | 1,595 | 1.1 | % | $ | (603 | ) | -37.8 | % | |||||||||||
|
Interest expense
|
(1,666 | ) | -1.0 | % | (33 | ) | 0.0 | % | (1,633 | ) | 4948.5 | % | ||||||||||||
|
Other income (expense), net
|
(4 | ) | 0.0 | % | (59 | ) | 0.0 | % | 55 | -93.2 | % | |||||||||||||
|
Total interest and other income (expense), net
|
$ | (678 | ) | -0.4 | % | $ | 1,503 | 1.1 | % | $ | (2,181 | ) | -145.1 | % | ||||||||||
Interest Income. Interest income decreased during the year ended December 31, 2009, as compared with fiscal 2008, primarily due to decreased interest income on cash and cash equivalents, and short-term investment balances as a result of lower yields on our investments and lower invested balances due to the financing of IDT NSE and RMI acquisitions.
Interest Expense. Interest expense increased during the year ended December 31, 2009, as compared with fiscal 2008, primarily due to increased interest expense of $1.5 million incurred on the line of credit and term notes which were obtained to finance a portion of the IDT NSE and RMI acquisitions.
Other Income (Expense), net. Other income and expense, net increased during the year ended December 31, 2009, as compared with fiscal 2008, primarily due to a decrease in software license write-offs incurred in 2008.
|
Year ended
December 31,
2009
|
Percentage
of
Pre-Tax Income
|
Year ended
December 31,
2008
|
Percentage
of
Pre-Tax Income
|
Year-to-Year
Change
|
Percentage
Change
|
|||||||||||||||||||
|
Benefit from income taxes
|
$ | (3,060 | ) | 6.1 | % | $ | (1,937 | ) | -118.1 | % | $ | (1,123 | ) | 58.0 | % | |||||||||
Benefit from income taxes. During the year ended December 31, 2009, we recorded an income tax benefit of $3.1 million. Our effective tax rate of 6.1% for the year ended December 31, 2009 was primarily driven by a rate differential for book income generated in foreign jurisdictions, the tax impact of non-deductible expenses such as stock-based compensation expenses and acquisition-related expenses and adjustments to certain tax reserves relating to an intercompany license agreement.
Liquidity and Capital Resources
Financial Condition
Our principal sources of liquidity are our cash, cash equivalents and marketable securities of $256.2 million as of December 31, 2010. We terminated our senior secured revolving credit facility of $25 million with a group of banks during the year and no longer have available credit under that arrangement as of December 31, 2010.
The table below sets forth the key components of cash flow for the years ended December 31, 2010, 2009 and 2008 (in thousands):
|
Year ended December 31,
|
||||||||||||
|
2010
|
2009
|
2008
|
||||||||||
|
Net cash provided by operating activities
|
$ | 108,613 | $ | 48,251 | $ | 41,856 | ||||||
|
Net cash used in investing activities
|
$ | (185,245 | ) | $ | (128,019 | ) | $ | (14,252 | ) | |||
|
Net cash provided by financing activities
|
$ | 132,877 | $ | 40,572 | $ | 5,226 | ||||||
Cash Flows during the Year ended December 31, 2010
Net cash provided by operating activities was $108.6 million for the year ended December 31, 2010, which takes into account adjustments for $66.4 million of net loss, $163.8 million of non-cash operating expenses and $11.2 million in benefits from changes in operating assets and liabilities. Non-cash operating expenses for the year ended December 31, 2010 included stock settlement of contingent earn-out liability of $60.6 million, depreciation and amortization of $52.9 million, stock-based compensation of $47.6 million, an increase in provision for inventory reserve of $6.1 million, net of benefits from deferred income taxes of $5.9 million, and benefits from stock-based awards of $0.2 million. Changes in operating assets and liabilities which resulted in cash provided by operating activities primarily related to $11.1 million cash settlement of contingent earn-out liability, increases in deferred margin of $2.4 million, increases in accounts receivable of $4.8 million, increases in inventory of $2.6 million and other changes. Changes in operating assets and liabilities which resulted in cash used in operating activities primarily related to increases in prepaid expenses of $3.8 million, and reductions in payables and accrued liabilities totaling $6.0 million.
Net cash used in investing activities was $185.2 million for the year ended December 31, 2010 primarily represent by the investment of offering proceeds and operating cash flows, and also included a cash payment of $11.5 million for settlement of contingent earn-out liability, purchases of marketable securities of $259.5 million, purchase of long-term investments in non-publicly traded companies, intangible assets and other of $8.7 million, and of property and equipment of $8.6 million, and reduced by proceeds from sales and maturities of marketable securities of $103.1 million. We also entered into capital lease obligations of $8.0 million related to software tools necessary to support product development activities. We expect to make capital expenditures of approximately $7.4 million during fiscal 2011 primarily to support product development activities.
Net cash provided by financing activities was $132.9 million for the year ended December 31, 2010, primarily from proceeds from issuance of Common Stock pursuant to a follow-on public offering of $117.8 million, net of stock offering costs of $6.1 million, and proceeds of $31.7 million from the issuance of common stock under our stock compensation plans, benefits from stock-based awards of $0.2 million, and reduced by payments of software licenses and other obligations of $7.0 million, and tax payments related to vested stock awards of $3.7 million.
Cash Flows during the Year ended December 31, 2009
Net cash provided by operating activities was $48.3 million for the year ended December 31, 2009, which takes into account adjustments for net loss of $47.2 million of net loss, $62.4 million of non-cash operating expenses and $33.1 million in benefits from changes in operating assets and liabilities. Non-cash operating expenses for the year ended December 31, 2009, included depreciation and amortization of $25.4 million, write-off of debt issuance costs related to senior secured term notes of $0.5 million, stock-based compensation of $40.7 million, an increase in provision for inventory reserve of $1.9 million, net of benefits from deferred income taxes of $4.6 million, and benefits from stock-based awards of $1.5 million. Changes in operating assets and liabilities which resulted in cash provided by operating activities primarily related to an increase in payables and accrued liabilities of $20.1 million, a decrease in inventories of $17.9 million, an increase in contingent earn-out liability of $2.0 million, and an increase in deferred margin of $1.6 million. Changes in operating assets and liabilities which resulted in cash used in operating activities primarily related to an increase in accounts receivables of $7.5 million and an increase in prepaid expenses and other assets of $1.1 millions.
Net cash used in investing activities was $128.0 million during the year ended December 31, 2009, of which we used $107.4 million in cash paid in connection with the IDT NSE and RMI acquisitions, $15.0 million for the loan to RMI, $0.4 million for the purchase of non-competition agreements in connection with the RMI acquisition, $15.5 million for the payment of Aeluros post-acquisition revenue milestone, $14.6 million for the purchase of short-term investments, $1.5 million of the purchase of long-term investment and $1.2 million to purchase property and equipment. Cash used in investing activities was reduced by $27.7 million for proceeds from sales and maturities of short-term investments.
Net cash provided by financing activities was $40.6 million for the year ended December 31, 2009, primarily from proceeds from our credit facility totaling $48.0 million, proceeds from the issuance of common stock in connection with a registered shelf offering, net of issuance costs, of $29.7 million, proceeds of $17.2 million from the issuance of common stock under our stock compensation plans, and tax benefit from stock-based awards of $1.5 million. Cash provided by financing activities was reduced for repayment of the entire $48.0 million of outstanding debt under our credit facility, payment of debt issuance costs of $1.2 million, tax payments related to vested stock awards of $4.3 million, and repayment of software license and other obligations of $2.3 million.
Cash Flows during the Year ended December 31, 2008
Net cash provided by operating activities was $41.9 million for the year ended December 31, 2008, which primarily consisted of $3.6 million of net income, $31.7 million of non-cash operating expenses and $6.6 million in benefits from changes in operating assets and liabilities. Non-cash operating expenses for the year ended December 31, 2008, included depreciation and amortization of $17.2 million, stock-based compensation of $16.5 million, and an increase in provision for inventory reserve of $2.4 million, net of benefits from deferred income taxes of $3.9 million, and benefits from stock-based awards of $0.7 million. Changes in operating assets and liabilities which resulted in cash provided by operating activities primarily related to a decrease in accounts receivable of $6.6 million, a decrease in prepaid expenses and other assets of $0.6 million, an increase in deferred margin of $1.3 million, and an increase in other liabilities of $1.1 million. Changes in operating assets and liabilities which resulted in cash used in operating activities primarily related to an increase in inventory of $1.4 million and a decrease in payables and accrued liabilities of $1.6 million.
Net cash used in investing activities was $14.3 million during the year ended December 31, 2008, of which we used $13.0 million for the purchase of short-term investments, and $1.4 million to purchase computer equipment and research and development design tools to support our growing operations
Net cash provided by financing activities was $5.2 million for the year ended December 31, 2008, primarily from proceeds of stock option exercises of $8.8 million, and tax benefit from stock-based awards of $0.7 million. Cash provided by financing activities was reduced for payments of software license and other obligations of $3.4 million and tax payments related to vested stock awards of $0.9 million.
Capital Resources
We believe that our existing cash, cash equivalents and marketable securities of $256.2 million as of December 31, 2010 will be sufficient to meet our anticipated cash needs for at least the next 12 months. We settled our payment obligations of approximately $11.5 million in cash and approximately 2.4 million shares of our stock under the earn-out provisions of the RMI merger agreement to the former holders of RMI common stock during December 2010.
Our future cash needs will depend on many factors, including the amount of revenue we generate, the timing and extent of spending to support product development efforts, the expansion of sales and marketing activities, the timing of introductions of new products, the costs to ensure access to adequate manufacturing capacity, and the continuing market acceptance of our products, and any future business acquisitions that we might undertake. We may seek additional funding through public or private equity or debt financing, and have a shelf registration allowing us to sell up to $120 million of our securities from time to time during the next three years. We also might decide to raise additional capital at such times and upon such terms as management considers favorable and in our interests, including, but not limited to, from the sale of our debt and/or equity securities (before reductions for expenses, underwriting discounts and commissions) under our existing shelf registration statement or one or more automatic shelf registration statements that we could file from time to time without advance public disclosure. We cannot be certain, however, that we will be able to complete offerings of our securities at such times and on such terms as we may consider desirable for us.
Contractual Obligations
Our principal commitments as of December 31, 2010 are summarized below (in thousands):
|
Total
|
Less than
1 year
|
1 - 3
years
|
4 -5
years
|
After
5 years
|
||||||||||||||||
|
Operating lease obligations
|
$ | 22,205 | $ | 744 | $ | 5,929 | $ | 7,164 | $ | 8,368 | ||||||||||
|
Software license obligations
|
6,547 | 4,514 | 2,033 | - | - | |||||||||||||||
|
Wafer purchases
|
16,250 | 16,250 | - | - | - | |||||||||||||||
|
Total
|
$ | 45,002 | $ | 21,508 | $ | 7,962 | $ | 7,164 | $ | 8,368 | ||||||||||
In addition to the enforceable and legally binding obligations quantified in the table above, we have other obligations for goods and services entered into in the normal course of business. These obligations, however, are either not enforceable or legally binding or are subject to change based on our business decisions.
Due to uncertainty with respect to timing of future cash flows associated with our unrecognized tax benefits at December 31, 2010, we are unable to make a reasonably reliable estimate of the period of cash settlement with the respective taxing authority. Therefore, $44.6 million of unrecognized tax benefits have not been included in the contractual obligations table above. See Note 7—Income Taxes or a discussion on Income Taxes.
Off-Balance Sheet Arrangements
As of December 31, 2010, we had no off-balance sheet arrangements as defined by item 303(a)(4)(ii) of Regulation S-K, other than the indemnities, commitments and guarantees discussed below.
Indemnities, Commitments and Guarantees
In the normal course of business, we have made certain indemnities, commitments and guarantees under which we may be required to make payments in relation to certain transactions. These include agreements to indemnify our customers with respect to liabilities associated with the infringement of other parties' technology based upon our products, obligations to indemnify our lessors under facility lease agreements, and obligations to indemnify our directors and officers to the maximum extent permitted under the laws of the state of Delaware. The duration of such indemnification obligations, commitments and guarantees varies and, in certain cases, is indefinite. We have not recorded any liability for any such indemnification obligations, commitments and guarantees in the accompanying balance sheets. We do, however, accrue for losses for any known contingent liability, including those that may arise from indemnification provisions, when future payment is estimable and probable.
We have undertaken specific obligations in the event of an epidemic product failure under master purchase agreements with certain customers. In the event of an epidemic product failure, our obligations under these arrangements may have a material impact on our results of operations, financial condition, or cash flows.
|
QUANTITATIVE AND QUALITATIVE DISCLOSURES ABOUT MARKET RISK.
|
The primary objective of our investment activities is to preserve principal while maximizing the income we receive from our investments without significantly increasing the risk of loss. Some of the investment securities permitted under our cash management policy may be subject to market risk for changes in interest rates. To mitigate this risk, we plan to maintain a portfolio of cash equivalent and short-term investments in a variety of securities which may include investment grade commercial paper, money market funds, government debt issued by the United States of America, state debt, certificates of deposit and investment grade corporate debt. Presently, we are exposed to minimal market risks associated with interest rate changes. We manage the sensitivity of our results of operations to these risks by maintaining investment grade short-term investments. Our cash management policy does not allow us to purchase or hold derivative or commodity instruments or other financial instruments for trading purposes. Additionally, our policy stipulates that we periodically monitor our investments for adverse material holdings related to the underlying financial solvency of the issuer. As of December 31, 2010, our marketable securities consisted primarily of deposits in money market funds, U.S. treasuries and government agency securities. Our results of operations and financial condition would not be significantly impacted by either a 10% increase or decrease in interest rates.
Our sales outside the United States are transacted in U.S. dollars; accordingly our sales are not generally impacted by foreign currency rate changes. Our operating expenses are denominated primarily in U.S. Dollars, except for expenses incurred by our wholly owned subsidiaries which are denominated in the local currency. To date, fluctuations in foreign currency exchange rates have not had a material impact on our results of operations.
|
FINANCIAL STATEMENTS AND SUPPLEMENTARY DATA.
|
NETLOGIC MICROSYSTEMS, INC.
Index to Financial Statements
|
|
Page
|
|
|
|
39
|
|
|
|
40
|
|
|
|
41
|
|
|
|
42
|
|
|
|
43
|
|
|
|
44
|
To the Board of Directors and Stockholders of
NetLogic Microsystems, Inc.:
In our opinion, the consolidated financial statements listed in the index appearing under Item 15(a) (1) present fairly, in all material respects, the financial position of NetLogic Microsystems, Inc. and its subsidiaries at December 31, 2010 and December 31, 2009, and the results of their operations and their cash flows for each of the three years in the period ended December 31, 2010 in conformity with accounting principles generally accepted in the United States of America. In addition, in our opinion, the financial statement schedule listed in the index appearing under Item 15(a) (2) presents fairly, in all material respects, the information set forth therein when read in conjunction with the related consolidated financial statements. Also in our opinion, the Company maintained, in all material respects, effective internal control over financial reporting as of December 31, 2010, based on criteria established in Internal Control - Integrated Framework issued by the Committee of Sponsoring Organizations of the Treadway Commission (COSO). The Company's management is responsible for these financial statements and financial statement schedule, for maintaining effective internal control over financial reporting and for its assessment of the effectiveness of internal control over financial reporting, included in Management's Report on Internal Control over Financial Reporting appearing under Item 9A. Our responsibility is to express opinions on these financial statements, on the financial statement schedule, and on the Company's internal control over financial reporting based on our integrated audits. We conducted our audits in accordance with the standards of the Public Company Accounting Oversight Board (United States). Those standards require that we plan and perform the audits to obtain reasonable assurance about whether the financial statements are free of material misstatement and whether effective internal control over financial reporting was maintained in all material respects. Our audits of the financial statements included examining, on a test basis, evidence supporting the amounts and disclosures in the financial statements, assessing the accounting principles used and significant estimates made by management, and evaluating the overall financial statement presentation. Our audit of internal control over financial reporting included obtaining an understanding of internal control over financial reporting, assessing the risk that a material weakness exists, and testing and evaluating the design and operating effectiveness of internal control based on the assessed risk. Our audits also included performing such other procedures as we considered necessary in the circumstances. We believe that our audits provide a reasonable basis for our opinions.
As discussed in Note 1 of the Notes to Consolidated Financial Statements, in 2009 the Company changed the manner in which it accounts for business combinations.
A company’s internal control over financial reporting is a process designed to provide reasonable assurance regarding the reliability of financial reporting and the preparation of financial statements for external purposes in accordance with generally accepted accounting principles. A company’s internal control over financial reporting includes those policies and procedures that (i) pertain to the maintenance of records that, in reasonable detail, accurately and fairly reflect the transactions and dispositions of the assets of the company; (ii) provide reasonable assurance that transactions are recorded as necessary to permit preparation of financial statements in accordance with generally accepted accounting principles, and that receipts and expenditures of the company are being made only in accordance with authorizations of management and directors of the company; and (iii) provide reasonable assurance regarding prevention or timely detection of unauthorized acquisition, use, or disposition of the company’s assets that could have a material effect on the financial statements.
Because of its inherent limitations, internal control over financial reporting may not prevent or detect misstatements. Also, projections of any evaluation of effectiveness to future periods are subject to the risk that controls may become inadequate because of changes in conditions, or that the degree of compliance with the policies or procedures may deteriorate.
/s/ PricewaterhouseCoopers LLP
San Jose, California
February 16, 2011
NETLOGIC MICROSYSTEMS, INC.
CONSOLIDATED BALANCE SHEETS
(IN THOUSANDS)
|
December 31,
|
||||||||
|
2010
|
2009
|
|||||||
|
ASSETS
|
||||||||
|
Current assets:
|
||||||||
|
Cash and cash equivalents
|
$ | 100,523 | $ | 44,278 | ||||
|
Short-term investments
|
155,644 | - | ||||||
|
Accounts receivables, net
|
19,829 | 25,137 | ||||||
|
Inventories
|
36,290 | 45,113 | ||||||
|
Deferred income taxes
|
8,428 | 13,098 | ||||||
|
Prepaid expenses and other current assets
|
11,458 | 8,676 | ||||||
|
Total current assets
|
332,172 | 136,302 | ||||||
|
Property and equipment, net
|
20,507 | 13,278 | ||||||
|
Goodwill
|
112,700 | 112,700 | ||||||
|
Intangible assets, net
|
180,838 | 223,345 | ||||||
|
Other assets
|
66,372 | 46,247 | ||||||
|
Total assets
|
$ | 712,589 | $ | 531,872 | ||||
|
LIABILITIES AND STOCKHOLDERS' EQUITY
|
||||||||
|
Current liabilities
|
||||||||
|
Accounts payable
|
$ | 17,257 | $ | 17,937 | ||||
|
Accrued liabilities
|
27,848 | 33,966 | ||||||
|
Contingent earn-out liability
|
- | 11,687 | ||||||
|
Deferred margin
|
4,242 | 2,667 | ||||||
|
Software licenses and other obligations, current
|
4,514 | 3,037 | ||||||
|
Total current liabilities
|
53,861 | 69,294 | ||||||
|
Software licenses and other obligations, long-term
|
2,033 | 2,409 | ||||||
|
Other liabilities
|
37,782 | 34,214 | ||||||
|
Total liabilities
|
93,676 | 105,917 | ||||||
|
Commitment and contingencies (Note 8)
|
||||||||
|
Stockholders' equity
|
||||||||
|
Preferred stock; 50,000 shares authorized at December 31, 2010 and 2009; none issued and outstanding at December 31, 2010 and 2009
|
- | - | ||||||
|
Common stock; 200,000 shares authorized at December 31, 2009 and 2008; 67,511 and 57,484 shares issued and outstanding at December 31, 2010 and 2009
|
675 | 575 | ||||||
|
Additional paid-in capital
|
807,780 | 548,523 | ||||||
|
Accumulated other comprehensive loss
|
(28 | ) | - | |||||
|
Accumulated deficit
|
(189,514 | ) | (123,143 | ) | ||||
|
Total stockholders' equity
|
618,913 | 425,955 | ||||||
|
Total liabilities and stockholders' equity
|
$ | 712,589 | $ | 531,872 | ||||
The accompanying notes are an integral part of these consolidated financial statements.
NETLOGIC MICROSYSTEMS, INC.
CONSOLIDATED STATEMENTS OF OPERATIONS
(IN THOUSANDS, EXCEPT FOR PER SHARE AMOUNTS)
|
Year ended December 31,
|
||||||||||||
|
2010
|
2009
|
2008
|
||||||||||
|
Revenue
|
$ | 381,745 | $ | 174,689 | $ | 139,927 | ||||||
|
Cost of revenue
|
173,427 | 99,251 | 61,616 | |||||||||
|
Gross profit
|
208,318 | 75,438 | 78,311 | |||||||||
|
Operating expenses:
|
||||||||||||
|
Research and development
|
127,697 | 73,631 | 51,607 | |||||||||
|
Selling, general and administrative
|
78,879 | 43,931 | 26,567 | |||||||||
|
Change in contingent earn-out liability
|
71,725 | 2,008 | - | |||||||||
|
Acquisition-related costs
|
735 | 5,412 | - | |||||||||
|
Total operating expenses
|
279,036 | 124,982 | 78,174 | |||||||||
|
Income (loss) from operations
|
(70,718 | ) | (49,544 | ) | 137 | |||||||
|
Interest and other income (expense), net:
|
||||||||||||
|
Interest income
|
409 | 992 | 1,595 | |||||||||
|
Interest expense
|
(480 | ) | (1,666 | ) | (33 | ) | ||||||
|
Other income (expense), net
|
(54 | ) | (4 | ) | (59 | ) | ||||||
|
Total interest and other income (expense), net
|
(125 | ) | (678 | ) | 1,503 | |||||||
|
Income (loss) before income taxes
|
(70,843 | ) | (50,222 | ) | 1,640 | |||||||
|
Benefit from income taxes
|
(4,472 | ) | (3,060 | ) | (1,937 | ) | ||||||
|
Net income (loss)
|
$ | (66,371 | ) | $ | (47,162 | ) | $ | 3,577 | ||||
|
Net income (loss) per share-basic
|
$ | (1.10 | ) | $ | (1.02 | ) | $ | 0.08 | ||||
|
Net income (loss) per share-diluted
|
$ | (1.10 | ) | $ | (1.02 | ) | $ | 0.08 | ||||
|
Shares used in calculation-basic
|
60,426 | 46,182 | 42,944 | |||||||||
|
Shares used in calculation-diluted
|
60,426 | 46,182 | 44,628 | |||||||||
The accompanying notes are an integral part of these consolidated financial statements.
NETLOGIC MICROSYSTEMS, INC.
CONSOLIDATED STATEMENT OF STOCKHOLDERS’ EQUITY AND COMPREHENSIVE INCOME (LOSS)
(IN THOUSANDS)
|
Common Stock
|
||||||||||||||||||||||||
|
Shares
|
Amount
|
Additional
Paid-In
Capital
|
Accumulated
Other Compre-
hensive Income
(Loss)
|
Accumulated
Deficit
|
Total
Stock-holder's
Equity
|
|||||||||||||||||||
|
Balance at December 31, 2007
|
42,628 | $ | 426 | $ | 251,028 | $ | (8 | ) | $ | (79,558 | ) | $ | 171,888 | |||||||||||
|
Issuance of stock under stock compensation plans
|
1,188 | 12 | 7,873 | 7,885 | ||||||||||||||||||||
|
Recording of stock-based compensation expense
|
16,354 | 16,354 | ||||||||||||||||||||||
|
Tax benefits of stock options
|
568 | 568 | ||||||||||||||||||||||
|
Comprehensive income:
|
||||||||||||||||||||||||
|
Currency translation adjustments
|
(45 | ) | (45 | ) | ||||||||||||||||||||
|
Unrealized gain on short-term investments
|
40 | 40 | ||||||||||||||||||||||
|
Net income
|
3,577 | 3,577 | ||||||||||||||||||||||
|
Total comprehensive income
|
3,572 | |||||||||||||||||||||||
|
Balance at December 31, 2008
|
43,816 | 438 | 275,823 | (13 | ) | (75,981 | ) | 200,267 | ||||||||||||||||
|
Issuance of common stock in connection with the acquisition of RMI
|
9,920 | 100 | 188,427 | 188,527 | ||||||||||||||||||||
|
Issuance of common stock in connection with stock offering, net of share issuance costs of $71
|
1,400 | 14 | 29,646 | 29,660 | ||||||||||||||||||||
|
Issuance of stock under stock compensation plans
|
2,348 | 23 | 12,878 | 12,901 | ||||||||||||||||||||
|
Recording of stock-based compensation expense
|
40,660 | 40,660 | ||||||||||||||||||||||
|
Tax benefits of stock options
|
1,089 | 1,089 | ||||||||||||||||||||||
|
Comprehensive income:
|
||||||||||||||||||||||||
|
Unrealized gain on short-term investments
|
13 | 13 | ||||||||||||||||||||||
|
Net loss
|
(47,162 | ) | (47,162 | ) | ||||||||||||||||||||
|
Total comprehensive loss
|
(47,149 | ) | ||||||||||||||||||||||
|
Balance at December 31, 2009
|
57,484 | 575 | 548,523 | - | (123,143 | ) | 425,955 | |||||||||||||||||
|
Issuance of common stock in connection with the
earnout consideration payable under the
acquisition of RMI
|
2,391 | 24 | 71,859 | 71,883 | ||||||||||||||||||||
|
Issuance of common stock in connection with
a follow-on stock offering, net of
share issuance costs of $6,145
|
4,084 | 41 | 111,627 | 111,668 | ||||||||||||||||||||
|
Issuance of stock under stock compensation plans
|
3,552 | 35 | 27,959 | 27,994 | ||||||||||||||||||||
|
Recording of stock-based compensation expense
|
47,553 | 47,553 | ||||||||||||||||||||||
|
Tax benefits of stock options
|
259 | 259 | ||||||||||||||||||||||
|
Comprehensive income (loss):
|
||||||||||||||||||||||||
|
Unrealized loss on short-term investments, net of tax
|
(28 | ) | (28 | ) | ||||||||||||||||||||
|
Net loss
|
(66,371 | ) | (66,371 | ) | ||||||||||||||||||||
|
Total comprehensive (loss)
|
(66,399 | ) | ||||||||||||||||||||||
|
Balance at December 31, 2010
|
67,511 | $ | 675 | $ | 807,780 | $ | (28 | ) | $ | (189,514 | ) | $ | 618,913 | |||||||||||
The accompanying notes are an integral part of these consolidated financial statements.
NETLOGIC MICROSYSTEMS, INC.
CONSOLIDATED STATEMENTS OF CASH FLOWS
(IN THOUSANDS)
|
Year ended December 31,
|
||||||||||||
|
2010
|
2009
|
2008
|
||||||||||
|
Cash flows from operating activities:
|
||||||||||||
|
Net income (loss)
|
$ | (66,371 | ) | $ | (47,162 | ) | $ | 3,577 | ||||
|
Adjustments to reconcile net income (loss) to net cash provided by operating activities:
|
||||||||||||
|
Depreciation and amortization
|
52,887 | 25,361 | 17,213 | |||||||||
|
Loss on disposal of property and equipment
|
43 | 6 | 106 | |||||||||
|
Write-off of debt issuance costs
|
305 | 524 | - | |||||||||
|
Amortization of premium (accretion of discount) relating to debt securities
|
706 | - | (13 | ) | ||||||||
|
Stock-based compensation
|
47,641 | 40,755 | 16,492 | |||||||||
|
Stock settled contingent earn-out liability
|
60,625 | 2,008 | - | |||||||||
|
Provision for doubtful accounts
|
198 | 4 | 49 | |||||||||
|
Provision for inventory reserves
|
6,091 | 1,861 | 2,441 | |||||||||
|
Deferred income taxes, net
|
(5,939 | ) | (4,601 | ) | (3,893 | ) | ||||||
|
Excess tax benefit from stock-based awards
|
(207 | ) | (1,506 | ) | (717 | ) | ||||||
|
Changes in current assets and liabilities, net of effects of acquisitions:
|
||||||||||||
|
Accounts receivables
|
4,804 | (7,544 | ) | 6,571 | ||||||||
|
Inventories
|
2,613 | 17,926 | (1,448 | ) | ||||||||
|
Prepaid expenses and other assets
|
(3,774 | ) | (1,054 | ) | 646 | |||||||
|
Accounts payable
|
(151 | ) | 6,379 | 524 | ||||||||
|
Accrued liabilities
|
(5,868 | ) | 13,755 | (2,084 | ) | |||||||
|
Cash settled contingent earn-out liability
|
11,099 | - | - | |||||||||
|
Deferred margin
|
2,381 | 1,567 | 1,321 | |||||||||
|
Other long-term liabilities
|
1,530 | (28 | ) | 1,071 | ||||||||
|
Net cash provided by operating activities
|
108,613 | 48,251 | 41,856 | |||||||||
|
Cash flows from investing activities:
|
||||||||||||
|
Purchase of property and equipment, net
|
(8,569 | ) | (1,237 | ) | (1,438 | ) | ||||||
|
Purchase of short-term investments
|
(259,452 | ) | (14,633 | ) | (13,014 | ) | ||||||
|
Sales and maturities of short-term investments
|
103,054 | 27,700 | - | |||||||||
|
Purchase of long term investment and other
|
(7,500 | ) | (1,500 | ) | - | |||||||
|
Purchase of intangible assets
|
(1,250 | ) | (400 | ) | - | |||||||
|
Loan to RMI
|
- | (15,000 | ) | - | ||||||||
|
Cash received from (paid for) acquisitions
|
- | (107,448 | ) | 200 | ||||||||
|
Cash paid for acquisition-related earn-out obligations
|
(11,528 | ) | (15,501 | ) | - | |||||||
|
Net cash used in investing activities
|
(185,245 | ) | (128,019 | ) | (14,252 | ) | ||||||
|
Cash flows from financing activities:
|
||||||||||||
|
Proceeds from line of credit and term notes
|
- | 48,000 | - | |||||||||
|
Payment of principal of line of credit and term notes
|
- | (48,000 | ) | - | ||||||||
|
Payments of debt issuance costs
|
- | (1,158 | ) | - | ||||||||
|
Payments of software license and other obligations
|
(6,992 | ) | (2,338 | ) | (3,376 | ) | ||||||
|
Proceeds from issuance of common stock
|
31,681 | 17,183 | 8,774 | |||||||||
|
Proceeds from issuance of common stock in connection with a stock offering
|
117,813 | 29,660 | - | |||||||||
|
Payments of stock issuance costs
|
(6,145 | ) | - | - | ||||||||
|
Tax payments related to vested awards
|
(3,687 | ) | (4,281 | ) | (889 | ) | ||||||
|
Excess tax benefit from stock-based awards
|
207 | 1,506 | 717 | |||||||||
|
Net cash provided by financing activities
|
132,877 | 40,572 | 5,226 | |||||||||
|
Effects of exchange rate on cash and cash equivalents
|
- | - | (45 | ) | ||||||||
|
Net increase (decrease) in cash and cash eqivalents
|
56,245 | (39,196 | ) | 32,785 | ||||||||
|
Cash and cash equivalents at beginning of year
|
44,278 | 83,474 | 50,689 | |||||||||
|
Cash and cash equivalents at end of year
|
$ | 100,523 | $ | 44,278 | $ | 83,474 | ||||||
|
Supplemental disclosures of cash flow information:
|
||||||||||||
|
Cash paid for interest
|
$ | 225 | $ | 916 | $ | 19 | ||||||
|
Cash paid for income taxes
|
$ | 1,883 | $ | 391 | $ | 562 | ||||||
|
Supplemental disclosures of non-cash investing and financing activities:
|
||||||||||||
|
Acquisition of property and equipment under capital leases and software licenses obligations
|
$ | 8,047 | $ | 7,189 | $ | 2,350 | ||||||
|
Issuance of common stock in connection with the RMI acquistion/earnout payment
|
$ | 71,883 | $ | 188,527 | $ | - | ||||||
|
Stock settled earn-out liability recognized as an increase to goodwill
|
$ | - | $ | 9,250 | $ | - | ||||||
|
Cash settled earn-out obligation recognized as an increase to goodwill
|
$ | - | $ | 429 | $ | 15,501 | ||||||
The accompanying notes are an integral part of these consolidated financial statements.
NETLOGIC MICROSYSTEMS, INC.
NOTES TO CONSOLIDATED FINANCIAL STATEMENTS
December 31, 2010
NOTE 1—THE COMPANY AND SUMMARY OF SIGNIFICANT ACCOUNTING POLICIES:
The Company
NetLogic Microsystems, Inc. is a leading fabless semiconductor company that designs, develops and sells proprietary high-performance processors and high speed integrated circuits that are used to enhance the performance, functionality and energy efficiency of advanced mobile wireless infrastructure, data center, enterprise, metro Ethernet, edge and core infrastructure networks. Our market-leading product portfolio includes high-performance multi-core communications processors, knowledge-based processors, high-speed 10/40/100 Gigabit Ethernet physical layer devices, network search engines, and ultra low-power embedded processors. These products are designed into high-performance systems such as switches, routers, wireless base stations, access aggregation, radio network controllers, security appliances, networked storage appliances, service gateways and connected media devices offered by leading original equipment manufacturers (“OEMs”).
Basis of Presentation
The consolidated financial statements include the accounts of the Company and its subsidiaries. All significant intercompany accounts and transactions have been eliminated in consolidation.
Use of Estimates
The preparation of financial statements in conformity with accounting principles generally accepted in the United States of America requires the Company’s management to make estimates and assumptions that affect the reported amounts of assets and liabilities and disclosure of contingent assets and liabilities at the date of the financial statements and reported amounts of revenues and expenses during the reporting period. Actual results could differ from those estimates.
Revenue Recognition
The Company derives its revenue primarily from its sales of semiconductor products. The Company recognizes revenue when all of the following criteria have been met: (i) persuasive evidence of a binding arrangement exists, (ii) delivery has occurred, (iii) the price is deemed fixed or determinable and free of contingencies and significant uncertainties, and (iv) collection is probable. The price is considered fixed or determinable at the execution of an agreement, based on specific products and quantities to be delivered at specified prices, which is often memorialized with a customer purchase order. The Company assesses the ability to collect from the Company’s customers based on a number of factors, including credit worthiness and any past transaction history of the customer.
Shipping charges billed to customers are included in product revenue and the related shipping costs are included in cost of revenue. Revenue consists primarily of sales of the Company’s products to OEM customers and their contract manufacturers, and to the Company’s distributors and international sales representatives. Initial sales of the Company’s products for a new design are usually made directly to OEM customers as they design and develop their product. Once their design enters production, they often outsource their manufacturing to contract manufacturers that purchase the Company’s products directly from the Company or from the Company’s distributors and international sales representatives.
NETLOGIC MICROSYSTEMS, INC.
NOTES TO CONSOLIDATED FINANCIAL STATEMENTS—(Continued)
December 31, 2010
The Company generally recognizes revenue at the time of shipment to OEM customers and their contract manufacturers and the Company’s international sales representatives. Product revenue and costs relating to sales made through distributors with rights of returns and price protection are deferred until the distributors sell the product to end customers because the selling price is not fixed and determinable and the Company is not able to estimate future returns. Revenue recognition depends on notification from the distributor that product has been sold to an end customer. On each reporting date the Company records a reduction in accounts receivables and deferred revenue based on the Company’s estimate of the margin to be ultimately recognized upon the sale of such products to end customers.
The Company delivers and maintains inventory, or “hubbing” arrangements with certain customers, including our largest customer, Cisco Systems, Inc. (“Cisco”), and its supplier, Wintec Industries (“Wintec”). The Company generally recognizes revenue when the customer, intermediary or third-party warehouse reports it has removed, or pulled, the Company’s product from the warehouse to be incorporated into the customers’ end products.
The Company has also entered into licensing agreements with some of its customers. For these license arrangements the Company recognizes revenue under the proportionate performance method provided that fees are fixed or determinable and collectability is probable. When such license arrangements contain multiple elements (e.g., license grants and services), the Company reviews each element to determine the separate units of accounting that exist within the agreement. If more than one unit of accounting exists, the Company generally allocates the consideration payable to the Company under the agreement to each unit of accounting using the relative fair value method. The Company recognizes revenue for each unit of accounting when the revenue recognition criteria have been met for that unit of accounting.
Warranty
The Company provides a limited warranty on its products for a period ranging from one to five years from the date of sale. The Company accrues for the estimated future costs of repair or replacement when revenue is recognized for products sold. The warranty accrual is estimated based on historical claims compared to actual revenue.
Cash, Cash Equivalents and Marketable Securities
The Company considers all highly liquid investments purchased with a remaining maturity of three months or less at the date of purchase to be cash equivalents. The Company diversifies its deposits with high credit quality financial institutions. Deposits held in money market funds are stated at cost, which approximates market value. Money market deposits are readily convertible to cash and are classified as cash equivalents. Marketable securities held by the Company, which are all available-for-sale investments and carried at fair value, consisted of U.S. treasury and government agency securities. The cost of securities sold is accounted for based on the specific identification method. Marketable securities with remaining contractual maturities on the date of purchase greater than 90 days are classified as short-term even though the contractual maturities may be greater than one year because such investments, which are highly liquid, represent funds available for use in current operations. These investments are monitored for impairment periodically and reductions in carrying value are recorded against earnings when the declines are determined to be other-than-temporary.
NETLOGIC MICROSYSTEMS, INC.
NOTES TO CONSOLIDATED FINANCIAL STATEMENTS—(Continued)
December 31, 2010
Long-term Investments
From time to time the Company makes debt and equity investments in non-publicly traded companies. These investments are included in “Other assets” on the accompanying Consolidated Balance Sheets. Debt investments are available-for-sale investments and are carried at fair value. Equity investments are accounted for under the cost method as the Company does not have the ability to exercise significant influence over the respective investee’s operating and financial policies. The Company monitors its available-for-sale debt investments and cost-method equity investments in non-publicly traded companies for impairment on a quarterly basis and records appropriate reductions in carrying values against earnings when such impairments are determined to be other-than-temporary. Factors considered in determining an impairment include, but are not limited to, the current business environment including competition and uncertainty of financial condition, going concern considerations such as the rate at which the investee company utilizes cash and the investee company’s ability to obtain additional private financing to fulfill its stated business plan, the need for changes to the investee company’s existing business model due to changing business environments and its ability to successfully implement necessary changes, and comparable valuations. If an investment is determined to be impaired, a further assessment is made as to whether such impairment is other-than-temporary.
As of December 31, 2010 and 2009, Other Assets included $2.6 million and $1.5 million of cost-method equity investments. As of December 31, 2010, Other Assets also included $5.0 million of available-for-sale debt investments in non-publicly traded companies. There were no available-for-sale investments in non-publicly traded companies as of December 31, 2009.
Risks and Uncertainties and Concentration of Credit Risk
While the Company has achieved profitability in recent years, it has reported a net loss for 2010 and 2009 and has a history of net losses prior to 2005. The Company’s ability to remain profitable is dependent, among other factors, upon the rate of growth of the target markets, continued customer acceptance of its products, continued end-user acceptance of its customer’s products, the strategic position of its products related to current or future competitors, its ability to develop new products that fulfill customer’s specifications, its ability to lower cost of goods sold through yield improvements and its ability to manage expenses. If the Company is unable to achieve profitability, it could be required, or could elect, to seek additional funding through public or private equity or debt financing. Such funds may not be available on terms acceptable to the Company or at all.
The Company depends on a few key customers for a substantial majority of its sales and the loss of, or a significant reduction in orders from any of them would likely significantly reduce revenues. For the years ended December 31, 2010, 2009, and 2008, the Company’s top five customers accounted for approximately 58%, 68%, and 68% of total product revenue, respectively. Because of the substantial market share owned by its top five customers, the Company’s revenue in the foreseeable future will likely continue to depend on sales to a relatively small number of customers, as well as the ability of these customers to sell products that use the Company’s products. The Company’s revenue would likely decline if one or more of these customers were to significantly reduce, delay or cancel their orders for any reason. In addition, any difficulty associated with collecting outstanding accounts receivable amounts due from its customers, particularly for the top five customers, would harm the Company’s financial performance. Because the Company’s sales are based upon standard purchase orders and not on long-term contracts, it cannot assure you that its customers will continue to purchase its products at current levels, or at all.
NETLOGIC MICROSYSTEMS, INC.
NOTES TO CONSOLIDATED FINANCIAL STATEMENTS—(Continued)
December 31, 2010
The Company purchases all of its semiconductor products from third party foundries. Because future foundry capacity may be limited and because the Company does not have long-term supply agreements with its foundries, it may not be able to secure adequate manufacturing capacity to satisfy the demand for its products. Although the Company presently utilize multiple foundries for wafers, it relies primarily on one foundry for current generation products. The Company provides the foundries with monthly rolling forecasts of its production requirements. The ability of each foundry to provide wafers to the Company could become limited in the future, by the foundry’s available capacity. Moreover, the price of the Company’s wafers may fluctuate based on changes in available industry capacity. Because the Company does not have long-term supply contracts with any of its foundries, they could choose to prioritize capacity for other customers, particularly larger customers, reduce or eliminate deliveries to them on short notice or increase the prices they charge them. Accordingly, the Company cannot be certain that its foundries will allocate sufficient capacity to satisfy its requirements. If the Company is not able to obtain foundry capacity as required, its relationships with present and future customers would be harmed and its revenue, gross margin and operating results would be materially impacted.
Financial instruments that potentially subject the Company to a concentration of credit risk as of December 31, 2010 consist of cash, cash equivalents, marketable securities and accounts receivable. Deposits held with financial institutions may exceed the amount of insurance provided on such deposits. To date the Company has not experienced any losses on its deposits of cash, cash equivalents, and marketable securities. The Company’s accounts receivable are derived from revenue earned from customers primarily located in North America and Asia. The Company performs ongoing credit evaluations of its customers’ financial condition and, generally, do not require collateral. In general, allowances are established for accounts aged over 90 days from the invoice date, unless specific circumstances indicate that the balance is collectible.
The following table summarizes customers comprising 10% or more of the Company’s gross account receivable for the periods indicated:
|
December 31,
|
||||||||
|
2010
|
2009
|
|||||||
|
Wintec Industries
|
31 | % | 26 | % | ||||
|
Huawei Technologies
|
19 | % | 14 | % | ||||
|
Flextronics
|
* | 12 | % | |||||
|
*
|
Less than 10% of gross accounts receivable
|
The following table summarizes revenue from bill-to customers comprising 10% or more of the Company’s revenue for the periods indicated:
|
December 31,
|
||||||||||||
|
2010
|
2009
|
2008
|
||||||||||
|
Wintec Industries
|
25 | % | 33 | % | 35 | % | ||||||
|
Celestica Corporation
|
* | * | 12 | % | ||||||||
|
Huawei Technologies
|
11 | % | * | * | ||||||||
|
Sanmina Corporation
|
* | 14 | % | * | ||||||||
|
*
|
Less than 10% of net revenue
|
NETLOGIC MICROSYSTEMS, INC.
NOTES TO CONSOLIDATED FINANCIAL STATEMENTS—(Continued)
December 31, 2010
The following table summarizes revenue from end customers comprising 10% or more of the Company’s revenue for the periods indicated:
|
December 31,
|
||||||||||||
|
2010
|
2009
|
2008
|
||||||||||
|
Cisco
|
27 | % | 35 | % | 38 | % | ||||||
|
Huawei Technologies
|
12 | % | 10 | % | 12 | % | ||||||
|
Alcatel-Lucent
|
10 | % | 13 | % | * | |||||||
|
*
|
Less than 10% of net revenue
|
Inventory Valuation and Adverse Purchase Commitments
The Company values its inventories at the lower of cost or market. The Company records inventory reserves for estimated obsolescence or unmarketable inventories based upon assumptions about future demand and market conditions. These estimates are generally based on a 12-month forecast prepared by management. Once a reserve is established, it is maintained until the product to which it relates is sold or otherwise disposed of. If actual market conditions are less favorable than those expected by management, additional adjustment to inventory valuation may be required. The carrying value of inventory and the determination of possible adverse purchase commitments are dependent on the Company's estimate of the yield that will be achieved, or the percent of good products identified when the product is tested.
Property and equipment
Property and equipment are stated at cost. Depreciation is computed using the straight-line method over the estimated useful lives of the assets. Leased assets and leasehold improvements are amortized using the straight-line method over the shorter of the estimated useful life of the asset or the term of the lease.
The depreciation and amortization periods for property and equipment categories are as follows:
|
Machinery and equipment
|
3 years
|
|
Software
|
3 years
|
|
Furniture and fixtures
|
5 years
|
Long-lived Assets and Intangible Assets
The Company assesses the impairment of long-lived assets and intangible assets whenever events or changes in circumstances indicate that the carrying value of such assets may not be recoverable. Whenever events or changes in circumstances suggest that the carrying amount of long-lived assets may not be recoverable, the Company estimates the future cash flows expected to be generated by the asset from its use or eventual disposition. If the sum of the expected future cash flows, which includes revenue, is less than the carrying amount of those assets, the Company recognizes an impairment loss based on the excess of the carrying amount over the fair value of the assets. Significant management judgment is required in the forecasts of future operating results that are used in the discounted cash flow method of valuation.
NETLOGIC MICROSYSTEMS, INC.
NOTES TO CONSOLIDATED FINANCIAL STATEMENTS—(Continued)
December 31, 2010
Goodwill
Goodwill is recorded as the difference, if any, between the aggregate consideration paid for an acquisition and the fair value of the net tangible and intangible assets acquired and liabilities assumed. The Company evaluates goodwill for impairment at least on an annual basis or whenever events and changes in circumstances suggest that the carrying amount may not be recoverable from its estimated future cash flow. The Company performs the goodwill impairment test for each reporting unit. If the fair value of the reporting unit exceeds the carrying value of the reporting unit, goodwill is not impaired. The Company performs its goodwill impairment assessment at the Company level, which is the sole reporting unit. The Company performed its annual goodwill impairment test in the fourth quarter and concluded there was no impairment of goodwill during the years ended December 31, 2010, 2009, and 2008.
Fair value of financial instruments
Carrying amounts of certain of the Company's financial instruments including cash and cash equivalents, marketable securities, debt investments, accounts receivable, accounts payable and software license and other obligations approximate fair value due to the short maturities and interest rates currently available to the Company.
Foreign currency
The functional currency for all of the Company's foreign subsidiaries is the United States dollar. Assets and liabilities denominated in non-U.S. dollars are re-measured into U.S. dollars at end-of-period exchange rates for monetary assets and liabilities, and historical exchange rates for nonmonetary assets and liabilities. Revenue and expenses are re-measured at average exchange rates in effect during the period, except for those revenue and expenses related to the nonmonetary assets and liabilities, which are measured at historical exchange rates. The gains or losses from foreign currency re-measurement are included in other income and expense, net. Such gains or losses were not material for the years ended December 31, 2010, 2009 and 2008.
Segment Reporting
ASC 280, Segment Reporting, establishes standards for the reporting of information about operating segments, including related disclosures about products and services, geographic areas and major customers. The standard for determining what information to report is based on available financial information that is regularly reviewed and used by the Company's chief executive officer, or CEO, who is the chief operating decision maker in evaluating its financial performance and resource allocation. Based on the criteria stated in ASC 280 for determining separately reportable operating segments and the financial information available to and reviewed by the CEO, the Company has determined that it operates as a single operating and reportable segment.
NETLOGIC MICROSYSTEMS, INC.
NOTES TO CONSOLIDATED FINANCIAL STATEMENTS—(Continued)
December 31, 2010
Income taxes
The Company accounts for income taxes under an asset and liability approach that requires the recognition of deferred tax liabilities and assets for the expected future tax consequences of timing differences between the carrying amounts and the tax bases of assets and liabilities. Valuation allowances are established when necessary to reduce deferred tax assets to amounts expected to be realized.
The Company also recognizes liabilities for uncertain tax positions based on a two-step process prescribed in ASC 740-10, Income Taxes. The first step is to evaluate the tax position for recognition by determining if the weight of available evidence indicates that it is more likely than not that the position will be sustained on audit, including resolution of related appeals or litigation processes, if any. The second step requires the Company to estimate and measure the tax benefit as the largest amount that is more than 50% likely to be realized upon ultimate settlement. It is inherently difficult and subjective to estimate such amounts, as the Company has to determine the probability of various possible outcomes. The Company reevaluates these uncertain tax positions on a quarterly basis. This evaluation is based on many factors, including, but not limited to, changes in facts or circumstances, changes in tax law, effectively settled issues under audit, and new audit activity. Such a change in recognition or measurement would result in the recognition of a tax benefit or an additional charge to the tax provision.
Computation of net income (loss) per share
The Company has computed net income (loss) per share under two methods, basic and diluted. Basic net income (loss) per share is computed by dividing net income (loss) by the weighted average number of common shares outstanding for the period. Diluted net income (loss) per share is computed by dividing net income (loss) by the sum of the weighted average number of common shares outstanding and potential common shares (when dilutive).
The following table sets forth the computation of basic and diluted net income (loss) attributable to common stockholders per share (in thousands):
|
Year ended December 31,
|
||||||||||||
|
2010
|
2009
|
2008
|
||||||||||
|
Numerator:
|
||||||||||||
|
Net income (loss): basic and diluted
|
$ | (66,371 | ) | $ | (47,162 | ) | $ | 3,577 | ||||
|
Denominator:
|
||||||||||||
|
Add: common shares outstanding
|
60,426 | 46,182 | 43,012 | |||||||||
|
Less: unvested common shares subject to repurchase
|
- | - | (68 | ) | ||||||||
|
Total shares: basic
|
60,426 | 46,182 | 42,944 | |||||||||
|
Add: stock options and warrants outstanding
|
- | - | 1,616 | |||||||||
|
Add: shares subject to repurchase
|
- | - | 68 | |||||||||
|
Total shares: diluted
|
60,426 | 46,182 | 44,628 | |||||||||
|
Basic earnings (loss) per share
|
$ | (1.10 | ) | $ | (1.02 | ) | $ | 0.08 | ||||
|
Diluted earnings (loss) per share
|
$ | (1.10 | ) | $ | (1.02 | ) | $ | 0.08 | ||||
NETLOGIC MICROSYSTEMS, INC.
NOTES TO CONSOLIDATED FINANCIAL STATEMENTS—(Continued)
December 31, 2010
The following numbers of shares underlying outstanding common stock options were excluded from the computation of diluted net income (loss) per share due to their anti-dilutive effects (in thousands):
|
Year ended December 31,
|
||||||||||||
|
2010
|
2009
|
2008
|
||||||||||
|
Stock options
|
5,065 | 4,256 | 4,478 | |||||||||
Advertising costs
Advertising costs are expensed as incurred. Advertising costs were not significant in the years ended December 31, 2010, 2009, and 2008.
Research and development
Research and development costs are expensed as incurred.
Stock-based compensation
The Company estimates the fair value of stock options and employee stock purchase plan awards using the Black-Scholes-Merton valuation model which requires the input of highly subjective assumptions, including the option's expected life, the price volatility of the underlying stock, future forfeitures and related tax effects. When establishing the expected life assumption, the Company reviews on a semi-annual basis the historical employee exercise behavior with respect to grants and awards with similar vesting periods. The expected stock price volatility assumption was determined using both the historical and implied volatility of the Company's common stock. Changes in the subjective assumptions required in the valuation models may significantly affect the estimated value of the awards, the related stock-based compensation expense and, consequently, the Company's results of operations.
Stock-based compensation expense recognized during the period is based on the value of the portion of share-based payment awards that is ultimately expected to vest. Stock-based compensation expense recognized in the Company's Consolidated Statement of Operations for the years ended December 31, 2010, 2009 and 2008 included (i) compensation expense for share-based payment awards granted prior to, but not yet vested as of, December 31, 2005 based on the grant date fair value estimated in accordance with the pro forma provisions of ASC 718 prior to its revision, and (ii) compensation expense for the share-based payment awards granted subsequent to December 31, 2005 based on the grant date fair value estimated in accordance with the provisions of ASC 718. The Company attributes the value of stock-based compensation to expense on a straight-line method for the awards granted subsequent to December 31, 2005, while the accelerated method is used for awards granted on or prior to December 31, 2005. As stock-based compensation expense recognized in the Consolidated Statement of Operations for the years ended December 31, 2010, 2009 and 2008 is based on awards ultimately expected to vest, it has been reduced for estimated forfeitures. ASC 718 requires forfeitures to be estimated at the time of grant and revised, if necessary, in subsequent periods if actual forfeitures differ from those estimates.
Business Combinations
Effective January 1, 2009, the Company adopted the FASB ASC 805, Business Combinations (“ASC 805”). ASC 805 updated guidance related to business combinations. The updated guidance establishes principles and requirements for how the acquirer of a business recognizes and measures in its financial statements the identifiable assets acquired, the liabilities assumed, and any non-controlling interest in the acquiree. The updated standard also provides guidance for recognizing and measuring the goodwill acquired in the business combination and determines what information to disclose to enable users of the financial statements to evaluate the nature and financial effects of the business combination. The updated standard also provides guidance for recognizing changes in an acquirer’s existing income tax valuation allowances and tax uncertainty accruals that result from a business combination transaction as adjustments to income tax expense. The updated guidance had a material impact on the Company’s consolidated financial statements during the year ended December 31, 2009. In fiscal 2009, the Company completed the IDT NSE and RMI acquisitions. Under the updated guidance the Company expensed the transaction costs associated with the IDT NSE and RMI acquisitions, while under the prior accounting standards such costs would have been capitalized. In addition, the Company recognized the fair value of a contingent earn-out liability in connection with the RMI acquisition of $9.7 million, and subsequently recognized an expense of $2.0 million related to the change in the estimated fair value of contingent earn-out liability, while under the prior accounting standards the earn-out would not have been recognized as part of the consideration transferred until the contingency was resolved. Further, the Company acquired in-process research and development of $46.5 million in connection with the RMI acquisition which has been capitalized in accordance with the updated guidance, whereas under prior authoritative guidance the amount would have been expensed immediately. Therefore, the adoption of the updated guidance related to business combinations has had and likely will continue to have a material impact on our future consolidated financial statements.
NETLOGIC MICROSYSTEMS, INC.
NOTES TO CONSOLIDATED FINANCIAL STATEMENTS—(Continued)
December 31, 2010
NOTE 2—BUSINESS COMBINATIONS
RMI CORPORATION
On October 30, 2009, the Company completed the acquisition of RMI Corporation (“RMI”), a provider of high-performance and low-power multi-core, multi-threaded processors. Pursuant to the Agreement and Plan of Merger Reorganization by and among the Company, Roadster Merger Corporation, RMI and WP VIII Representative LLC dated as of May 31, 2009, or the merger agreement, on October 30, 2009, Roadster Merger Corporation was merged with and into RMI, and the Company delivered merger consideration of approximately 9.9 million shares of the Company's common stock and $12.6 million cash to the paying agent for distribution to the holders of RMI capital stock. Approximately 10% of the shares of merger consideration common stock were held in escrow as security for claims and expenses that might have arisen during the first 12 months following the closing date and were subsequently released to the former holders of RMI capital stock in October 2010. Under the merger agreement, the Company loaned $15.0 million to RMI pursuant to a secured promissory note bearing interest at a 10% annual rate. Additionally, in December 2010, the Company issued approximately 2.4 million shares of its common stock and $11.5 million cash to the former holders of RMI capital stock as earn-out consideration based upon the Company’s achievement of specified percentage of revenue targets for the 12-month period from November 1, 2009 through October 31, 2010.
Fair Value of Initial Consideration Transferred
|
Issuance of NetLogic common stock to RMI preferred shareholders
|
$ | 188,527 | ||
|
Payments to RMI common shareholders in cash
|
12,582 | |||
|
Acquisition-related contingent consideration
|
9,679 | |||
|
Other adjustments
|
(837 | ) | ||
|
Total
|
$ | 209,951 |
In accordance with ASC 805 Business Combinations, a liability was recognized for the estimated merger date fair value of the acquisition-related contingent consideration based on the probability of the achievement of the revenue target. Changes in the fair value of the acquisition-related contingent consideration subsequent to the merger date, such as changes in the Company's estimate of the revenue expected to be achieved and changes in their stock price, were recognized in earnings in the period the estimated fair value changes – see Note 12 for details. The fair value estimate assumed probability-weighted revenues were achieved over the earn-out period.
The estimated initial earn-out liability was based on the Company's probability assessment of RMI's revenue achievements during the earn-out period. In developing these estimates, the Company considered the revenue projections of RMI management, RMI's historical results, and general macro-economic environment and industry trends. This fair value measurement is based on significant revenue inputs not observed in the market and thus represents a Level 3 measurement as defined by ASC 820 Fair Value Measurements and Disclosures. Level 3 instruments are valued based on unobservable inputs that are supported by little or no market activity and reflect the Company's own assumptions in measuring fair value. The Company assumed a probability-weighted revenue achievement of approximately 80% of target. The Company determined that the resulting earn-out consideration would be 489,000 shares of its common stock and cash payment of approximately $0.4 million. The Company then applied its closing stock price of $19.01 as of October 30, 2009 to the 489,000 shares and added $0.4 million to arrive at an initial earn-out liability of $9.7 million. Refer to Note 12, Fair Value Measurements, for further information.
As retention incentive awards under the definitive agreement the Company (i) issued 488,536 fully vested shares of its common stock to specified former RMI employees at the closing date for services through the consummation of the merger, (ii) granted restricted stock units representing the rights to acquire a total of 573,746 shares of common stock to employees of RMI that will vest over the first 12 months of post-closing employment with the Company, and (iii) granted restricted stock units representing the rights to acquire a total of 1,898,416 shares of common stock and stock options for the purchase of a total of 1,365,046 shares of common stock options to former employees of RMI, subject to vesting and other standard terms determined. The Company did not assume any outstanding stock options or warrants to purchase capital stock of RMI in the merger. The Company recorded the estimated stock-based compensation expense of approximately $9.3 million relating to the 488,536 fully vested shares of common stock in the fourth quarter of 2009.
NETLOGIC MICROSYSTEMS, INC.
NOTES TO CONSOLIDATED FINANCIAL STATEMENTS—(Continued)
December 31, 2010
Allocation of Consideration Transferred
The acquisition was accounted for as a business combination under ASC 805 Business Combinations. The total purchase price of $210.0 million was allocated to the net tangible and intangible assets acquired and liabilities assumed based on their fair values as of the date of the completion of the acquisition as follows (in thousands):
|
Net tangible assets
|
$ | 50,047 | ||
|
Amortizable intangible assets:
|
||||
|
Existing and core technology
|
71,800 | |||
|
Customer contracts and related relationships
|
13,800 | |||
|
Composite intangible assets
|
2,700 | |||
|
Tradenames and trademarks
|
2,200 | |||
|
Backlog
|
200 | |||
|
Indefinite-lived intangible asset:
|
||||
|
In-process research and development
|
46,500 | |||
|
Goodwill
|
22,704 | |||
|
Total
|
$ | 209,951 |
As of the effective date of the merger, inventories are required to be measured at fair value. The fair value of inventory of $37.7 million was based on assumptions applied to the RMI acquired inventory balance. In estimating the fair value of finished goods and work-in-progress inventory, the Company made assumptions about the selling prices and selling cost associated with the inventory. The Company assumed that estimated selling prices would yield gross margins consistent with actual margins earned by RMI during the first half of 2009. The Company assumed that selling cost as a percentage of revenue would be consistent with actual rates experienced by RMI during the first half of 2009.
Existing and core technology consisted of products which have reached technological feasibility and relate to the multi-core, multi-threaded processing products (XLR and XLS processors) and the ultra low-power processing products (Au 1xxx). The value of the developed technology was determined by discounting estimated net future cash flows of these products. The Company is amortizing the existing and core technology on a straight-line basis over estimated lives of 4 to 7 years.
Customer contracts and related relationships relate to the Company's ability to sell existing and future versions of products to existing RMI customers. The fair value of the customer contracts and related relationships was determined by discounting estimated net future cash flows from the customer contracts. The Company is amortizing customer contracts and related relationships on a straight-line basis over an estimated life of 10 years.
Composite intangible assets relate to matured legacy products. The fair value of the developed technology was determined by discounting estimated net future cash flows of these products. The Company is amortizing the composite intangible assets on a straight-line basis over an estimated life of 2 years.
Tradename and trademarks represents various RMI brands, registered product names and marks. The fair value of tradename and trademarks was determined by estimating a benefit from owning the asset rather than paying a royalty to a third party for the use of the asset. The Company is amortizing the asset on a straight-line basis over an estimated life of 3 years.
NETLOGIC MICROSYSTEMS, INC.
NOTES TO CONSOLIDATED FINANCIAL STATEMENTS—(Continued)
December 31, 2010
The backlog fair value relates to the estimated selling cost to generate backlog at October 30, 2009. The fair value of backlog at closing was amortized over an estimated life of 6 months.
In-process research and development, or IPRD, consisted of the in-process project to complete development of the XLPTM processor. The value assigned to IPRD was determined by considering the importance of products under development to the overall development plan, estimating costs to develop the purchased IPRD into commercially viable products, estimating the resulting net cash flows from the projects when completed and discounting the net cash flows to their present value. This methodology is referred to as the income approach, which discounts expected future cash flows to present value. The discount rate used in the present value calculations was derived from a weighted-average cost of capital analysis, adjusted to reflect additional risks related to the product's development and success as well as the product's stage of completion. Acquired IPRD assets are initially recognized at fair value and are classified as indefinite-lived assets until the successful completion or abandonment of the associated research and development efforts. Accordingly, during the development period after the acquisition date, these assets will not be amortized as charges to earnings; instead this asset will be subject to periodic impairment testing. The Company received and sampled first silicon on this product and in October 2010 has determined that the project is complete. The asset was re-designated a finite-lived intangible asset within the patent and core technology category and amortization of the asset commenced in November 2010 over an expected useful live of 10 years. Minor validation and testing work will continue prior to achieving high volume production which is anticipated to occur in 2011.
Deferred tax assets and liabilities associated with the estimated fair value adjustments of assets acquired and liabilities assumed was recorded using the estimated weighted average statutory tax rate in the jurisdictions where the fair value adjustments occurred.
Of the total estimated purchase price paid at the time of acquisition, approximately $22.7 million has been allocated to goodwill. Goodwill represents the excess of the purchase price of an acquired business over the fair value of the underlying tangible and intangible assets acquired and liabilities assumed and is not deductible for tax purposes. Among the factors that contributed to a purchase price in excess of the fair value of the net tangible and intangible assets was the acquisition of an assembled workforce of experienced semiconductor engineers, synergies in products, technologies, skillsets, operations, customer base and organizational cultures that can be leveraged to enable the Company to build an enterprise greater than the sum of its parts. In accordance with ASC 350 Intangibles—Goodwill and Other, goodwill will not be amortized but instead will be tested for impairment at least annually and more frequently if certain indicators of impairment are present. In the event that management determines that the value of goodwill has become impaired, the Company will record an expense for the amount impaired during the fiscal quarter in which the determination is made.
In connection with the acquisition of RMI, the Company entered into non-competition agreements with certain employees of RMI with a value of approximately $0.4 million. These non-competition agreements were negotiated as part of the acquisition, and as such, the fair value of these agreements is accounted for as a transaction separate from the business combination. Non-competition agreements are valued by determining the difference in net future cash flows with and without the covenant not to compete. The Company is amortizing the assets on a straight-line basis over an estimated life of 2.5 years.
Prior to the close of the acquisition, RMI initiated a restructuring plan under which the employment of some RMI employees was terminated upon the close of the merger. The Company has determined that the restructuring plan was a separate plan from the business combination because the plan to terminate the employment of certain employees was in contemplation of the merger. Therefore, the full severance cost of $0.9 million was recognized by the Company as an expense on the acquisition date. The severance costs comprised of $0.4 million, which was paid by RMI to the terminated employees prior to the close, and $0.5 million which was paid after the merger by the Company.
NETLOGIC MICROSYSTEMS, INC.
NOTES TO CONSOLIDATED FINANCIAL STATEMENTS—(Continued)
December 31, 2010
INTEGRATED DEVICE TECHNOLOGY, INC., NETWORK SEARCH ENGINE BUSINESS
On July 17, 2009, the Company purchased intellectual property and other assets relating to the network search engine business of IDT, which is referred to as the "IDT NSE Acquisition", for $98.2 million in cash, net of a price adjustment based on a determination of the actual amount of inventory received, pursuant to an Asset Purchase Agreement dated April 30, 2009. The Company acquired the IDT NSE Assets to further expand its existing portfolio of knowledge-based processors and, NETLite processors and network search engines, and to further strengthen the relationships with its customer base.
Allocation of Consideration Transferred
The acquisition was accounted for as a business combination under ASC 805 Business Combinations. The estimated total purchase price of $98.2 million was allocated to the net tangible and intangible assets based on their fair values as of the date of the completion of the acquisition as follows (in thousands):
|
Inventory
|
$ | 13,256 | ||
|
Composite intangible assets
|
62,800 | |||
|
Supply agreement
|
872 | |||
|
Goodwill
|
21,253 | |||
|
Total
|
$ | 98,181 |
As of the effective date of the acquisition, inventories are required to be measured at fair value. The fair value of inventory of $13.3 million was based on assumptions applied to the IDT NSE inventory acquired. In estimating the fair value of inventory, the Company made assumptions about projected selling prices and the remaining selling and manufacturing efforts associated with the inventory.
In conjunction with the IDT NSE Acquisition, the Company entered into a supply agreement with IDT. The supply agreement allows the Company to source certain finished products from IDT generally at its cost for a contracted period of time. IDT's pricing to the Company was considered to be below market price in most cases. Accordingly, the Company recorded an asset upon the signing of the agreement representing the difference between IDT prices and estimated market prices for those products based on quantities they currently estimate they will purchase under the supply agreement. The Company will amortize the asset associated with the supply agreement and increase its inventory carrying value as products are purchased under the supply agreement.
NETLOGIC MICROSYSTEMS, INC.
NOTES TO CONSOLIDATED FINANCIAL STATEMENTS—(Continued)
December 31, 2010
Composite intangible assets consist of products which have reached technological feasibility and include search accelerator, network search engine and route accelerator product families. The value of the developed technology was determined by discounting estimated net future cash flows of these products. Composite intangible assets consisted of acquired IDT existing technology and customer relationships. Because no future products were planned in the business acquired, and market participants would continue to sell products solely under existing relationships until the products became obsolete, both components of the asset were deemed to have the same useful lives and were treated as a composite asset. There are six composite assets, each represented by a product line with its own fair value supported by an underlying cashflow projection. Their respective useful lives of two to nine years were based on the period of remaining significant cashflow streams by product. The Company is amortizing these composite intangible assets on a straight-line basis over the respective estimated lives.
Amortization of composite intangible assets has been included in cost of revenue.
Of the total estimated purchase price paid at the time of acquisition, approximately $21.3 million has been allocated to goodwill. Goodwill represents the excess of the purchase price of an acquired business over the fair value of the underlying net tangible and intangible assets and which is deductible for tax purposes in tax jurisdictions which the Company pays taxes. Among the factors that contributed to a purchase price in excess of the fair value of the net tangible and intangible assets were expected benefits from economies of scale by combining the IDT NSE assets with the Company's business. In accordance with ASC 350 Intangibles—Goodwill and Other, goodwill is not being amortized, but instead will be tested for impairment at least annually and more frequently if certain indicators of impairment are present. In the event that management determines that the value of goodwill has become impaired, the Company will record an impairment charge during the fiscal quarter in which the determination is made.
The amount of revenue included in the Company's consolidated statement of operations from the IDT NSE and RMI acquisition dates to December 31, 2009 was approximately $30.7 million.
Pro Forma Data for IDT NSE and RMI Acquisitions
The following table presents the unaudited pro forma results of the Company as though the IDT NSE and RMI acquisitions described above occurred as of January 1, 2008. The data below includes the historical results of the Company and each of these acquisitions on a standalone basis through the respective acquisition closing dates. Such historical results included acquisition-related costs totaling $2.0 million recorded by RMI in 2009, as well as restructuring and impairment charges totaling $3.1 million during the fiscal year ended March 29, 2009 and $2.4 million during the six months ended June 28, 2009 recorded by IDT prior to the Company's acquisition of the NSE business. Adjustments have been made for the estimated fair value adjustment related to acquired inventory, amortization of intangible assets, and the related income tax impact of the pro forma adjustments. No adjustments were made to interest and related expenses associated with debt financing of these acquisitions or the change in contingent earn-out liability recorded by the Company in 2009. The pro forma information presented as follows does not purport to be indicative of the results that would have been achieved had both acquisitions been made as of those dates nor of the results which may occur in the future (in thousands, except per share amounts):
|
Year ended December 31,
|
||||||||
|
2009
|
2008
|
|||||||
|
Revenue
|
$ | 257,990 | $ | 282,464 | ||||
|
Net loss
|
(105,378 | ) | (81,278 | ) | ||||
|
Net loss per share - basic and diluted
|
(1.92 | ) | (1.52 | ) | ||||
NETLOGIC MICROSYSTEMS, INC.
NOTES TO CONSOLIDATED FINANCIAL STATEMENTS—(Continued)
December 31, 2010
NOTE 3—GOODWILL AND OTHER INTANGIBLE ASSETS
The following table summarizes the activity related to the carrying value of our goodwill during the years ended December 31, 2010 and 2009 (in thousands):
|
December 31,
|
||||||||
|
2010
|
2009
|
|||||||
|
Beginning balance
|
$ | 112,700 | $ | 68,712 | ||||
|
IDT NSE acquisition
|
- | 21,253 | ||||||
|
RMI acquisition
|
- | 22,704 | ||||||
|
Other adjustments
|
- | 31 | ||||||
|
Ending balance
|
$ | 112,700 | $ | 112,700 | ||||
As of December 31, 2010 and December 31, 2009, goodwill represented approximately 16% and 21% of the Company’s total assets.
The following table summarizes the components of other intangible assets and related accumulated amortization balances, which were recorded as a result of prior business combinations (in thousands):
|
December 31, 2010
|
December 31, 2009
|
|||||||||||||||||||||||
|
Gross Carrying
Amount
|
Accumulated
Amortization
|
Net Carrying
Amount
|
Gross Carrying
Amount
|
Accumulated
Amortization
|
Net Carrying
Amount
|
|||||||||||||||||||
|
Other intangible assets:
|
||||||||||||||||||||||||
|
Developed technology
|
$ | 36,880 | $ | (28,794 | ) | $ | 8,086 | $ | 36,880 | $ | (19,821 | ) | $ | 17,059 | ||||||||||
|
Composite intangible asset
|
74,046 | (22,176 | ) | 51,870 | 74,046 | (10,560 | ) | 63,486 | ||||||||||||||||
|
Patents and core technology
|
125,140 | (23,371 | ) | 101,769 | 77,390 | (5,159 | ) | 72,231 | ||||||||||||||||
|
Customer relationships
|
20,700 | (6,006 | ) | 14,694 | 20,700 | (3,246 | ) | 17,454 | ||||||||||||||||
|
Tradenames and trademarks
|
2,200 | (856 | ) | 1,344 | 2,200 | (122 | ) | 2,078 | ||||||||||||||||
|
Non-competition agreements
|
400 | (187 | ) | 213 | 400 | (27 | ) | 373 | ||||||||||||||||
|
Intellectual property licenses
|
3,472 | (610 | ) | 2,862 | 3,472 | (88 | ) | 3,384 | ||||||||||||||||
|
Other intangible assets
|
256 | (256 | ) | - | 256 | (103 | ) | 153 | ||||||||||||||||
|
Supply agreement
|
872 | (872 | ) | - | 872 | (245 | ) | 627 | ||||||||||||||||
|
In-process resarch and development
|
- | - | - | 46,500 | - | 46,500 | ||||||||||||||||||
|
Total
|
$ | 263,966 | $ | (83,128 | ) | $ | 180,838 | $ | 262,716 | $ | (39,371 | ) | $ | 223,345 | ||||||||||
The following table presents details of the amortization of intangible assets included in the cost of revenue and operating expenses categories for the years ended December 31, 2010, 2009 and 2008, except for amortization related to supply agreement and other intangible assets (in thousands):
|
Year ended December 31,
|
||||||||||||
|
2010
|
2009
|
2008
|
||||||||||
|
Cost of revenue
|
$ | 39,458 | $ | 18,865 | $ | 11,919 | ||||||
|
Operating expenses:
|
||||||||||||
|
Selling, general and administrative
|
3,652 | 1,759 | 1,380 | |||||||||
NETLOGIC MICROSYSTEMS, INC.
NOTES TO CONSOLIDATED FINANCIAL STATEMENTS—(Continued)
December 31, 2010
As of December 31, 2010, the estimated future amortization expense of other intangible assets is as follows (in thousands):
|
Fiscal Year Ending
|
Estimated
Amortization
|
|||
|
2011
|
$ | 43,577 | ||
|
2012
|
35,457 | |||
|
2013
|
29,015 | |||
|
2014
|
16,072 | |||
|
2015
|
14,035 | |||
|
Thereafter
|
42,682 | |||
|
Total
|
$ | 180,838 | ||
NOTE 4—BALANCE SHEET COMPONENTS:
The following table summarizes the significant components of assets as of December 31, 2010 and 2009 (in thousands):
|
December 31,
|
||||||||
|
2010
|
2009
|
|||||||
|
Accounts receivables:
|
||||||||
|
Trade accounts receivables
|
$ | 21,922 | $ | 26,261 | ||||
|
Less: Allowance for doubtful accounts and customer returns
|
(2,093 | ) | (1,124 | ) | ||||
| $ | 19,829 | $ | 25,137 | |||||
|
Inventories:
|
||||||||
|
Finished goods
|
$ | 18,971 | $ | 18,147 | ||||
|
Work-in-progress
|
17,319 | 26,966 | ||||||
| $ | 36,290 | $ | 45,113 | |||||
|
Property and equipment, net:
|
||||||||
|
Machinery and equipment
|
$ | 12,347 | $ | 9,352 | ||||
|
Software
|
24,928 | 19,779 | ||||||
|
Furniture and fixtures
|
998 | 393 | ||||||
|
Leasehold improvements
|
790 | 292 | ||||||
| 39,063 | 29,816 | |||||||
|
Less: Accumulated depreciation and amortization
|
(18,556 | ) | (16,538 | ) | ||||
| $ | 20,507 | $ | 13,278 | |||||
|
Other assets:
|
||||||||
|
Deferred tax assets, non current
|
$ | 54,920 | $ | 44,014 | ||||
|
Long-term investments
|
7,676 | 1,500 | ||||||
|
Other assets
|
3,776 | 733 | ||||||
| $ | 66,372 | $ | 46,247 | |||||
Depreciation and amortization expense related to property and equipment for the years ended December 31, 2010, 2009 and 2008 was $8.9 million, $4.3 million, and $3.9 million, respectively.
NETLOGIC MICROSYSTEMS, INC.
NOTES TO CONSOLIDATED FINANCIAL STATEMENTS—(Continued)
December 31, 2010
The following table summarizes the significant components of liabilities as of December 31, 2010 and 2009 (in thousands):
|
December 31,
|
||||||||
|
2010
|
2009
|
|||||||
|
Accrued Liabilities:
|
||||||||
|
Acrrued payroll and related expenses
|
$ | 11,219 | $ | 11,335 | ||||
|
Accrued inventory purchases
|
1,967 | 10,210 | ||||||
|
Accrued licenses
|
4,232 | 1,430 | ||||||
|
Accrued warranty
|
2,270 | 1,534 | ||||||
|
Other accrued expenses
|
8,160 | 9,457 | ||||||
| $ | 27,848 | $ | 33,966 | |||||
|
Other Liabilities:
|
||||||||
|
Income taxes
|
$ | 35,434 | $ | 34,002 | ||||
|
Other liabilities
|
2,348 | 212 | ||||||
| $ | 37,782 | $ | 34,214 | |||||
The following table summarizes the activity related to the product warranty liability during the years ended December 31, 2010 and 2009 (in thousands):
|
December 31,
|
||||||||
|
2010
|
2009
|
|||||||
|
Warranty accrual:
|
||||||||
|
Beginning balance
|
$ | 1,534 | $ | 1,445 | ||||
|
Provision for warranty
|
1,390 | 294 | ||||||
|
Settlements made during the period
|
(654 | ) | (205 | ) | ||||
|
Ending balance
|
$ | 2,270 | $ | 1,534 | ||||
NOTE 5—COMMON STOCK:
The Company's restated certificate of incorporation authorizes it to issue 200,000,000 shares of $0.01 par value per share Common Stock. Occasionally, the Company may sell shares to employees or other service providers with a right of repurchase of the Company subject to vesting, which is generally over a four year period from the earlier of grant date or employee hire date, as applicable, until vesting is complete. At December 31, 2010 there were no shares subject to such a right of repurchase.
On February 16, 2010, the Board of Directors approved a 2 for 1 stock split of the Company’s common stock, to be effected pursuant to the issuance of additional shares as a stock dividend. The stock dividend was paid on March 19, 2010 to stockholders of record as of March 5, 2010.
Warrants for common stock
At December 31, 2010, there were no outstanding warrants.
Stockholder rights plan
The Company adopted a stockholder rights plan that generally entitles its stockholders to rights to acquire additional shares of the common stock when a third party acquires 15.0% of the Company's common stock or commences or announces its intent to commence a tender offer for at least 15.0% of the common stock, other than for certain stockholders that were stockholders prior to the Company's initial public offering as to whom this threshold is 20.0%. This plan could delay, deter or prevent an investor from acquiring the Company in a transaction that could otherwise result in its stockholders receiving a premium over the market price for their shares of common stock.
NETLOGIC MICROSYSTEMS, INC.
NOTES TO CONSOLIDATED FINANCIAL STATEMENTS—(Continued)
December 31, 2010
Significant Equity Transactions
On March 25, 2010, the Company entered into an underwriting agreement with Credit Suisse Securities (USA) LLC and Morgan Stanley & Co. Incorporated, as representatives of the several underwriters named in the underwriting agreement, and stockholders of the Company identified in the underwriting agreement, relating to the sale in a public offering of the Company's common stock, par value $0.01 per share, at a public offering price of $28.85 per share, less discounts and commissions of $1.37 per share. Under the terms and conditions of the underwriting agreement, the Company issued and sold approximately 4.1 million shares and received $111.7 million in cash, after payment of related underwriting commissions and expenses. The offering was made pursuant to an automatic shelf registration statement.
In December 2009, the Company entered into a Purchase Agreement with an asset management firm, providing for the sale and issuance of a total of 1,400,800 shares of its common stock. Pursuant to the Purchase Agreement, the asset management firm agreed on behalf of a group of customers for which it acted as investment manager to purchase, and the Company agreed to sell and issue, the shares at a purchase price per share of $21.13 according to the allocation specified in the Purchase Agreement. The sale closed on December 23, 2009, and the Company received net proceeds of $29.7 million, after deducting offering expenses of approximately $0.1 million.
In connection with the acquisition of RMI, the Company delivered merger consideration of approximately 9.9 million shares of it common stock to the paying agent for distribution to the holders of RMI capital stock. Approximately 10% of the shares of the Company's common stock were held in escrow as security for claims and expenses that might arise during the first 12 months following the closing date and were subsequently released to the former holders of RMI capital stock in October 2010. The closing price of a share of the Company's common stock on October 30, 2009 was $19.01. Subsequently, in December 2010, the Company issued approximately 2.4 million additional shares of its common stock (plus cash, refer to Note 2 Business Combinations and Asset Purchase) to the former holders of RMI capital stock as earn-out consideration based upon achievement of specified percentages of revenue targets for the 12-month period from November 1, 2009 through October 31, 2010. Additionally, in connection with the merger, and pursuant to NASDAQ Listing Rule 5635(a), the Company granted from its total authorized shares, and not pursuant to a pre-existing stock plan, restricted stock units representing the right to acquire a total of 2,472,162 shares of common stock and stock options for the purchase of a total of 1,365,046 shares of common stock options to those employees of RMI who continued as employees of the Company or one of its subsidiaries.
Registration Statements
The Company has an effective shelf registration statement on SEC Form S-3 that will not expire until 2012. This registration statement on Form S-3 permits the Company to sell, in one or more public offerings, shares of its common stock, shares of preferred stock or debt securities, or any combination of such securities, for proceeds in an aggregate amount of up to $120 million, net of previously sold under the registration statement. In December 2009, the Company sold 1,400,800 shares of common stock pursuant to this registration statement for approximately $29.7 million, as discussed above. To date no other securities have been issued pursuant to this registration statement.
NETLOGIC MICROSYSTEMS, INC.
NOTES TO CONSOLIDATED FINANCIAL STATEMENTS—(Continued)
December 31, 2010
NOTE 6—STOCK OPTION PLANS:
The Company has adopted stock plans that provide for grants to employees of equity-based awards, which include stock options and restricted stock. In addition, the Company has an employee stock purchase plan that allows employees to purchase its common stock at a discount through payroll deductions. The estimated fair value of the Company’s equity-based awards, less expected forfeitures, is amortized over the service period of the awards. The Company also grants stock options and restricted stock to new employees in accordance with Nasdaq Marketplace rule 5635(c)(4) as an inducement material to the new employee’s entering into employment with the Company.
The Company's Amended and Restated 2004 Equity Incentive Plan and the 2000 Stock Plan (collectively, the "Plans") provide for the granting of stock options to employees, directors and consultants. Options granted under the Plans may be either incentive stock options or nonqualified stock options. Incentive stock options ("ISO") may be granted only to the Company's employees (including officers and directors who are also employees). Nonqualified stock options ("NSO") may be granted to our employees, non-employee directors and consultants. The Company no longer grants options under the 2000 Stock Plan. Restricted stock units and restricted stock may also be granted under the Plans. A total of 15,546,382 shares of common stock have been reserved for awards issuable under the Amended and Restated 2004 Equity Incentive Plan, which further provides for an annual increase of 300,000 shares on each January 1. At December 31, 2010, 3,386,094 shares were available for grant under the Amended and Restated 2004 Equity Incentive Plan, including an increase of 2,700,000 shares under the Amended and Restated 2004 Equity Incentive Plan approved by the Company’s stockholders at the Company’s 2010 Annual Meeting of Stockholders.
Options under the Plans may be granted for periods of up to ten years. Under the Plans, the exercise price of (i) an ISO shall not be less than 100% of the estimated fair value of the shares on the date of grant, and (ii) an ISO granted to a 10% stockholder shall not be less than 110% of the estimated fair value of the shares on the date of grant. The exercise price of an NSO under the 2004 Plan may be any price as determined by the board of directors. Options granted under the 2000 Stock Plan were exercisable immediately subject to repurchase options held by the Company which lapse over a maximum period of five years at such times and under such conditions as determined by the board of directors. The 2004 Plan also allows for the grant of restricted common stock. No shares of restricted common stock were granted in 2010, 2009 and 2008.
In conjunction with the Aeluros acquisition in October 2007, the Company assumed Aeluros' 2001 Stock Option/Stock Issuance Plan (the "Aeluros Plan"), and reserved 208,000 shares of common stock under the Aeluros Plan for issuance upon exercise of assumed outstanding options. The related options are included in the table below. The options vest over four to five years and have eight to ten year terms. The Company no longer grants options under the Aeluros Plan.
In January 2008, the Company adopted the 2008 New Employee Inducement Incentive Plan (the "2008 Plan") and reserved 500,000 shares of common stock under the 2008 Plan for the granting of non-statutory stock options and restricted units to retain the services of new employees and directors, or following a bona fide period of non-employment, as an inducement material to the individual's entering employment with the Company within the meaning of Rule 5635(c)(4) (formerly Rule 4350(i)(l)(A)(iv)) of the Nasdaq Marketplace Rules. In July 2009, the Company increased the reserve of shares issuable under the 2008 Plan by 500,000 shares. At December 31, 2010, 87,000 shares were available for grant.
NETLOGIC MICROSYSTEMS, INC.
NOTES TO CONSOLIDATED FINANCIAL STATEMENTS—(Continued)
December 31, 2010
A summary of all options activity under the Plans is presented below (number of shares in thousands):
|
Options Outstanding
|
||||||||
|
Number of
Shares
|
Weighted
Average
Exercise
Price
|
|||||||
|
Balance at December 31, 2007
|
9,284 | $ | 11.20 | |||||
|
Options granted
|
834 | 14.32 | ||||||
|
Options exercised
|
(994 | ) | 7.32 | |||||
|
Options forfeited or expired
|
(778 | ) | 14.17 | |||||
|
Balance at December 31, 2008
|
8,346 | 11.69 | ||||||
|
Options granted
|
622 | 12.46 | ||||||
|
Options granted - RMI
|
1,366 | 19.16 | ||||||
|
Options exercised
|
(1,564 | ) | 9.92 | |||||
|
Options forfeited or expired
|
(98 | ) | 14.77 | |||||
|
Balance at December 31, 2009
|
8,672 | 13.21 | ||||||
|
Options granted
|
- | - | ||||||
|
Options exercised
|
(2,306 | ) | 11.97 | |||||
|
Options forfeited or expired
|
(68 | ) | 16.54 | |||||
|
Balance at December 31, 2010
|
6,298 | $ | 13.63 | |||||
The following table summarizes information about options granted and outstanding under the Plans at December 31, 2010 (number of shares in thousands):
|
Options Outstanding
|
Options Exercisable
|
|||||||||||||||||||||||||||||
|
Range of Exercise Prices
|
Outstanding
(in thousands)
|
Weighted
Average
Remaining
Contractual
Life
(in years)
|
Weighted
Average
Exercise
Price
|
Aggregate
Intrinsic
Value
(in thousands)
|
Exercisable
(in thousands)
|
Weighted
Average
Exercise
Price
|
Aggregate
Instrinsic
Value
(in thousands)
|
|||||||||||||||||||||||
| $ | 1.00-$6.50 | 813 | 3.66 | $ | 5.01 | $ | 21,455 | 811 | $ | 5.02 | $ | 21,403 | ||||||||||||||||||
| $ | 6.63-$10.95 | 1,157 | 6.26 | $ | 10.29 | 24,432 | 788 | $ | 10.01 | 16,857 | ||||||||||||||||||||
| $ | 11.44-$13.62 | 901 | 5.84 | $ | 12.57 | 16,984 | 840 | $ | 12.59 | 15,812 | ||||||||||||||||||||
| $ | 13.63-$15.15 | 936 | 6.72 | $ | 14.63 | 15,711 | 615 | $ | 14.91 | 10,154 | ||||||||||||||||||||
| $ | 15.20-$16.96 | 888 | 6.59 | $ | 16.19 | 13,504 | 669 | $ | 16.29 | 10,119 | ||||||||||||||||||||
| $ | 17.41-$18.91 | 283 | 5.76 | $ | 17.98 | 3,805 | 244 | $ | 18.04 | 3,261 | ||||||||||||||||||||
| $ | 19.16-$19.16 | 1,223 | 8.84 | $ | 19.16 | 14,977 | 200 | $ | 19.16 | 2,453 | ||||||||||||||||||||
| $ | 19.67-$20.22 | 97 | 8.12 | $ | 19.75 | 1,131 | 95 | $ | 19.74 | 1,105 | ||||||||||||||||||||
| $ | 1.00-$20.22 | 6,298 | 6.49 | $ | 13.63 | $ | 111,999 | 4,262 | $ | 12.37 | $ | 81,164 | ||||||||||||||||||
The aggregate intrinsic value in the table above is based on the Company's closing stock price of $31.41 as of December 31, 2010, which would have been received by the option holders had all option holders exercised their in the money options as of that date. The weighted average remaining contractual term of options exercisable at December 31, 2010 was approximately 6.49 years.
NETLOGIC MICROSYSTEMS, INC.
NOTES TO CONSOLIDATED FINANCIAL STATEMENTS—(Continued)
December 31, 2010
As of December 31, 2010, there was approximately $12.9 million of total unrecognized compensation cost related to unvested stock options granted and outstanding with a weighted average remaining vesting period of 2.59 years.
The total intrinsic value of options exercised during the years ended December 31, 2010, 2009, and 2008 were as follows (in thousands):
|
Year ended December 31,
|
||||||||||||
|
2010
|
2009
|
2008
|
||||||||||
|
Total intrinsic value of options exercised
|
$ | 38,730 | $ | 15,560 | $ | 9,023 | ||||||
The Company's non-vested stock awards consists of restricted stock awards, restricted stock units, and performance-based restricted stock units. A summary of non-vested stock awards activity during the year ended December 31, 2010 is presented below (number of shares in thousands):
|
Awards Outstanding
|
||||||||
|
Number of
Shares
|
Weighted-
Average
Grant Date Fair Value
|
|||||||
|
Balance at December 31, 2007
|
994 | $ | 13.83 | |||||
|
Granted
|
1,170 | 13.47 | ||||||
|
Vested
|
(278 | ) | 12.10 | |||||
|
Forfeited
|
(230 | ) | 14.10 | |||||
|
Balance at December 31, 2008
|
1,656 | 13.83 | ||||||
|
Granted
|
1,498 | 17.94 | ||||||
|
Granted - RMI
|
2,472 | 20.04 | ||||||
|
Vested
|
(458 | ) | 15.41 | |||||
|
Forfeited
|
(68 | ) | 16.52 | |||||
|
Balance at December 31, 2009
|
5,100 | 17.87 | ||||||
|
Granted
|
980 | 28.95 | ||||||
|
Vested
|
(1,172 | ) | 17.20 | |||||
|
Forfeited
|
(250 | ) | 19.62 | |||||
|
Balance at December 31, 2010
|
4,658 | $ | 20.27 | |||||
The fair value of the Company's non-vested stock awards is calculated based upon the fair market value of the Company's stock at the date of grant. As of December 31, 2010, there was $56.7 million of total unrecognized compensation cost related to nonvested stock awards granted, which is expected to be recognized over a weighted average period 2.43 years. The total fair value of stock awards that vested during the years ended December 31, 2010, 2009, and 2008, was $20.2 million, $7.1 million, and $3.4 million, respectively.
NETLOGIC MICROSYSTEMS, INC.
NOTES TO CONSOLIDATED FINANCIAL STATEMENTS—(Continued)
December 31, 2010
Performance-Based Restricted Stock Units. During the fourth quarter of 2007, in connection with the Aeluros acquisition the Company entered into performance-based restricted stock unit award agreements with certain former Aeluros employees. During the year ended December 31, 2008, the Company modified the vesting conditions of 31,000 shares of performance-based restricted stock units and reversed $199,000 of stock-based compensation that had been recognized previously.
2004 Employee Stock Purchase Plan
In July 2004, the Company adopted the 2004 employee stock purchase plan, or ESPP, which complies with the requirements of Section 423 of the Internal Revenue Code. The shares reserved under the 2004 ESPP are subject to an automatic increase on January 1 of each year equal to the lesser of 150,000 shares or 0.5% of the outstanding shares of the Company's common stock at the end of the preceding fiscal year. The 2004 ESPP permits eligible employees (as defined in the plan) to purchase up to $25,000 worth of the Company's common stock annually over the course of two six-month offering periods, other than the initial two-year offering period which commenced on July 8, 2004. The purchase price to be paid by participants is 85% of the price per share of the Company's common stock either at the beginning or the end of each six-month offering period, whichever is less. At the Company's 2006 Annual Meeting of Stockholders held on May 18, 2006, its stockholders approved the reduction in the number of shares reserved under the 2004 ESPP by 1,400,000 shares, and the transfer of those reserved shares to their 2004 Equity Incentive Plan. During the year ended December 31, 2010, 2009 and 2008, approximately 193,000, 132,000 shares, and 106,000 shares, respectively, were issued under the Purchase Plan, and approximately 278,000 shares remain available for future issuance at December 31, 2010. The 2004 ESPP terminates in May 2014.
Stock-Based Compensation Expense
The total stock-based compensation expense recognized for the years ended December 31, 2010, 2009 and 2008 was allocated as follows (in thousands):
|
Year ended December 31,
|
||||||||||||
|
2010
|
2009
|
2008
|
||||||||||
|
Cost of revenue
|
$ | 915 | $ | 672 | $ | 1,030 | ||||||
|
Research and development
|
25,177 | 21,527 | 9,474 | |||||||||
|
Selling, general and administrative
|
21,549 | 18,556 | 5,988 | |||||||||
|
Total stock-based compensation expense
|
$ | 47,641 | $ | 40,755 | $ | 16,492 | ||||||
In addition, the Company capitalized approximately $0.1 million and $0.1 million of stock-based compensation in inventory as of December 31, 2010 and 2009, respectively, which represented indirect manufacturing costs related to its inventory.
Valuation Assumptions
For the years ended December 31, 2010, 2009, and 2008, the fair value of stock options including options assumed in connection with the Aeluros acquisition, and granted under the Plans, were estimated at the date of grant (or date of acquisition for options assumed) with the following weighted-average assumptions (there were no stock options granted during the year ended December 31, 2010):
|
Year ended December 31,
|
||||||||||||
|
2010
|
2009
|
2008
|
||||||||||
|
Stock Option Plans:
|
||||||||||||
|
Risk-free interest rate
|
- | 2.22 | % | 3.12 | % | |||||||
|
Expected life of options (in years)
|
- | 5.65 | 5.43 | |||||||||
|
Expected dividend yield
|
- | 0.00 | % | 0.00 | % | |||||||
|
Volatility
|
- | 55 | % | 58 | % | |||||||
|
Weighted average fair value
|
- | $ | 8.80 | $ | 7.73 | |||||||
|
Employee Stock Purchase Plan:
|
||||||||||||
|
Risk-free interest rate
|
0.20 | % | 0.30 | % | 2.74 | % | ||||||
|
Expected life of options (in years)
|
0.50 | 0.50 | 0.50 | |||||||||
|
Expected dividend yield
|
0.00 | % | 0.00 | % | 0.00 | % | ||||||
|
Volatility
|
43 | % | 67 | % | 53 | % | ||||||
|
Weighted average fair value
|
$ | 6.81 | $ | 4.57 | $ | 4.95 | ||||||
NETLOGIC MICROSYSTEMS, INC.
NOTES TO CONSOLIDATED FINANCIAL STATEMENTS—(Continued)
December 31, 2010
NOTE 7—INCOME TAXES:
The components of income (loss) before income taxes consisted of the following (in thousands):
|
Year ended December 31,
|
||||||||||||
|
2010
|
2009
|
2008
|
||||||||||
|
Domestic
|
$ | (70,416 | ) | $ | (40,104 | ) | $ | (8,343 | ) | |||
|
Foreign
|
(427 | ) | (10,118 | ) | 9,983 | |||||||
|
Income (loss) before income taxes
|
$ | (70,843 | ) | $ | (50,222 | ) | $ | 1,640 | ||||
The components of the benefit from income taxes are as follows (in thousands):
|
Year ended December 31,
|
||||||||||||
|
2010
|
2009
|
2008
|
||||||||||
|
Current:
|
||||||||||||
|
Federal
|
$ | 747 | $ | 3,484 | $ | 1,573 | ||||||
|
State
|
105 | (31 | ) | 559 | ||||||||
|
Foreign
|
615 | 190 | (176 | ) | ||||||||
|
Total current
|
1,467 | 3,643 | 1,956 | |||||||||
|
Deferred:
|
||||||||||||
|
Federal
|
$ | (4,958 | ) | $ | (9,574 | ) | $ | (2,895 | ) | |||
|
State
|
(981 | ) | 2,871 | (998 | ) | |||||||
|
Foreign
|
- | - | - | |||||||||
|
Total deferred
|
(5,939 | ) | (6,703 | ) | (3,893 | ) | ||||||
|
Benefit from income taxes
|
$ | (4,472 | ) | $ | (3,060 | ) | $ | (1,937 | ) | |||
The benefit from income taxes differs from the amount computed by applying the U.S. statutory federal rate to income (loss) before income tax as a result of the following (in thousands):
|
Year ended December 31,
|
||||||||||||
|
2010
|
2009
|
2008
|
||||||||||
|
Tax at statutory rate
|
$ | (24,795 | ) | $ | (17,577 | ) | $ | 574 | ||||
|
State taxes, net of federal benefit
|
(570 | ) | 2,772 | (635 | ) | |||||||
|
Nondeductible stock based compensation
|
448 | 1,333 | 1,673 | |||||||||
|
Foreign rate differential
|
(1,129 | ) | 9,598 | (3,832 | ) | |||||||
|
Research and development credits
|
(3,267 | ) | (1,289 | ) | (697 | ) | ||||||
|
Nondeductible acquisition related expenses
|
25,169 | 1,887 | - | |||||||||
|
Other
|
(328 | ) | 216 | 980 | ||||||||
|
Benefit from income taxes
|
$ | (4,472 | ) | $ | (3,060 | ) | $ | (1,937 | ) | |||
NETLOGIC MICROSYSTEMS, INC.
NOTES TO CONSOLIDATED FINANCIAL STATEMENTS—(Continued)
December 31, 2010
Deferred income taxes reflect the net tax effect of temporary differences between the carrying amounts of assets and liabilities for financial reporting and the amount used for income tax purposes. Significant components of the Company's deferred tax assets and liabilities consist of the following (in thousands):
|
December 31,
|
||||||||
|
2010
|
2009
|
|||||||
|
Deferred tax assets:
|
||||||||
|
Net operating loss carryforwards
|
$ | 32,872 | $ | 36,028 | ||||
|
Accrued liabilities and other
|
6,487 | 6,196 | ||||||
|
Deferred stock-based compensation
|
10,601 | 8,560 | ||||||
|
Depreciation and amortization
|
2,891 | 11,255 | ||||||
|
Research and development tax credits
|
21,968 | 17,123 | ||||||
| 74,819 | 79,162 | |||||||
|
Valuation allowance
|
(8,483 | ) | (7,043 | ) | ||||
|
Total deferred tax assets
|
66,336 | 72,119 | ||||||
|
Deferred tax liabilities:
|
||||||||
|
Acquired intangible assets and other
|
(2,988 | ) | (15,007 | ) | ||||
|
Net deferred tax assets
|
$ | 63,348 | $ | 57,112 | ||||
The following table presents the breakdown between current and non-current net deferred tax assets and liabilities (in thousands):
|
December 31,
|
||||||||
|
2010
|
2009
|
|||||||
|
Current deferred tax assets
|
$ | 8,428 | $ | 13,098 | ||||
|
Non-current deferred tax assets
|
54,920 | 44,014 | ||||||
|
Net deferred tax assets
|
$ | 63,348 | $ | 57,112 | ||||
The valuation allowance is based on the Company’s assessment that it cannot conclude that it is more than likely than not that certain deferred tax assets will be realized in the foreseeable future. As of December 31, 2010 and 2009, the Company had a valuation allowance of approximately $8.5 million and $7.0 million, respectively. In February 2009, the California 2009-2010 budget legislature was enacted into law, allowing companies to elect, for income tax purposes, to apply a single sales factor apportionment for years beginning after January 1, 2011. Based upon its anticipated election, the Company determined a need to establish a valuation allowance on certain deferred tax assets associated with its California research and development tax credits, totaling $8.5 million and $7.0 million at December 31, 2010 and 2009.
The deferred tax assets at December 31, 2010 exclude $9.0 million ($4.1 million at December 31, 2009) related to benefits of stock option deductions which, when recognized, will be allocated directly to contributed capital.
NETLOGIC MICROSYSTEMS, INC.
NOTES TO CONSOLIDATED FINANCIAL STATEMENTS—(Continued)
December 31, 2010
At December 31, 2010, the Company had federal and state net operating loss carryforwards of approximately $96.7 million and $144.4 million, respectively. These federal and state net operating loss carryforwards will expire commencing 2020 and 2017, respectively. The Company also has federal and state research and development tax credit carryforwards of approximately $21.8 million and $24 million, respectively. The federal tax credits carryforwards will expire commencing in 2020 and California tax credits have no expiration date.
For federal and state purposes, a portion of the Company's net operating loss carryforwards and research and development credits will be subject to certain limitation on annual utilization due to a change in ownership, as defined by federal and state tax law.
Undistributed earnings of the Company's foreign subsidiaries of approximately $33.3 million at December 31, 2010 are considered to be indefinitely reinvested and, accordingly, no provisions for federal and state income taxes have been provided thereon. The Company has calculated its indefinitely reinvested earnings on an entity by entity basis, excluding entities with negative earnings. Upon distribution of those earnings in the form of dividends or otherwise, the Company would be subject to both U.S. income taxes (subject to an adjustment for foreign tax credits) and withholding taxes payable to various foreign countries. Determination of the amount of unrecognized deferred income tax liability related to these earnings is not practicable.
The following table summarizes the activity related to the Company's unrecognized tax benefits (in thousands):
|
December 31,
|
||||||||
|
2010
|
2009
|
|||||||
|
Beginning balance
|
$ | 49,285 | $ | 16,492 | ||||
|
Increase related to current year tax positions
|
2,299 | 7,893 | ||||||
|
Increase related to tax positions of prior years
|
956 | 24,900 | ||||||
|
Decrease related to tax positions of prior years
|
(1,254 | ) | - | |||||
|
Ending balance
|
$ | 51,286 | $ | 49,285 | ||||
As of December 31, 2010 and 2009, a total of $44.6 million and $44.1 million, respectively, of the unrecognized tax benefits would affect the Company's effective tax rate if recognized.
The Company recognizes interest and penalties related to uncertain tax positions in income tax expense. As of December 31, 2010 and 2009, the Company has $0.8 million and $0.4 million of accrued interest and no penalties related to uncertain tax positions. The Company recognized total interest expense (benefit) of $0.4 million, ($0.1 million), and $0.5 million during the years ended December 31, 2010, 2009, and 2008. The tax years 1999-2010 remain open to examination by one or more of the major taxing jurisdictions in which the Company is subject to tax on its taxable income. The Company anticipates that it is reasonably possible that approximately $10 million of unrecognized tax benefits will decrease within the next twelve months due to the expiration of statute of limitations.
Our subsidiary in India has received tax benefits under the India Tax Holiday provision. The Tax Holiday in India expires on March 31, 2011. We received tax benefits of approximately $0.3 million in 2010 and $0.2 million in 2009. To maintain our eligibility for these benefits, we must meet certain agreed conditions. We expect to be able to meet those conditions, but if we are not able to achieve or maintain the required conditions, we may lose our eligibility for such benefits which could result in our income in India being taxed at the statutory rate of 30% instead of the agreed Tax Holiday rate of 0%. A loss of all or part of these tax benefits would adversely affect our results of operations and cash flows.
NETLOGIC MICROSYSTEMS, INC.
NOTES TO CONSOLIDATED FINANCIAL STATEMENTS—(Continued)
December 31, 2010
NOTE 8—COMMITMENTS AND CONTINGENCIES:
Leases
The Company acquires rights to use certain CAD tools under software licenses and other obligations that require installment payments that are due after 12 months. These arrangements have been accounted similar to capital leases.
The Company also leases its facilities under non-cancelable operating leases, which contain renewal options and escalation clauses, and expires through 2018. The terms of certain facility lease provide for rental payments on a graduated scale. The Company recognizes rent expense on a straight-line basis over the lease period and accrues for rent expense incurred but not paid. Rent expense for the years ended December 31, 2010, 2009 and 2008 was $4.1 million, $1.5 million, and $1.1 million, respectively.
Future minimum commitments as of December 31, 2010 under non-cancelable software licenses and operating lease agreements, including significant common area maintenance charges for facility leases, were as follows (in thousands):
|
Year Ending December 31,
|
Software licenses
and other
obligations
|
Operating
Leases
|
Total
|
|||||||||
|
2011
|
$ | 4,670 | $ | 744 | $ | 5,414 | ||||||
|
2012
|
2,081 | 2,490 | 4,571 | |||||||||
|
2013
|
- | 3,439 | 3,439 | |||||||||
|
2014
|
- | 3,526 | 3,526 | |||||||||
|
2015
|
- | 3,638 | 3,638 | |||||||||
|
2016 and thereafter
|
- | 8,368 | 8,368 | |||||||||
| 6,751 | $ | 22,205 | $ | 28,956 | ||||||||
|
Less: Interest component
|
(204 | ) | ||||||||||
|
Present value of minimum lease payment
|
6,547 | |||||||||||
|
Less: Current portion
|
(4,514 | ) | ||||||||||
|
Long-term portion of obligations
|
$ | 2,033 | ||||||||||
Purchase Commitments
At December 31, 2010, the Company had approximately $16.2 million in firm, non-cancelable and unconditional purchase commitments with its suppliers.
Contingencies
From time to time the Company is party to claims and litigation proceedings arising in the normal course of business. Currently, the Company does not believe that there are any claims or litigation proceeds involving matters that will result in the payment of monetary damages, net of any applicable insurance proceeds, that, in the aggregate, would be material in relation to its business, financial position, results of operations or cash flows. There can be no assurance, however, that any such matters will be resolved without costly litigation, in a manner that is not adverse to the Company’s business, financial position, results of operations or cash flows, or without requiring royalty payments in the future that may adversely impact gross margins.
NETLOGIC MICROSYSTEMS, INC.
NOTES TO CONSOLIDATED FINANCIAL STATEMENTS—(Continued)
December 31, 2010
Indemnities, Commitments and Guarantees
In the normal course of business, the Company has made certain indemnities, commitments and guarantees under which it may be required to make payments in relation to certain transactions. These include agreements to indemnify the Company's customers with respect to liabilities associated with the infringement of other parties' technology based upon its products, obligation to indemnify its lessors under facility lease agreements, and obligation to indemnify its directors and officers to the maximum extent permitted under the laws of the state of Delaware. The duration of such indemnification obligations, commitments and guarantees varies and, in certain cases, is indefinite. The Company has not recorded any liability for any such indemnification obligations, commitments and guarantees in the accompanying balance sheets. The Company does, however, accrue for losses for any known contingent liability, including those that may arise from indemnification provisions, when future payment is estimable and probable.
The Company has undertaken specified obligations in the event of an epidemic product failure under master purchase agreements with certain customers. In the event of an epidemic product failure, the Company’s obligations under these arrangements may have a material impact on the Company’s results of operations or financial condition.
Credit Facility
The Company terminated a senior secured revolving credit facility of $25 million with a group of banks during the third quarter of fiscal 2010, and as of December 31, 2010, had no available credit under that arrangement.
NOTE 9—SEGMENT INFORMATION:
The Company operates as one operating and reportable segment and sells its products to customers in North America, Asia and Europe. The components of revenue by geographic regions reported below were based on the customer’s ship-to address. The following is a summary of the geographic information related to revenues for the years ended December 31, 2010, 2009 and 2008:
|
Year ended December 31,
|
||||||||||||
|
2010
|
2009
|
2008
|
||||||||||
|
Revenue:
|
||||||||||||
|
United States
|
18 | % | 25 | % | 33 | % | ||||||
|
China
|
38 | % | 27 | % | 22 | % | ||||||
|
Malaysia
|
26 | % | 31 | % | 30 | % | ||||||
|
Other
|
18 | % | 16 | % | 15 | % | ||||||
|
Total
|
100 | % | 100 | % | 100 | % | ||||||
Substantially all of the Company's tangible assets are located in the United States of America.
NOTE 10—EMPLOYEE BENEFIT PLAN:
The Company sponsors a 401(k) defined contribution plan covering all employees. Contributions made by the Company are determined annually by the Board of Directors. To date the Company has not made any contributions to the plan.
NETLOGIC MICROSYSTEMS, INC.
NOTES TO CONSOLIDATED FINANCIAL STATEMENTS—(Continued)
December 31, 2010
NOTE 11—AVAILABLE-FOR-SALE INVESTMENTS:
The following is a summary of available-for-sale investments as of December 31, 2010; there were no available-for-sale investments at December 31, 2009 (in thousands):
|
December 31, 2010
|
||||||||||||||||
|
Amortized
Cost
|
Gross
Unrealized
Gain
|
Gross
Unrealized
Loss
|
Estimated
Fair
Value
|
|||||||||||||
|
U.S. government agency securities
|
$ | 153,864 | $ | 33 | $ | (80 | ) | $ | 153,817 | |||||||
|
U.S. treasury bills
|
16,414 | 1 | (1 | ) | 16,414 | |||||||||||
|
Money market funds
|
60,026 | - | - | 60,026 | ||||||||||||
|
Privately held debt investments
|
5,000 | - | - | 5,000 | ||||||||||||
|
Total
|
$ | 235,304 | $ | 34 | $ | (81 | ) | $ | 235,257 | |||||||
|
Reported as:
|
||||||||||||||||
|
Cash and cash equivalents
|
$ | 74,613 | $ | 1 | $ | (1 | ) | $ | 74,613 | |||||||
|
Marketable securities, short-term
|
155,691 | 33 | (80 | ) | 155,644 | |||||||||||
|
Other assets
|
5,000 | - | - | 5,000 | ||||||||||||
|
Total
|
$ | 235,304 | $ | 34 | $ | (81 | ) | $ | 235,257 | |||||||
Excluding money market funds, which do not have stated contractual maturity dates, the fair value of the Company's investments by contractual maturity at December 31, 2010 was as follows (in thousands):
|
December 31,
|
||||
|
2010
|
||||
|
Due in 1 year or less
|
$ | 166,242 | ||
|
Due after 1 year through 5 years
|
8,989 | |||
|
Total
|
$ | 175,231 | ||
Net unrealized holding gains and losses on available-for-sale investments are included as a separate component of stockholders' equity at December 31, 2010.
NETLOGIC MICROSYSTEMS, INC.
NOTES TO CONSOLIDATED FINANCIAL STATEMENTS—(Continued)
December 31, 2010
NOTE 12—FAIR VALUE MEASUREMENTS:
ASC 820 defines fair value as the price that would be received from selling an asset or paid to transfer a liability in an orderly transaction between market participants at the measurement date. When determining the fair value measurements for assets and liabilities required or permitted to be recorded at fair value, the Company considers the principal or most advantageous market in which it would transact and consider assumptions that market participants would use when pricing the asset or liability, such as inherent risk, transfer restrictions, and risk of nonperformance.
Fair Value Hierarchy
ASC 820 establishes a fair value hierarchy that requires an entity to maximize the use of observable inputs and minimize the use of unobservable inputs when measuring fair value. A financial instrument's categorization within the fair value hierarchy is based upon the lowest level of input that is significant to the fair value measurement. ASC 820 establishes three levels of inputs that may be used to measure fair value:
Level 1—Quoted prices in active markets for identical assets or liabilities.
Level 2—Observable inputs other than Level 1 prices such as quoted prices for similar assets or liabilities, quoted prices in markets with insufficient volume or infrequent transactions (less active markets), or model-derived valuations in which all significant inputs are observable or can be derived principally from or corroborated by observable market data for substantially the full term of the assets or liabilities.
Level 3—Unobservable inputs to the valuation methodology that are significant to the measurement of fair value of assets or liabilities.
Assets and Liabilities Measured at Fair Value on a Recurring Basis
The Company measures its financial assets, specifically cash equivalents, marketable securities and debt investment in a privately held corporation, at fair value on a recurring basis. The fair value of these financial assets was determined using the following inputs as of December 31, 2010 (in thousands):
|
Fair Value Measurements at December 31, 2010 Using
|
||||||||||||||||
|
Total
|
Quoted Prices in
Active Markets for
Identical Assets
(Level 1)
|
Significant Other
Observable Inputs
(Level 2)
|
Significant Other
Unobserv-able Inputs
(Level 3)
|
|||||||||||||
|
(in thousands)
|
||||||||||||||||
|
Assets:
|
||||||||||||||||
|
Money market funds (1)
|
$ | 60,026 | $ | 60,026 | $ | - | $ | - | ||||||||
|
U.S. government agency securities (2)
|
153,817 | - | 153,817 | - | ||||||||||||
|
U.S. treasury bills (3)
|
16,414 | - | 16,414 | - | ||||||||||||
|
Privately held debt investments (4)
|
5,000 | - | - | 5,000 | ||||||||||||
|
Total
|
$ | 235,257 | $ | 60,026 | $ | 170,231 | $ | 5,000 | ||||||||
|
(1)
|
Included in cash and cash equivalents on the Company's consolidated balance sheet.
|
| (2 | ) |
$14.6 million of which is included in cash and cash equivalents and $139.2 million of which is included in short-term marketable securities on the Company's consolidated balance sheet.
|
| (3 | ) |
$16.4 million of which is included in short-term marketable securities on the Company's consolidated balance sheet.
|
|
(4)
|
Included in other assets on the Company's consolidated balance sheet.
|
As of December 31, 2009, the Company's cash balance was $44.3 million, and it did not have cash equivalents or short-term investments.
NETLOGIC MICROSYSTEMS, INC.
NOTES TO CONSOLIDATED FINANCIAL STATEMENTS—(Continued)
December 31, 2010
The fair value of financial liabilities at December 31, 2009 was determined using the following inputs (in thousands):
|
Fair Value Measurements at December 31, 2009 Using
|
||||||||||||||||
|
Total
|
Quoted Prices in
Active Markets for
Identical Assets
(Level 1)
|
Significant Other
Observable Inputs
(Level 2)
|
Significant Other
Unobserv-able Inputs
(Level 3)
|
|||||||||||||
|
(in thousands)
|
||||||||||||||||
|
Liabilities:
|
||||||||||||||||
|
Contingent earn-out liability
|
$ | 11,687 | $ | - | $ | - | $ | 11,687 | ||||||||
Contingent earn-out liability
The Company estimated the fair value of the contingent earn-out liability based on its probability assessment of revenue achievements from acquired RMI products during the earn-out period – see Note 2 for further details. In developing these estimates, the Company considered its revenue projections, its historical results, and general macro-economic environment and industry trends. This fair value measurement is based on significant revenue inputs not observed in the market and thus represents a Level 3 measurement. Level 3 instruments are valued based on unobservable inputs that are supported by little or no market activity and reflect the Company’s own assumptions in measuring fair value. The Company’s fair value estimate of this liability was $9.7 million at the date of acquisition. Changes in the fair value of the contingent earn-out liability subsequent to the acquisition date, including changes arising from events that occurred after the acquisition date, such as changes in the Company’s estimate of revenue achievements, were recognized in earnings in the periods when the estimated fair value changed. In December 2010, the Company issued approximately 2.4 million shares of its common stock and $11.5 million in cash to the former holders of RMI capital stock as settlement for the earn-out liability.
The following table represents a reconciliation of the change in the fair value measurement of the contingent earn-out liability for the year ended December 31, 2010 and 2009:
|
December 31,
|
||||||||
|
2010
|
2009
|
|||||||
|
Beginning balance
|
$ | 11,687 | $ | - | ||||
|
Acquisition date fair value measurement
|
- | 9,679 | ||||||
|
Adjustment to fair value measurement charged to net income
|
71,725 | 2,008 | ||||||
|
Settlement of liability in stock
|
(71,884 | ) | - | |||||
|
Settlement of liability in cash
|
(11,528 | ) | - | |||||
|
Ending balance
|
$ | - | $ | 11,687 | ||||
NOTE 13—RELATED PARTY:
The Company leased its previous headquarters facility in Mountain View, California from an affiliate of Berg & Berg Enterprises, LLC, which it believes holds shares of the Company's common stock. During the year ended December 31, 2010, 2009 and 2008, the Company made lease payments of approximately $369,000, $1,029,000, and $1,089,000, respectively, under this lease arrangement. The Company executed a lease termination agreement for our previous headquarters facility in Mountain View, California and recorded a charge of approximately $0.5 million during the second quarter of fiscal 2010.
SUPPLEMENTARY FINANCIAL DATA
Selected Quarterly Financial Data (unaudited)
The following table presents selected unaudited consolidated financial data for each of the eight quarters in the two-year period ended December 31, 2010. In the Company's opinion, this unaudited information has been prepared on the same basis as the audited information and includes all adjustments (consisting of only normal recurring adjustments) necessary for a fair statement of the financial information for the period presented. Net income (loss) per share—basic and diluted, for the four quarters of each fiscal year may not sum to the total for the fiscal year because of the different number of shares outstanding during each period. All share and per share amounts presented below have been retroactively adjusted to reflect the 2-for-1 stock dividend that we declared with respect to our common stock and paid on March 19, 2010 to stockholders of record as of March 5, 2010.
|
Quarter
|
||||||||||||||||
|
First
|
Second
|
Third
|
Fourth
|
|||||||||||||
|
(in thousands, except per share data)
|
||||||||||||||||
|
Year Ended December 31, 2010
|
||||||||||||||||
|
Total revenue
|
$ | 86,251 | $ | 95,014 | $ | 100,052 | $ | 100,428 | ||||||||
|
Gross profit
|
$ | 34,920 | $ | 52,002 | $ | 59,529 | $ | 61,867 | ||||||||
|
Net income (loss)
|
$ | (57,337 | ) | $ | (4,835 | ) | $ | 5,209 | $ | (9,408 | ) | |||||
|
Net income (loss) per share - basic
|
$ | (0.99 | ) | $ | (0.08 | ) | $ | 0.08 | $ | (0.14 | ) | |||||
|
Net income (loss) per share - diluted
|
$ | (0.99 | ) | $ | (0.08 | ) | $ | 0.08 | $ | (0.14 | ) | |||||
|
Shares used in calculation - basic
|
57,993 | 62,875 | 63,632 | 65,155 | ||||||||||||
|
Shares used in calculation - diluted
|
57,993 | 62,875 | 67,933 | 65,155 | ||||||||||||
|
Year Ended December 31, 2009
|
||||||||||||||||
|
Total revenue
|
$ | 30,366 | $ | 32,485 | $ | 42,314 | $ | 69,524 | ||||||||
|
Gross profit
|
$ | 16,822 | $ | 18,498 | $ | 20,816 | $ | 19,302 | ||||||||
|
Net loss
|
$ | (3,917 | ) | $ | (2,156 | ) | $ | (3,853 | ) | $ | (37,236 | ) | ||||
|
Net loss per share - basic
|
$ | (0.09 | ) | $ | (0.05 | ) | $ | (0.09 | ) | $ | (0.71 | ) | ||||
|
Net loss per share - diluted
|
$ | (0.09 | ) | $ | (0.05 | ) | $ | (0.09 | ) | $ | (0.71 | ) | ||||
|
Shares used in calculation - basic
|
43,676 | 43,922 | 44,494 | 52,248 | ||||||||||||
|
Shares used in calculation - diluted
|
43,676 | 43,922 | 44,494 | 52,248 | ||||||||||||
|
CHANGES IN AND DISAGREEMENTS WITH ACCOUNTANTS ON ACCOUNTING AND FINANCIAL DISCLOSURE.
|
Not Applicable.
|
CONTROLS AND PROCEDURES.
|
Evaluation of Disclosure Controls and Procedures
Our management evaluated, with the participation of our Chief Executive Officer and Chief Financial Officer, the effectiveness of our disclosure controls and procedures as of December 31, 2010. Based upon that evaluation, our Chief Executive Officer and Chief Financial Officer concluded that our disclosure controls and procedures are effective to ensure that information we are required to disclose in reports that we file or submit under the Securities Exchange Act of 1934, as amended, is (i) recorded, processed, summarized and reported within the time periods specified in Securities and Exchange Commission rules and forms, and (ii) accumulated and communicated to our management, including our Chief Executive Officer and Chief Financial Officer, as appropriate to allow timely decisions regarding required disclosures as of December 31, 2010.
Management's Annual Report on Internal Control Over Financial Reporting
Our management is responsible for establishing and maintaining adequate internal control over financial reporting. Internal control over financial reporting cannot provide absolute assurance of achieving financial reporting objectives because of its inherent limitations. Internal control over financial reporting is a process that involves human diligence and compliance and is subject to lapses in judgment and breakdowns resulting from human failures. Internal control over financial reporting also can be circumvented by collusion or improper management override. Because of such limitations, there is a risk that material misstatements may not be prevented or detected on a timely basis by internal control over financial reporting. However, these inherent limitations are known features of the financial reporting process. Therefore, it is possible to design into the process safeguards to reduce, though not eliminate, this risk.
Our management assessed the effectiveness of the company's internal control over financial reporting as of December 31, 2010. In making this assessment, management used the criteria set forth by the Committee of Sponsoring Organizations of the Treadway Commission (COSO) in Internal Control—Integrated Framework. Based on this assessment using those criteria, management concluded that, as of December 31, 2010, our internal control over financial reporting was effective.
The effectiveness of the company's internal control over financial reporting as of December 31, 2010 has been audited by PricewaterhouseCoopers LLP, an independent registered public accounting firm, as stated in their attestation report which appears as part of this Annual Report on Form 10-K.
Changes in Internal Control Over Financial Reporting
There were no changes in our internal control over financial reporting that occurred during the fourth fiscal quarter that have materially affected, or are reasonably likely to materially affect, our internal control over financial reporting.
|
OTHER INFORMATION.
|
Not Applicable.
|
DIRECTORS, EXECUTIVE OFFICERS AND CORPORATE GOVERNANCE
|
Information relating to our executive directors, executive officers and corporate governance required to be provided in response to this item will be presented in our definitive proxy statement in connection with our 2011 Annual Meeting of Stockholders to be held on or about May 20, 2011, which information is incorporated into this report by reference. However, certain information required by this item concerning executive officers is set forth in Item 1 of Part I of this Report under caption “Executive Officers of the Registrant.”
We have adopted a Code of Business Conduct and Ethics for Employees, Executive Officers and Directors that applies to all of our employees and directors. We have posted this Code of Business Conduct and Ethics on the Company's website at www.netlogicmicro.com.
|
EXECUTIVE COMPENSATION
|
Information relating to executive compensation required to be provided in response to this item will be presented in our definitive proxy statement for our 2011 Annual Meeting of Stockholders to be held on or about May 20, 2011, which information is incorporated into this report by reference.
|
SECURITY OWNERSHIP OF CERTAIN BENEFICIAL OWNERS AND MANAGEMENT AND RELATED STOCKHOLDER MATTERS
|
Information relating to security ownership and securities authorized for issuance under equity compensation plans will be presented in our definitive proxy statement for our 2011 Annual Meeting of Stockholders, to be held on or about May 20, 2011, which information is also incorporated into this report by reference.
|
CERTAIN RELATIONSHIPS AND RELATED TRANSACTIONS, AND DIRECTOR INDEPENDENCE
|
Information required to be provided in response to this item will be presented in our definitive proxy statement for our 2011 Annual Meeting of Stockholders, to be held on or about May 20, 2011, which information is also incorporated into this report by reference.
|
PRINCIPAL ACCOUNTANT FEES AND SERVICES
|
Information required to be provided in response to this item will be presented in our definitive proxy statement for our 2011 Annual Meeting of Stockholders, to be held on or about May 20, 2011, which information is also incorporated into this report by reference.
|
EXHIBITS AND FINANCIAL STATEMENT SCHEDULES.
|
|
(a)
|
The following documents are filed as part of this report on Form 10-K:
|
|
(1)
|
Financial Statements. Reference is made to the Index to the registrant's the Financial Statements under Item 8 in Part II of this Form 10-K.
|
|
(2)
|
Financial Statement Schedules. The following consolidated financial statement schedule of the registrant is filed as part of this report on Form 10-K and should be read in conjunction with the Financial Statements of NetLogic Microsystems, Inc.:
|
Schedule II—Valuation and Qualifying Accounts for the years ended December 31, 2010, 2009 and 2008.
Schedules not listed above are omitted because they are not required, they are not applicable or the information is already included in the consolidated financial statements or notes thereto.
|
(3)
|
Exhibits. The exhibits listed on the accompanying index to exhibits in Item 15(b) below are filed as part of, or hereby incorporated by reference into, this report on Form 10-K.
|
|
(b)
|
Exhibits.
|
The exhibits listed below are required by Item 601 of Regulation S-K.
|
Exhibit
|
|
Description
|
|
2.1
|
|
Not in use.
|
|
2.2
|
|
Not in use.
|
|
2.3
|
|
Not in use.
|
|
2.4
|
Asset Purchase Agreement, dated as of April 30, 2009, between NetLogic Microsystems, Inc. and Integrated Device Technology, Inc., which includes the forms of Intellectual Property Cross License Agreement (Exhibit D) and Non-Competition Agreement (Exhibit E) (1)
|
|
|
2.5
|
Agreement and Plan of Merger Reorganization by and among NetLogic Microsystems, Inc., Roadster Merger Corporation, RMI Corporation and the Representative of Certain of the Holders of all of the Capital Stock of RMI Corporation dated as of May 31, 2009 (2)
|
|
|
3.1
|
|
Restated Certificate of Incorporation of the registrant filed on August 2, 2004 (3)
|
|
3.4
|
|
Bylaws of the registrant (4)
|
|
4.1
|
|
Specimen common stock certificate (5)
|
|
4.2
|
|
Rights Agreement by and between the registrant and Wells Fargo Bank, National Association, dated July 7, 2004 (6)
|
|
4.3*
|
|
Form of Stock Option Agreement (7)
|
|
4.4*
|
|
Form of Restricted Stock Unit Agreement (8)
|
|
10.1*
|
|
2000 Stock Plan and forms of related agreements (9)
|
|
10.2*
|
|
2004 Equity Incentive Plan (10)
|
|
10.2.1*
|
|
Form of Stock Option Agreement under Amended and Restated 2004 Equity Incentive Plan (11)
|
|
10.2.2*
|
|
Form of Restricted Stock Agreement under Amended and Restated 2004 Equity Incentive Plan (12)
|
|
10.3*
|
|
2004 Employee Stock Purchase Plan and forms of related agreements (13)
|
|
Exhibit
|
|
Description
|
|
10.4
|
|
Form of Indemnity Agreement (9)
|
|
10.5
|
|
Not in use.
|
|
10.9*
|
|
Form of Change-In-Control Agreement between the registrant and each of certain officers thereof (14)
|
|
10.10*
|
|
Incentive Bonus Plan effective May 5, 2005 (15)
|
|
10.11
|
|
Form of Master Purchase Agreement by and between the registrant and Cisco Systems, Inc. (16)†
|
|
10.12
|
|
Not in use.
|
|
10.13
|
|
Not in use.
|
|
10.14
|
|
Standard Form Lease by and between the registrant and Mission West Properties, L.P. dated May 3, 2004 (17)
|
|
10.15
|
|
Second Amendment to Lease between Mission West Charleston, LLC and NetLogic Microsystems, Inc. (18)
|
|
10.16*
|
|
Employment offer letter, dated April 12, 2000, between the registrant and Ronald Jankov (18)
|
|
10.17*
|
|
Employment offer letter, dated April 1, 1999, between the registrant and Roland Cortes (18)
|
|
10.18*
|
|
Employment offer letter, dated March 15, 2002, between the registrant and Ibrahim Korgav, as amended (18)
|
|
10.19*
|
|
Employment offer letter, dated February 9, 1996, between the registrant and Varadarajan Srinivasan (18)
|
|
10.20*
|
|
Employment offer letter, dated June 7, 1999, between the registrant and Marcia Zander (18)
|
|
10.21*
|
|
Form of Restricted Stock Unit Award Agreement (19)
|
|
10.22*
|
|
Employment offer letter, dated June 30, 2009, between the registrant and Behrooz Abdi. (20)
|
|
10.23*
|
|
Employment offer letter, dated July 11, 2007, between registrant and Michael Tate (21)
|
|
10.24
|
|
Not in use.
|
|
10.25
|
|
Purchase Agreement between Registrant and Wintec Industries, Inc.† (21)
|
|
10.26
|
|
Not in use.
|
|
10.27*
|
|
NetLogic Microsystems, Inc. 2008 New Employee Inducement Incentive Plan dated January 16, 2008 (22)
|
|
10.28*
|
|
Form of Restricted Stock Agreement for New Employee Inducement Grants (21)
|
|
10.29*
|
|
Form of Notice of Restricted Stock Unit Award and Agreement under the registrant's 2008 New Employee Inducement Incentive Plan (23)
|
|
10.30*
|
|
Form of Notice of Restricted Stock Unit Award and Agreement under the Amended and Restated 2004 Equity Incentive Plan (23)
|
|
10.31
|
|
Not in use.
|
|
10.32
|
|
Not in use.
|
|
Exhibit
|
Description
|
|
|
10.38
|
Office Lease by and between the registrant and Carr NP Properties, L.L.C. and 3975 Freedom Circle Drive L.L.C. dated March 19, 2010 (24)
|
|
|
21.1**
|
List of Subsidiaries of Registrant
|
|
|
23.1**
|
Consent of PricewaterhouseCoopers LLP, Independent Registered Public Accounting Firm
|
|
|
31.1**
|
Rule 13a-14 certification
|
|
|
31.2**
|
Rule 13a-14 certification
|
|
|
32.1**
|
Section 1350 certification
|
|
|
32.2**
|
Section 1350 certification
|
|
|
(1)
|
Incorporated by reference to Exhibit 2.4 to the registrant's Current Report on Form 8-K filed with the Securities and Exchange Commission on May 6, 2009.
|
|
(2)
|
Incorporated by reference to Annex A to the definitive proxy statement filed by the registrant with the Securities and Exchange Commission on September 30, 2009.
|
|
(3)
|
Incorporated by reference to the same-numbered exhibit to the registrant's Quarterly Report on Form 10-Q for the quarterly period ended June 30, 2004, filed with the Securities and Exchange Commission on August 20, 2004.
|
|
(4)
|
Incorporated by reference to the same-numbered exhibit to the registrant's Current Report on Form 8-K filed with the Securities and Exchange Commission on October 21, 2008.
|
|
(5)
|
Incorporated by reference to the same-numbered exhibit to Amendment No.3 to Form S-1 (Registration No. 333-114549) filed by the registrant with the Securities and Exchange Commission on June 21, 2004.
|
|
(6)
|
Incorporated by reference to Exhibit 99 (i) to Form 8-A (Registration No. 000-50838) filed by the registrant with the Securities and Exchange Commission on July 8, 2004.
|
|
(7)
|
Incorporated by reference to Exhibit 4.3 to Form S-8 (Registration No. 333-162765) filed by the registrant with the Securities and Exchange Commission on October 30, 2009.
|
|
(8)
|
Incorporated by reference to Exhibit 4.4 to Form S-8 (Registration No. 333-162765) filed by the registrant with the Securities and Exchange Commission on October 30, 2009.
|
|
(9)
|
Incorporated by reference to the same-numbered exhibit to Form S-1 (Registration No. 333-114549) filed by the registrant with the Securities and Exchange Commission on April 16, 2004.
|
|
(10)
|
Incorporated by reference to Exhibit 99.1 to the registrant’s Current Report on Form 8-K filed with the Securities and Exchange Commission on July 27, 2010.
|
|
(11)
|
Incorporated by reference to the same-numbered exhibit to the registrant's Quarterly Report on Form 10-Q for the quarterly period ended September 30, 2004, filed with the Securities and Exchange Commission on November 12, 2004.
|
|
(12)
|
Incorporated by reference to the same-numbered exhibit to the registrant's Annual Report on Form 10-K for the year ended December 31, 2005, filed with the Securities and Exchange Commission on February 28, 2006.
|
|
(13)
|
Incorporated by reference to the same-numbered exhibit to Form S-8 (Registration No. 333-117619) filed by the registrant with the Securities and Exchange Commission on July 23, 2004.
|
|
(14)
|
Incorporated by reference to the same-numbered exhibit to the registrant's Annual Report on Form 10-K for the year ended December 31, 2004, filed with the Securities and Exchange Commission on March 11, 2005.
|
|
(15)
|
Incorporated by reference to the same-numbered exhibit to the registrant's Quarterly Report on Form 10-Q for the quarterly period ended March 31, 2005, filed with the Securities and Exchange Commission on May 9, 2005.
|
|
(16)
|
Incorporated by reference to the same-numbered exhibit to the registrant's Quarterly Report on Form 10-Q for the quarterly period ended September 30, 2005, filed with the Securities and Exchange Commission on November 8, 2005.
|
|
(17)
|
Incorporated by reference to the same-numbered exhibit to the registrant's Quarterly Report on Form 10-Q for the quarterly period ended March 30, 2006, filed with the Securities and Exchange Commission on May 9, 2006.
|
|
(18)
|
Incorporated by reference to the same-numbered exhibit to Amendment No. 1 to Form S-1 (Registration No. 333-114549) filed by the registrant with the Securities and Exchange Commission on May 19, 2004.
|
|
(19)
|
Incorporated by reference to Exhibit 10.25 to Form S-8 (Registration No. 333-147064) filed by the registrant with the Securities and Exchange Commission on October 31, 2007.
|
|
(20)
|
Incorporated by reference to the same-numbered exhibit to the registrant's Annual Report on Form 10-K for the year ended December 31, 2009 filed with the Securities and Exchange Commission on February 26, 2010.
|
|
(21)
|
Incorporated by reference to same-numbered exhibit to the registrant's Quarterly Report on Form 10-Q for the quarter ended June 30, 2007 filed with the Securities and Exchange Commission on August 7, 2007.
|
|
(22)
|
Incorporated by reference to the same-numbered exhibit to the registrant's Annual Report on Form 10-K for the year ended December 31, 2007, filed with the Securities and Exchange Commission on March 14, 2008.
|
|
(23)
|
Incorporated by reference to the same-numbered exhibit to the registrant's Annual Report on Form 10-K for the year ended December 31, 2008, filed with the Securities and Exchange Commission on March 4, 2009.
|
|
(24)
|
Incorporated by reference to the same-numbered exhibit to the registrant's Current Report on Form 8-K filed with the Securities and Exchange Commission on March 23, 2010.
|
|
*
|
Indicates management contract or compensatory plan or arrangement.
|
|
**
|
Filed herewith.
|
|
†
|
Certain portions of this exhibit are subject to confidential treatment.
|
|
(c)
|
Financial statements and schedules.
|
Reference is made to Item 15(a) above.
Pursuant to the requirements of Section 13 or 15(d) of the Securities Exchange Act of 1934, the registrant has duly caused this report to be signed on its behalf by the undersigned, thereunto duly authorized.
|
Dated: February 16, 2011
|
NETLOGIC MICROSYSTEMS, INC.
|
|||||||
|
By
|
/s/ RONALD JANKOV
|
|||||||
|
Ronald Jankov
President and Chief Executive Officer
|
||||||||
POWER OF ATTORNEY
KNOW ALL MEN BY THESE PRESENTS, that each person whose signature appears below constitutes and appoints Ronald Jankov and Michael Tate as his true and lawful attorneys-in-fact and agents, with full power of substitution and resubstitution, for him and in his name, place and stead, in any and all capacities, to sign any and all amendments to this Report on Form 10-K, and to file the same, with all exhibits thereto, and other documents in connection therewith, with the Securities and Exchange Commission, granting unto said attorneys-in-fact and agents full power and authority to do and perform each and every act and thing requisite and necessary to be done in connection therewith, as fully to all intents and purposes as he might or could do in person, hereby ratifying and confirming all that said attorneys-in-fact and agents, or their substitute or substitutes, may lawfully do or cause to be done by virtue hereof.
Pursuant to the requirements of the Securities Exchange Act of 1934, this report has been signed below by the following persons on behalf of the Registrant and in the capacities and on the dates indicated.
|
Name
|
|
Title
|
Date
|
|
|
/s/ RONALD JANKOV
Ronald Jankov
|
|
Chief Executive Officer and Director
(Principal Executive Officer)
|
February 16, 2011
|
|
|
/s/ MICHAEL TATE
Michael Tate
|
|
Vice President and Chief Financial Officer (Principal Financial Officer and Principal Accounting Officer)
|
February 16, 2011
|
|
|
/s/ LEONARD PERHAM
Leonard Perham
|
|
Director
|
February 16, 2011
|
|
|
/s/ NORMAN GODINHO
Norman Godinho
|
|
Director
|
February 16, 2011
|
|
|
/s/ ALAN KROCK
Alan Krock
|
|
Director
|
February 16, 2011
|
|
|
/s/ DOUGLAS BROYLES
Douglas Broyles
|
|
Director
|
February 16, 2011
|
|
|
/s/ STEVE DOMENIK
Steve Domenik
|
|
Director
|
February 16, 2011
|
|
|
/s/ MARVIN BURKETT
Marvin Burkett
|
|
Director
|
February 16, 2011 | |
SCHEDULE II
VALUATION AND QUALIFYING ACCOUNTS
FOR THE YEARS ENDED DECEMBER 31, 2010, 2009 and 2008
(in thousands)
|
Balance at Beginning of Period
|
Additions
|
Write-off Adjustments
|
Balance at End of Period
|
|||||||||||||
|
Allowance for Doubtful Accounts
|
||||||||||||||||
|
Year ended December 31, 2010
|
$ | 259 | $ | 131 | $ | (33 | ) | $ | 357 | |||||||
|
Year ended December 31, 2009
|
$ | 68 | $ | 4 | $ | 187 | $ | 259 | ||||||||
|
Year ended December 31, 2008
|
$ | 19 | $ | 68 | $ | (19 | ) | $ | 68 | |||||||
|
Income Tax Valuation Allowance:
|
||||||||||||||||
|
Year ended December 31, 2010
|
$ | 7,043 | $ | 1,440 | $ | - | $ | 8,483 | ||||||||
|
Year ended December 31, 2009
|
$ | - | $ | 7,043 | $ | - | $ | 7,043 | ||||||||
|
Year ended December 31, 2008
|
$ | - | $ | - | $ | - | $ | - | ||||||||
EXHIBIT INDEX
|
Exhibit
|
|
Description
|
|
2.1
|
|
Not in use.
|
|
2.2
|
|
Not in use.
|
|
2.3
|
|
Not in use.
|
| 2.4 | Asset Purchase Agreement, dated as of April 30, 2009, between NetLogic Microsystems, Inc. and Integrated Device Technology, Inc., which includes the forms of Intellectual Property Cross License Agreement (Exhibit D) and Non-Competition Agreement (Exhibit E) (1) | |
| 2.5 | Agreement and Plan of Merger Reorganization by and among NetLogic Microsystems, Inc., Roadster Merger Corporation, RMI Corporation and the Representative of Certain of the Holders of all of the Capital Stock of RMI Corporation dated as of May 31, 2009 (2) | |
|
3.1
|
|
Restated Certificate of Incorporation of the registrant filed on August 2, 2004 (3)
|
|
3.4
|
|
Bylaws of the registrant (4)
|
|
4.1
|
|
Specimen common stock certificate (5)
|
|
4.2
|
|
Rights Agreement by and between the registrant and Wells Fargo Bank, National Association, dated July 7, 2004 (6)
|
|
4.3*
|
|
Form of Stock Option Agreement (7)
|
|
4.4*
|
|
Form of Restricted Stock Unit Agreement (8)
|
|
10.1*
|
|
2000 Stock Plan and forms of related agreements (9)
|
|
10.2*
|
|
Amended and Restated 2004 Equity Incentive Plan (10)
|
|
10.2.1*
|
|
Form of Stock Option Agreement under Amended and Restated 2004 Equity Incentive Plan (11)
|
|
10.2.2*
|
|
Form of Restricted Stock Agreement under Amended and Restated 2004 Equity Incentive Plan (12)
|
|
10.3*
|
|
2004 Employee Stock Purchase Plan and forms of related agreements (13)
|
|
10.4
|
|
Form of Indemnity Agreement (9)
|
|
10.5
|
|
Not in use.
|
|
10.9*
|
|
Form of Change-In-Control Agreement between the registrant and each of certain officers thereof (14)
|
|
10.10*
|
|
Incentive Bonus Plan effective May 5, 2005 (15)
|
|
10.11
|
|
Form of Master Purchase Agreement by and between the registrant and Cisco Systems, Inc. (16)†
|
|
10.12
|
|
Not in use.
|
|
10.13
|
|
Not in use.
|
|
10.14
|
|
Standard Form Lease by and between the registrant and Mission West Properties, L.P. dated May 3, 2004 (17)
|
|
10.15
|
|
Second Amendment to Lease between Mission West Charleston, LLC and NetLogic Microsystems, Inc. (18)
|
|
10.16*
|
|
Employment offer letter, dated April 12, 2000, between the registrant and Ronald Jankov (18)
|
|
10.17*
|
|
Employment offer letter, dated April 1, 1999, between the registrant and Roland Cortes (18)
|
|
Exhibit
|
|
Description
|
|
10.18*
|
|
Employment offer letter, dated March 15, 2002, between the registrant and Ibrahim Korgav, as amended (18)
|
|
10.19*
|
|
Employment offer letter, dated February 9, 1996, between the registrant and Varadarajan Srinivasan (18)
|
|
10.20*
|
|
Employment offer letter, dated June 7, 1999, between the registrant and Marcia Zander (18)
|
|
10.21*
|
|
Form of Restricted Stock Unit Award Agreement (19)
|
|
10.22*
|
|
Employment offer letter, dated June 30, 2009, between the registrant and Behrooz Abdi. (20)
|
|
10.23*
|
|
Employment offer letter, dated July 11, 2007, between registrant and Michael Tate (21)
|
|
10.24
|
|
Not in use.
|
|
10.25
|
|
Purchase Agreement between Registrant and Wintec Industries, Inc.† (21)
|
|
10.26
|
|
Not in use.
|
|
10.27*
|
|
NetLogic Microsystems, Inc. 2008 New Employee Inducement Incentive Plan dated January 16, 2008 (22)
|
|
10.28*
|
|
Form of Restricted Stock Agreement for New Employee Inducement Grants (21)
|
|
10.29*
|
|
Form of Notice of Restricted Stock Unit Award and Agreement under the registrant's 2008 New Employee Inducement Incentive Plan (23)
|
|
10.30*
|
|
Form of Notice of Restricted Stock Unit Award and Agreement under the registrant's 2004 Equity Incentive Plan (23)
|
|
10.31
|
|
Not in use.
|
|
10.38
|
|
Office Lease by and between the registrant and Carr NP Properties, L.L.C. and 3975 Freedom Circle Drive L.L.C. dated March 19, 2010 (24)
|
|
21.1**
|
|
List of Subsidiaries of Registrant
|
|
23.1**
|
|
Consent of PricewaterhouseCoopers LLP, Independent Registered Public Accounting Firm
|
|
31.1**
|
|
Rule 13a-14 certification
|
|
31.2**
|
|
Rule 13a-14 certification
|
|
Exhibit
|
|
Description
|
|
32.1** Section 1350 certification
|
|
|
|
32.2** Section 1350 certification
|
|
|
|
(1)
|
Incorporated by reference to Exhibit 2.4 to the registrant's Current Report on Form 8-K filed with the Securities and Exchange Commission on May 6, 2009.
|
|
(2)
|
Incorporated by reference to Annex A to the definitive proxy statement filed by the registrant with the Securities and Exchange Commission on September 30, 2009.
|
|
(3)
|
Incorporated by reference to the same-numbered exhibit to the registrant's Quarterly Report on Form 10-Q for the quarterly period ended June 30, 2004, filed with the Securities and Exchange Commission on August 20, 2004.
|
|
(4)
|
Incorporated by reference to the same-numbered exhibit to the registrant's Current Report on Form 8-K filed with the Securities and Exchange Commission on October 21, 2008.
|
|
(5)
|
Incorporated by reference to the same-numbered exhibit to Amendment No.3 to Form S-1 (Registration No. 333-114549) filed by the registrant with the Securities and Exchange Commission on June 21, 2004.
|
|
(6)
|
Incorporated by reference to Exhibit 99 (i) to Form 8-A (Registration No. 000-50838) filed by the registrant with the Securities and Exchange Commission on July 8, 2004.
|
|
(7)
|
Incorporated by reference to Exhibit 4.3 to Form S-8 (Registration No. 333-162765) filed by the registrant with the Securities and Exchange Commission on October 30, 2009.
|
|
(8)
|
Incorporated by reference to Exhibit 4.4 to Form S-8 (Registration No. 333-162765) filed by the registrant with the Securities and Exchange Commission on October 30, 2009.
|
|
(9)
|
Incorporated by reference to the same-numbered exhibit to Form S-1 (Registration No. 333-114549) filed by the registrant with the Securities and Exchange Commission on April 16, 2004.
|
|
(10)
|
Incorporated by reference to Exhibit 99.1 to the registrant’s Current Report on Form 8-K filed with the Securities and Exchange Commission on July 27, 2010.
|
|
(11)
|
Incorporated by reference to the same-numbered exhibit to the registrant's Quarterly Report on Form 10-Q for the quarterly period ended September 30, 2004, filed with the Securities and Exchange Commission on November 12, 2004.
|
|
(12)
|
Incorporated by reference to the same-numbered exhibit to the registrant's Annual Report on Form 10-K for the year ended December 31, 2005, filed with the Securities and Exchange Commission on February 28, 2006.
|
|
(13)
|
Incorporated by reference to the same-numbered exhibit to Form S-8 (Registration No. 333-117619) filed by the registrant with the Securities and Exchange Commission on July 23, 2004.
|
|
(14)
|
Incorporated by reference to the same-numbered exhibit to the registrant's Annual Report on Form 10-K for the year ended December 31, 2004, filed with the Securities and Exchange Commission on March 11, 2005.
|
|
(15)
|
Incorporated by reference to the same-numbered exhibit to the registrant's Quarterly Report on Form 10-Q for the quarterly period ended March 31, 2005, filed with the Securities and Exchange Commission on May 9, 2005.
|
|
(16)
|
Incorporated by reference to the same-numbered exhibit to the registrant's Quarterly Report on Form 10-Q for the quarterly period ended September 30, 2005, filed with the Securities and Exchange Commission on November 8, 2005.
|
|
(17)
|
Incorporated by reference to the same-numbered exhibit to the registrant's Quarterly Report on Form 10-Q for the quarterly period ended March 30, 2006, filed with the Securities and Exchange Commission on May 9, 2006.
|
|
(18)
|
Incorporated by reference to the same-numbered exhibit to Amendment No. 1 to Form S-1 (Registration No. 333-114549) filed by the registrant with the Securities and Exchange Commission on May 19, 2004.
|
|
(19)
|
Incorporated by reference to Exhibit 10.25 to Form S-8 (Registration No. 333-147064) filed by the registrant with the Securities and Exchange Commission on October 31, 2007.
|
|
(20)
|
Incorporated by reference to the same-numbered exhibit to the registrant's Annual Report on Form 10-K for the year ended December 31, 2009 filed with the Securities and Exchange Commission on February 26, 2010.
|
|
(21)
|
Incorporated by reference to same-numbered exhibit to the registrant's Quarterly Report on Form 10-Q for the quarter ended June 30, 2007 filed with the Securities and Exchange Commission on August 7, 2007.
|
|
(22)
|
Incorporated by reference to the same-numbered exhibit to the registrant's Annual Report on Form 10-K for the year ended December 31, 2007, filed with the Securities and Exchange Commission on March 14, 2008.
|
|
(23)
|
Incorporated by reference to the same-numbered exhibit to the registrant's Annual Report on Form 10-K for the year ended December 31, 2008, filed with the Securities and Exchange Commission on March 4, 2009.
|
|
(24)
|
Incorporated by reference to the same-numbered exhibit to the registrant's Current Report on Form 8-K filed with the Securities and Exchange Commission on March 23, 2010.
|
|
*
|
Indicates management contract or compensatory plan or arrangement.
|
|
**
|
Filed herewith.
|
|
†
|
Certain portions of this exhibit are subject to confidential treatment.
|
|
(c)
|
Financial statements and schedules.
|
Reference is made to Item 15(a) above.