Attached files
| file | filename |
|---|---|
| 8-K - DEUTSCHE BANK CONFERENCE - Celanese Corp | form8-k.htm |

EXHIBIT 99.1
Celanese Corporation
Celanese Corporation
February 2011

2
Forward-Looking Statements
This presentation may contain “forward-looking statements,” which include information concerning the company’s plans, objectives, goals, strategies, future revenues or performance,
capital expenditures, financing needs and other information that is not historical information. When used in this presentation, the words “outlook,” “forecast,” “estimates,” “expects,”
“anticipates,” “projects,” “plans,” “intends,” “believes,” and variations of such words or similar expressions are intended to identify forward-looking statements. All forward-looking
statements are based upon current expectations and beliefs and various assumptions. There can be no assurance that the company will realize these expectations or that these beliefs will
prove correct.
There are a number of risks and uncertainties that could cause actual results to differ materially from the results expressed or implied in the forward-looking statements contained in this
presentation. These risks and uncertainties include, among other things: changes in general economic, business, political and regulatory conditions in the countries or regions in which we
operate; the length and depth of business cycles, particularly in the automotive, electrical, electronics and construction industries; changes in the price and availability of raw materials; the
ability to pass increases in raw material prices on to customers or otherwise improve margins through price increases; the ability to maintain plant utilization rates and to implement planned
capacity additions and expansions; the ability to improve productivity by implementing technological improvements to existing plants; increased price competition and the introduction of
competing products by other companies; market acceptance of our technology; the ability to obtain governmental approvals and to construct facilities on terms and schedules acceptable to
the company; changes in the degree of intellectual property and other legal protection afforded to our products; compliance and other costs and potential disruption of production due to
accidents or other unforeseen events or delays in construction or operation of facilities; potential liability for remedial actions and increased costs under existing or future environmental
regulations, including those relating to climate change; potential liability resulting from pending or future litigation, or from changes in the laws, regulations or policies of governments or
other governmental activities in the countries in which we operate; changes in currency exchange rates and interest rates; and various other factors discussed from time to time in the
company’s filings with the Securities and Exchange Commission. Any forward-looking statement speaks only as of the date on which it is made, and the company undertakes no obligation
to update any forward-looking statements to reflect events or circumstances after the date on which it is made or to reflect the occurrence of anticipated or unanticipated events or
circumstances.
Results Unaudited
The results in this presentation, together with the adjustments made to present the results on a comparable basis, have not been audited and are based on internal financial data furnished
to management. Quarterly and LTM results should not be taken as an indication of the results of operations to be reported for any subsequent period or for the full fiscal year.
to management. Quarterly and LTM results should not be taken as an indication of the results of operations to be reported for any subsequent period or for the full fiscal year.
Use of Non-U.S. GAAP Financial Information
This presentation includes the following non-U.S. GAAP financial measures: operating EBITDA, proportional EBITDA, and adjusted earnings per share. These measurements are not
recognized in accordance with U.S. GAAP and should not be viewed as an alternative to U.S. GAAP measures of performance. The most directly comparable financial measure presented
in accordance with U.S. GAAP in our consolidated financial statements for operating EBITDA is net income; for proportional share EBITDA is equity in net earnings of affiliates; and for
adjusted earnings per share is earnings per common share-diluted. Reconciliations of these non-U.S. GAAP financial measures are included in the Appendix.
Operating EBITDA, a measure used by management to measure performance, is defined by the company as net earnings plus loss from discontinued operations, interest expense, taxes,
and depreciation and amortization, and further adjusted for Other Charges and Adjustments. We may provide guidance on operating EBITDA and are unable to reconcile forecasted
operating EBITDA to a U.S. GAAP financial measure because a forecast of Other Charges and Adjustments is not practical.
and depreciation and amortization, and further adjusted for Other Charges and Adjustments. We may provide guidance on operating EBITDA and are unable to reconcile forecasted
operating EBITDA to a U.S. GAAP financial measure because a forecast of Other Charges and Adjustments is not practical.
Proportional EBITDA of Affiliates is defined by the company as proportional operating profit plus the proportional depreciation and amortization of its equity investments.
Adjusted earnings per share is defined by the company as net earnings (loss) available to common shareholders plus preferred dividends, adjusted for Other Charges and Adjustments,
and divided by the number of basic common shares, diluted preferred shares, and options valued using the treasury method. We may provide guidance on an adjusted earnings per share
basis and are unable to reconcile forecasted adjusted earnings per share to a U.S. GAAP financial measure without unreasonable effort because a forecast of Other Items is not practical.
Note: The tax rate used for adjusted earnings per share approximates the midpoint in a range of forecasted tax rates for the year, excluding changes in uncertain tax positions, discrete
items and other material items adjusted out of our U.S. GAAP earnings for adjusted earnings per share purposes, and changes in management's assessments regarding the ability to
realize deferred tax assets. We analyze this rate quarterly and adjust if there is a material change in the range of forecasted tax rates; an updated forecast would not necessarily result in a
change to our tax rate used for adjusted earnings per share. The adjusted tax rate is an estimate and may differ significantly from the tax rate used for U.S. GAAP reporting in any given
reporting period. It is not practical to reconcile our prospective adjusted tax rate to the actual U.S. GAAP tax rate in any future period.

3
Celanese technology-focused portfolio -
building on a track record of execution
and value creation
building on a track record of execution
and value creation
Celanese
($ in millions)
2010 Revenue: $5,918
2010 Operating EBITDA: $1,122
Revenue: $1,089
Operating EBITDA: $371
Revenue: $1,109
Operating EBITDA: $363
Revenue: $1,036
Operating EBITDA: $111
Revenue: $2,682
Operating EBITDA: $411
Consumer Specialties
Advanced Engineered
Materials
Materials
Industrial Specialties
Acetyl Intermediates
Note: Celanese total includes Other Activities’ revenue and operating EBITDA of $2 million and ($134) million, respectively; $409 million of intersegment sales are excluded
Significant value
opportunity for
investors
opportunity for
investors
Strong earnings growth
Leading portfolio with
strategic affiliates
strategic affiliates
4
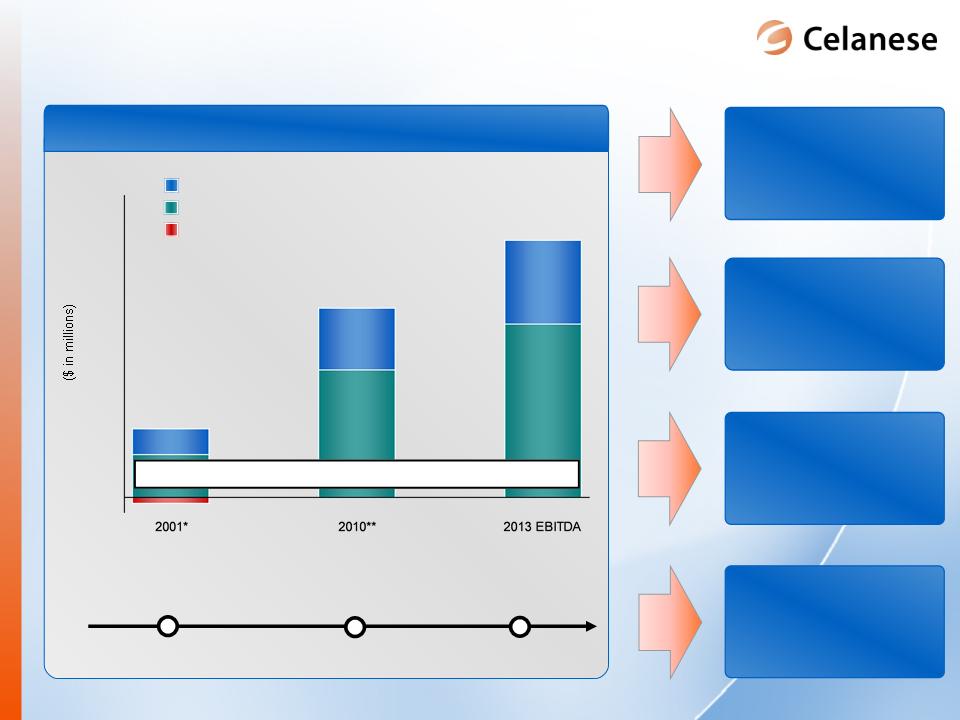
Today’s Celanese:
A Technology and Specialty Materials Company
A Technology and Specialty Materials Company
“Undifferentiated
Era”
Era”
“Hybrid
Transition”
Transition”
“Technology &
Specialty
Materials Era”
Materials Era”
Advantaged Intermediates
Specialty Materials
Commodity
Celanese Portfolio Transformation
Operating EBITDA Shift Towards Specialty Materials
500 -
1,000 -
0 -
* Celanese management estimates, based on unaudited similar information of predecessor company
** Excludes Other Activities segment
Specialty Materials: 2001 - 2013 CAGR: >12%
1,500 -
2,000 -
Modest earnings
volatility
volatility
Relatively higher
margins
margins
Sustained
earnings growth
of 10 - 15%
earnings growth
of 10 - 15%
High capital
return
return
5
Continued generation
& deployment of cash
& deployment of cash
Improved earnings
power
power
Accelerated topline
growth
growth
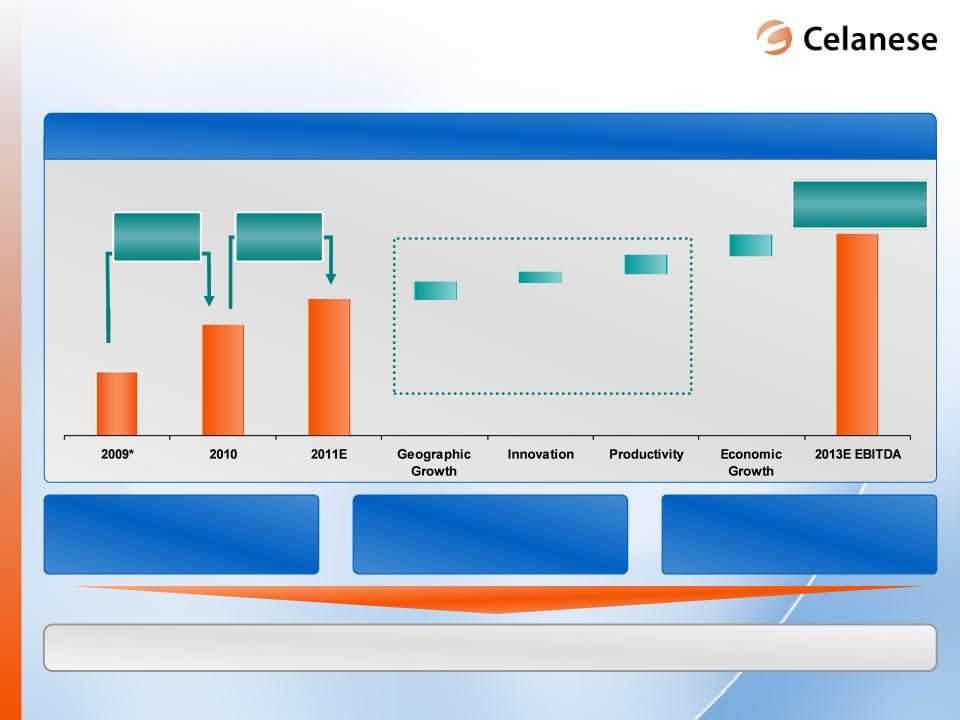
Earnings power of advantaged portfolio
Operating EBITDA
$857 million
Multiple strategic levers accelerate earnings growth
+$265
million
million
+~$150
million
million
$1,600- $1,800
million
million
CE Specific:
70% of 2011 to 2013
Earnings Improvement
* Adjusted to reflect the change in accounting method for Ibn Sina; includes Other Activities segment
$1,122 million

6
Portfolio
► Synergistic acquisition
► Portfolio extensions to reduce
earnings volatility
earnings volatility
► Emerging technologies
Innovation
Value growth levers drive increased earnings
Productivity
► Value-added products drive margin
expansion
expansion
► Access to new application space
supports accelerated growth
supports accelerated growth
► Efficient manufacturing technologies
Geographic Growth
► Emerging-region leadership
► Participation in > GDP growth
markets in developed economies
markets in developed economies
► Deliver cost improvements
2x fixed cost inflation
2x fixed cost inflation
► Strengthens operating leverage
Increasing the earnings power of the portfolio to $1.6 - $1.8 billion

7
Diversified end-uses capture economic AND
geographic growth
geographic growth
Note: Celanese management estimates of end-uses and geographic revenue based on Celanese 2009 net sales - includes strategic affiliates' proportional revenue
Other
8%
8%
Construction
3%
3%
Paints &
Coatings
13%
Coatings
13%
Consumer &
Medical
Applications
12%
Medical
Applications
12%
Consumer
& Industrial
Adhesives
9%
& Industrial
Adhesives
9%
Textiles
5%
5%
Food &
Beverage
4%
Beverage
4%
Chemical
Additives
3%
Additives
3%
Paper &
Packaging
3%
Packaging
3%
Industrial
Performance
Applications
7%
Performance
Applications
7%
Consolidated Revenue by Region (USD)
Americas
25%
EU
36%
AOC
21%
China
18%
7

8
IS: Nanjing expansion supports vinyl system
growth
growth
► Vinyl system leadership
• Focus on product technology
differentiation
differentiation
• Partner with leading Western and
Chinese companies
Chinese companies
► 2008 Nanjing I
• Achieved a leading position in China for
key segments
key segments
• Sales growth 18 months ahead of plan
• Developed business in other emerging
regions
regions
► 2011 Nanjing II
• Announced doubling of Nanjing VAE
capacity in October 2009
capacity in October 2009
• Startup expected mid-2011
Expanding vinyl technology into emerging markets
Source: Celanese management estimates
Asia Growth
Nanjing II VAE
startup
Nanjing I VAE
startup
Celanese Emulsion Asia Revenue

9
CS: China position continues to strengthen
portfolio
portfolio
Acetate Dividends
► Dec 2009 - Announced
Memorandum of understanding for next phase
of China expansion
Memorandum of understanding for next phase
of China expansion
► April 2010 - Approved
Memorandum of understanding NDRC
approval
Memorandum of understanding NDRC
approval
Zhuhai Cellulose Fibers Co., Ltd.
Kunming Cellulose Fibers Co., Ltd
Nantong Cellulose Fibers Co., Ltd
Dividend
Reinvestmen
t
Reinvestmen
t
Strong Partnership for Future Growth
Expansion project approved with current China partner

10
Portfolio
► Synergistic acquisition
► Portfolio extensions to reduce
earnings volatility
earnings volatility
► Emerging technologies
Innovation
Value growth levers drive increased earnings
Productivity
► Value-added products drive margin
expansion
expansion
► Access to new application space
supports accelerated growth
supports accelerated growth
► Efficient manufacturing technologies
Geographic Growth
► Emerging-region leadership
► Participation in > GDP growth
markets in developed economies
markets in developed economies
► Deliver cost improvements
2x fixed cost inflation
2x fixed cost inflation
► Strengthens operating leverage
Increasing the earnings power of the portfolio to $1.6 - $1.8 billion
11
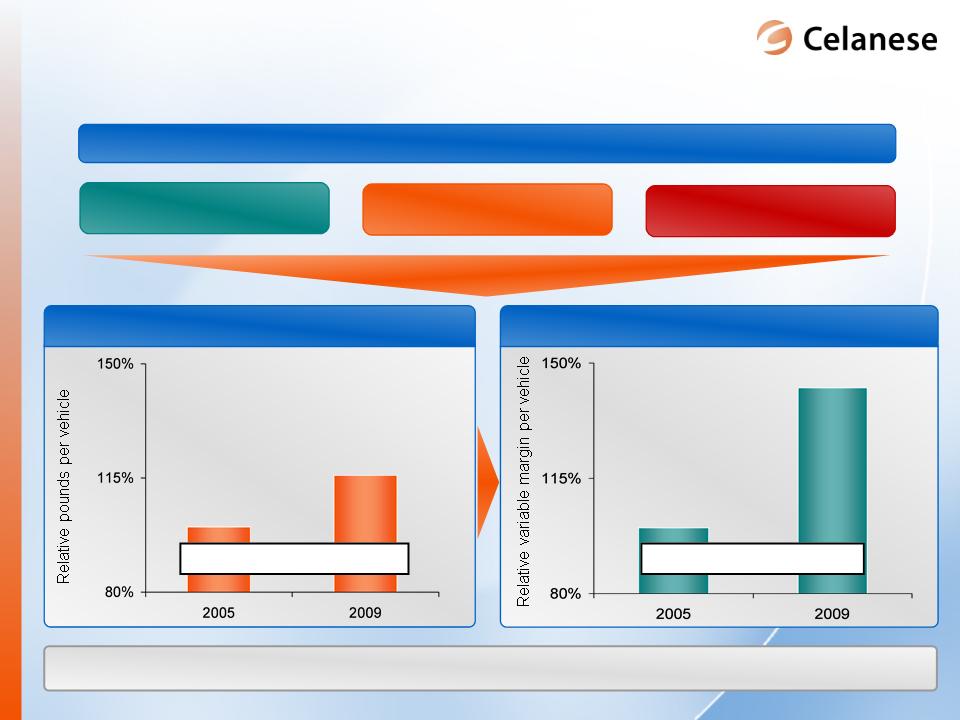
Ticona Polymers Weight per Vehicle
AEM: Application development with key
customers drives increasing value per vehicle
customers drives increasing value per vehicle
Ticona Polymers Value per Vehicle
Strong history of translating applications into value
2005 - 2009 CAGR: 5%
2005 - 2009 CAGR: >9%
Fuel Efficiency
Electrical Systems
Key Global Automotive Trends
Safety Systems
Source: Celanese management estimates

12
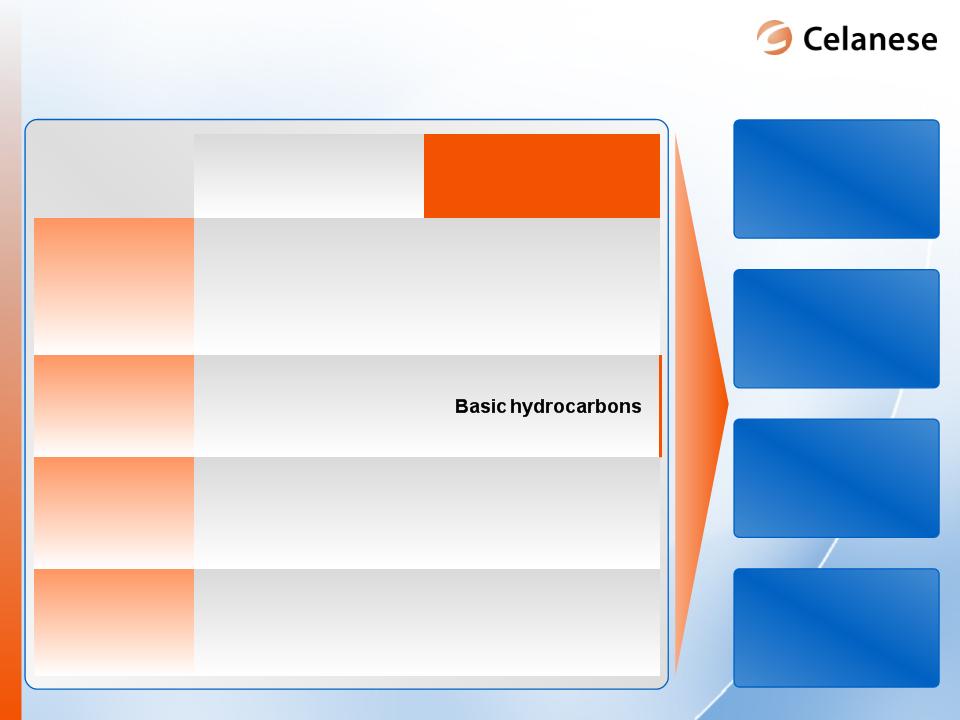
AI: Attractive technology driven cost curve
fueled by sustainable process innovation
fueled by sustainable process innovation
By-Product
Avg Other Leading
Technology
Ethylene
Highest Cost
China MeOH
China MeOH
Ethanol
Effective Industry Utilization Rates
Lower Cost
China MeOH
China MeOH
Pricing for CE to
earn >15%
EBITDA
EBITDA
75 - 80%
2011E Acetic Acid Cost Curve*
Avg Non-China
MeOH Carbonylation
Average Celanese
Additional
advantage
achievable
advantage
achievable
Minimum
15%
advantage
exists
today
15%
advantage
exists
today
Disadvantaged
Technology
Technology
Lowest
Cost Local
Cost Local
China
Celanese
Celanese
Near Term
Near Term
► $10 per ton of variable cost reduction
= $30 million of Operating EBITDA improvement
= $30 million of Operating EBITDA improvement
Continued technology enhancement contributes to earnings growth
► $15 per ton of variable cost reduction
= $20 million of Operating EBITDA improvement
= $20 million of Operating EBITDA improvement
Disadvantaged
Technology
Technology
Celanese
Celanese
Near Term
Near Term
* Source: Celanese management estimates, available public information; based on recent raw material costs
13
|
|
Prevailing Ethanol
Technology |
Celanese Ethanol
Technology |
|
Technology
|
Undifferentiated
fermentation processes |
Proprietary and
breakthrough technology leveraging Celanese industry- leading acetyl platform |
|
Feedstock
|
Corn, cassava,
sugarcane, and other carbohydrates |
|
|
Growth
|
Economically
constrained in target regions |
High growth potential
|
|
Energy Balance
|
Low returns from energy
inputs |
High returns from
energy invested |
AI: Paradigm shift in proprietary cost
advantaged ethanol technology
advantaged ethanol technology
Significant
Revenue
Opportunity
Revenue
Opportunity
Sustained
Earnings
Growth
Earnings
Growth
High Operating
Margins
Margins
Attractive
Capital Returns
Capital Returns
14
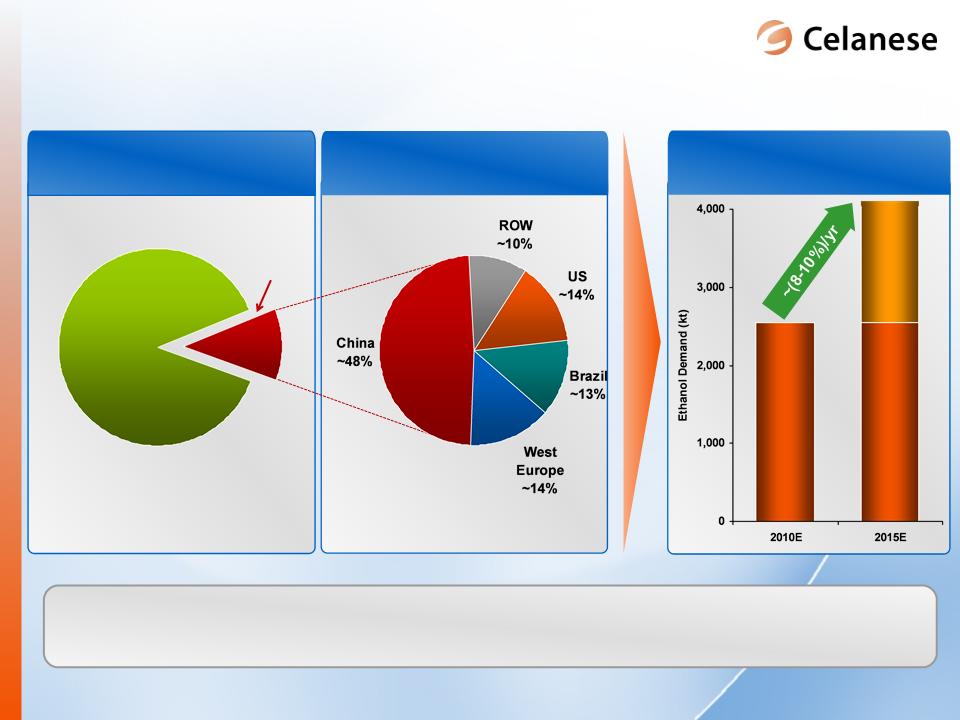
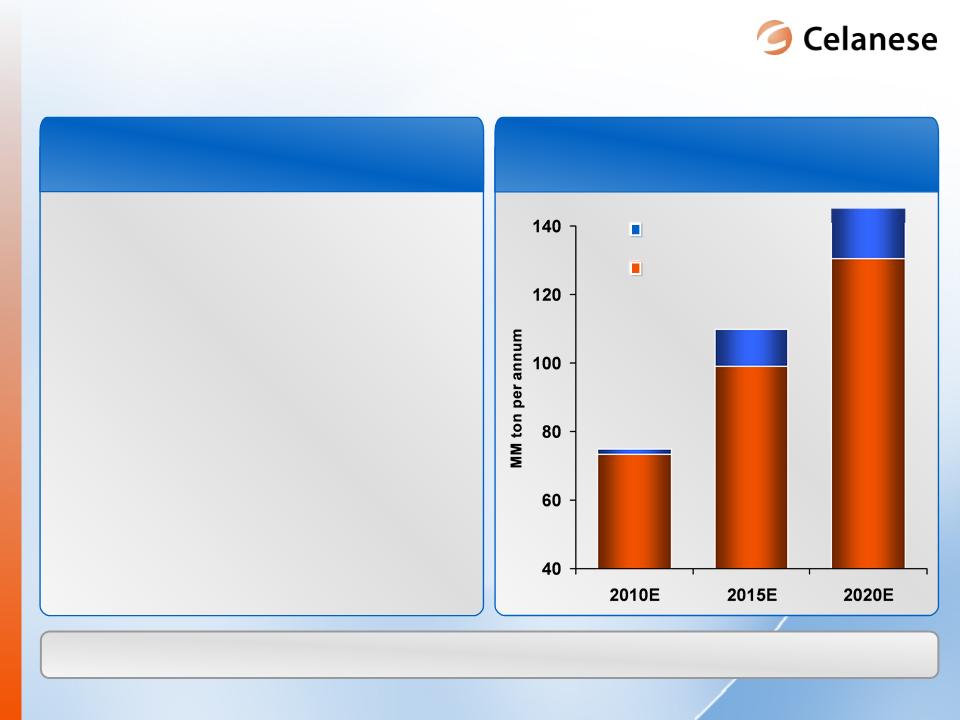
AI: Innovation creates opportunity for growth
with increasing demand for industrial ethanol
with increasing demand for industrial ethanol
Significant, and growing, demand in China
(paints, coatings, inks, and pharmaceuticals)
Source: Celanese management estimates, SRI Consulting, GAIN report
Fuel
~40-50 mmT
~5-6 mmT
Industrial
Global Ethanol Demand
Industrial vs. Fuel
Industrial vs. Fuel
Industrial Ethanol
Demand by Region
Demand by Region
Chinese Industrial Ethanol
Opportunity
Opportunity
15
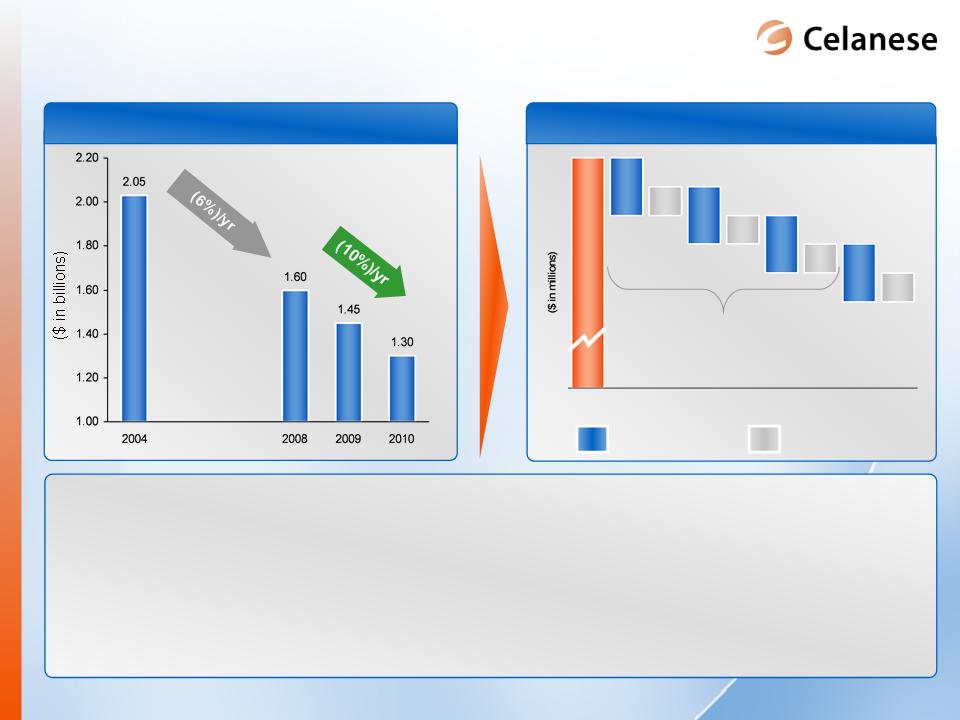
Example - China Fuel Ethanol
Potential extension of our technology breakthrough to fuel segment
AI: Exploring fuel ethanol opportunities in
commercially supportive regions
commercially supportive regions
Source: Celanese management estimates, Purvin & Gertz, Inc.
~10MM
~10MM
~15MM
~15MM
Current fuel
ethanol
ethanol
Current fuel
ethanol
ethanol
~1.6MM
~1.6MM
Gasoline Demand
Gasoline Demand
Government Targeted
Fuel Ethanol Blending
Fuel Ethanol Blending
Government Targeted
Fuel Ethanol Blending
Fuel Ethanol Blending
► Have desire to reduce
dependence on imported
energy
dependence on imported
energy
► Have access to economically
attractive hydrocarbons
attractive hydrocarbons
► Have policies which promote
“technology and feedstock
neutrality”
“technology and feedstock
neutrality”
Focus on Regions with Favorable
Commercial Environment
Commercial Environment

16
Portfolio
► Synergistic acquisition
► Portfolio extensions to reduce
earnings volatility
earnings volatility
► Emerging technologies
Innovation
Value growth levers drive increased earnings
Productivity
► Value-added products drive margin
expansion
expansion
► Access to new application space
supports accelerated growth
supports accelerated growth
► Efficient manufacturing technologies
Geographic Growth
► Emerging-region leadership
► Participation in > GDP growth
markets in developed economies
markets in developed economies
► Deliver cost improvements
2x fixed cost inflation
2x fixed cost inflation
► Strengthens operating leverage
Increasing the earnings power of the portfolio to $1.6 - $1.8 billion
17
Consistently delivering productivity over
fixed cost inflation
fixed cost inflation
1) Fixed costs exclude energy, fixed distribution, depreciation and amortization; FX adjusted; 2004 is pro forma of current portfolio based on Celanese management estimates
2) Assumes stable currency and raw material pricing
Fixed Costs1
Spending2
Productivity
Inflation
2011E
2012E
2013E
Thereafter
Base
2011-2013 productivity
net of inflation
$120 - $180
net of inflation
$120 - $180
► Process technology improvements
• Catalyst / yield
• Digitization
► Energy reduction
• Multi-year initiative
• Critical to meeting
sustainability goals
sustainability goals
► Strategic programs
• Raw materials
► Business process excellence
• Six Sigma
• Lean manufacturing

18
Portfolio
► Synergistic acquisition
► Portfolio extensions to reduce
earnings volatility
earnings volatility
► Emerging technologies
Innovation
Value growth levers drive increased earnings
Productivity
► Value-added products drive margin
expansion
expansion
► Access to new application space
supports accelerated growth
supports accelerated growth
► Efficient manufacturing technologies
Geographic Growth
► Emerging-region leadership
► Participation in > GDP growth
markets in developed economies
markets in developed economies
► Deliver cost improvements
2x fixed cost inflation
2x fixed cost inflation
► Strengthens operating leverage
Increasing the earnings power of the portfolio to $1.6 - $1.8 billion

19
FACT LFT
Acquisition
Acquisition
Recent portfolio enhancements build on
advantaged specialty materials
advantaged specialty materials
► Expands
customer/application
space
customer/application
space
► Enables manufacturing
footprint optimization
footprint optimization
► Adds technology
capabilities
capabilities
► Extends current
relationship and
advantaged raw
material position
relationship and
advantaged raw
material position
► Increases economic
participation
participation
► Supports future growth
Increasing the earnings power of the business through
effective cash deployment
effective cash deployment
Advanced Engineered Materials
Ibn Sina POM
Expansion
Expansion
► Builds on leading
technology platform
technology platform
► Increases presence in
high growth regions
high growth regions
► Provides access to
new customers and
application space
new customers and
application space
DuPont LCP and PCT
Acquisition
Acquisition
20
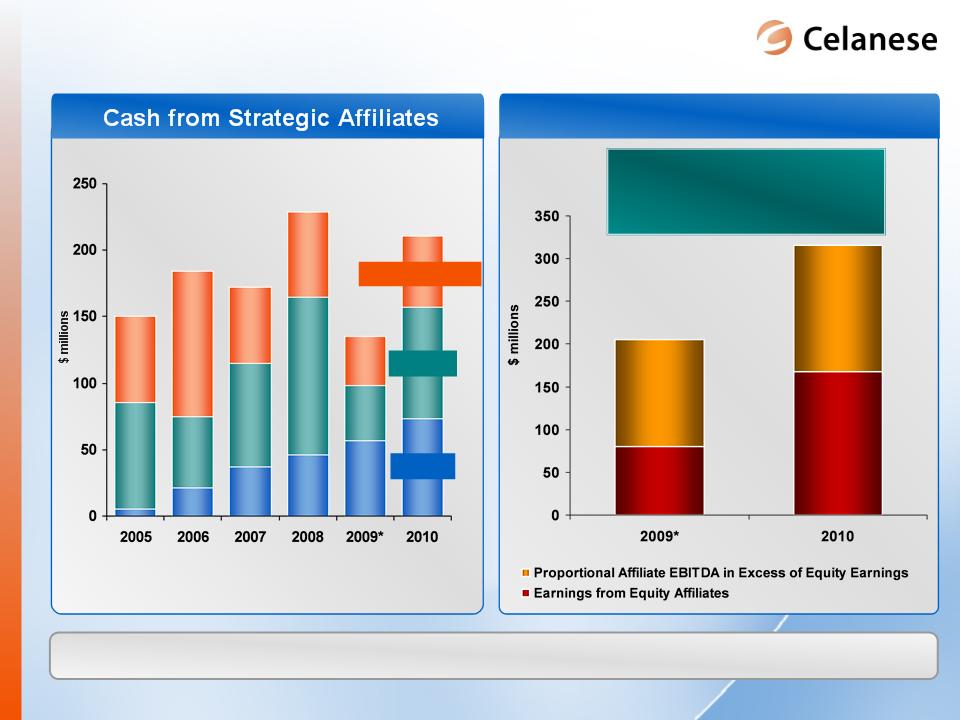
Economic value of our strategic affiliates
Significant earnings AND cash contributions
Acetate
Ibn Sina
Other Equity Affiliates
Proportional EBITDA of Affiliates
>$120 million annual EBITDA
in affiliates not reflected in
CE Operating EBITDA
in affiliates not reflected in
CE Operating EBITDA
* Full year 2009 excludes a one-time tax adjustment to Equity in net earnings of affiliates of $19 million.

21
|
2011E Adjusted Free Cash Outflows
(off EBITDA Base)
|
|
|
Cash Taxes
|
$75 - $100
|
|
Capital Expenditures
|
$300 - $350
|
|
Reserve/Other
|
$100 - $120
|
|
Net Interest
|
$220 - $230
|
|
Pension
|
$120 - $140
|
|
Working Capital
|
$30 - $50
|
|
Adjusted Free Cash Outflows*
|
$845 - $990
|
► Dividend, debt service and share repurchases of ~$90-110 million
► Expect approximately $100 million net cash outflow for Kelsterbach
expansion in 2011, including capital expenditures and project expense
expansion in 2011, including capital expenditures and project expense
Strong cash generation continues
throughout economic cycle
throughout economic cycle
|
Available Cash
|
|
|
Cash (as of 12/31/2010)
|
$740
|
|
Operating Cash
|
~($100 - $200)
|
|
Cash Available for
Strategic Purposes |
~$600
|
$ in millions
$ in millions
* Excludes Ticona Kelsterbach expansion cash flows

22
Debt Repayment
Strategic uses of cash
($ in Millions)
Comments
► Priority use of cash - strategic
growth opportunities, M&A, and
strategic reserve replenishment
growth opportunities, M&A, and
strategic reserve replenishment
► Debt paydown next largest use of
cash
cash
► Modest annual increases in
dividends
dividends
► Flexible use of cash for
opportunistic share repurchase
opportunistic share repurchase
• Share repurchase offsetting equity
compensation dilution
compensation dilution
• Move towards industry norm
+
+
+
$30 / yr
Current Level —
Dividends
++
$20-30 / yr
Opportunistic (migrate towards peers) —
Current Level —
Strategic Opportunities
Reserve
$500 - $1,000
Future Cash
Generation
Generation
Pro Forma
12/31/2010*
12/31/2010*
Excess Cash
Approx. $600
* Ending cash on 12/31/2010 of $740 million less $100-$200 million of operating cash.

23
Represents ~ $0.60 per share in 2011 earnings improvement
Increasingly advantaged portfolio drives
2011 earnings improvement
2011 earnings improvement
Advanced
Engineered
Materials
Engineered
Materials
Consumer
Specialties
Specialties
Industrial
Specialties
Specialties
Acetyl
Intermediates
Intermediates

24
Celanese growth opportunities represent an
attractive investment for shareholders
attractive investment for shareholders
► Technology-focused; specialty materials
► Strategic affiliates: Add to attractive portfolio
Leading portfolio with
strategic affiliates
strategic affiliates
► Significant mid-term earnings growth
opportunities
opportunities
► Celanese-specific value growth levers
Strong earnings
growth
growth
► Increasingly confident in strategic objective of
$1.6 to $1.8 billion mid-term operating EBITDA
$1.6 to $1.8 billion mid-term operating EBITDA
► Cash deployment opportunities add to value
creation
creation
Significant value
opportunity for
investors
opportunity for
investors

Celanese Corporation
APPENDIX

26
Confident in short-term earnings growth
2010
2009*
Geographic
Growth
Growth
Innovation
Portfolio
Productivity
Economic
Growth
Growth
YOY Improvement
+$265 million operating EBITDA
+$1.62 Adjusted EPS
Operating
EBITDA
$857 million
EBITDA
$857 million
Adjusted EPS
$1.75
$1.75
• Continued strength in emerging economies
• Nanjing expansion supports further growth
• Commercialization of new Ticona polymer
technology
technology
• Emulsions low VOC products
• Acquired FACT’s LFT business
• Acquired DuPont’s LCP/PCT businesses
• Economic recovery off low 2009 base
• Accelerated pace of recovery in 2010
• Manufacturing optimization
• Energy reduction
• SG&A process improvements
Low
High
In-Year Impact
* Adjusted to reflect the change in accounting method for Ibn Sina

27
Geographic
Growth
Growth
Innovation
Portfolio
Productivity
Economic
Growth
Growth
Confident in short-term earnings growth
YOY Improvement
+ ~$150 million operating EBITDA
+ ~$0.60 Adjusted EPS
YOY Improvement
+$265 million operating EBITDA
+$1.62 Adjusted EPS
Low
High
In-Year Impact
• Continued growth in emerging economies
• New VAE unit in China
• IS and AEM innovation pipeline
• AI process innovation
• Further manufacturing optimization
• Energy reduction
• Acquisition synergies
• Additional deployment of cash
• Continue gradual economic recovery
Operating
EBITDA
$857 million
EBITDA
$857 million
Adjusted EPS
$1.75
$1.75
2010
2011
2009*
* Adjusted to reflect the change in accounting method for Ibn Sina
28
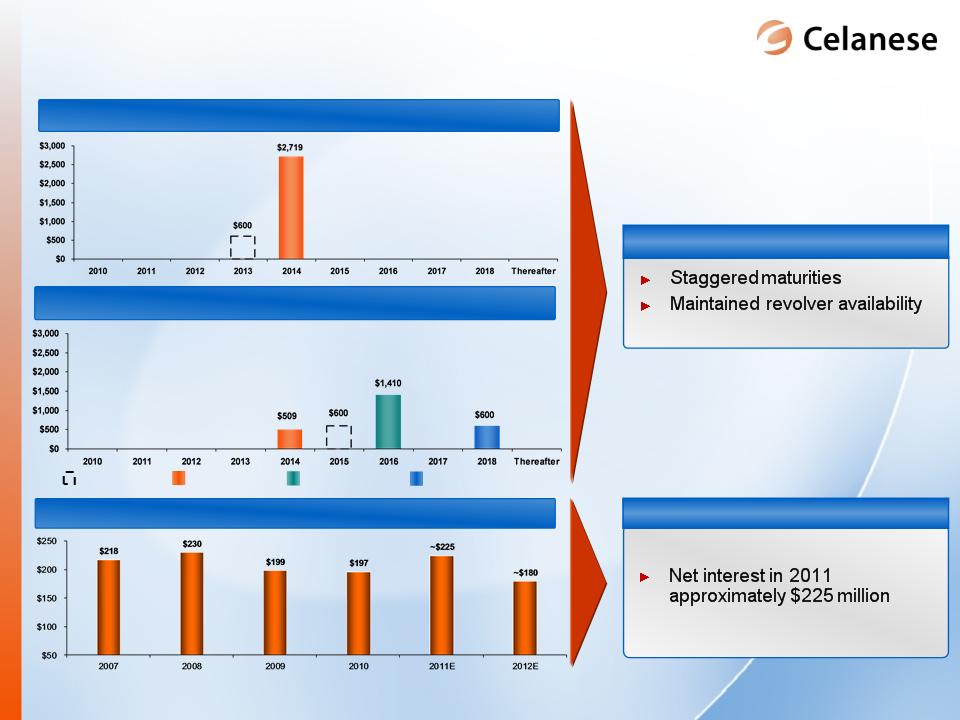
Impact on Interest Cost
Debt maturities and interest cost
Net Interest Cost
($mm)
($mm)
► Minimal effect in 2010
► Significant decrease in 2012 as
fixed LIBOR declines sharply
fixed LIBOR declines sharply
Existing Term Loan
Extended Term Loan
New Senior Unsecured Notes
Revolver Capacity
After Transaction
Before Transaction
► Maintained flexibility
($mm)
($mm)
($mm)
($mm)
Note: Does not reflect maturities of capital leases, industrial revenue bonds, other bank obligations, or affiliate borrowings. Excludes impact of amortization of deferred financing costs.
LIBOR assumptions for 2010 [0.46%], 2011 [0.64%], and 2012 [1.27%]
Benefits
29
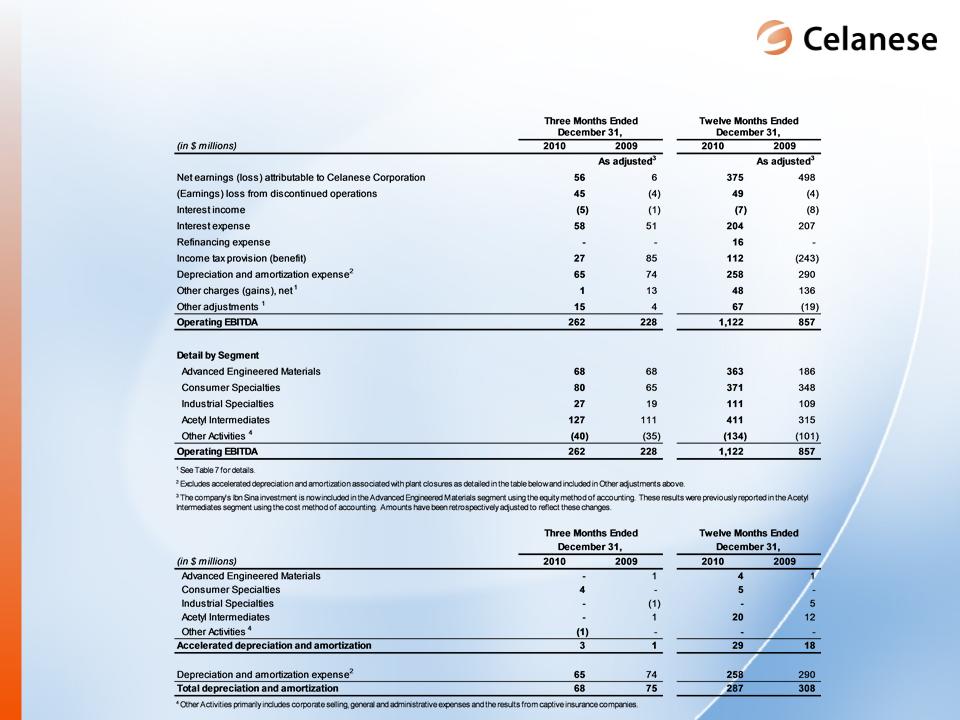
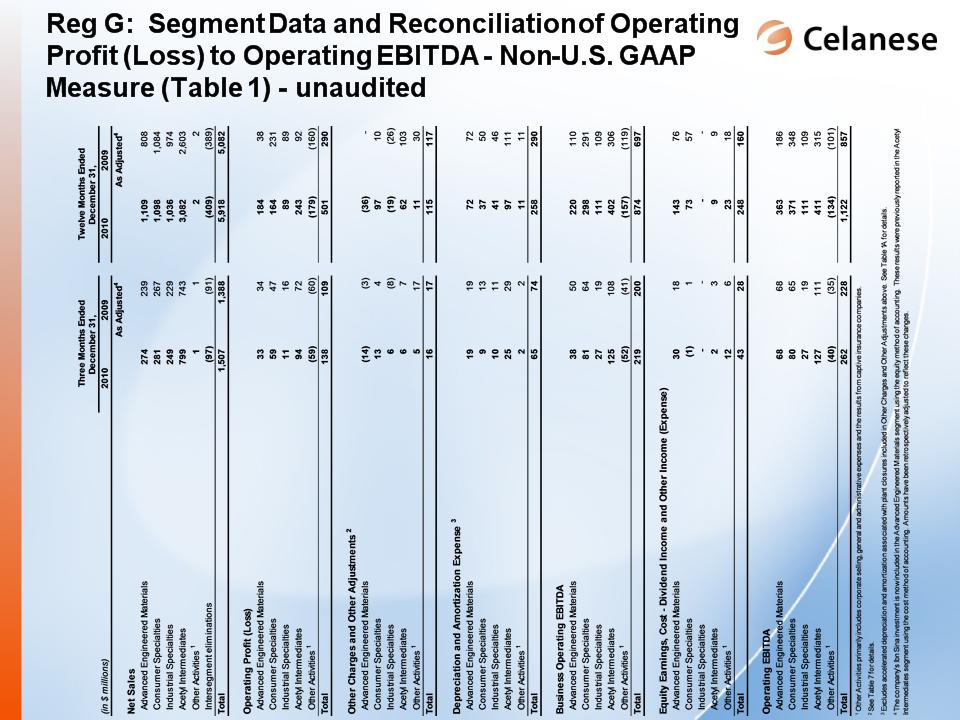
30
Reg G: Reconciliation of consolidated Operating
EBITDA to net earnings (loss) - Non-U.S. GAAP
Measure (Table 1A) - unaudited
EBITDA to net earnings (loss) - Non-U.S. GAAP
Measure (Table 1A) - unaudited
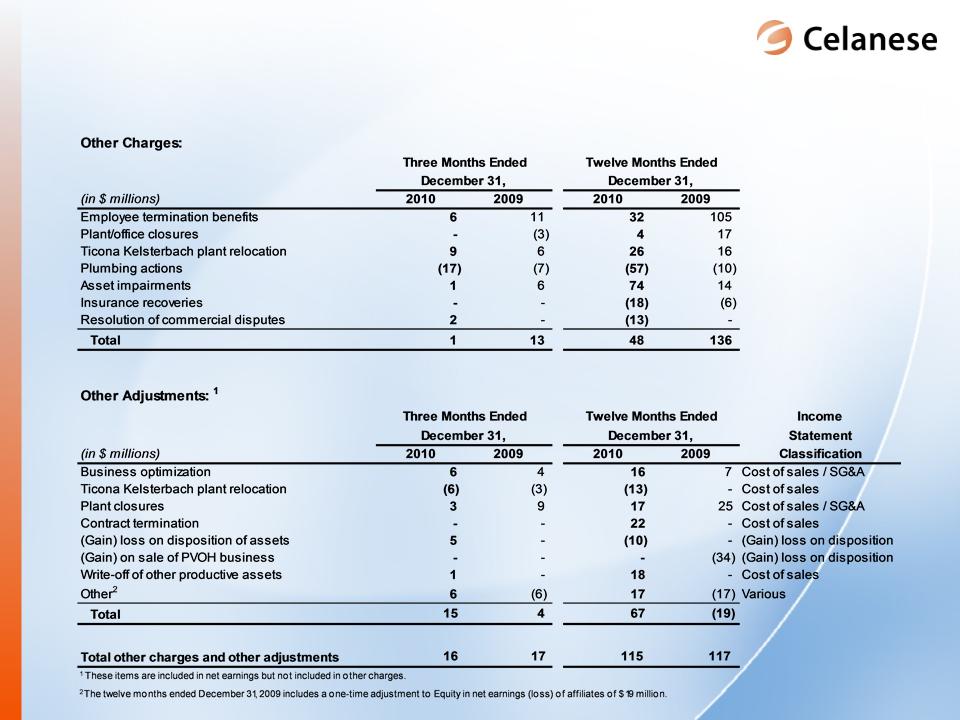
31
Reg G: Reconciliation of other charges and other
adjustments (Table 2) - Non-U.S. GAAP Measure -
unaudited
adjustments (Table 2) - Non-U.S. GAAP Measure -
unaudited
32
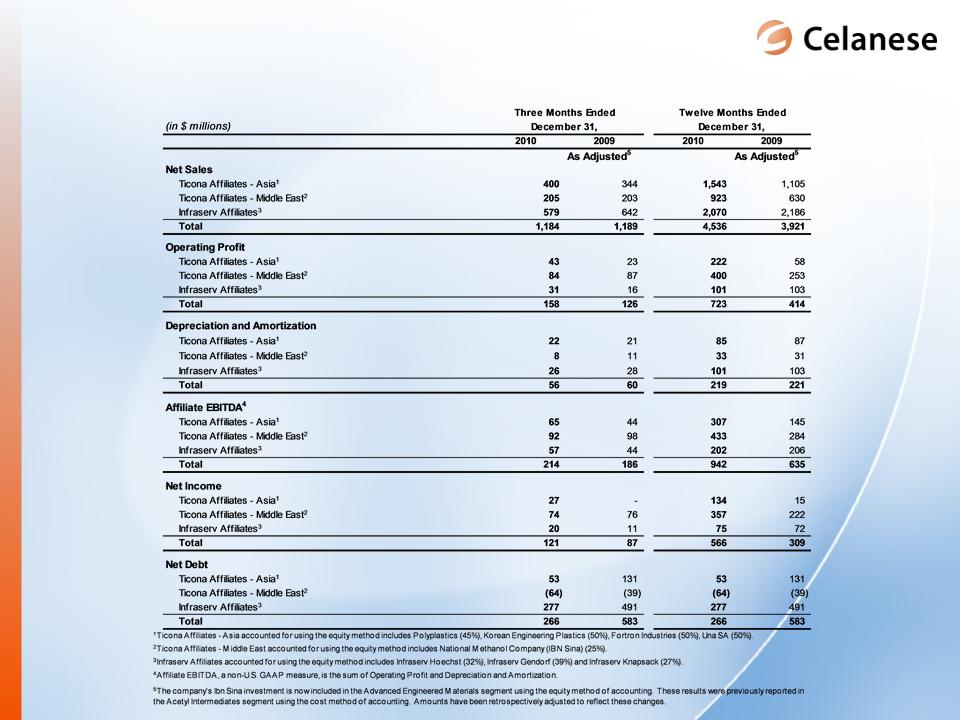
Reg G: Equity affiliate preliminary results - Total
(Table 3) - Non-U.S. GAAP Measure - unaudited
(Table 3) - Non-U.S. GAAP Measure - unaudited

33
34
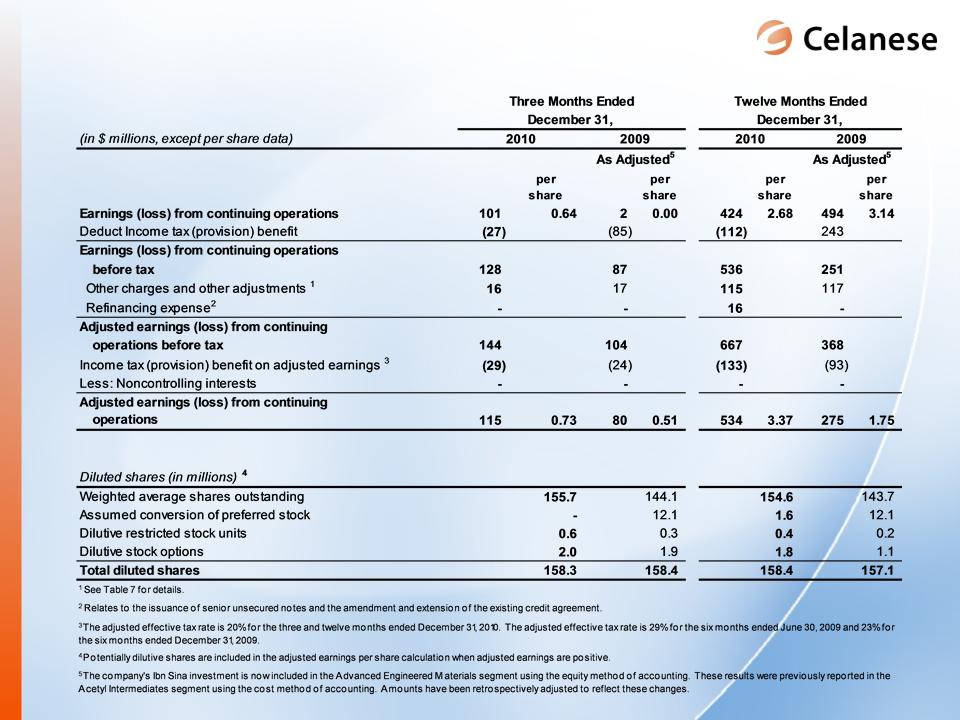
Reg G: Reconciliation of adjusted EPS (Table 4) -
Non-U.S. GAAP Measure - unaudited
Non-U.S. GAAP Measure - unaudited