Attached files
| file | filename |
|---|---|
| 8-K - FORM 8-K - BBX CAPITAL CORP | d8k.htm |
Exhibit 99.1

BankAtlantic Bancorp Reports Financial Results
For the Fourth Quarter and Full Year, 2010
FORT LAUDERDALE, Florida – February 11, 2011 — BankAtlantic Bancorp, Inc. (NYSE: BBX) today reported financial results for the fourth quarter and full year ending December 31, 2010.
Fourth Quarter 2010
BankAtlantic Bancorp, Inc. (the “Company”) today reported a net loss from continuing operations of ($48.1) million, or ($0.77) per diluted share, for the quarter ended December 31, 2010, compared to a net loss from continuing operations of ($52.5) million, or ($1.06) per diluted share, for the quarter ended December 31, 2009.
Full Year 2010
BankAtlantic Bancorp reported a net loss from continuing operations of ($145.0) million, or ($2.61) per diluted share, for the year ended December 31, 2010, compared to a net loss from continuing operations of ($189.5) million, or ($7.99) per diluted share, for the year ended December 31, 2009.
BankAtlantic Bancorp’s Chairman and Chief Executive Officer, Alan B. Levan, commented, “As the effects of the recession wind down, I want to take the opportunity to reflect on the strategies we articulated in the latter half of 2007 and our positioning over the last three and a half years. Let me make it clear – we do not believe we are out of the woods yet; however, we are optimistic that 2011 will be a building year and that in 2012, we will enjoy the benefits of a rebounding economy and an infrastructure prepared to take advantage of a return to normalcy.
Highlights of the BankAtlantic Operating Segment
“In 2007, BankAtlantic was among the first in the country to recognize cracks in the real estate economy and the potential havoc it could create. At that time, we disclosed both internally and externally that our focus would be on Capital, Credit and Core Earnings. We never imagined just how challenging and difficult the last three and a half years would be. Obviously, the most important thing about a recession is to survive it in order to benefit from the recovery.
1
While the period from the third quarter 2007 through year end 2010 has been extremely difficult, BankAtlantic’s accomplishments should not be overlooked when comparing year end 2007 to year end 2010:
| • | Tier 1/Core Capital ratios remained stable from 6.94% at December 31, 2007 to 6.22% at December 31, 2010. At no time did our capital ratios fall below defined regulatory “well capitalized” levels. The previously announced Tampa branch sale (anticipated to close in June 2011, subject to regulatory approvals and customary conditions), is estimated to add over 130 basis points to our regulatory capital ratios. |
| • | Core earnings ( 1) held firm from $51 million for the full year 2007 to $47 million for the full year 2010. We expect that significant efficiencies will be kicking in during 2011. |
| • | Core deposits ( 2) increased from $2.3 billion at December 31, 2007 to $2.8 billion at December 31, 2010. |
| • | Total cost of deposits decreased from 2.15% in the fourth quarter of 2007 to 0.47% in the fourth quarter of 2010. |
| • | Brokered deposits have never been a core funding source, totaling $14.7 million or 0.2% of total assets at December 31, 2007 and $14.1 million or 0.3% of total assets at December 31, 2010. |
| • | Net interest margin was 3.62% for the year ended December 31, 2007 and 3.55% for the year ended December 31, 2010. |
| • | Available liquidity, which includes cash, free securities and unused Federal Funds and/or FHLB borrowing capacity, increased from 35.9% of deposits at December 31, 2007 to 37.7% at December 31, 2010. Cash and free securities balances increased from 12.7% of deposits at December 31, 2007 to 22.0% of deposits at December 31, 2010. |
| (1) | Pre-tax core operating earnings is a non-GAAP measure that we use to refer to pre-tax earnings before provision for loan losses, tax certificate provisions, debt redemption costs, gains/losses on sales of real estate, and impairments, restructuring and exit activities. A reconciliation of loss from bank operations before income taxes to pre-tax core operating earnings is included in BankAtlantic Bancorp’s Fourth Quarter and Full Year, 2010 Supplemental Financials available at www.BankAtlanticBancorp.com. To view the financial data, access the “Investor Relations” section and click on the “Quarterly Financials or Supplemental Financials” navigation links. |
| (2) | Core deposits is a term that we use to refer to Demand, NOW and Savings accounts. A reconciliation of core deposits to total deposits is included in BankAtlantic Bancorp’s Fourth Quarter and Full Year, 2010 Supplemental Financials available at www.BankAtlanticBancorp.com. To view the financial data, access the “Investor Relations” section and click on the “Quarterly Financials or Supplemental Financials” navigation links. |
2
| • | Leverage decreased from $1.6 billion at December 31, 2007 to $226 million at December 31, 2010. The ratio of borrowings as a percentage of total borrowings and deposits declined from 28.7% at December 31, 2007 to only 5.5% at December 31, 2010. |
| • | Non-interest expense decreased from $314 million at December 31, 2007 to $236 million at December 31, 2010. |
| • | Employee count decreased from 2,569 at December 31, 2007 to 1,363 at December 31, 2010. |
| • | The allowance for loan losses to total loans increased from 2.04% at December 31, 2007 to 5.08% at December 31, 2010. |
| • | During 2010, BankAtlantic was rated as having the “Highest in Customer Satisfaction in Florida for Retail Banking” based on the J.D. Power and Associates 2010 Retail Banking Satisfaction Study™. |
“As we have previously discussed, we believe that the fall of 2010 was a turning point for BankAtlantic. While both the current quarter and the full year 2010 results continue to reflect losses associated with our real estate related loan portfolios as the Florida economy has continued to suffer, we are confident that our focus on our three core initiatives and additional directives will serve us well, and position us to be a stronger, leaner, more profitable company.
Supplemental graphs for BankAtlantic (bank only) are provided as a means to illustrate many of the metrics described above. To view the supplemental graphs, please visit our website at www.BankAtlanticBancorp.com, access the “Investor Relations” section and click on the “Supplemental Graphs” navigation link or visit http://www.snl.com/interactive/lookandfeel/101666/BBX_fin_supp.pdf.
Additional detailed financial data for BankAtlantic (bank only), the Parent- BankAtlantic Bancorp, and consolidated BankAtlantic Bancorp are available at www.BankAtlanticBancorp.com. To view the financial data, access the “Investor Relations” section and click on the “Quarterly Financials or Supplemental Financials” navigation links.
BANKATLANTIC PERFORMANCE
CAPITAL:
“Despite the reported losses and the challenges of the recession, our capital ratios have remained relatively stable over the last four years. We have achieved this, in spite of over $450
3
million in losses, through a variety of strategies including capital raises, core earnings focus, and the reduction and sale of assets. At December 31, 2010, BankAtlantic’s capital ratios were: Tier 1/Core capital of 6.22%, Tier 1 risk-based capital of 9.84%, and Total risk-based capital of 11.90%.
Our historical Capital Ratios at BankAtlantic were:
| 12/2006 | 12/2007 | 12/2008 | 12/2009 | |||||||||||||
| Tier 1/Core |
7.55 | % | 6.94 | % | 6.80 | % | 7.58 | % | ||||||||
| Tier 1 Risk-Based |
10.50 | % | 9.85 | % | 9.80 | % | 10.63 | % | ||||||||
| Total Risk-Based |
12.08 | % | 11.63 | % | 11.63 | % | 12.56 | % | ||||||||
“In addition, we anticipate recording a net gain on the Tampa branch sale transaction which, combined with the reduction in assets from the sale and based on current deposit levels and financial statements, is estimated to add over 130 basis points to our regulatory capital ratios.
CREDIT:
“While no section of the country has been immune to the effect of the recession, Florida has been especially hard hit as real estate values declined significantly and unemployment levels rose. However, when we compare 2010 to 2009, we are encouraged with recent credit trends and we continue to believe that we may have seen the peak of our impairments, provisions and delinquencies.
| • | “Delinquencies excluding non-accrual loans were 1.20% of loans at December 31, 2010 as compared to 1.91% at December 31, 2009. |
| • | “BankAtlantic’s allowance for loan losses was $161.3 million at December 31, 2010. The allowance coverage to total loans increased to 5.08% at December 31, 2010 compared to 4.53% at December 31, 2009. |
| • | “The provision for loan losses in the fourth quarter of 2010 was $40.1 million compared to $82.5 million in the fourth quarter of 2009. For the full year 2010, the provision for loan losses was $138.8 million compared to $214.2 million for the full year 2009. |
| • | “The provision for loan losses in the fourth quarter of 2010 assigned to each loan portfolio is as follows: Commercial Real Estate- $26.5 million provision; Consumer- $0.3 million provision; Small Business- $2.9 million provision; Residential Real Estate- $6.0 million provision; and Commercial Business- $1.6 million provision. |
4
| • | “Net charge-offs were $57.7 million in the fourth quarter of 2010, compared to $74.9 million in the fourth quarter of 2009. Fourth quarter 2010 net charge-offs reflected lower to relatively unchanged net charge-offs in all categories as compared to the prior year’s quarter, and in all categories except Commercial Real Estate as compared to the third quarter of 2010. Net charge-offs were $148.2 million for the full year 2010, down from $166.2 million for the full year 2009. |
| • | “Total non-accrual loans were $371.0 million at December 31, 2010, reflecting a decrease of $33.1 million as compared to the third quarter of 2010, and an increase of $84.8 million as compared to December 31, 2009. Included in this number at December 31, 2010 is approximately $113.3 million of commercial real estate and commercial business non-accrual loans that continued to be current and paying under the terms of their loan agreements. |
| • | “Total nonperforming assets were $438.9 million at December 31, 2010, reflecting a decrease of $25.9 million from the third quarter of 2010, and an increase of $114.7 million from December 31, 2009. |
CORE EARNINGS:
Results of Operations – “BankAtlantic’s net loss was ($43.5) million for the fourth quarter of 2010, compared to a net loss of ($48.6) million for the fourth quarter of 2009. Pretax core operating earnings for the fourth quarter of 2010 were $8.4 million, compared to $10.4 million for the fourth quarter of 2009. Loan loss and tax certificate provisions, debt redemption costs, loss on real estate sold and impairment, restructuring and exit activity expenses, which are not included in pre-tax core operating earnings, were ($51.8) million for the fourth quarter of 2010, and ($90.8) million for the fourth quarter of 2009.
“For the full year 2010, BankAtlantic’s net loss was ($118.2) million, compared to a net loss of ($148.7) million for the full year of 2009. Pretax core operating earnings for the full year of 2010 were $47.1 million, compared to $69.2 million for the full year 2009. For the year ended December 31, 2010, loan loss and tax certificate provisions, debt redemption costs, loss on real estate sold and impairment, restructuring and exit activity expenses, which are not included in pre-tax core operating earnings, were ($165.1) million compared to ($249.6) million for the year ended December 31, 2009. The individual components of earnings are described more fully below.
5
Deposits and Borrowings – BankAtlantic’s Chief Executive Officer, Jarett S. Levan, commented, “BankAtlantic’s ‘Core’ and total deposits at December 31, 2010 were $2.8 billion and $3.9 billion, respectively.
| • | “During the fourth quarter of 2010: |
| • | Core deposits increased $75.8 million. |
| • | Total deposits increased by $55.4 million, reflecting primarily the increased core deposits and increased public funds balances. |
| • | “For the full year 2010: |
| • | Core deposits increased approximately $198.2 million. |
| • | Total deposits decreased approximately $76.7 million as the net declines in non-core accounts (primarily higher-cost CDs) offset the growth in core deposits. |
“In addition, the average cost of core deposits and total deposits for the fourth quarter of 2010 was 0.25% and 0.46%, respectively; brokered deposit balances represented 0.3% of assets; and non-CD balances represented approximately 83% of total deposits.
Net Interest Income and Margin – “Net interest income for the fourth quarter of 2010 was $35.8 million compared to $40.0 million for the fourth quarter of 2009. Net interest income for the full year 2010 was $151.3 million compared to $163.3 million for the full year 2009. The reduction in both the current quarter and full year net interest income as compared to the comparative prior year periods reflected the impact of decreases in earning assets, increases in lower-yielding investments and net increases in nonperforming assets.
| • | “Net interest margin during the fourth quarter of 2010 was 3.40% as compared to 3.53% during the fourth quarter of 2009. |
| • | “Net interest spread during the fourth quarter of 2010 was 3.24% as compared to 3.27% during the fourth quarter of 2009. |
| • | “Average balance sheet activity impacting net interest income included: |
| • | “Average earning assets declined by $325.0 million from the fourth quarter 2009 to the fourth quarter 2010, due primarily to routine asset paydowns and net charge-offs. |
6
| • | “Average invested excess cash of $263.9 million during the fourth quarter of 2010 earned an average yield of 25 basis points. This compares to $113.4 million in average invested cash during the fourth quarter of 2009 earning a similar yield. |
| • | “Nonperforming assets increased by $114.7 million from December 31, 2009 to December 31, 2010. |
Non-interest income – “Total non-interest income for the fourth quarter of 2010 was $24.2 million, down from $28.2 million for the fourth quarter of 2009. The decrease in the current quarter primarily reflects declines in service charges relating to customer non-sufficient funds activity, versus the comparable quarter of 2009.
“Total non-interest income for the full year 2010 was $105.8 million compared to $129.3 million for the full year 2009. The decline in the full year non-interest income included $15.9 million in reduced service charges on deposits, as well as $8.3 million in lower securities gains.
Non-interest expense – “Total non-interest expenses were $63.3 million in the fourth quarter of 2010 compared to $66.0 million in the fourth quarter of 2009. Core expenses (3) were $51.6 million in the fourth quarter of 2010, compared to core expenses of $57.7 million in the fourth quarter of 2009, reflecting a $6.2 million decrease in employee compensation and benefits and a $1.3 million decrease in occupancy and equipment expense. These expense reductions were partially offset by a $1.1 million increase in professional fees primarily related to legal costs.
“Total non-interest expense in 2010 was $236.3 million compared to $258.8 million in 2009. Core expenses (3) were $210.0 million for the full year 2010, compared to core expenses of $223.4 for the full year 2009, reflecting a $12.1 million decrease in employee compensation and benefits, a $5.0 million decrease in occupancy and equipment expense and a $1.8 million decrease in check losses. These expense reductions were partially offset by a $4.8 million increase in professional fees primarily related to legal costs.
| (3) | Core expense is a non-GAAP measure that we use to refer to total non-interest expenses excluding tax certificate provisions, debt redemption costs, gains/losses on sales of real estate, impairments, restructuring and exit activities. A reconciliation of total expense to core expense is included in BankAtlantic Bancorp’s Fourth Quarter and Full Year, 2010 Supplemental Financials available at www.BankAtlanticBancorp.com. To view the financial data, access the “Investor Relations” section and click on the “Quarterly Financials or Supplemental Financials” navigation links. |
7
“Expenses not included in ‘core expenses’ consisted of the following:
| • | “Impairment, restructuring and exit charges were $10.2 million in the fourth quarter of 2010, versus $7.7 million in the fourth quarter of 2009. The charges in the fourth quarter of 2010 included: |
| • | Charges totaling $5.0 million related to write-downs of real estate owned. |
| • | Charges totaling $3.4 million related to lease termination costs and real estate impairments associated with stores held-for-sale. |
| • | A $1.9 million severance charge related to a reduction in force during the fourth quarter of 2010. The anticipated annual expense reduction in compensation and benefits resulting from this reduction in force is estimated at $7.0 million. |
| • | “Tax certificate provision of $0.8 million in the fourth quarter of 2010, versus $0.7 million in the fourth quarter of 2009. |
| • | “Loss on sale of real estate of $0.7 million in the fourth quarter of 2010, versus a gain of $0.1 million in the fourth quarter of 2009. |
“Total non-interest expense in 2010 was $236.3 million compared to $258.8 million in 2009.
| • | “Core expenses for the full year 2010 were $210.0 million compared to $223.4 million in 2009, reflecting an improvement of $13.4 million, or 6.0%. The year-over-year core expense improvement included decreases during 2010 of $12.1 million in employee compensation and benefits; $5.0 million in occupancy and equipment expense and $1.8 million in check losses (related to the decline in deposit service charges discussed above); and $2.4 million in FDIC special assessments in 2009. These improvements were partially offset by a $4.8 million increase in professional fees, primarily reflecting higher legal costs. |
Tampa Branch Sale
“As previously announced on January 31, 2011, BankAtlantic has entered into an agreement for the sale of its Tampa – St. Petersburg franchise to PNC Bank, N.A., a part of The PNC Financial Services Group Inc. Under the agreement, BankAtlantic has agreed to sell its 19 branches and 2 related facilities in the Tampa – St. Petersburg area and the associated deposits
8
(approximately $350 million), to PNC. PNC has agreed to pay a premium for the deposits assumed by PNC in the transaction plus the net book value of the acquired real estate and fixed assets associated with the branches and facilities. This transaction, which is subject to regulatory approvals and other customary terms and conditions, is anticipated to close during June 2011, at which point we anticipate recording a net gain on this transaction of between $34 million and $35 million (based on current deposit levels). The sale of the Tampa locations will allow BankAtlantic to focus its efforts on its primary footprint, consisting of 79 branches, in Southeast Florida.
Regulatory Matters
“The regulatory environment is challenging and based upon our reported losses and level of nonperforming assets, we expect that we may be required to increase our capital ratios and may be subject to additional operating requirements and restrictions.”
BANKATLANTIC BANCORP (Parent Company level):
Alan B. Levan further commented, “BankAtlantic Bancorp’s net loss at the parent only level was ($4.6) million for the fourth quarter of 2010, compared to a net loss of ($3.8) million for the fourth quarter of 2009. The fourth quarter 2010 included a net provision for loan losses of $0.5 million compared to a net recovery of $(1.2) million in the fourth quarter of 2009. Additionally, the net loss in the fourth quarter of 2009 included a $1.3 million gain on securities sales. For the full year, the net loss at the parent only level was ($26.8) million compared to a net loss of ($40.8) million for the full year 2009 due primarily to $12.9 million in lower loan provisions.
“As announced in the first quarter of 2009, we continue to defer the regularly scheduled interest payments on the outstanding junior subordinated debentures relating to all of our TruPS, which is permitted under the terms of the securities for up to another 12 consecutive quarterly periods.
Asset Workout Subsidiary – “The loans and real estate owned held by the holding company workout subsidiary at December 31, 2010 included real estate owned of $10.2 million, performing loans of $2.8 million and non-accrual loans of $14.5 million. Charge-offs of $34.7 million have been taken on these non-accrual loans, and $0.8 million in specific reserves are currently maintained related to these loans.
9
Litigation – “As previously reported, the Company and certain of its directors and executive officers were defendants in a shareholder class action lawsuit brought in the United States District Court for the Southern District of Florida, and on November 18, 2010, the jury in the lawsuit returned a verdict awarding $2.41 per share to shareholders who purchased shares of the Company’s Class A Common Stock during the period of April 26, 2007 to October 26, 2007 and retained those shares until the end of the period. The jury was not asked to and did not determine a total damage award to the class as a whole. Further, the Judge has indicated that if the post-trial motions to set aside the verdict are denied, the issues will be certified to the 11th Circuit Court of Appeals before any judgment is entered or claims commenced. The motions to set aside the verdict along with related motions have been submitted and are currently being considered by the Court. While there is no certainty, the Company, based on the advice of counsel, currently believes a loss is not probable. Accordingly, there is no related liability currently recorded on BankAtlantic Bancorp’s financial statements as of December 31, 2010. As facts and circumstances relating to this lawsuit develop further, we will continue to review and take any accruals as appropriate.”
- - -
Additional detailed financial data for BankAtlantic (bank only), the Parent- BankAtlantic Bancorp, and consolidated BankAtlantic Bancorp are available at www.BankAtlanticBancorp.com
To view the financial data, access the “Investor Relations” section and click on the “Quarterly Financials or Supplemental Financials” navigation links. Additionally, BankAtlantic’s financial information is provided quarterly to the OTS through Thrift Financial Reports, available to the public through the OTS and FDIC websites.
Additionally, copies of BankAtlantic Bancorp’s fourth quarter and full year, 2010 financial results press release and financial data are available upon request via fax, email, or postal service mail. To request a copy, contact BankAtlantic Bancorp’s Investor Relations department using the contact information listed below.
About BankAtlantic Bancorp:
BankAtlantic Bancorp (NYSE: BBX) is a bank holding company and the parent company of BankAtlantic.
10
About BankAtlantic:
BankAtlantic, Florida’s Most Convenient Bank, is one of the largest financial institutions headquartered in Florida. BankAtlantic was rated as having the “Highest in Customer Satisfaction in Florida for Retail Banking” based on the J.D. Power and Associates 2010 Retail Banking Satisfaction Study™. Via its broad network of community branches and conveniently located ATMs, BankAtlantic provides a full line of personal, small business and commercial banking products and services. BankAtlantic is open 7 days a week and offers extended weekday hours, Online Banking & Bill Pay, a 7-Day Customer Service Center, Change Exchange coin counters, as well as retail and business checking accounts. Member FDIC.
For further information, please visit our websites:
www.BankAtlanticBancorp.com
www.BankAtlantic.com
To receive future BankAtlantic Bancorp news releases or announcements directly via Email, please click on the Email Broadcast Sign Up button on our website: www.BankAtlanticBancorp.com.
BankAtlantic Bancorp Contact Info:
Leo Hinkley, Investor and Media Relations Officer
Telephone: (954) 940-5300
Email: InvestorRelations@BankAtlanticBancorp.com
BankAtlantic, “Florida’s Most Convenient Bank,” Contact Info:
Media Relations:
Sharon Lyn, Vice President
Telephone: 954-940-6383, Fax: 954-940-5320
Email: CorpComm@BankAtlanticBancorp.com
# # #
Except for historical information contained herein, the matters discussed in this press release contain forward-looking statements within the meaning of Section 27A of the Securities Act of 1933, as amended (the “Securities Act”), and Section 21E of the Securities Exchange Act of 1934, as amended (the “Exchange Act”), that involve substantial risks and uncertainties. Actual results, performance, or achievements could differ materially from those contemplated, expressed, or implied by the forward-looking statements contained herein. These forward-looking statements are based largely on the expectations of BankAtlantic Bancorp, Inc. (“the Company”) and are subject to a number of risks and uncertainties that are subject to change based on factors which are, in many instances, beyond the Company’s control. These include, but are not limited to, risks and uncertainties associated with: the impact of economic,
11
competitive and other factors affecting the Company and its operations, markets, products and services, including the impact of the changing regulatory environment, a continued or deepening recession, continued decreases in real estate values, and increased unemployment or sustained high unemployment rates on our business generally, our regulatory capital ratios, the ability of our borrowers to service their obligations and of our customers to maintain account balances and the value of collateral securing our loans; credit risks and loan losses, and the related sufficiency of the allowance for loan losses, including the impact on the credit quality of our loans (including those held in the asset workout subsidiary of the Company) of a sustained downturn in the economy and in the real estate market and other changes in the real estate markets in our trade area, and where our collateral is located; the quality of our real estate based loans including our residential land acquisition and development loans (including Builder land bank loans, Land acquisition and development loans and Land acquisition, development and construction loans) as well as Commercial land loans, other Commercial real estate loans, Residential loans and Consumer loans, and conditions specifically in those market sectors; the quality of our Commercial business loans and conditions specifically in that market sector; the risks of additional charge-offs, impairments and required increases in our allowance for loan losses especially if the economy and real estate markets in Florida do not improve; the impact of regulatory proceedings and litigation regarding overdraft fees; that we may not be able to comply with regulatory mandates or additional regulatory requirements; our activities may be subject to regulatory restrictions which may materially impact our business and prospects; that the securities class action litigation verdict may not be overturned, the uncertain impact of legal proceedings on our financial condition or operations, changes in interest rates and the effects of, and changes in, trade, monetary and fiscal policies and laws including their impact on the bank’s net interest margin; adverse conditions in the stock market, the public debt market and other financial and credit markets and the impact of such conditions on our activities, the value of our assets and on the ability of our borrowers to service their debt obligations and maintain account balances; the sale of our Tampa operations may not be completed as announced or at all and may not have the positive financial impact currently anticipated; our expense reduction initiatives may not be successful and additional cost savings may not be achieved; we may raise additional capital and such capital may be highly dilutive to BankAtlantic Bancorp’s shareholders or may not be available; and the risks associated with the impact of periodic
12
valuation testing of goodwill, deferred tax assets and other assets. Past performance and perceived trends may not be indicative of future results. In addition to the risks and factors identified above, reference is also made to other risks and factors detailed in reports filed by the Company with the Securities and Exchange Commission, including the Company’s Annual Report on Form 10-K for the year ended December 31, 2009. The Company cautions that the foregoing factors are not exclusive. Furthermore, BankAtlantic received the highest numerical score among retail banks in Florida in the proprietary J.D. Power and Associates 2010 Retail Banking Satisfaction StudySM. Study based on 47,673 total responses measuring 9 providers in Florida and measures opinions of consumers with their primary banking provider. Proprietary study results are based on experiences and perceptions of consumers surveyed in January 2010. Your experiences may vary. Visit jdpower.com.
13
BankAtlantic Bancorp, Inc. and Subsidiaries
Summary of Selected Financial Data (unaudited)
| For the Three Months Ended | For the Years Ended |
|||||||||||||||||||||||||||||
| 12/31/2010 | 9/30/2010 | 6/30/2010 | 3/31/2010 | 12/31/2009 | 12/31/2010 | 12/31/2009 | ||||||||||||||||||||||||
| Earnings (in thousands): |
||||||||||||||||||||||||||||||
| Net loss from continuing operations |
$ | (48,056 | ) | (25,184 | ) | (51,250 | ) | (20,521 | ) | (52,464 | ) | (145,011 | ) | (189,520 | ) | |||||||||||||||
| Net loss |
$ | (48,556 | ) | (25,184 | ) | (51,250 | ) | (20,521 | ) | (52,464 | ) | (145,511 | ) | (185,819 | ) | |||||||||||||||
| Net loss attributable to BankAtlantic Bancorp |
$ | (48,815 | ) | (25,409 | ) | (51,489 | ) | (20,729 | ) | (52,464 | ) | (146,442 | ) | (185,819 | ) | |||||||||||||||
| Pre-tax core operating earnings - Non-GAAP |
(note 1) | $ | 4,269 | 7,871 | 3,927 | 11,103 | 5,379 | 27,170 | 46,813 | |||||||||||||||||||||
| Average Common Shares Outstanding (in thousands): |
||||||||||||||||||||||||||||||
| Basic |
62,571 | 60,784 | 50,679 | 49,335 | 49,335 | 55,835 | 23,718 | |||||||||||||||||||||||
| Diluted |
62,571 | 60,784 | 50,679 | 49,335 | 49,335 | 55,835 | 23,718 | |||||||||||||||||||||||
| Key Performance Ratios |
||||||||||||||||||||||||||||||
| Basic and diluted loss per share from continuing operations |
(note 2) | $ | (0.77 | ) | (0.42 | ) | (1.02 | ) | (0.42 | ) | (1.06 | ) | (2.61 | ) | (7.99 | ) | ||||||||||||||
| Basic and diluted loss per share |
(note 2) | $ | (0.78 | ) | (0.42 | ) | (1.02 | ) | (0.42 | ) | (1.06 | ) | (2.62 | ) | (7.83 | ) | ||||||||||||||
| Return on average tangible assets from continuing operations |
(note 3) | % | (4.26) | (2.22 | ) | (4.46 | ) | (1.74 | ) | (4.30 | ) | (3.16 | ) | (3.61 | ) | |||||||||||||||
| Return on average tangible equity from continuing operations |
(note 3) | % | (373.78) | (138.75 | ) | (193.89 | ) | (64.56 | ) | (110.64 | ) | (163.00 | ) | (99.00 | ) | |||||||||||||||
| Average Balance Sheet Data (in millions): |
||||||||||||||||||||||||||||||
| Assets |
$ | 4,530 | 4,548 | 4,616 | 4,744 | 4,894 | 4,609 | 5,263 | ||||||||||||||||||||||
| Tangible assets - Non-GAAP |
(note 3) | $ | 4,515 | 4,533 | 4,600 | 4,728 | 4,878 | 4,594 | 5,245 | |||||||||||||||||||||
| Loans, gross |
$ | 3,360 | 3,513 | 3,627 | 3,799 | 3,991 | 3,573 | 4,214 | ||||||||||||||||||||||
| Investments |
$ | 883 | 748 | 648 | 604 | 610 | 722 | 679 | ||||||||||||||||||||||
| Deposits and escrows |
$ | 3,900 | 3,931 | 4,080 | 4,013 | 3,988 | 3,981 | 4,027 | ||||||||||||||||||||||
| Equity |
$ | 63 | 85 | 118 | 142 | 201 | 102 | 205 | ||||||||||||||||||||||
| Tangible equity - Non-GAAP |
(note 3) | $ | 51 | 73 | 106 | 127 | 190 | 89 | 191 | |||||||||||||||||||||
| Period End ($ in thousands) |
||||||||||||||||||||||||||||||
| Total loans, net |
$ | 3,018,179 | 3,239,542 | 3,387,725 | 3,515,542 | 3,694,326 | ||||||||||||||||||||||||
| Total assets |
$ | 4,509,433 | 4,527,736 | 4,655,600 | 4,748,201 | 4,815,617 | ||||||||||||||||||||||||
| Total equity |
$ | 14,744 | 64,082 | 77,466 | 119,611 | 141,571 | ||||||||||||||||||||||||
| Class A common shares outstanding |
61,595,321 | 61,595,321 | 52,946,126 | 48,245,042 | 48,245,042 | |||||||||||||||||||||||||
| Class B common shares outstanding |
975,225 | 975,225 | 975,225 | 975,225 | 975,225 | |||||||||||||||||||||||||
| Book value per share |
$ | 0.24 | 1.02 | 1.44 | 2.43 | 2.88 | ||||||||||||||||||||||||
| Tangible book value per share - Non-GAAP |
(note 4) | $ | 0.06 | 0.84 | 1.20 | 2.20 | 2.59 | |||||||||||||||||||||||
| High stock price for the quarter |
$ | 1.59 | 1.85 | 3.28 | 3.24 | 2.96 | ||||||||||||||||||||||||
| Low stock price for the quarter |
$ | 0.60 | 0.75 | 1.35 | 1.14 | 1.20 | ||||||||||||||||||||||||
| Closing stock price |
$ | 1.15 | 0.80 | 1.40 | 1.77 | 1.30 | ||||||||||||||||||||||||
Notes:
| (1) | Pre-tax core operating earnings excludes provision for loan losses, cost associated with debt redemption, provision for tax certificates, FDIC special assessment, gains/losses on sales of real estate and impairments, restructuring and exit activities. Pre-tax core operating earnings is a non-GAAP measure. |
See page 7 for a reconciliation of non-GAAP measures to GAAP financial measures.
| (2) | Diluted and basic loss per share are the same for all periods presented. |
| (3) | Average tangible assets is defined as average total assets less average goodwill and core deposit intangibles. |
Average tangible equity is defined as average total equity less average goodwill, core deposit intangibles and other comprehensive income. Average tangible assets and average tangible equity are non-GAAP measures. See page 7 for a reconciliation of non-GAAP measures to GAAP financial measures.
| (4) | Tangible book value per share is defined as equity less accumulated other comprehensive loss, goodwill and core deposit intangibles divided by the number of common shares outstanding. Tangible book value per share is a non-GAAP measure. |
See page 7 for a reconciliation of non-GAAP measures to GAAP financial measures.
14
BankAtlantic Bancorp, Inc. and Subsidiaries
Consolidated Statements of Financial Condition (unaudited)
| (in thousands) | December 31, 2010 |
December 31, 2009 |
||||||
| ASSETS |
||||||||
| Cash and due from depository institutions |
$ | 98,430 | 108,946 | |||||
| Interest bearing deposits at federal reserve and other banks |
455,038 | 125,851 | ||||||
| Securities available for sale and derivatives (at fair value) |
424,391 | 320,327 | ||||||
| Investment securities (approximate fair value: $1,500 and $1,500) |
1,500 | 1,500 | ||||||
| Tax certificates, net of allowance of $8,811 and $6,781 |
89,789 | 110,991 | ||||||
| Loans receivable, net of allowance for loan losses of $162,139 and $187,218 |
3,018,179 | 3,689,779 | ||||||
| Loans held for sale (at lower of cost or fair value) |
29,765 | 4,547 | ||||||
| Federal Home Loan Bank stock, at cost which approximates fair value |
43,557 | 48,751 | ||||||
| Real estate held for development and sale |
5,436 | 13,694 | ||||||
| Real estate owned |
74,488 | 46,477 | ||||||
| Office properties and equipment, net |
151,414 | 201,686 | ||||||
| Goodwill and other intangible assets |
14,569 | 15,817 | ||||||
| Assets held for sale |
37,334 | — | ||||||
| Other assets |
65,543 | 127,251 | ||||||
| Total assets |
$ | 4,509,433 | 4,815,617 | |||||
| LIABILITIES AND EQUITY |
||||||||
| Liabilities: |
||||||||
| Deposits |
||||||||
| Demand |
$ | 792,260 | 827,580 | |||||
| Savings |
418,304 | 412,360 | ||||||
| NOW |
1,370,568 | 1,409,138 | ||||||
| Money market |
354,282 | 360,043 | ||||||
| Certificates of deposit |
616,454 | 960,559 | ||||||
| Deposits held for sale |
341,146 | — | ||||||
| Total deposits |
3,893,014 | 3,969,680 | ||||||
| Advances from FHLB |
170,000 | 282,012 | ||||||
| Securities sold under agreements to repurchase |
21,524 | 24,468 | ||||||
| Federal funds purchased and other short term borrowings |
1,240 | 2,803 | ||||||
| Subordinated debentures and bonds payable |
22,000 | 22,697 | ||||||
| Junior subordinated debentures |
322,385 | 308,334 | ||||||
| Liabilities held for sale |
87 | — | ||||||
| Other liabilities |
64,439 | 64,052 | ||||||
| Total liabilities |
4,494,689 | 4,674,046 | ||||||
| Equity: |
||||||||
| Common stock |
626 | 493 | ||||||
| Additional paid-in capital |
317,362 | 296,438 | ||||||
| Accumulated deficit |
(299,875 | ) | (153,434 | ) | ||||
| Accumulated other comprehensive loss |
(3,827 | ) | (1,926 | ) | ||||
| Total BankAtlantic Bancorp stockholders’ equity |
14,286 | 141,571 | ||||||
| Noncontrolling interests |
458 | — | ||||||
| Total equity |
14,744 | 141,571 | ||||||
| Total liabilities and equity |
$ | 4,509,433 | 4,815,617 | |||||
15
BankAtlantic Bancorp, Inc. and Subsidiaries
Consolidated Statements of Operations (unaudited)
| For the Three Months Ended | For the Years Ended |
|||||||||||||||||||||||||||
| (in thousands) | 12/31/2010 | 9/30/2010 | 6/30/2010 | 3/31/2010 | 12/31/2009 | 12/31/2010 | 12/31/2009 | |||||||||||||||||||||
| INTEREST INCOME: |
||||||||||||||||||||||||||||
| Interest and fees on loans |
$ | 36,106 | 38,356 | 39,898 | 41,634 | 43,056 | 155,994 | 185,509 | ||||||||||||||||||||
| Interest on securities available for sale |
2,815 | 2,847 | 2,714 | 3,645 | 3,889 | 12,021 | 23,542 | |||||||||||||||||||||
| Interest on tax certificates |
1,544 | 2,837 | 514 | 2,356 | 2,975 | 7,251 | 14,022 | |||||||||||||||||||||
| Interest and dividends on investments |
299 | 367 | 223 | 153 | 136 | 1,042 | 520 | |||||||||||||||||||||
| Total interest income |
40,764 | 44,407 | 43,349 | 47,788 | 50,056 | 176,308 | 223,593 | |||||||||||||||||||||
| INTEREST EXPENSE: |
||||||||||||||||||||||||||||
| Interest on deposits |
4,556 | 4,877 | 6,021 | 7,057 | 7,950 | 22,511 | 41,884 | |||||||||||||||||||||
| Interest on advances from FHLB |
144 | 106 | 1 | 958 | 1,783 | 1,209 | 16,523 | |||||||||||||||||||||
| Interest on short-term borrowed funds |
7 | 8 | 7 | 8 | 9 | 30 | 209 | |||||||||||||||||||||
| Interest on long-term debt |
4,007 | 4,107 | 3,891 | 3,791 | 3,824 | 15,796 | 16,615 | |||||||||||||||||||||
| Total interest expense |
8,714 | 9,098 | 9,920 | 11,814 | 13,566 | 39,546 | 75,231 | |||||||||||||||||||||
| NET INTEREST INCOME |
32,050 | 35,309 | 33,429 | 35,974 | 36,490 | 136,762 | 148,362 | |||||||||||||||||||||
| Provision for loan losses |
40,643 | 24,410 | 48,553 | 30,755 | 81,301 | 144,361 | 232,658 | |||||||||||||||||||||
| NET INTEREST INCOME AFTER PROVISION |
(8,593 | ) | 10,899 | (15,124 | ) | 5,219 | (44,811 | ) | (7,599 | ) | (84,296 | ) | ||||||||||||||||
| NON-INTEREST INCOME: |
||||||||||||||||||||||||||||
| Service charges on deposits |
14,080 | 15,214 | 15,502 | 15,048 | 17,940 | 59,844 | 75,739 | |||||||||||||||||||||
| Other service charges and fees |
7,528 | 7,495 | 7,739 | 7,378 | 7,103 | 30,140 | 29,542 | |||||||||||||||||||||
| Securities activities, net |
(34 | ) | (552 | ) | 312 | 3,138 | 1,273 | 2,864 | 11,180 | |||||||||||||||||||
| Other |
3,091 | 5,204 | 2,970 | 2,900 | 3,267 | 14,165 | 13,360 | |||||||||||||||||||||
| Total non-interest income |
24,665 | 27,361 | 26,523 | 28,464 | 29,583 | 107,013 | 129,821 | |||||||||||||||||||||
| NON-INTEREST EXPENSE: |
||||||||||||||||||||||||||||
| Employee compensation and benefits |
19,868 | 23,549 | 25,155 | 25,378 | 28,628 | 93,950 | 108,245 | |||||||||||||||||||||
| Occupancy and equipment |
12,999 | 13,263 | 13,745 | 13,582 | 14,270 | 53,589 | 58,576 | |||||||||||||||||||||
| Advertising and business promotion |
2,389 | 2,026 | 2,239 | 1,944 | 2,286 | 8,598 | 8,646 | |||||||||||||||||||||
| Professional fees |
6,518 | 6,209 | 4,824 | 2,887 | 5,138 | 20,438 | 14,629 | |||||||||||||||||||||
| Check losses |
705 | 763 | 521 | 432 | 1,207 | 2,421 | 4,188 | |||||||||||||||||||||
| Supplies and postage |
1,052 | 983 | 921 | 998 | 1,135 | 3,954 | 4,173 | |||||||||||||||||||||
| Telecommunication |
635 | 702 | 662 | 534 | 844 | 2,533 | 2,481 | |||||||||||||||||||||
| Cost associated with debt redemption |
— | — | 53 | 7 | — | 60 | 7,463 | |||||||||||||||||||||
| Provision for tax certificates |
800 | 885 | 2,134 | 733 | 686 | 4,552 | 3,388 | |||||||||||||||||||||
| (Gain) loss on sale of real estate |
663 | (442 | ) | 1,490 | (104 | ) | (122 | ) | 1,607 | (342 | ) | |||||||||||||||||
| Impairment, restructuring and exit activities |
10,219 | 8,165 | 2,947 | 143 | 7,700 | 21,474 | 22,457 | |||||||||||||||||||||
| FDIC special assessment |
— | — | — | — | — | — | 2,428 | |||||||||||||||||||||
| Other |
8,280 | 7,304 | 7,958 | 7,580 | 7,186 | 31,122 | 30,432 | |||||||||||||||||||||
| Total non-interest expense |
64,128 | 63,407 | 62,649 | 54,114 | 68,958 | 244,298 | 266,764 | |||||||||||||||||||||
| Loss from continuing operations before income taxes |
(48,056 | ) | (25,147 | ) | (51,250 | ) | (20,431 | ) | (84,186 | ) | (144,884 | ) | (221,239 | ) | ||||||||||||||
| Provision (benefit) for income taxes |
— | 37 | — | 90 | (31,722 | ) | 127 | (31,719 | ) | |||||||||||||||||||
| Loss from continuing operations |
(48,056 | ) | (25,184 | ) | (51,250 | ) | (20,521 | ) | (52,464 | ) | (145,011 | ) | (189,520 | ) | ||||||||||||||
| Discontinued operations |
(500 | ) | — | — | — | — | (500 | ) | 3,701 | |||||||||||||||||||
| Net loss |
(48,556 | ) | (25,184 | ) | (51,250 | ) | (20,521 | ) | (52,464 | ) | (145,511 | ) | (185,819 | ) | ||||||||||||||
| Less: net income attributable to noncontrolling interest |
(259 | ) | (225 | ) | (239 | ) | (208 | ) | — | (931 | ) | — | ||||||||||||||||
| Net loss attributable to BankAtlantic Bancorp |
$ | (48,815 | ) | (25,409 | ) | (51,489 | ) | (20,729 | ) | (52,464 | ) | (146,442 | ) | (185,819 | ) | |||||||||||||
16
BankAtlantic Bancorp, Inc. and Subsidiaries
Consolidated Average Balance Sheet (unaudited)
| For the Three Months Ended | ||||||||||||||||||||||||
| (in thousands except percentages and per share data) | 12/31/2010 | 9/30/2010 | 6/30/2010 | 3/31/2010 | 12/31/2009 | |||||||||||||||||||
| Loans: |
||||||||||||||||||||||||
| Residential real estate |
$ | 1,270,095 | 1,356,748 | 1,433,322 | 1,513,302 | 1,600,027 | ||||||||||||||||||
| Commercial real estate |
1,010,148 | 1,061,918 | 1,079,760 | 1,148,435 | 1,228,250 | |||||||||||||||||||
| Consumer |
635,564 | 653,631 | 670,173 | 688,173 | 700,254 | |||||||||||||||||||
| Commercial business |
139,485 | 133,841 | 135,689 | 139,843 | 150,467 | |||||||||||||||||||
| Small business |
304,406 | 306,927 | 308,254 | 309,549 | 312,485 | |||||||||||||||||||
| Total Loans |
3,359,698 | 3,513,065 | 3,627,198 | 3,799,302 | 3,991,483 | |||||||||||||||||||
| Investments |
882,974 | 748,299 | 648,462 | 603,874 | 609,946 | |||||||||||||||||||
| Total interest earning assets |
4,242,672 | 4,261,364 | 4,275,660 | 4,403,176 | 4,601,429 | |||||||||||||||||||
| Goodwill and core deposit intangibles |
14,718 | 15,028 | 15,353 | 15,652 | 15,973 | |||||||||||||||||||
| Other non-interest earning assets |
272,805 | 271,950 | 324,727 | 324,910 | 276,438 | |||||||||||||||||||
| Total assets |
$ | 4,530,195 | 4,548,342 | 4,615,740 | 4,743,738 | 4,893,840 | ||||||||||||||||||
| Tangible assets - Non-GAAP |
(note 3 | ) | $ | 4,515,477 | 4,533,314 | 4,600,387 | 4,728,086 | 4,877,867 | ||||||||||||||||
| Deposits: |
||||||||||||||||||||||||
| Demand deposits |
$ | 924,035 | 907,294 | 916,131 | 864,413 | 844,052 | ||||||||||||||||||
| Savings |
448,942 | 444,981 | 445,686 | 425,235 | 421,032 | |||||||||||||||||||
| NOW |
1,476,258 | 1,484,558 | 1,525,475 | 1,467,103 | 1,312,073 | |||||||||||||||||||
| Money market |
406,781 | 404,406 | 386,712 | 360,470 | 372,081 | |||||||||||||||||||
| Certificates of deposit |
644,124 | 689,664 | 805,656 | 896,074 | 1,038,920 | |||||||||||||||||||
| Total deposits |
3,900,140 | 3,930,903 | 4,079,660 | 4,013,295 | 3,988,158 | |||||||||||||||||||
| Short-term borrowed funds |
18,099 | 26,187 | 25,528 | 26,332 | 30,812 | |||||||||||||||||||
| FHLB advances |
149,130 | 106,685 | 1,264 | 173,011 | 282,015 | |||||||||||||||||||
| Long-term debt |
341,409 | 340,230 | 334,507 | 331,403 | 328,222 | |||||||||||||||||||
| Total borrowings |
508,638 | 473,102 | 361,299 | 530,746 | 641,049 | |||||||||||||||||||
| Other liabilities |
58,015 | 59,207 | 57,152 | 57,755 | 63,979 | |||||||||||||||||||
| Total liabilities |
4,466,793 | 4,463,212 | 4,498,111 | 4,601,796 | 4,693,186 | |||||||||||||||||||
| Equity |
63,402 | 85,130 | 117,629 | 141,942 | 200,654 | |||||||||||||||||||
| Total liabilities and equity |
$ | 4,530,195 | 4,548,342 | 4,615,740 | 4,743,738 | 4,893,840 | ||||||||||||||||||
| Other comprehensive loss in equity |
(2,743 | ) | (2,499 | ) | (3,454 | ) | (846 | ) | (4,999 | ) | ||||||||||||||
| Tangible equity - Non-GAAP |
(note 3 | ) | $ | 51,427 | 72,601 | 105,730 | 127,136 | 189,680 | ||||||||||||||||
| Net Interest Margin |
3.03 | % | 3.32 | % | 3.13 | % | 3.33 | % | 3.26 | % | ||||||||||||||
17
Consolidated BankAtlantic Bancorp, Inc. and Subsidiaries
Nonperforming Assets and Credit Quality Statistics
| (in thousands) | As of | |||||||||||||||||||
| 12/31/2010 | 9/30/2010 | 6/30/2010 | 3/31/2010 | 12/31/2009 | ||||||||||||||||
| Nonaccrual loans: |
||||||||||||||||||||
| BankAtlantic |
$ | 370,959 | 404,087 | 362,126 | 301,365 | 286,120 | ||||||||||||||
| Parent- Work out Sub |
14,508 | 19,916 | 24,358 | 35,326 | 44,897 | |||||||||||||||
| Consolidated nonaccrual loans |
$ | 385,467 | 424,003 | 386,484 | 336,691 | 331,017 | ||||||||||||||
| Quarter-to-Date Net Charge-offs: |
||||||||||||||||||||
| BankAtlantic |
$ | (57,688 | ) | (21,887 | ) | (32,547 | ) | (36,074 | ) | (74,910 | ) | |||||||||
| Parent- Work out Sub |
(3,741 | ) | (4,438 | ) | (5,741 | ) | (4,302 | ) | (3,836 | ) | ||||||||||
| Consolidated charge-offs |
$ | (61,429 | ) | (26,325 | ) | (38,288 | ) | (40,376 | ) | (78,746 | ) | |||||||||
| Quarter-to-date Loan Provision: |
||||||||||||||||||||
| BankAtlantic |
$ | 40,144 | 23,012 | 43,634 | 32,034 | 82,523 | ||||||||||||||
| Parent- Work out Sub |
498 | 1,398 | 4,919 | (1,279 | ) | (1,222 | ) | |||||||||||||
| Consolidated loan provision |
$ | 40,642 | 24,410 | 48,553 | 30,755 | 81,301 | ||||||||||||||
| Allowance for Loan Loss: |
||||||||||||||||||||
| BankAtlantic |
$ | 161,309 | 181,760 | 180,635 | 169,548 | 173,588 | ||||||||||||||
| Parent- Work out Sub |
830 | 4,187 | 7,227 | 8,049 | 13,630 | |||||||||||||||
| Consolidated allowance for loan loss |
$ | 162,139 | 185,947 | 187,862 | 177,597 | 187,218 | ||||||||||||||
| Nonperforming Assets: |
||||||||||||||||||||
| BankAtlantic |
$ | 438,923 | 464,865 | 410,542 | 343,693 | 324,226 | ||||||||||||||
| Parent- Work out Sub |
24,668 | 29,682 | 34,190 | 45,858 | 55,429 | |||||||||||||||
| Consolidated nonperforming assets |
$ | 463,591 | 494,547 | 444,732 | 389,551 | 379,655 | ||||||||||||||
| Consolidated Credit Quality Statistics |
||||||||||||||||||||
| Allowance for loan losses to total loans |
% | 5.10 | 5.43 | 5.25 | 4.81 | 4.82 | ||||||||||||||
| Allowance to nonaccrual loans |
% | 42.06 | 43.86 | 48.61 | 52.75 | 56.56 | ||||||||||||||
| Provision to average loans |
% | 4.84 | 2.78 | 5.35 | 3.24 | 8.15 | ||||||||||||||
| Nonperforming loans, gross to total assets |
% | 8.55 | 9.36 | 8.30 | 7.09 | 6.87 | ||||||||||||||
| Nonperforming assets, gross to total assets |
% | 10.28 | 10.92 | 9.55 | 8.20 | 7.88 | ||||||||||||||
18
BankAtlantic Bancorp, Inc. and Subsidiaries
Reconciliation of GAAP Financial Measures to Non-GAAP Measures
Management uses non-GAAP financial measures to supplement its GAAP financial information and to provide additional useful measures in the evaluation of the Company's operating results and any related trends that may be affecting the Company's business. Management uses pre-tax core operating earnings to measure the Company's ongoing financial performance excluding items that are not currently controllable by management. Management uses book value per share and tangible book value per share to enable investors to compare these measures to the quoted market price of the Company's Class A common stock and to other companies in the industry. The return on average tangible equity and average tangible assets is used by management to measure the Company's effectiveness in its use of capital and assets, respectively, and to allow for comparison to other companies in the industry. These disclosures should not be viewed as a substitute for operating results determined in accordance with GAAP, nor are they necessarily comparable to non-GAAP performance measures that may be presented by other companies.
| Reconciliation of loss from continuing operations before income taxes to pre-tax core operating earnings |
||||||||||||||||||||||||||||
| For the Three Months Ended | For the Years Ended |
|||||||||||||||||||||||||||
| (in thousands) | 12/31/2010 | 9/30/2010 | 6/30/2010 | 3/31/2010 | 12/31/2009 | 12/31/2010 | 12/31/2009 | |||||||||||||||||||||
| Loss from continuing operations before income taxes |
$ | (48,056 | ) | (25,147 | ) | (51,250 | ) | (20,431 | ) | (84,186 | ) | (144,884 | ) | (221,239 | ) | |||||||||||||
| Costs associated with debt redemption |
— | — | 53 | 7 | — | 60 | 7,463 | |||||||||||||||||||||
| Provision for tax certificates |
800 | 885 | 2,134 | 733 | 686 | 4,552 | 3,388 | |||||||||||||||||||||
| Loss (gain) on sale of real estate |
663 | (442 | ) | 1,490 | (104 | ) | (122 | ) | 1,607 | (342 | ) | |||||||||||||||||
| Impairment, restructuring and exit activities |
10,219 | 8,165 | 2,947 | 143 | 7,700 | 21,474 | 22,457 | |||||||||||||||||||||
| FDIC special assessment |
— | — | — | — | — | — | 2,428 | |||||||||||||||||||||
| Provision for loan losses |
40,643 | 24,410 | 48,553 | 30,755 | 81,301 | 144,361 | 232,658 | |||||||||||||||||||||
| Non-GAAP pre-tax core operating earnings |
$ | 4,269 | 7,871 | 3,927 | 11,103 | 5,379 | 27,170 | 46,813 | ||||||||||||||||||||
| Reconciliation of equity to tangible book value per share |
||||||||||||||||||||||||||||
| As of | ||||||||||||||||||||||||||||
| (in thousands) | 12/31/2010 | 9/30/2010 | 6/30/2010 | 3/31/2010 | 12/31/2009 | |||||||||||||||||||||||
| Equity |
$ | 14,744 | 64,082 | 77,466 | 119,611 | 141,571 | ||||||||||||||||||||||
| Goodwill and core deposit intangibles |
(14,569 | ) | (14,877 | ) | (15,186 | ) | (15,494 | ) | (15,817 | ) | ||||||||||||||||||
| Other comprehensive loss |
3,827 | 3,207 | 2,320 | 4,141 | 1,926 | |||||||||||||||||||||||
| Tangible book value |
$ | 4,002 | 52,412 | 64,600 | 108,258 | 127,680 | ||||||||||||||||||||||
| Common shares outstanding, period end |
62,570,546 | 62,570,546 | 53,921,351 | 49,220,267 | 49,220,267 | |||||||||||||||||||||||
| Book value per share |
$ | 0.24 | 1.02 | 1.44 | 2.43 | 2.88 | ||||||||||||||||||||||
| Tangible book value per share - Non-GAAP |
$ | 0.06 | 0.84 | 1.20 | 2.20 | 2.59 | ||||||||||||||||||||||
| Reconciliation of return on average assets and average equity to return on average tangible assets and average tangible equity |
||||||||||||||||||||||||||||
| For the Three Months Ended | For the Years Ended |
|||||||||||||||||||||||||||
| (in thousands) | 12/31/2010 | 9/30/2010 | 6/30/2010 | 3/31/2010 | 12/31/2009 | 12/31/2010 | 12/31/2009 | |||||||||||||||||||||
| Net loss from continuing operations |
$ | (48,056 | ) | (25,184 | ) | (51,250 | ) | (20,521 | ) | (52,464 | ) | (145,011 | ) | (189,520 | ) | |||||||||||||
| Average total assets |
4,530,195 | 4,548,342 | 4,615,740 | 4,743,738 | 4,893,840 | 4,608,746 | 5,263,364 | |||||||||||||||||||||
| Average goodwill and core deposit intangibles |
(14,718 | ) | (15,028 | ) | (15,353 | ) | (15,652 | ) | (15,973 | ) | (15,185 | ) | (18,681 | ) | ||||||||||||||
| Average tangible assets |
4,515,477 | 4,533,314 | 4,600,387 | 4,728,086 | 4,877,867 | 4,593,561 | 5,244,683 | |||||||||||||||||||||
| Average equity |
63,402 | 85,130 | 117,629 | 141,942 | 200,654 | 101,759 | 204,995 | |||||||||||||||||||||
| Average goodwill and core deposit intangibles |
(14,718 | ) | (15,028 | ) | (15,353 | ) | (15,652 | ) | (15,973 | ) | (15,185 | ) | (18,681 | ) | ||||||||||||||
| Other comprehensive loss |
2,743 | 2,499 | 3,454 | 846 | 4,999 | 2,391 | 5,113 | |||||||||||||||||||||
| Average tangible equity |
$ | 51,427 | 72,601 | 105,730 | 127,136 | 189,680 | 88,965 | 191,427 | ||||||||||||||||||||
| Return on average assets from continuing operations |
-4.24 | % | -2.21 | % | -4.44 | % | -1.73 | % | -4.29 | % | -3.15 | % | -3.60 | % | ||||||||||||||
| Return on average tangible assets from continuing operations - Non-GAAP |
-4.26 | % | -2.22 | % | -4.46 | % | -1.74 | % | -4.30 | % | -3.16 | % | -3.61 | % | ||||||||||||||
| Return on average equity from continuing operations |
-303.18 | % | -118.33 | % | -174.28 | % | -57.83 | % | -104.59 | % | -142.50 | % | -92.45 | % | ||||||||||||||
| Return on average tangible equity from continuing operations - Non-GAAP |
-373.78 | % | -138.75 | % | -193.89 | % | -64.56 | % | -110.64 | % | -163.00 | % | -99.00 | % | ||||||||||||||
19
BankAtlantic (Bank Operations Business Segment)
Summary of Selected Financial Data (unaudited)
| (in thousands except percentages) | For the Three Months Ended | For the Years Ended |
||||||||||||||||||||||||||
| 12/31/2010 | 9/30/2010 | 6/30/2010 | 3/31/2010 | 12/31/2009 | 12/31/2010 | 12/31/2009 | ||||||||||||||||||||||
| Statistics: |
||||||||||||||||||||||||||||
| Average interest earning assets |
$ | 4,220,720 | 4,234,115 | 4,240,545 | 4,355,771 | 4,545,711 | 4,262,249 | 4,866,593 | ||||||||||||||||||||
| Average interest bearing liabilities |
$ | 3,177,611 | 3,189,179 | 3,220,458 | 3,383,776 | 3,494,040 | 3,242,045 | 3,901,672 | ||||||||||||||||||||
| Period end borrowings to deposits and borrowings |
% | 5.50 | 5.76 | 4.13 | 4.84 | 8.00 | 5.50 | 8.00 | ||||||||||||||||||||
| Efficiency ratio |
% | 105.60 | 91.87 | 94.05 | 77.86 | 96.82 | 91.92 | 88.44 | ||||||||||||||||||||
| Yield on interest earning assets |
% | 3.86 | 4.19 | 4.08 | 4.34 | 4.40 | 4.13 | 4.58 | ||||||||||||||||||||
| Cost of interest-bearing liabilities |
% | 0.62 | 0.65 | 0.78 | 0.99 | 1.13 | 0.76 | 1.53 | ||||||||||||||||||||
| Interest spread |
% | 3.24 | 3.54 | 3.30 | 3.35 | 3.27 | 3.37 | 3.05 | ||||||||||||||||||||
| Net interest margin |
% | 3.40 | 3.70 | 3.49 | 3.57 | 3.62 | 3.55 | 3.35 | ||||||||||||||||||||
| Non-GAAP Measures (Note 1) |
||||||||||||||||||||||||||||
| Average tangible assets |
$ | 4,473,959 | 4,489,189 | 4,544,611 | 4,668,854 | 4,819,572 | 4,543,400 | 5,167,432 | ||||||||||||||||||||
| Average tangible equity |
$ | 319,982 | 338,712 | 356,572 | 367,220 | 425,344 | 345,403 | 398,607 | ||||||||||||||||||||
| Pre-tax core operating earnings |
$ | 8,323 | 13,922 | 9,078 | 15,774 | 10,428 | 47,097 | 69,211 | ||||||||||||||||||||
| Core operating efficiency ratio |
% | 86.12 | 78.95 | 85.65 | 76.71 | 84.70 | 81.68 | 76.35 | ||||||||||||||||||||
| Return on average tangible assets |
% | (3.89 | ) | (1.57 | ) | (3.51 | ) | (1.47 | ) | (4.04 | ) | (2.60 | ) | (2.88 | ) | |||||||||||||
| Return on average tangible equity |
% | (54.38 | ) | (20.87 | ) | (44.73 | ) | (18.66 | ) | (45.74 | ) | (34.21 | ) | (37.31 | ) | |||||||||||||
| Tangible capital to tangible assets |
% | 6.12 | 7.08 | 7.29 | 7.55 | 7.66 | ||||||||||||||||||||||
| Earning assets repricing at period end: |
||||||||||||||||||||||||||||
| Percent of earning assets that have fixed rates |
% | 45 | 45 | 47 | 48 | 48 | ||||||||||||||||||||||
| Percent of earning assets that have variable rates |
% | 55 | 55 | 53 | 52 | 52 | ||||||||||||||||||||||
| Regulatory capital ratios and statistics at period end |
||||||||||||||||||||||||||||
| Total risk-based capital |
% | 11.90 | 12.59 | 12.86 | 12.86 | 12.56 | ||||||||||||||||||||||
| Tier I risk-based capital |
% | 9.84 | 10.59 | 10.87 | 10.90 | 10.63 | ||||||||||||||||||||||
| Core capital |
% | 6.22 | 7.17 | 7.36 | 7.51 | 7.58 | ||||||||||||||||||||||
| Risk-weighted assets |
$ | 2,807,257 | 3,021,862 | 3,104,341 | 3,206,075 | 3,364,662 | ||||||||||||||||||||||
| Adjusted total assets |
$ | 4,444,797 | 4,459,875 | 4,584,519 | 4,656,270 | 4,720,917 | ||||||||||||||||||||||
Note 1
See page 15 for a reconciliation of non-GAAP measures to GAAP financial measures.
20
BankAtlantic (Bank Operations Business Segment)
Condensed Statements of Operations (unaudited)
| For the Three Months Ended | For the Years Ended |
|||||||||||||||||||||||||||
| (in thousands) | 12/31/2010 | 9/30/2010 | 6/30/2010 | 3/31/2010 | 12/31/2009 | 12/31/2010 | 12/31/2009 | |||||||||||||||||||||
| Net interest income |
$ | 35,766 | 39,101 | 37,008 | 39,459 | 39,992 | 151,334 | 163,324 | ||||||||||||||||||||
| Provision for loan losses |
40,145 | 23,012 | 43,634 | 32,034 | 82,523 | 138,825 | 214,244 | |||||||||||||||||||||
| Net interest income after provision for loan losses |
(4,379 | ) | 16,089 | (6,626 | ) | 7,425 | (42,531 | ) | 12,509 | (50,920 | ) | |||||||||||||||||
| Non-interest income |
||||||||||||||||||||||||||||
| Service charges on deposits |
14,080 | 15,214 | 15,502 | 15,048 | 17,940 | 59,844 | 75,739 | |||||||||||||||||||||
| Other service charges and fees |
7,528 | 7,495 | 7,739 | 7,378 | 7,103 | 30,140 | 29,542 | |||||||||||||||||||||
| Securities activities, net |
(34 | ) | (543 | ) | 309 | 3,132 | — | 2,864 | 11,161 | |||||||||||||||||||
| Other non-interest income |
2,625 | 4,869 | 2,721 | 2,699 | 3,116 | 12,914 | 12,850 | |||||||||||||||||||||
| Total non-interest income |
24,199 | 27,035 | 26,271 | 28,257 | 28,159 | 105,762 | 129,292 | |||||||||||||||||||||
| Non-interest expense |
||||||||||||||||||||||||||||
| Employee compensation and benefits |
20,028 | 22,475 | 24,254 | 24,374 | 26,229 | 91,131 | 103,209 | |||||||||||||||||||||
| Occupancy and equipment |
12,996 | 13,263 | 13,745 | 13,581 | 14,269 | 53,585 | 58,574 | |||||||||||||||||||||
| Advertising and business promotion |
2,333 | 1,917 | 2,121 | 1,934 | 2,254 | 8,305 | 8,395 | |||||||||||||||||||||
| Professional fees |
5,638 | 4,942 | 4,220 | 2,565 | 4,542 | 17,365 | 12,574 | |||||||||||||||||||||
| Check losses |
705 | 763 | 521 | 432 | 1,207 | 2,421 | 4,188 | |||||||||||||||||||||
| Supplies and postage |
1,024 | 929 | 895 | 965 | 1,106 | 3,813 | 4,084 | |||||||||||||||||||||
| Telecommunication |
632 | 697 | 655 | 529 | 842 | 2,513 | 2,464 | |||||||||||||||||||||
| Cost associated with debt redemption |
— | — | 53 | 7 | — | 60 | 7,463 | |||||||||||||||||||||
| Provision for tax certificates |
800 | 885 | 2,134 | 733 | 686 | 4,552 | 3,388 | |||||||||||||||||||||
| (Gain) loss on sale of real estate |
663 | (442 | ) | 880 | (104 | ) | (122 | ) | 997 | (342 | ) | |||||||||||||||||
| Impairment, restructuring and exit activities |
10,219 | 8,099 | 2,247 | 143 | 7,700 | 20,708 | 22,457 | |||||||||||||||||||||
| FDIC special assessment |
— | — | — | — | — | — | 2,428 | |||||||||||||||||||||
| Other |
8,286 | 7,228 | 7,790 | 7,562 | 7,274 | 30,866 | 29,917 | |||||||||||||||||||||
| Total non-interest expense |
63,324 | 60,756 | 59,515 | 52,721 | 65,987 | 236,316 | 258,799 | |||||||||||||||||||||
| Loss from bank operations business segment before income taxes |
(43,504 | ) | (17,632 | ) | (39,870 | ) | (17,039 | ) | (80,359 | ) | (118,045 | ) | (180,427 | ) | ||||||||||||||
| Provision (benefit) for income taxes |
— | 37 | — | 90 | (31,722 | ) | 127 | (31,719 | ) | |||||||||||||||||||
| Net loss from bank operations business segment |
(43,504 | ) | (17,669 | ) | (39,870 | ) | (17,129 | ) | (48,637 | ) | (118,172 | ) | (148,708 | ) | ||||||||||||||
| Less: net income attributable to noncontrolling interest |
(259 | ) | (225 | ) | (239 | ) | (208 | ) | — | (931 | ) | — | ||||||||||||||||
| Net loss attributable to BankAtlantic |
$ | (43,763 | ) | (17,894 | ) | (40,109 | ) | (17,337 | ) | (48,637 | ) | (119,103 | ) | (148,708 | ) | |||||||||||||
21
BankAtlantic (Bank Operations Business Segment)
Condensed Statements of Financial Condition (unaudited)
| As of | ||||||||||||||||||||
| (in thousands) | 12/31/2010 | 9/30/2010 | 6/30/2010 | 3/31/2010 | 12/31/2009 | |||||||||||||||
| ASSETS |
||||||||||||||||||||
| Loans receivable, net |
$ | 3,009,771 | 3,218,097 | 3,361,772 | 3,480,198 | 3,655,396 | ||||||||||||||
| Loans held for sale (lower of cost or fair value) |
21,704 | 2,839 | 5,861 | 5,030 | 4,547 | |||||||||||||||
| Investment securities and FHLB stock |
133,371 | 150,035 | 189,120 | 137,189 | 159,742 | |||||||||||||||
| Available for sale securities |
424,360 | 446,591 | 275,065 | 243,779 | 320,322 | |||||||||||||||
| Goodwill |
13,081 | 13,081 | 13,081 | 13,081 | 13,081 | |||||||||||||||
| Core deposit intangible asset |
1,488 | 1,796 | 2,105 | 2,413 | 2,736 | |||||||||||||||
| Assets held for sale |
37,333 | 37,209 | — | — | — | |||||||||||||||
| Other assets |
828,060 | 615,828 | 764,278 | 806,311 | 599,298 | |||||||||||||||
| Total assets |
$ | 4,469,168 | 4,485,476 | 4,611,282 | 4,688,001 | 4,755,122 | ||||||||||||||
| LIABILITIES AND EQUITY |
||||||||||||||||||||
| Deposits |
||||||||||||||||||||
| Demand |
$ | 792,260 | 809,830 | 902,486 | 900,984 | 827,580 | ||||||||||||||
| Savings |
418,304 | 411,612 | 442,142 | 443,288 | 412,360 | |||||||||||||||
| NOW |
1,370,568 | 1,288,792 | 1,496,369 | 1,501,274 | 1,409,138 | |||||||||||||||
| Money market |
354,282 | 386,091 | 397,313 | 361,877 | 360,043 | |||||||||||||||
| Certificates of deposit |
616,454 | 601,956 | 749,948 | 840,017 | 960,559 | |||||||||||||||
| Deposits held for sale |
341,146 | 339,360 | — | — | — | |||||||||||||||
| Total deposits |
3,893,014 | 3,837,641 | 3,988,258 | 4,047,440 | 3,969,680 | |||||||||||||||
| Advances from Federal Home Loan Bank |
170,000 | 180,000 | 115,000 | 152,008 | 282,012 | |||||||||||||||
| Short term borrowings |
34,435 | 32,666 | 34,685 | 31,797 | 40,657 | |||||||||||||||
| Long term debt |
22,000 | 22,000 | 22,000 | 22,000 | 22,697 | |||||||||||||||
| Liabilities held for sale |
87 | 100 | — | — | — | |||||||||||||||
| Other liabilities |
62,526 | 81,452 | 100,904 | 66,574 | 61,175 | |||||||||||||||
| Total liabilities |
4,182,062 | 4,153,859 | 4,260,847 | 4,319,819 | 4,376,221 | |||||||||||||||
| Equity |
287,106 | 331,617 | 350,435 | 368,182 | 378,901 | |||||||||||||||
| Total liabilities and equity |
$ | 4,469,168 | 4,485,476 | 4,611,282 | 4,688,001 | 4,755,122 | ||||||||||||||
22
BankAtlantic (Bank Operations Business Segment)
Average Balance Sheet - Yield / Rate Analysis
| For the Three Months Ended | ||||||||||||||||||||||||
| December 31, 2010 | December 31, 2009 | |||||||||||||||||||||||
| (in thousands) | Average Balance |
Revenue/ Expense |
Yield/ Rate |
Average Balance |
Revenue/ Expense |
Yield/ Rate |
||||||||||||||||||
| Loans: |
||||||||||||||||||||||||
| Residential real estate |
$ | 1,270,095 | 15,344 | 4.83 | % | $ | 1,600,027 | 20,100 | 5.02 | % | ||||||||||||||
| Commercial real estate |
989,741 | 8,938 | 3.61 | 1,174,201 | 10,944 | 3.73 | ||||||||||||||||||
| Consumer |
635,564 | 4,748 | 2.99 | 700,254 | 5,158 | 2.95 | ||||||||||||||||||
| Commercial business |
137,950 | 2,263 | 6.56 | 148,931 | 1,806 | 4.85 | ||||||||||||||||||
| Small business |
304,406 | 4,758 | 6.25 | 312,485 | 4,989 | 6.39 | ||||||||||||||||||
| Total loans |
3,337,756 | 36,051 | 4.32 | 3,935,898 | 42,997 | 4.37 | ||||||||||||||||||
| Investments |
882,964 | 4,658 | 2.11 | 609,813 | 6,982 | 4.58 | ||||||||||||||||||
| Total interest earning assets |
4,220,720 | 40,709 | 3.86 | % | 4,545,711 | 49,979 | 4.40 | % | ||||||||||||||||
| Goodwill and core deposit intangibles |
14,718 | 15,973 | ||||||||||||||||||||||
| Other non-interest earning assets |
253,239 | 273,861 | ||||||||||||||||||||||
| Total Assets |
$ | 4,488,677 | $ | 4,835,545 | ||||||||||||||||||||
| Deposits: |
||||||||||||||||||||||||
| Savings |
$ | 448,942 | 257 | 0.23 | % | $ | 421,033 | 354 | 0.33 | % | ||||||||||||||
| NOW |
1,476,258 | 1,569 | 0.42 | 1,312,073 | 2,093 | 0.63 | ||||||||||||||||||
| Money market |
406,781 | 465 | 0.45 | 372,080 | 624 | 0.67 | ||||||||||||||||||
| Certificates of deposit |
644,124 | 2,265 | 1.40 | 1,038,920 | 4,879 | 1.86 | ||||||||||||||||||
| Total interest bearing deposits |
2,976,105 | 4,556 | 0.61 | 3,144,106 | 7,950 | 1.00 | ||||||||||||||||||
| Short-term borrowed funds |
30,376 | 11 | 0.14 | 45,225 | 14 | 0.12 | ||||||||||||||||||
| Advances from FHLB |
149,130 | 144 | 0.38 | 282,015 | 1,782 | 2.51 | ||||||||||||||||||
| Long-term debt |
22,000 | 231 | 4.17 | 22,694 | 241 | 4.21 | ||||||||||||||||||
| Total interest bearing liabilities |
3,177,611 | 4,942 | 0.62 | 3,494,040 | 9,987 | 1.13 | ||||||||||||||||||
| Demand deposits |
924,021 | 844,053 | ||||||||||||||||||||||
| Non-interest bearing other liabilities |
55,088 | 61,130 | ||||||||||||||||||||||
| Total Liabilities |
4,156,720 | 4,399,223 | ||||||||||||||||||||||
| Equity |
331,957 | 436,322 | ||||||||||||||||||||||
| Total liabilities and equity |
$ | 4,488,677 | $ | 4,835,545 | ||||||||||||||||||||
| Net interest income/ net interest spread |
35,767 | 3.24 | % | 39,992 | 3.27 | % | ||||||||||||||||||
| Margin |
||||||||||||||||||||||||
| Interest income/interest earning assets |
3.86 | % | 4.40 | % | ||||||||||||||||||||
| Interest expense/interest earning assets |
0.46 | 0.87 | ||||||||||||||||||||||
| Net interest margin |
3.40 | % | 3.53 | % | ||||||||||||||||||||
23
BankAtlantic (Bank Operations Business Segment)
Average Balance Sheet - Yield / Rate Analysis
| For the Years Ended | ||||||||||||||||||||||||
| December 31, 2010 | December 31, 2009 | |||||||||||||||||||||||
| (in thousands) | Average Balance |
Revenue/ Expense |
Yield/ Rate |
Average Balance |
Revenue/ Expense |
Yield/ Rate |
||||||||||||||||||
| Loans: |
||||||||||||||||||||||||
| Residential real estate |
$ | 1,392,600 | 68,392 | 4.91 | % | $ | 1,758,188 | 89,836 | 5.11 | % | ||||||||||||||
| Commercial real estate |
1,043,261 | 39,758 | 3.81 | 1,204,005 | 46,746 | 3.88 | ||||||||||||||||||
| Consumer |
661,718 | 19,285 | 2.91 | 723,135 | 21,104 | 2.92 | ||||||||||||||||||
| Commercial business |
135,669 | 9,036 | 6.66 | 143,224 | 7,461 | 5.21 | ||||||||||||||||||
| Small business |
307,269 | 19,295 | 6.28 | 316,328 | 20,010 | 6.33 | ||||||||||||||||||
| Total loans |
3,540,517 | 155,766 | 4.40 | 4,144,880 | 185,157 | 4.47 | ||||||||||||||||||
| Investments |
721,732 | 20,259 | 2.81 | 721,713 | 37,890 | 5.25 | ||||||||||||||||||
| Total interest earning assets |
4,262,249 | 176,025 | 4.13 | % | 4,866,593 | 223,047 | 4.58 | % | ||||||||||||||||
| Goodwill and core deposit intangibles |
15,185 | 18,681 | ||||||||||||||||||||||
| Other non-interest earning assets |
281,151 | 300,839 | ||||||||||||||||||||||
| Total Assets |
$ | 4,558,585 | $ | 5,186,113 | ||||||||||||||||||||
| Deposits: |
||||||||||||||||||||||||
| Savings |
$ | 441,286 | 1,112 | 0.25 | % | $ | 436,169 | 1,612 | 0.37 | % | ||||||||||||||
| NOW |
1,488,363 | 7,013 | 0.47 | 1,189,903 | 7,248 | 0.61 | ||||||||||||||||||
| Money market |
389,760 | 2,275 | 0.58 | 399,437 | 2,713 | 0.68 | ||||||||||||||||||
| Certificates of deposit |
758,000 | 12,111 | 1.60 | 1,192,012 | 30,311 | 2.54 | ||||||||||||||||||
| Total deposits |
3,077,409 | 22,511 | 0.73 | 3,217,521 | 41,884 | 1.30 | ||||||||||||||||||
| Short-term borrowed funds |
35,056 | 46 | 0.13 | 108,248 | 237 | 0.22 | ||||||||||||||||||
| Advances from FHLB |
107,455 | 1,209 | 1.13 | 553,146 | 16,522 | 2.99 | ||||||||||||||||||
| Long-term debt |
22,125 | 924 | 4.18 | 22,757 | 1,080 | 4.75 | ||||||||||||||||||
| Total interest bearing liabilities |
3,242,045 | 24,690 | 0.76 | 3,901,672 | 59,723 | 1.53 | ||||||||||||||||||
| Demand deposits |
903,122 | 809,900 | ||||||||||||||||||||||
| Non-interest bearing other liabilities |
55,221 | 62,343 | ||||||||||||||||||||||
| Total Liabilities |
4,200,388 | 4,773,915 | ||||||||||||||||||||||
| Stockholder’s equity |
358,197 | 412,198 | ||||||||||||||||||||||
| Total liabilities and stockholder’s equity |
$ | 4,558,585 | $ | 5,186,113 | ||||||||||||||||||||
| Net interest income/net interest spread |
151,335 | 3.37 | % | 163,324 | 3.05 | % | ||||||||||||||||||
| Margin |
||||||||||||||||||||||||
| Interest income/interest earning assets |
4.13 | % | 4.58 | % | ||||||||||||||||||||
| Interest expense/interest earning assets |
0.58 | 1.23 | ||||||||||||||||||||||
| Net interest margin |
3.55 | % | 3.35 | % | ||||||||||||||||||||
24
BankAtlantic (Bank Operations Business Segment)
Allowance for Loan Loss and Credit Quality
| (in thousands) | For the Three Months Ended | For the Years Ended |
||||||||||||||||||||||||||
| 12/31/2010 | 9/30/2010 | 6/30/2010 | 3/31/2010 | 12/31/2009 | 12/31/2010 | 12/31/2009 | ||||||||||||||||||||||
| Allowance for Loan Losses |
||||||||||||||||||||||||||||
| Beginning balance |
$ | 181,760 | 180,635 | 169,548 | 173,588 | 165,975 | 173,588 | 125,572 | ||||||||||||||||||||
| Charge-offs: |
||||||||||||||||||||||||||||
| Residential real estate |
(4,272 | ) | (4,619 | ) | (5,233 | ) | (4,181 | ) | (7,579 | ) | (18,305 | ) | (23,264 | ) | ||||||||||||||
| Commercial real estate |
(44,979 | ) | (5,969 | ) | (14,146 | ) | (21,332 | ) | (58,664 | ) | (86,426 | ) | (96,300 | ) | ||||||||||||||
| Commercial business |
(996 | ) | — | — | — | — | (996 | ) | (516 | ) | ||||||||||||||||||
| Consumer |
(7,009 | ) | (9,881 | ) | (11,822 | ) | (10,771 | ) | (8,307 | ) | (39,483 | ) | (40,236 | ) | ||||||||||||||
| Small business |
(2,409 | ) | (2,402 | ) | (2,225 | ) | (837 | ) | (1,738 | ) | (7,873 | ) | (9,105 | ) | ||||||||||||||
| Total charge-offs |
(59,665 | ) | (22,871 | ) | (33,426 | ) | (37,121 | ) | (76,288 | ) | (153,083 | ) | (169,421 | ) | ||||||||||||||
| Recoveries: |
||||||||||||||||||||||||||||
| Residential real estate |
284 | 383 | 435 | 64 | 96 | 1,166 | 912 | |||||||||||||||||||||
| Commercial real estate |
1,210 | — | 65 | 62 | 422 | 1,337 | 700 | |||||||||||||||||||||
| Commercial business |
57 | — | 1 | 658 | 494 | 716 | 500 | |||||||||||||||||||||
| Consumer |
300 | 294 | 254 | 194 | 205 | 1,042 | 587 | |||||||||||||||||||||
| Small business |
126 | 307 | 124 | 69 | 161 | 626 | 494 | |||||||||||||||||||||
| Total recoveries |
1,977 | 984 | 879 | 1,047 | 1,378 | 4,887 | 3,193 | |||||||||||||||||||||
| Net charge-offs |
(57,688 | ) | (21,887 | ) | (32,547 | ) | (36,074 | ) | (74,910 | ) | (148,196 | ) | (166,228 | ) | ||||||||||||||
| Transfer to held for sale |
(2,907 | ) | — | — | — | — | (2,907 | ) | — | |||||||||||||||||||
| Provision for loan losses |
40,144 | 23,012 | 43,634 | 32,034 | 82,523 | 138,824 | 214,244 | |||||||||||||||||||||
| Ending balance |
$ | 161,309 | 181,760 | 180,635 | 169,548 | 173,588 | 161,309 | 173,588 | ||||||||||||||||||||
| As of | ||||||||||||||||||||
| 12/31/2010 | 9/30/2010 | 6/30/2010 | 3/31/2010 | 12/31/2009 | ||||||||||||||||
| Credit Quality |
||||||||||||||||||||
| Nonaccrual loans |
||||||||||||||||||||
| Commercial real estate |
$ | 243,299 | 275,057 | 230,007 | 168,937 | 167,867 | ||||||||||||||
| Consumer |
14,120 | 13,282 | 13,818 | 14,428 | 14,451 | |||||||||||||||
| Small business |
10,879 | 10,995 | 12,248 | 10,971 | 9,338 | |||||||||||||||
| Residential real estate |
86,538 | 87,563 | 83,894 | 88,262 | 76,401 | |||||||||||||||
| Commercial business |
16,123 | 17,190 | 22,159 | 18,767 | 18,063 | |||||||||||||||
| Total Nonaccrual loans |
370,959 | 404,087 | 362,126 | 301,365 | 286,120 | |||||||||||||||
| Nonaccrual tax certificates |
3,636 | 2,761 | 2,836 | 1,495 | 2,161 | |||||||||||||||
| Real estate owned |
64,328 | 58,017 | 45,492 | 40,833 | 35,935 | |||||||||||||||
| Other repossessed assets |
— | — | 88 | — | 10 | |||||||||||||||
| Total nonperforming assets |
$ | 438,923 | 464,865 | 410,542 | 343,693 | 324,226 | ||||||||||||||
| Allowance for loan losses to total loans |
% | 5.08 | 5.34 | 5.08 | 4.64 | 4.53 | ||||||||||||||
| Allowance to nonaccrual loans |
% | 43.48 | 44.98 | 49.88 | 56.26 | 60.67 | ||||||||||||||
| Provision to average loans |
% | 4.81 | 2.64 | 4.86 | 3.42 | 8.39 | ||||||||||||||
| Annualized net charge-offs to average loans |
% | 6.91 | 2.51 | 3.62 | 3.85 | 7.61 | ||||||||||||||
| Nonperforming loans to total assets |
% | 8.30 | 9.01 | 7.85 | 6.43 | 6.02 | ||||||||||||||
| Nonperforming assets to total assets |
% | 9.82 | 10.36 | 8.90 | 7.33 | 6.82 | ||||||||||||||
25
BankAtlantic (Bank Operations Business Segment)
Delinquencies, Excluding Non-Accrual Loans, at Period-End
| ($ in thousands) | 12/31/2010 | 9/30/2010 | 6/30/2010 | 3/31/2010 | 12/31/2009 | |||||||||||||||
| Commercial real estate |
$ | 31 | 14,317 | 7,537 | 40,642 | 25,489 | ||||||||||||||
| Consumer |
12,405 | 12,004 | 13,181 | 14,858 | 15,173 | |||||||||||||||
| Small business |
2,712 | 2,927 | 4,182 | 3,891 | 2,714 | |||||||||||||||
| Residential real estate |
23,053 | 17,946 | 18,472 | 26,893 | 26,710 | |||||||||||||||
| Commercial business |
— | — | — | 1,129 | 2,820 | |||||||||||||||
| Total BankAtlantic |
$ | 38,201 | 47,194 | 43,372 | 87,413 | 72,906 | ||||||||||||||
| 12/31/2010 | 9/30/2010 | 6/30/2010 | 3/31/2010 | 12/31/2009 | ||||||||||||||||
| Commercial real estate |
% | 0.00 | * | 1.43 | * | 0.72 | * | 3.85 | * | 2.28 | * | |||||||||
| Consumer |
% | 2.01 | 1.90 | 2.04 | 2.23 | 2.23 | ||||||||||||||
| Small business |
% | 0.89 | 0.96 | 1.35 | 1.26 | 0.87 | ||||||||||||||
| Residential real estate |
% | 1.88 | ** | 1.37 | ** | 1.32 | ** | 1.83 | ** | 1.72 | ** | |||||||||
| Commercial business |
% | — | — | — | 0.84 | 1.80 | ||||||||||||||
| Total BankAtlantic |
% | 1.20 | 1.39 | 1.23 | 2.40 | 1.91 | ||||||||||||||
| * | Excludes $0, $12.0 million, $1.2 million, $0 and $8.7 million of Commercial Real Estate loans at December 31, September 30, June 30, 2010, March 31, 2010 and December 31,2009, respectively, which had matured and had been approved for renewal or forbearance but were not fully documented at period end. Including these loans, Commercial Real Estate delinquencies were 2.63%, .83%, and 3.07% and total BankAtlantic delinquencies would have been 1.75%, 1.26% and 2.14% at September 30, 2010, June 30, 2010 and December 31, 2009, respectively. |
| ** | Includes $1.1 billion, $1.2 billion, $1.3 billion, $1.4 billion and $1.5 billion of purchased residential loans with delinquencies excluding non-accrual loans of 1.77%, 1.19%, 1.09%, 1.63% and 1.59% as of December 31, 2010, September 30, 2010, June 30, 2010, March 31, 2010 and December 31, 2009, respectively. |
BankAtlantic (Bank Operations Business Segment)
Loan Provision & Allowance for Loan Losses
| ($ in thousands) | 4Q 2010 Loan Provision |
Allowance for Loan Losses |
% of Reserves to Total Loans |
|||||||||
| Commercial real estate |
$ | 26,468 | 83,030 | 9.22 | % | |||||||
| Consumer |
324 | 32,043 | 5.20 | |||||||||
| Small business |
2,875 | 11,513 | 3.78 | |||||||||
| Residential real estate |
5,955 | 23,937 | 1.96 | |||||||||
| Commercial business |
1,615 | 10,786 | 8.18 | |||||||||
| Total BankAtlantic |
$ | 37,237 | 161,309 | 5.08 | % | |||||||
26
BankAtlantic (Bank Operations Business Segment)
Reconciliation of GAAP Financial Measures to Non-GAAP Measures
Management uses non-GAAP financial measures to supplement its GAAP financial information and to provide additional useful measures in the evaluation of BankAtlantic’s operating results and any related trends that may be affecting BankAtlantic’s business. Management uses pre-tax core operating earnings to measure BankAtlantic’s ongoing financial performance excluding items that are not currently controllable by management. Management uses core expenses to measure expense reduction trends excluding items that are not currently controllable by management. The core operating efficiency ratio is used by management to measure the costs expended to generate a dollar of revenues excluding items that are not currently controllable by management. The return on average tangible equity and average tangible assets is used by management to measure BankAtlantic’s effectiveness in its use of capital and assets, respectively, and to allow for comparison to other companies in the industry. The tangible equity to tangible asset ratio is used by management to evaluate capital adequacy trends and to allow for comparison to other companies in the industry. Management uses the core deposit measure to assess trends relating to its lower cost deposit categories, which management believes may generally be more indicative of relationship deposits. These disclosures should not be viewed as a substitute for operating results determined in accordance with GAAP, nor are they necessarily comparable to non-GAAP performance measures that may be presented by other companies.
Reconciliation of loss from bank operations business segment before income taxes to pre-tax core operating earnings
| For the Three Months Ended | For the Years Ended |
|||||||||||||||||||||||||||
| (in thousands) | 12/31/2010 | 9/30/2010 | 6/30/2010 | 3/31/2009 | 12/31/2009 | 12/31/2010 | 12/31/2009 | |||||||||||||||||||||
| Loss from bank operations business segment before income taxes |
$ | (43,504 | ) | (17,632 | ) | (39,870 | ) | (17,039 | ) | (80,359 | ) | (118,045 | ) | (180,427 | ) | |||||||||||||
| Costs associated with debt redemption |
— | — | 53 | 7 | — | 60 | 7,463 | |||||||||||||||||||||
| Provision for tax certificates |
800 | 885 | 2,134 | 733 | 686 | 4,552 | 3,388 | |||||||||||||||||||||
| Loss (gain) on sale of real estate |
663 | (442 | ) | 880 | (104 | ) | (122 | ) | 997 | (342 | ) | |||||||||||||||||
| Impairment, restructuring and exit activities |
10,219 | 8,099 | 2,247 | 143 | 7,700 | 20,708 | 22,457 | |||||||||||||||||||||
| FDIC special assessment |
— | — | — | — | — | — | 2,428 | |||||||||||||||||||||
| Provision for loan losses |
40,145 | 23,012 | 43,634 | 32,034 | 82,523 | 138,825 | 214,244 | |||||||||||||||||||||
| Non-GAAP pre-tax core operating earnings |
$ | 8,323 | 13,922 | 9,078 | 15,774 | 10,428 | 47,097 | 69,211 | ||||||||||||||||||||
Reconciliation of non-interest expense to core expenses and calculation of core operating efficiency ratio
| For the Three Months Ended | For the Years Ended |
|||||||||||||||||||||||||||
| ($ in thousands) | 12/31/2010 | 9/30/2010 | 6/30/2010 | 3/31/2009 | 12/31/2009 | 12/31/2010 | 12/31/2009 | |||||||||||||||||||||
| Non-interest expense |
$ | 63,324 | 60,756 | 59,515 | 52,721 | 65,987 | 236,316 | 258,799 | ||||||||||||||||||||
| Costs associated with debt redemption |
— | — | (53 | ) | (7 | ) | — | (60 | ) | (7,463 | ) | |||||||||||||||||
| Provision for tax certificates |
(800 | ) | (885 | ) | (2,134 | ) | (733 | ) | (686 | ) | (4,552 | ) | (3,388 | ) | ||||||||||||||
| Gain (loss) on sale of real estate |
(663 | ) | 442 | (880 | ) | 104 | 122 | (997 | ) | 342 | ||||||||||||||||||
| Impairment, restructuring and exit activities |
(10,219 | ) | (8,099 | ) | (2,247 | ) | (143 | ) | (7,700 | ) | (20,708 | ) | (22,457 | ) | ||||||||||||||
| FDIC special assessment |
— | — | — | — | — | — | (2,428 | ) | ||||||||||||||||||||
| Core expenses |
$ | 51,642 | 52,214 | 54,201 | 51,942 | 57,723 | 209,999 | 223,405 | ||||||||||||||||||||
| Net interest income |
35,766 | 39,101 | 37,008 | 39,459 | 39,992 | 151,334 | 163,324 | |||||||||||||||||||||
| Non-interest income |
24,199 | 27,035 | 26,271 | 28,257 | 28,159 | 105,762 | 129,292 | |||||||||||||||||||||
| Total revenues |
$ | 59,965 | 66,136 | 63,279 | 67,716 | 68,151 | 257,096 | 292,616 | ||||||||||||||||||||
| Non-GAAP core operating efficiency ratio |
86.12 | % | 78.95 | % | 85.65 | % | 76.71 | % | 84.70 | % | 81.68 | % | 76.35 | % | ||||||||||||||
Reconciliation of return on average assets and average equity to return on average tangible assets and average tangible equity
| For the Three Months Ended | For the Years Ended |
|||||||||||||||||||||||||||
| ($ in thousands) | 12/31/2010 | 9/30/2010 | 6/30/2010 | 3/31/2009 | 12/31/2009 | 12/31/2010 | 12/31/2009 | |||||||||||||||||||||
| Net loss from bank operations business segment |
$ | (43,504 | ) | (17,669 | ) | (39,870 | ) | (17,129 | ) | (48,637 | ) | (118,172 | ) | (148,708 | ) | |||||||||||||
| Average total assets |
4,488,677 | 4,504,217 | 4,559,964 | 4,684,506 | 4,835,545 | 4,558,585 | 5,186,113 | |||||||||||||||||||||
| Average goodwill and core deposit intangibles |
(14,718 | ) | (15,028 | ) | (15,353 | ) | (15,652 | ) | (15,973 | ) | (15,185 | ) | (18,681 | ) | ||||||||||||||
| Average tangible assets |
4,473,959 | 4,489,189 | 4,544,611 | 4,668,854 | 4,819,572 | 4,543,400 | 5,167,432 | |||||||||||||||||||||
| Average equity |
331,957 | 351,241 | 368,472 | 382,027 | 436,322 | 358,197 | 412,198 | |||||||||||||||||||||
| Average goodwill and core deposit intangibles |
(14,718 | ) | (15,028 | ) | (15,353 | ) | (15,652 | ) | (15,973 | ) | (15,185 | ) | (18,681 | ) | ||||||||||||||
| Other comprehensive loss |
2,743 | 2,499 | 3,453 | 845 | 4,995 | 2,391 | 5,090 | |||||||||||||||||||||
| Average tangible equity |
$ | 319,982 | 338,712 | 356,572 | 367,220 | 425,344 | 345,403 | 398,607 | ||||||||||||||||||||
| Return on average assets from continuing operations |
-3.88 | % | -1.57 | % | -3.50 | % | -1.46 | % | -4.02 | % | -2.59 | % | -2.87 | % | ||||||||||||||
| Return on average tangible assets from continuing operations - Non-GAAP |
-3.89 | % | -1.57 | % | -3.51 | % | -1.47 | % | -4.04 | % | -2.60 | % | -2.88 | % | ||||||||||||||
| Return on average equity from continuing operations |
-52.42 | % | -20.12 | % | -43.28 | % | -17.93 | % | -44.59 | % | -32.99 | % | -36.08 | % | ||||||||||||||
| Return on average tangible equity from continuing operations - Non-GAAP |
-54.38 | % | -20.87 | % | -44.73 | % | -18.66 | % | -45.74 | % | -34.21 | % | -37.31 | % | ||||||||||||||
Reconciliation of equity to total tangible capital; Total assets to total tangible assets; The calculation of tangible capital to tangible assets
| As of | ||||||||||||||||||||
| ($ in thousands) | 12/31/2010 | 9/30/2010 | 6/30/2010 | 3/31/2009 | 12/31/2009 | |||||||||||||||
| Equity |
$ | 287,106 | 331,617 | 350,435 | 368,182 | 378,901 | ||||||||||||||
| Goodwill and core deposit intangibles |
(14,569 | ) | (14,877 | ) | (15,186 | ) | (15,494 | ) | (15,817 | ) | ||||||||||
| Total tangible capital |
272,537 | 316,740 | 335,249 | 352,688 | 363,084 | |||||||||||||||
| Total assets |
4,469,168 | 4,485,476 | 4,611,282 | 4,688,001 | 4,755,122 | |||||||||||||||
| Goodwill and core deposit intangibles |
(14,569 | ) | (14,877 | ) | (15,186 | ) | (15,494 | ) | (15,817 | ) | ||||||||||
| Total tangible assets |
$ | 4,454,599 | $ | 4,470,599 | $ | 4,596,096 | $ | 4,672,507 | $ | 4,739,305 | ||||||||||
| Non-GAAP tangible capital to tangible assets |
6.12 | % | 7.08 | % | 7.29 | % | 7.55 | % | 7.66 | % | ||||||||||
Reconciliation of total deposits to core deposits
| As of | ||||||||||||||||||||
| (in thousands) | 12/31/2010 | 9/30/2010 | 6/30/2010 | 3/31/2009 | 12/31/2009 | |||||||||||||||
| Total deposits |
$ | 3,893,014 | 3,837,641 | 3,988,258 | 4,047,440 | 3,969,680 | ||||||||||||||
| Non-core deposits held for sale |
(75,010 | ) | (78,088 | ) | — | — | — | |||||||||||||
| Money market |
(354,282 | ) | (386,091 | ) | (397,313 | ) | (361,877 | ) | (360,043 | ) | ||||||||||
| Certificates of deposit |
(616,454 | ) | (601,956 | ) | (749,948 | ) | (840,017 | ) | (960,559 | ) | ||||||||||
| Core deposits |
2,847,268 | 2,771,506 | 2,840,997 | 2,845,546 | 2,649,078 | |||||||||||||||
27
Parent Company Business Segment
Condensed Statements of Operations (unaudited)
| For the Three Months Ended | For the Years Ended |
|||||||||||||||||||||||||||
| (in thousands) | 12/31/2010 | 9/30/2010 | 6/30/2010 | 3/31/2010 | 12/31/2009 | 12/31/2010 | 12/31/2009 | |||||||||||||||||||||
| Net interest expense |
$ | (3,716 | ) | (3,792 | ) | (3,579 | ) | (3,485 | ) | (3,501 | ) | (14,572 | ) | (14,962 | ) | |||||||||||||
| Provision (recovery) for loan losses |
498 | 1,398 | 4,919 | (1,279 | ) | (1,222 | ) | 5,536 | 18,414 | |||||||||||||||||||
| Net interest income after provision for loan losses |
(4,214 | ) | (5,190 | ) | (8,498 | ) | (2,206 | ) | (2,279 | ) | (20,108 | ) | (33,376 | ) | ||||||||||||||
| Non-interest income |
||||||||||||||||||||||||||||
| Income from unconsolidated subsidiaries |
335 | 293 | 237 | 189 | 145 | 1,054 | 487 | |||||||||||||||||||||
| Securities activities, net |
— | (9 | ) | 3 | 6 | 1,274 | — | 19 | ||||||||||||||||||||
| Other |
431 | 292 | 271 | 263 | 294 | 1,257 | 1,058 | |||||||||||||||||||||
| Non-interest income |
766 | 576 | 511 | 458 | 1,713 | 2,311 | 1,564 | |||||||||||||||||||||
| Non-interest expense |
||||||||||||||||||||||||||||
| Employee compensation and benefits |
(160 | ) | 1,074 | 901 | 1,004 | 2,399 | 2,819 | 5,036 | ||||||||||||||||||||
| Advertising and business promotion |
56 | 109 | 118 | 10 | 31 | 293 | 251 | |||||||||||||||||||||
| Professional fees |
881 | 1,267 | 604 | 322 | 596 | 3,074 | 2,055 | |||||||||||||||||||||
| Loss on sale of real estate |
— | — | 610 | — | — | 610 | — | |||||||||||||||||||||
| Impairment of real estate owned |
— | 66 | 700 | — | — | 766 | — | |||||||||||||||||||||
| Other |
328 | 385 | 460 | 308 | 235 | 1,481 | 1,658 | |||||||||||||||||||||
| Non-interest expense |
1,105 | 2,901 | 3,393 | 1,644 | 3,261 | 9,043 | 9,000 | |||||||||||||||||||||
| Loss from parent company activities before income taxes |
(4,553 | ) | (7,515 | ) | (11,380 | ) | (3,392 | ) | (3,827 | ) | (26,840 | ) | (40,812 | ) | ||||||||||||||
| Provision (benefit) for income taxes |
— | — | — | — | — | — | — | |||||||||||||||||||||
| Net loss from parent company business segment |
$ | (4,553 | ) | (7,515 | ) | (11,380 | ) | (3,392 | ) | (3,827 | ) | (26,840 | ) | (40,812 | ) | |||||||||||||
Parent Company Business Segment
Condensed Statements of Financial Condition - Unaudited
| As of | ||||||||||||||||||||
| (in thousands) | 12/31/2010 | 9/30/2010 | 6/30/2010 | 3/31/2010 | 12/31/2009 | |||||||||||||||
| ASSETS |
||||||||||||||||||||
| Cash |
$ | 12,226 | 12,240 | 8,395 | 5,135 | 14,002 | ||||||||||||||
| Securities |
1,507 | 1,508 | 1,508 | 1,506 | 1,505 | |||||||||||||||
| Investment in subsidiaries |
313,319 | 359,368 | 379,776 | 413,759 | 423,529 | |||||||||||||||
| Investment in unconsolidated subsidiaries |
10,361 | 10,027 | 9,733 | 9,496 | 9,307 | |||||||||||||||
| Other assets |
945 | 1,635 | 2,430 | 2,329 | 4,017 | |||||||||||||||
| Total assets |
$ | 338,358 | 384,778 | 401,842 | 432,225 | 452,360 | ||||||||||||||
| LIABILITIES AND STOCKHOLDERS’ EQUITY |
||||||||||||||||||||
| Subordinated debentures and notes payable |
$ | 322,385 | 318,802 | 315,160 | 311,707 | 308,334 | ||||||||||||||
| Other liabilities |
1,687 | 2,314 | 9,632 | 1,288 | 2,455 | |||||||||||||||
| Total liabilities |
324,072 | 321,116 | 324,792 | 312,995 | 310,789 | |||||||||||||||
| Stockholders’ equity |
14,286 | 63,662 | 77,050 | 119,230 | 141,571 | |||||||||||||||
| Total liabilities and stockholders’ equity |
$ | 338,358 | 384,778 | 401,842 | 432,225 | 452,360 | ||||||||||||||
Parent Company Business Segment
Allowance for Loan Loss and Credit Quality
Parent Company and Work-out Subsidiary
| (in thousands) |
For the Three Months Ended | For the Years Ended |
||||||||||||||||||||||||||
| 12/31/2010 | 9/30/2010 | 6/30/2010 | 3/31/2010 | 12/31/2009 | 12/31/2010 | 12/31/2009 | ||||||||||||||||||||||
| Allowance for Loan Losses |
||||||||||||||||||||||||||||
| Beginning balance |
$ | 4,187 | 7,227 | 8,049 | 13,630 | 18,688 | 13,630 | 11,685 | ||||||||||||||||||||
| Net charge-offs |
(3,741 | ) | (4,438 | ) | (5,741 | ) | (4,302 | ) | (3,836 | ) | (18,222 | ) | (16,469 | ) | ||||||||||||||
| Transfer to held for sale |
(114 | ) | — | — | — | — | (114 | ) | — | |||||||||||||||||||
| Provision (recovery) for loan losses |
498 | 1,398 | 4,919 | (1,279 | ) | (1,222 | ) | 5,536 | 18,414 | |||||||||||||||||||
| Ending balance |
$ | 830 | 4,187 | 7,227 | 8,049 | 13,630 | 830 | 13,630 | ||||||||||||||||||||
| As of | ||||||||||||||||||||
| 12/31/2010 | 9/30/2010 | 6/30/2010 | 3/31/2010 | 12/31/2009 | ||||||||||||||||
| Credit Quality |
||||||||||||||||||||
| Total Loans - gross |
$ | 17,300 | 22,793 | 27,319 | 38,363 | 48,012 | ||||||||||||||
| Nonaccrual loans |
$ | 14,508 | 19,916 | 24,358 | 35,326 | 44,897 | ||||||||||||||
| Specific reserves |
(830 | ) | (4,187 | ) | (7,227 | ) | (8,049 | ) | (13,630 | ) | ||||||||||
| Nonaccrual loans, net |
$ | 13,678 | 15,729 | 17,131 | 27,277 | 31,267 | ||||||||||||||
| Real estate owned |
10,160 | 9,766 | 9,832 | 10,532 | 10,532 | |||||||||||||||
| Total nonperforming assets |
$ | 23,838 | 25,495 | 26,963 | 37,809 | 41,799 | ||||||||||||||
28

BankAtlantic (Bank Operations Business Segment)
Supplemental Graphs
Fourth Quarter and Full Year 2010
Release Date: February 11, 2011
This information is preliminary, unaudited and based on data available at the time of the release.
BANKATLANTIC (BANK ONLY)
SUPPLEMENTAL GRAPHS
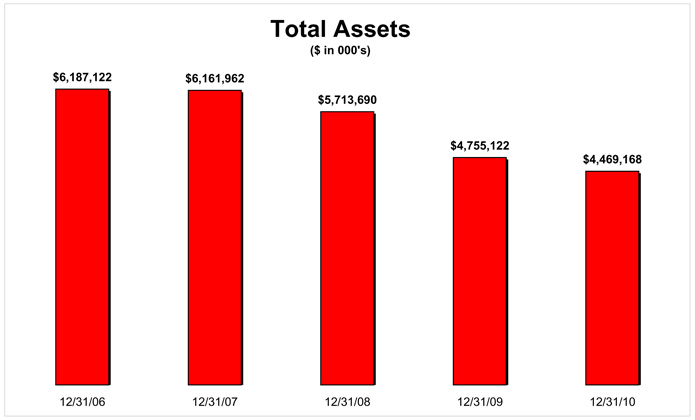
1
BANKATLANTIC (BANK ONLY)
SUPPLEMENTAL GRAPHS
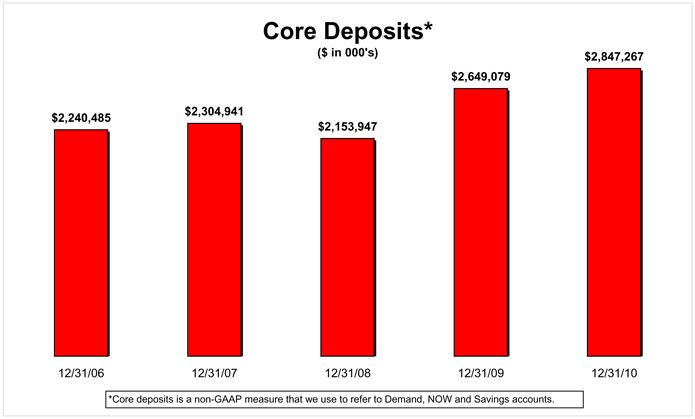
2
BANKATLANTIC (BANK ONLY)
SUPPLEMENTAL GRAPHS
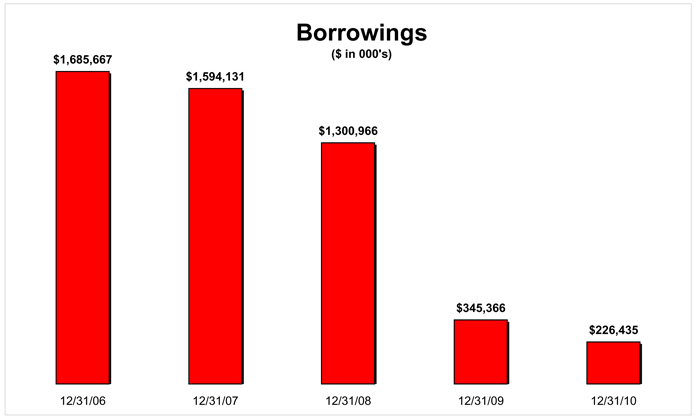
3
BANKATLANTIC (BANK ONLY)
SUPPLEMENTAL GRAPHS
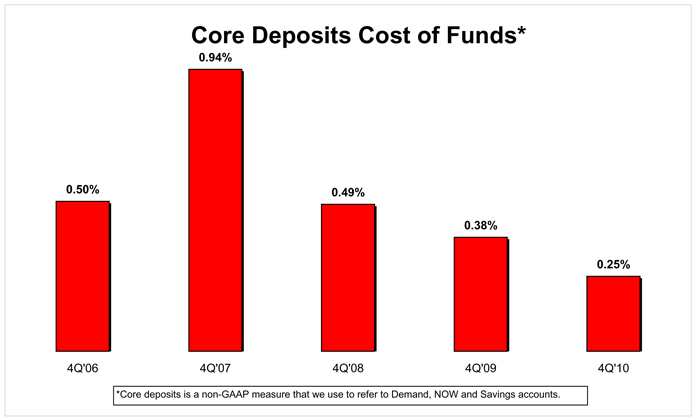
4
BANKATLANTIC (BANK ONLY)
SUPPLEMENTAL GRAPHS
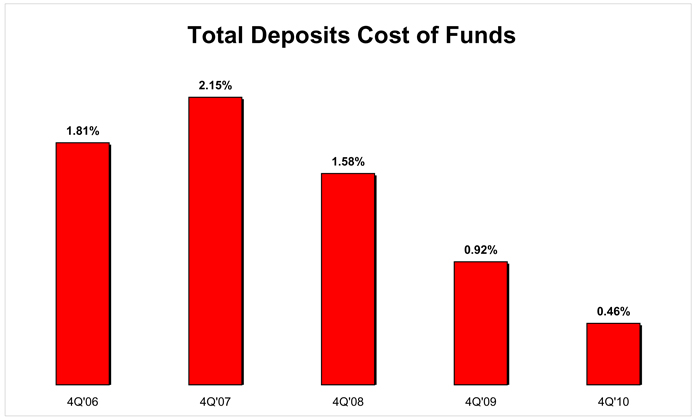
5
BANKATLANTIC (BANK ONLY)
SUPPLEMENTAL GRAPHS
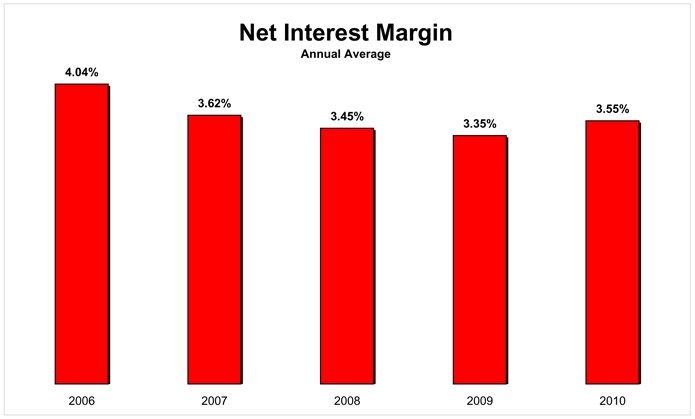
6
BANKATLANTIC (BANK ONLY)
SUPPLEMENTAL GRAPHS
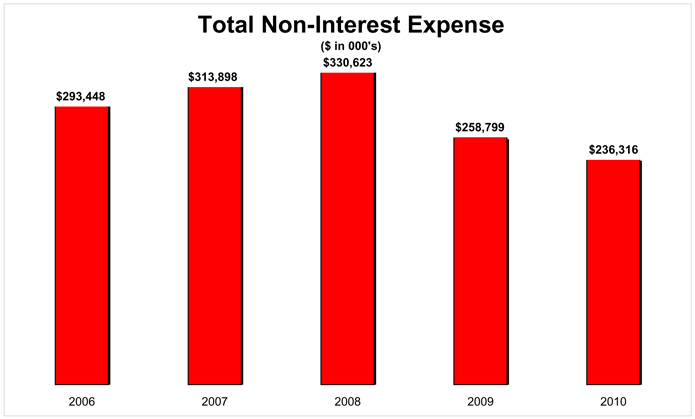
7
BANKATLANTIC (BANK ONLY)
SUPPLEMENTAL GRAPHS
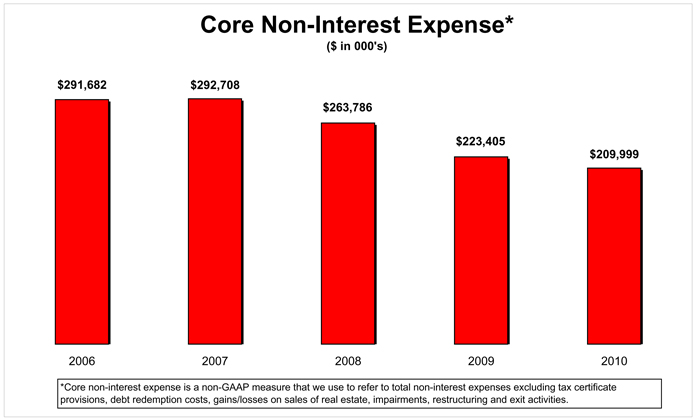
8
BANKATLANTIC (BANK ONLY)
SUPPLEMENTAL GRAPHS
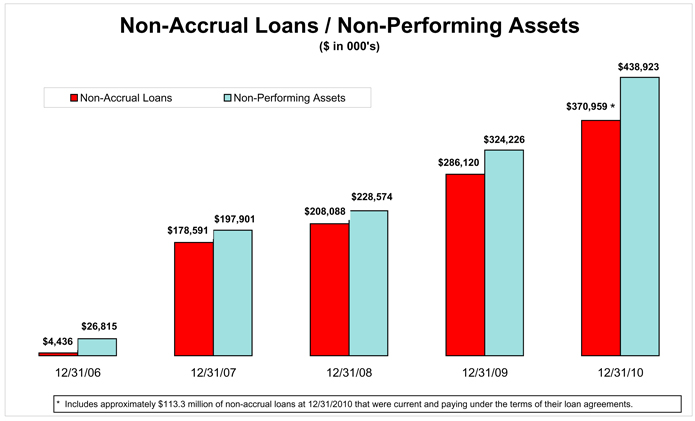
9
BANKATLANTIC (BANK ONLY)
SUPPLEMENTAL GRAPHS
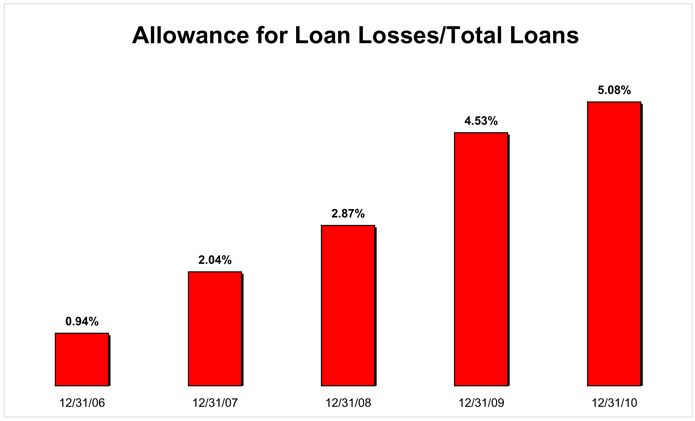
10
BANKATLANTIC (BANK ONLY)
SUPPLEMENTAL GRAPHS
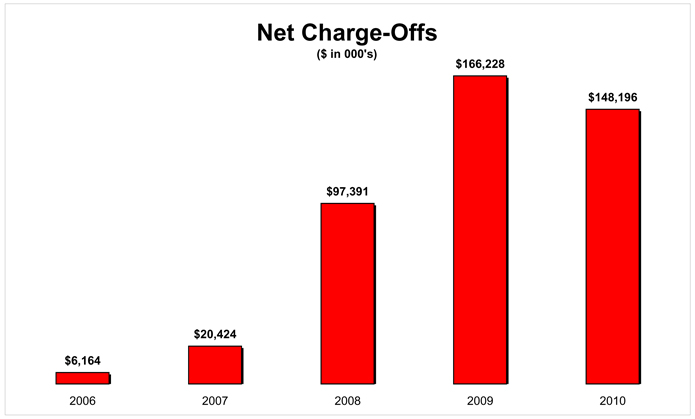
11
BANKATLANTIC (BANK ONLY)
SUPPLEMENTAL GRAPHS
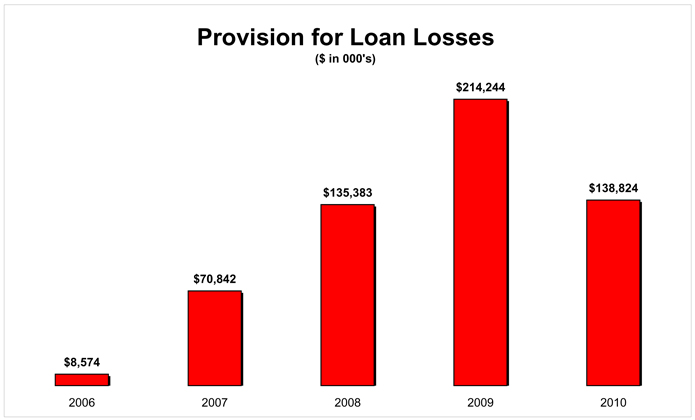
12
BANKATLANTIC (BANK ONLY)
SUPPLEMENTAL GRAPHS
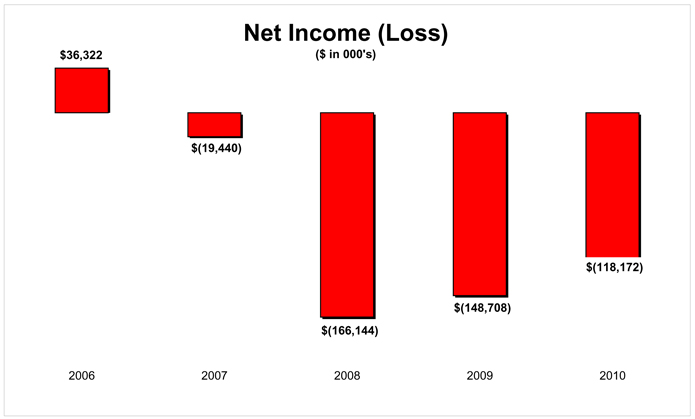
13
BANKATLANTIC (BANK ONLY)
SUPPLEMENTAL GRAPHS
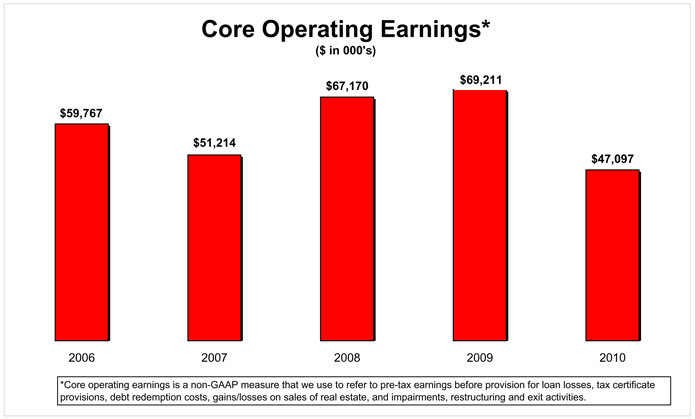
14
BANKATLANTIC (BANK ONLY)
SUPPLEMENTAL GRAPHS
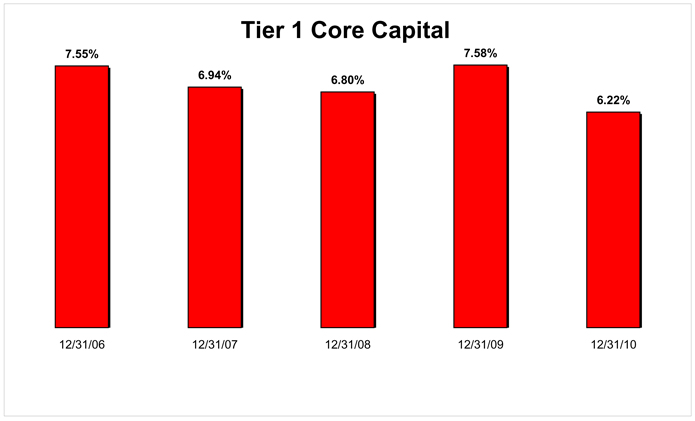
15
BANKATLANTIC (BANK ONLY)
SUPPLEMENTAL GRAPHS
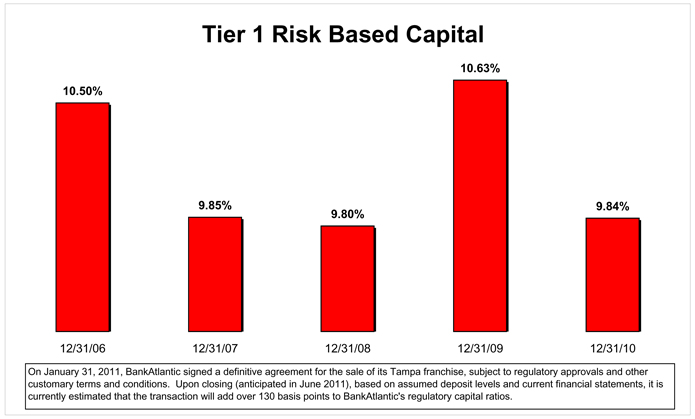
16
BANKATLANTIC (BANK ONLY)
SUPPLEMENTAL GRAPHS
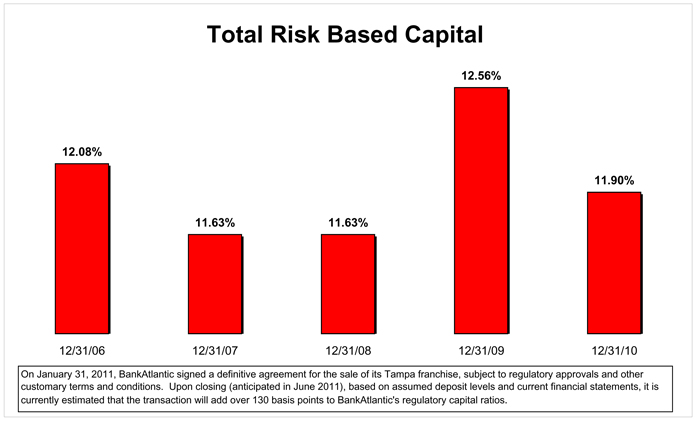
17