Attached files
| file | filename |
|---|---|
| 8-K - FORM 8-K - STATE STREET CORP | d8k.htm |
 Investor & Analyst Forum
10 February 2011
Exhibit 99.1 |
 Extending Our Leadership
AGENDA
Joseph L. Hooley
Chairman, President and
Chief Executive Officer
Scott F. Powers
Chief Executive Officer
State Street Global Advisors
James S. Phalen
Executive Vice President
Operations & Technology
Edward J. Resch
Executive Vice President and
Chief Financial Officer |
 3
Reminder
This presentation contains “forward-looking statements” within the meaning of U.S.
securities laws, including statements about industry trends, management’s expectations about our
financial performance, market growth, acquisitions and divestitures, new technologies, services and
opportunities and earnings, management’s confidence in our strategies and other matters
that do not relate strictly to historical facts. Forward-looking statements are often identified by such forward-looking terminology as “expect,” “look,” “believe,” “anticipate,”
“estimate,” “seek,” “may,” “will,” “trend,”
“target” and “goal,” or similar statements or variations of such terms. Forward-looking statements are subject to various risks and uncertainties,
which change over time, are based on management’s expectations and assumptions at the time the
statements are made, and are not guarantees of future results. Management’s expectations
and assumptions, and the continued validity of the forward-looking statements, are subject to change due to a broad range of factors affecting the national and global
economies, the equity, debt, currency and other financial markets, as well as factors specific to
State Street and its subsidiaries, including State Street Bank. Therefore, actual
outcomes and results may differ materially from what is expressed in those statements, and those
statements should not be relied upon as representing our expectations or beliefs as of any date
subsequent to February 10, 2011. Factors that could cause changes in the expectations or assumptions on which forward-looking
statements are based include, but are not limited to: the manner in which the Federal Reserve
implements the Dodd-Frank Act, including any changes to our minimum regulatory capital ratios; changes to our business model, or how we provide services, required by our
compliance with the Dodd-Frank Act, and similar non-U.S. rules and regulations; required
regulatory capital ratios under Basel II and Basel III, in each case as fully implemented by
State Street and State Street Bank (and in the case of Basel III, when finally adopted by the Federal
Reserve), which may result in the need for substantial additional capital or increased levels
of liquidity in the future; changes in law or regulation that may adversely affect our, our clients’ or our counterparties’ business activities and the products or services
that we sell, including additional or increased taxes or assessments thereon, capital adequacy
requirements and changes that expose us to risks related to compliance; financial market
disruptions and the economic recession, whether in the U.S. or internationally; the liquidity of the U.S. and international securities markets, particularly the markets for fixed
income securities, and the liquidity requirements of our clients; increases in the volatility of, or
declines in the levels of, our net interest revenue, changes in the composition of the assets
on our consolidated balance sheet and the possibility that we may be required to change the manner in which we fund those assets; the financial strength and continuing
viability of the counterparties with which we or our clients do business and to which we have
investment, credit or financial exposure; the credit quality, credit agency ratings, and fair
values of the securities in our investment securities portfolio, a deterioration or downgrade of which
could lead to other-than-temporary impairment of the respective securities and the
recognition of an impairment loss in our consolidated statement of income; delays or difficulties in
the execution of our previously announced global multi-year program designed to enhance our
operating model, which could lead to changes in our estimates of the charges, expenses or savings associated with the planned program, resulting in increased volatility
of our earnings; the maintenance of credit agency ratings for our debt and depository obligations as
well as the level of credibility of credit agency ratings; the risks that acquired businesses
will not be integrated successfully, or that the integration will take longer than anticipated, that expected synergies will not be achieved or unexpected disynergies will be
experienced, that client and deposit retention goals will not be met, that other regulatory or
operational challenges will be experienced and that disruptions from the transaction will harm
relationships with clients, employees or regulators; the ability to complete acquisitions, divestitures and joint ventures, including the ability to obtain regulatory approvals, the
ability to arrange financing as required and the ability to satisfy closing conditions; the
performance of and demand for the products and services we offer, including the level and timing
of redemptions and withdrawals from our collateral pools and other collective investment products; the
possibility of our clients incurring substantial losses in investment pools where we act as
agent, and the possibility of significant reductions in the valuation of assets; our ability to attract deposits and other low-cost, short-term funding;
potential changes to the competitive environment, including changes due to the effects of
consolidation, and perceptions of State Street as a suitable service provider or counterparty;
the level and volatility of interest rates and the performance and volatility of securities, credit,
currency and other markets in the U.S. and internationally; our ability to measure the fair
value of the investment securities on our consolidated balance sheet; the results of litigation,
government investigations and similar disputes or proceedings; our ability to control operating
risks, information technology systems risks and outsourcing risks, and our ability to protect our intellectual property rights, the possibility of errors in the quantitative models
we use to manage our business and the possibility that our controls will prove insufficient, fail or
be circumvented; ‰ adverse publicity or other reputational harm; our ability to grow
revenue, attract and/or retain and compensate highly skilled people, control expenses and attract the
capital necessary to achieve our business goals and comply with regulatory requirements; the
potential for new products and services to impose additional costs on us and expose us to increased operational risk; changes in accounting standards and
practices; and changes in tax legislation and in the interpretation of existing tax laws by U.S. and
non-U.S. tax authorities that affect the amount of taxes due. Other important factors that could cause actual results to differ materially from those indicated by
any forward-looking statements are set forth in our 2010 Annual Report on Form 10-K and
our subsequent SEC filings, including the risk factor disclosures in our Current Report on Form 8-K filed on February 2, 2011. We encourage investors to read these filings,
particularly the sections on risk factors, for additional information with respect to any
forward-looking statements and prior to making any investment decision. The forward-looking
statements contained in this presentation speak only as of the date hereof, February 10, 2011 and we
do not undertake efforts to revise those forward-looking statements to reflect events after
that date. |
 4
Extending Our Leadership
Agenda
Forward Focus
Financial Update
Summary
Solutions Innovation
Operations & IT Transformation
Risk and Capital Management
Global Expansion |
 5
Forward Focus
1
The NASDAQ Stock Market Inc., Data Products, as of 12/31/10.
2
Scrip Issue Global Report, 9/10.
3 ICFA Annual Fund Administration Survey, 2010; HFN Biannual Fund
Administration Survey, 6/10. 4
Pension and Investments 6/28/10.
5 Pension and Investments 5/31/10.
LEADERSHIP TODAY
•
No. 1:
–
U.S. Mutual Fund Accounting
1
–
Global Investment Manager
Operations Outsourcing
2
–
Global Alternative Asset Servicing
3
–
Securities Finance
2
•
Leading Transition Manager
•
Electronic Trading Innovator
•
No. 2:
–
Worldwide
Institutional
Asset Management
4
–
Passive Manager of Domestic Equities
and Bonds
5
–
ETF provider
4
FORWARD FOCUS
Operations & IT Transformation
Risk and Capital Management
Solutions Innovation
Global Expansion |
 6
Forward Focus
Solutions Innovation
Solutions Innovation
Operations & IT Transformation
Global Expansion
Risk and Capital Management
GLOBAL
SERVICES
•
Investment Manager
Operations Outsourcing
–
No.1 provider in market
1
with $7.9TN in AUA
2
•
Leading suite of Alternative
Asset servicing capabilities
–
No.1 provider in market
3
with $660BN in AUA
2
•
Services augmented by
comprehensive array of
data, risk and analytics
capabilities
1
Greensted
Scripp
Issue report, 9/10.
2 As of 12/31/10.
3
ICFA Annual Fund Administration Survey, 2010; HFN Biannual Fund Administration
Survey, 6/10. |
 7
Forward Focus
Solutions Innovation
GLOBAL
MARKETS
•
Advisory relationships
informing portfolio
strategies, including trading
and securities finance,
integrated with transition
management
–
Relationships with 89 of
the top 100 global
investment managers
•
Robust e-exchange platform
•
Leader in research with
unique partnership with
academia (State Street
Associates)
Solutions Innovation
Operations & IT Transformation
Global Expansion
Risk and Capital Management |
 8
Forward Focus
Solutions Innovation
GLOBAL
ADVISORS
•
Multi-asset class, multi-
strategy approach meeting
needs of global investors
•
Core strength in passive and
quantitative investment
management
•
Strategy to grow business in
Defined Contribution plans,
cash management, and
Exchange-Traded Funds
Solutions Innovation
Operations & IT Transformation
Global Expansion
Risk and Capital Management |
 9
Forward Focus
Operations & IT Transformation
SUPPORTING
GROWTH
•
Market expansion
•
Mergers and acquisitions
•
Geographic expansion
ENABLING
PRODUCTIVITY
•
Business process
excellence
•
Flexible global workforce
•
Global shared services
ACCELERATING
INNOVATION
•
New product development
•
Technology leadership
•
Global solutions
BENEFITING THE
CLIENT
•
Service excellence
•
Time to market
•
New products and services
Solutions Innovation
Operations & IT Transformation
Global Expansion
Risk and Capital Management |
 10
Forward Focus
Risk and Capital Management
RISK FOCUS
•
Adjusting to evolving
regulatory requirements
•
Developing best-in-class
capabilities
CAPITAL
POSITION
•
Capital strength as a
competitive differentiator
•
Well positioned to meet
Basel III requirements
DEPLOYMENT
•
Restoring dividend
a priority
•
Evaluate share repurchase
and
potential acquisitions
Solutions Innovation
Operations & IT Transformation
Global Expansion
Risk and Capital Management |
 11
Forward Focus
Solutions Innovation
Operations & IT Transformation
Global Expansion
Risk and Capital Management |
 12
Year ended
12/31/00²
Year ended
12/31/10
% Change
Operating-basis revenue
$3.45BN
$8.71BN
+152%
Operating-basis non-US revenue
$0.94BN
$3.18BN
+238%
Employees³
17,281
28,670
+66%
Non-US employees³
3,463
12,518
+261%
Forward Focus
Global Expansion1
1 Financial data presented on an operating-basis (which is adjusted to
exclude, among other things, discount accretion). For a description of operating-basis revenue and resulting
reconciliation, see the Appendix.
2 Data exclude the revenue and employees associated with the Corporate Trust
and Private Asset Management businesses divested in 2002 and 2003, respectively.
3 At period end.
North America
2000
$2.687BN
14,471 Employees
2010
$5.728BN
17,391 Employees
Europe, Middle East, Africa
2000
$0.439BN
1,695 Employees
2010
$2.348BN
8,458 Employees
Asia / Pacific
2000
$0.327BN
1,115 Employees
2010
$0.638BN
2,821 Employees
Revenue in $ |
 13
Forward Focus
Global Expansion
European Collective, Pension, Insurance Markets:
$19.1TN¹ European market forecast to grow 5.5%
per year over next 3 years 5
1
Total assets include seven key European markets: UK, Netherlands, Germany, Ireland
/ Luxembourg offshore assets, Italy, Switzerland and France. 2
EFAMA, 9/30/10.
3
Towers Watson Global Pension Study 2010, STT estimates.
4
CEA European Insurance 12/09; Datamonitor
as of 9/10.
5
Collectives, EFAMA, 9/10;
Strategic Insight (1/11); Pensions BCG (1/11); Insurance BCG (1/11).
|
 14
Forward Focus
Global Expansion
1
Total assets include seven key European markets: UK, Netherlands, Germany, Ireland
/ Luxembourg offshore assets, Italy, Switzerland and France. 2 AUA
represents all European assets under custody / administration. 3
Sources: Collectives: ICI (12/05); Pensions: Watson Wyatt Global Pension Asset Study (12/05); OECD Pension Market (Italy, (12/05); Insurance: CEA Insurance (12/05).
4 See footnotes 2-4, slide 14. |
 15
Forward Focus
Global Expansion |
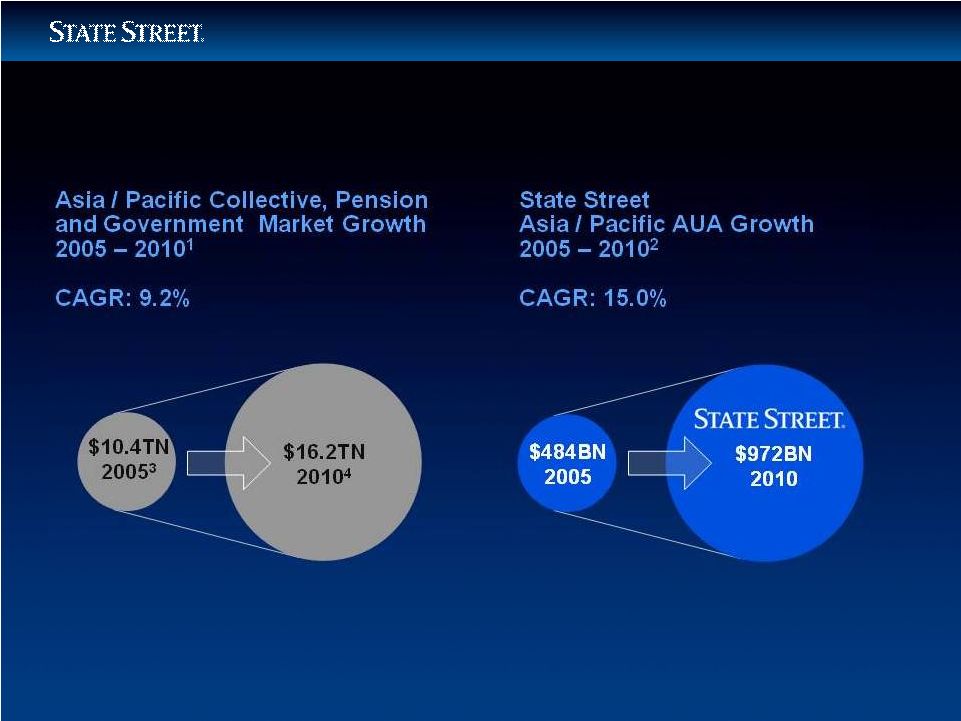 16
Forward Focus
Global Expansion
1
Total assets include seven key markets: Japan, Australia, Hong Kong, South Korea,
Taiwan, China and Singapore. 2 AUA represents all Asia / Pacific
assets under custody / administration. 3 Sources: Collectives: ICI
(12/05); Pensions: Watson Wyatt Global Pension Asset Study (01/06); Singapore Central Provident Board (12/05); Government: International Financial
Statistics (12/05); Japan Post Bank Annual Reports (03/05); Economist Intelligence
Unit (Taiwan, (12/05); Chungwha Post Bank (12/05); Temasek
Holdings (12/05), GIC (12/05).
4 Sources: see footnotes 2-4, slide 16. |
 17
Forward Focus
Global Expansion –
Contribution of Acquisitions
NON-US
ACQUISITIONS
Deutsche Bank’s Global
Securities Services
Established State Street’s leadership position in Europe
Mourant International
Finance Administration
Established State Street as No. 1 servicer of private equity and
hedge funds worldwide
Intesa Sanpaulo
Securities Services
Expanded State Street’s footprint in Europe and established
leadership position in Italy
Bank Of Ireland
Asset Management
Added fundamental capabilities to SSgA’s suite of solutions
(closed 1/11)
OTHER
IFS
Added hedge fund servicing capability
Currenex
Expanded electronic high-speed trading capability
Palmeri
Accelerated State Street’s leadership in private
equity servicing
Investors Financial
Expanded share of mutual fund and hedge fund
servicing markets |
 18
Forward Focus
Global Expansion |
 19
Forward Focus
•
Aligned against strong secular growth trends
•
Comprehensive global footprint and infrastructure
•
Well positioned in fast-growing markets with significant market share
•
Deep client relationships fueling strong organic growth
•
Opportunistic about acquisitions to expand market share or capabilities
for clients
Summary |
 20
Extending Our Leadership
Agenda |
 21
Solutions Innovation
Investment Management
1
Pension & Investments 6/28/10.
2
Pensions & Investments 5/31/10.
3
eVestment Alliance 9/30/10.
4 Pensions & Investments 9/20/2010.
5
Pensions & Investments 10/4/2010.
LEADERSHIP TODAY
•
No. 2 in worldwide institutional
asset management¹
•
No. 2 passive manager of domestic
equities and bonds²
•
No. 2 ETF provider¹
•
No. 1 endowment / foundation assets²
•
No. 1 defined benefit assets²
•
No. 1 global equity²
•
No. 1 emerging markets manager³
•
No. 2 index manager
4
•
No. 6 defined contribution assets
5
FORWARD FOCUS
•
Defined Contribution Plans
•
Cash Management
Global Investment
Management Solutions
•
Exchange Traded Funds |
 22
Solutions Innovation
Investment Management Solutions
Asia / Pacific
North America
Europe, Middle East
Atlanta
Boston
Chicago
Montreal
New York
Rye Brook, NY
San
Francisco
Wilton, CT
Toronto
Investment Center
Management Office
Global Alliance
Amsterdam
Brussels
London
Paris
Geneva
Frankfurt
Munich
Milan
Dubai
Bangalore
Hong Kong
Melbourne
Seoul
Singapore
Shanghai
Tokyo
Sydney
Dublin
•
10 investment centers; 24-hour global trading capability
•
39% of 2010 operating-basis revenue from non-US sources
Leading Global Asset Manager
As of December 31, 2010. |
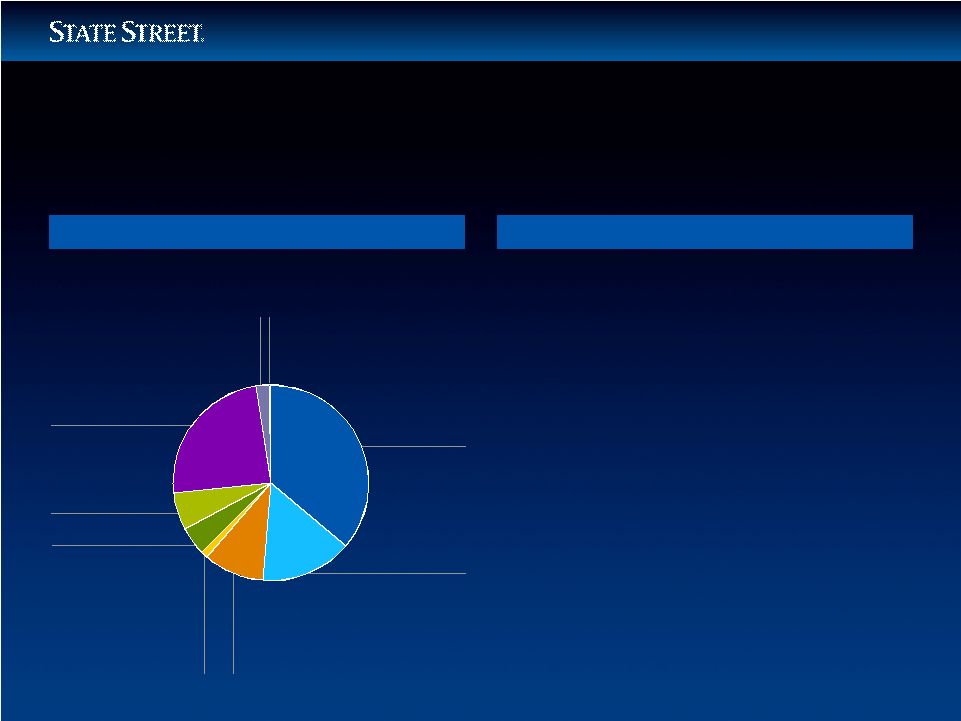
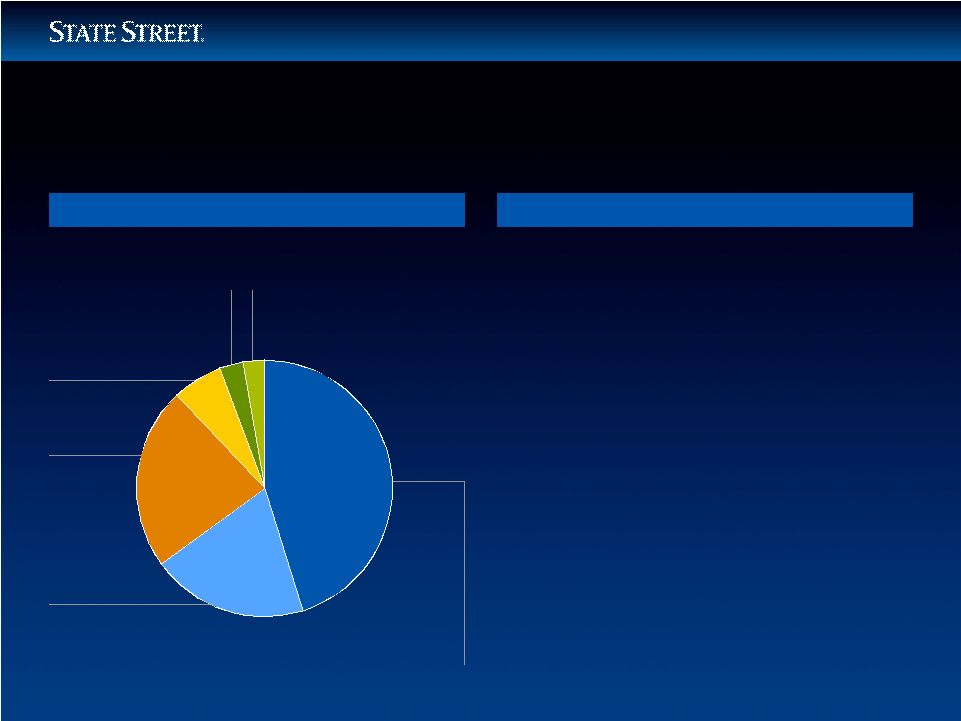
 23
Solutions Innovation
Investment Management Solutions
$2.0TN AUM
*
* As of December 31, 2010.
Note: Assets in Asset Allocation are not counted in the underlying asset
class. BROAD CAPABILITIES
CLIENTS
•
3,000 global clients
–
37% non-US domiciled
–
24 Central Bank relationships
–
24 Sovereign Wealth Fund clients
•
65% of clients use two or
more strategies
•
86% of new business in 2010 came
from existing SSgA clients
–
65% of new business came from
non-US sources
Cash
$426BN
21%
Other
$28BN
1%
Equities
$655BN
33%
ACTIVE
Fixed
Income
$20BN
1%
Equities
$55BN
3%
PASSIVE
Fixed Income
$361BN
18%
Currency Sub-advised Assets,
Multi-asset Class Solutions $210BN 10%
Exchange Traded Funds
$255BN
13% |
 24
Solutions Innovation
Investment Management Solutions
VALUE
PROPOSITION
A broad range of investment solutions
•
Includes active, enhanced, passive, fixed-income, cash, pure
alpha and multi-asset class solutions
•
More than 120 ETFs
Advanced research behind every portfolio
•
Dedicated asset class and credit research teams
•
Advanced Research Center (ARC), with 32 experienced
professionals
Strong performance
•
More than 70%
of all active strategies outperformed their
benchmarks in 2010
•
An efficient passive provider with low tracking error |
 25
•
AUM in Defined Contribution plans is projected to grow at a CAGR
of 10% over the
next 5 years as Defined Benefit plans decelerate
*
•
This trend is expected to accelerate as sponsors shift the burden of retirement risk
onto participants
Solutions Innovation
Defined Contribution Plans
*
Source: McKinsey Retirement Practice, 1/11.
Defined Contribution and Defined Benefit Assets
= 100%
41
42
43
45
47
49
52
54
55
58
59
58
57
55
53
51
48
46
45
42
2006
2007
2008
2009
2010
2011
2012
2013
2014
2015
Defined Benefit
Defined Contribution
15.5
16.3
13.4
14.0
14.5
15.1
15.8
16.5
17.2
18.5
Global
$TN |
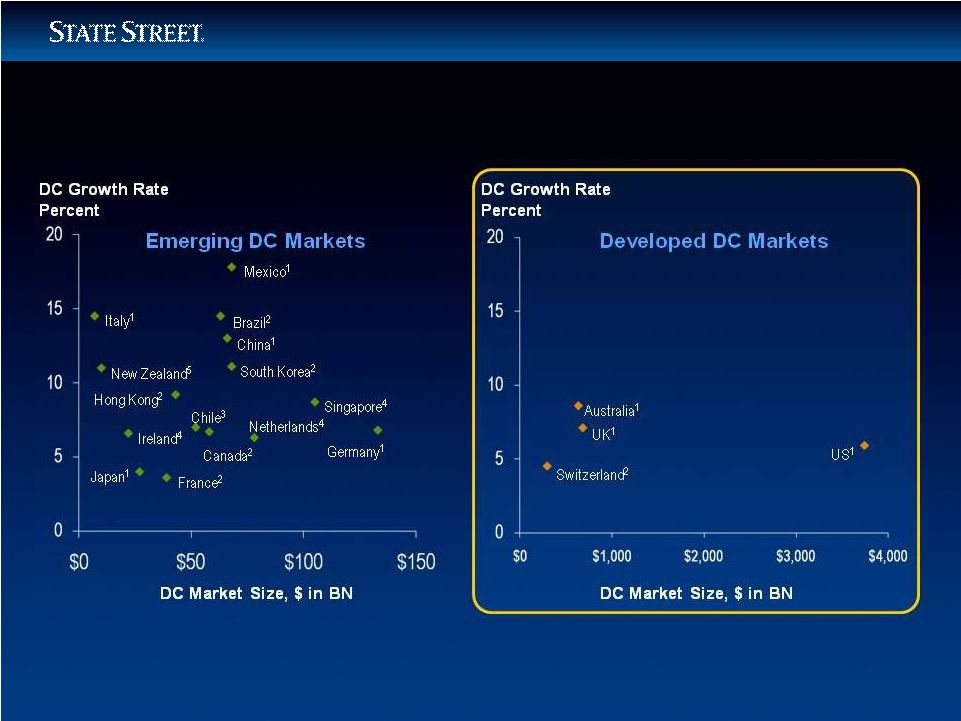 26
Solutions Innovation
Defined Contribution Plans –
Global Growth Rates
1
Using 2008 –
2013 projected DC AUM growth rate (CAGR) from Cerulli.
2
Using 2008 –
2013 projected total pension growth rate (CAGR) from Cerulli.
3
Using 2004 –
2008 historic DC AUM growth rate (CAGR) from Cerulli.
4 Using 1998 –
2008 historic total pension growth rate (CAGR) from Watson Wyatt.
5
Using 2001 –
2007 historic total pension growth rate (CAGR) from IFSL.
Source: McKinsey Retirement Practice; Cerulli; IFSL; Watson Wyatt; WMM; team
analysis. |
 27
International
Equities
$30BN
15%
Solutions Innovation
Defined Contribution Plans
Company Stock
Management
$49BN
24%
Cash
$4BN
2%
Alternative Indices*
$1BN
1%
Balanced
$12BN
6%
Target Date
$10BN
5%
Stable Value
$2BN
1%
Fixed Income
$20BN
10%
US Equities
$72BN
36%
BROAD CAPABILITIES
VALUE PROPOSITION
•
Trends favoring transparency and
passive offerings
•
More than 30 years of experience in
the Defined Contribution market
•
Extensive product offerings across all
major asset classes and risk spectrum
•
Top-performing Target Date Funds
•
Opportunity to cross sell into
extensive defined-benefit client base
$200BN AUM*
* As of 12/31/10. |
 28
Solutions Innovation
Cash Management
GLOBAL MARKET SIZE
Cash AUM
Projected Growth in Cash
*
5-Year CAGR = 3%
$TN
*
Source: Cerulli, 6/10.
7.4
7.7
8.0
8.2
8.4
8.5
$6
$7
$8
$9
2009
2010E
2011E
2012E
2013E
2014E |
 29
Separate
Accounts
45%
Solutions Innovation
Cash Management
BROAD CAPABILITIES
VALUE PROPOSITION
•
Broad global experience managing
cash in six locations and seven
currencies worldwide
•
Full range of global risk-controlled
cash options
•
Significant credit research and
portfolio management resources
•
Opportunities to cross-sell liquidity
management solutions to existing
corporate, sovereign wealth fund and
central bank clients
*
As of 12/31/10.
Registered
Funds
26%
Pooled Account
and Other
29%
$426BN* AUM |
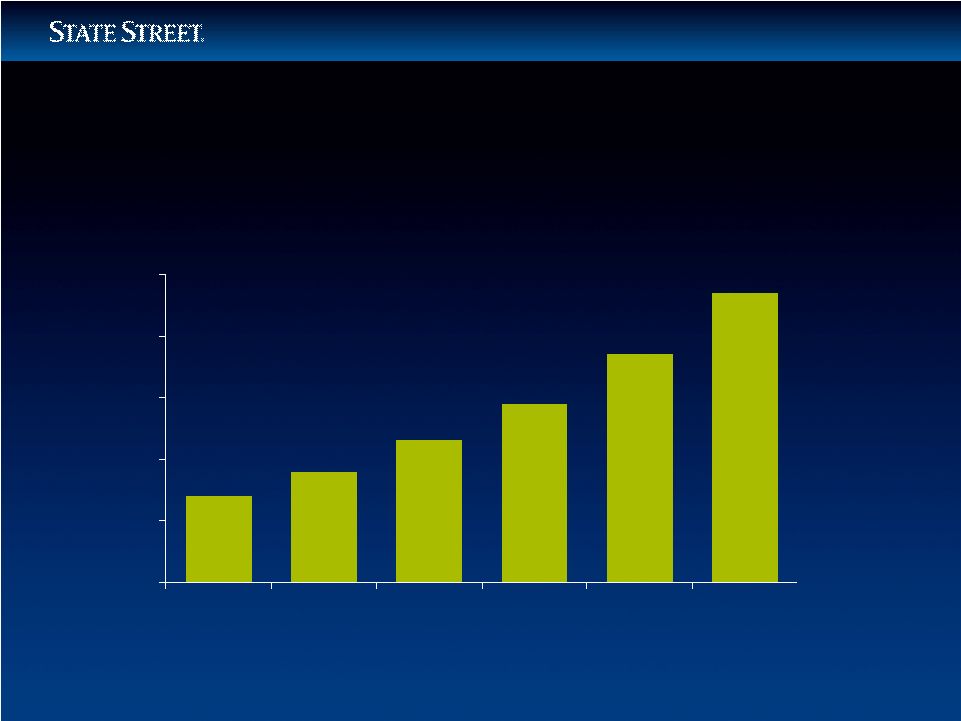 30
ETF and Other Exchange-Traded Products AUM
1,2
5-yr CAGR¹: 26.7%
$0
$1
$2
$3
$4
$5
2010
2011
2012
2013
2014
2015
Solutions Innovation
Exchange-Traded Funds –
Global AUM Growth Forecast1
$TN
1.5
1.8
2.3
2.9
3.7
4.7
1 The global forecast includes estimates for Americas, Europe, Asia (ex-Japan) plus all other
regions (e.g. Japan, Mideast, etc.). 2 Includes all
exchange-traded products (e.g., ETF, ETN, ETC) and baseline steady state growth (no shocks to system).
Source: ETF Landscape Year-end 2010, industry reports, McKinsey analysis as of 1/2011.
|
 31
Solutions Innovation
Exchange-Traded Funds -
Continued Growth and Innovation
$255BN in Global ETF AUM¹
Sector
$51BN
Size
(e.g. Large, Mid, Small Cap)
$115BN
Fixed Income
$16BN
Commodity
$58BN
Dividend /
Fundamental / Other
$7BN
1 As of 12/31/10.
2 Annual ETF Global Awards, 4/10.
BROAD CAPABILITIES
VALUE PROPOSITION
•
Pioneered market in 1993 by launching
the first US-listed ETF
•
SPDR
®
is “most recognized”
brand²
–
Represents more than 100 global
offerings across asset classes and
geographies
•
Committed to service and support of
investment professionals
–
56 product, strategy, and marketing
professionals
–
78 sales professionals
•
Institutional caliber products and
services traditionally available in “pure
institutional”
arena, now available to
sophisticated investment professionals
International
$8BN |
 32
Solutions Innovation
•
Well positioned against large fast-growing market segments
•
Leveraging core competencies
•
Extensive global footprint
•
Deep, long-standing relationships with world’s leading institutions
•
Ability to cross-sell to existing State Street clients
Summary |
 33
Extending Our Leadership
Agenda |
 34
Operations & IT Transformation
LEADERSHIP TODAY
•
Global footprint
•
Global platform
•
Secure, reliable infrastructure
•
World-class Lean skills
•
Shared service / COE
operating model
FORWARD FOCUS
Enabling Productivity
Accelerating Innovation
Supporting Growth
Benefiting Clients |
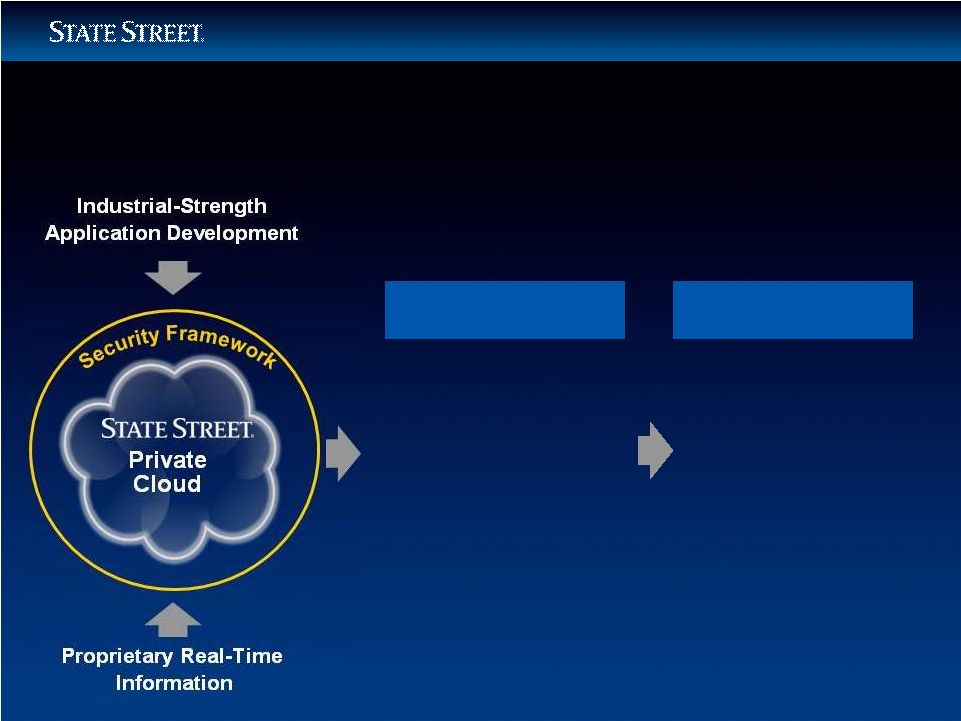
 35
Operations & IT Transformation
•
Deploy leading-edge
technologies to fuel
innovation
•
Shift to new, private cloud
computing paradigm
•
Leverage Lean to standardize
processes and platforms
•
Improve speed to market
and enhance service delivery
•
Deliver real-time analytics
and data
Supporting Growth –
Program Profile |
       36
Operations & IT Transformation
Supporting Growth –
Program Profile
*
National Institute of Standards and Technology.
Lean*
A systematic approach to identifying
and eliminating waste through
continuous improvement, flowing the
product at the pull of the customer in
pursuit of perfection
Cloud Computing*
A model for enabling convenient,
on-demand network access to a shared
pool of configurable computing
resources (e.g. networks, servers,
storage, applications, and services) that
can be rapidly provisioned and released
with minimal management effort or
service provider interaction |
 37
Operations & IT Transformation
Enabling Productivity
Service Excellence
Client-backed model
World class engineering
Follow the sun model
Resource Optimization
Functional centers
of excellence (COEs)
Capacity on demand
Right-shore talent by
location
Process Standardization
Global processes for
the core
More efficient
organization
LEAN METHODOLOGIES
GLOBAL FLEXIBLE
WORKFORCE
Fact-Based
Engineering Approach
Technology investment
based on detail analysis
Higher productivity |
 38
Operations & IT Transformation
Accelerating Innovation
•
Automation / capacity on
demand
•
Accelerated time
to market
•
Integrated security
environment
•
Real-time data
infrastructure
•
Advanced platform for
product innovation
•
Strengthened client
service
KEY BENEFITS
•
Custom analytics and
data
•
Risk and control
Services
•
Performance,
compliance and
advisory services
NEW PRODUCTS
AND SERVICES |
 39
Operations & IT Transformation
Benefiting Clients
Leading Multi-Asset Global Investment Manager
Benefits
Today
Future Plan
STATE STREET
SERVICE DELIVERY
Speed and Agility
•
New test systems and
applications take 3 to 6
weeks to deploy
•
New test systems
and applications
take minutes to
deploy
•
Aggregate data views
available end of day
•
Aggregate data view
real time
Innovation
•
Managing multiple
data feeds and inputs
including external data
providers
•
Holistic real-time
reporting with risk
and analytics
capabilities
•
Enhanced controls
and reporting to
deliver component
solutions
•
A cloud-enabled life
cycle solution with
on demand capacity |
 40
Operations & IT Transformation
Progress to Date
PRIVATE CLOUD
•
Global pilot conducted in 2010
•
Multiple independent reviews
•
Security parameters successfully tested
LEAN
•
700 Lean professionals trained
•
33 projects completed in ’09 and ’10
CENTERS OF
EXCELLENCE
•
Key processing centers established in China, India and Poland
•
Core functions aligned against client needs / demand
GLOBAL FLEXIBLE
WORFORCE
•
4,800
employees in China, India & Poland*
•
Ability to move work from center of excellence to enhance client
service and reduce cost
*
As of 12/31/10. Includes JV in India. |
 41
Operations & IT Transformation
Financial Profile
NET BENEFIT
•
Expect to achieve annual pre-tax run rate of $575MN to $625MN
by the end of 2014
CUMULATIVE NET
OPERATING
IMPACT
•
2011: slight benefit
•
2012: about 1/3 of the total expected
•
2013: about 2/3 of the total expected
•
2014: 100% of total expected
IMPLEMENTATION
EXPENSES
•
Incremental costs to range between $15MN to $20MN per
quarter
•
Costs are expected to peak in 2012 and trail off in 2014
RESTRUCTURING
CHARGES
•
Expect about $400MN to $450MN
–
$156MN in 2010
•
Expect charges to peak in 2012, similar to the ramp of the
implementation expenses
2011 –
2014 |
 42
Operations & IT Transformation
•
Strengthens service excellence
•
Heightens introduction of new products and services
•
Accelerates time to market
•
Enables flexible global workforce
•
Enhances data security
Summary |
 43
Extending Our Lead
Agenda |
 44
Risk and Capital Management
Capital
NEW WORLD
NEW RULES
•
Adjusting to new global
evolving capital
requirements
•
Developing best-in-class
capabilities
SOURCES OF
CAPITAL
•
Strong organic
capital generator
USES OF
CAPITAL
•
Reinstating dividend
a priority
•
Evaluating share repurchase
program and potential
acquisitions
WELL-
POSITIONED
PORTFOLIO
•
Strategically repositioned
portfolio in 2010
•
90% of assets rated
AAA / AA
*
•
Recent actions better
prepared STT for Basel III
ahead of implementation
dates
Solutions Innovation
Operations & IT Transformation
Global Expansion
Risk and Capital Management
*
As of 12/31/10. |
 45
Risk and Capital Management
Capital Ratios
State Street Corporation
“Well
Capitalized”¹
12/31/10
Actual
under Basel I
12/31/10
Adjusted to reflect
Basel III proposal
5
Tier 1 Leverage
5.0%²
8.2%
5.9%
Tier 1 Capital
6.0%
20.5%
10.6%
Tier 1 Common Ratio³
----
18.1%
9.4%
Total Capital
10.0%
22.0%
11.6%
Tangible Common Equity
4
----
7.6%
7.6% |
 46
Risk and Capital Management
Transition from Basel I to Basel III Regulations
CAPITAL CHANGES
•
FAS 115 (unrealized loss) and FAS 158 (pension funding)
no longer added back
•
Trust preferred and subordinated debt phased out
•
Deferred tax assets treated less restrictively
•
Revised methodology for expected credit losses
RISK-WEIGHTED
ASSET CHANGES
•
Model for operational risk internally driven
•
Changes to risk weightings related to credit risk
•
Asset securitization deduction
AVERAGE ASSETS
•
Off-balance sheet loan commitments
•
Stand-by purchase agreements
•
Derivative exposures included |
 47
Extending Our Lead
Agenda |
 48
Financial Update
Business
2010 New Wins
*
($BN)
Installed through Q4
($BN)
To be Installed
($BN)
US Asset Servicing
$911.4
$640.2
$271.2
Non-US Asset Servicing
$454.8
$335.5
$119.3
Total Asset Servicing
$1,366.2
$975.7
$390.5
US Asset Management
$88.7
$63.8
$24.9
Non-US Asset Management
$70.5
$55.4
$15.1
Total Asset Management
$159.2
$119.2
$40.0
Revenue Drivers –
Winning New Business
*
Assets as of 12/31/10. |
 49
SECURITIES
FINANCE
•
Average assets on loan over the past six quarters were $397BN per
quarter, with NYSE short interest below historic levels
•
2011 outlook is cautious:
–
Volumes declined from Q3 2010 level to $368B in Q4 2010
–
Rate environment (FF to 3-month LIBOR) remains compressed
•
From Q1 ’07 to Q4 ’10 our global market share increased from 21% to
almost 26%¹
FOREIGN
EXCHANGE
•
Q4 volumes annualized ($3.0TN) tracking above 2009 level ($2.9TN),
but not at level of 2007 and 2008, averaged ($3.3TN)
–
Improvement in volume from 2009 based on modest increase in
cross-border trading and re-risking by equity managers
•
Average annual volatility in ’10 (1.06%) is below the average level in
’09 (1.34%) and ’08 (1.39%)²
Financial Update
Market-Driven Revenues
1 Based on data from Data Explorers Universe as of period end.
2 Based on customer-weighted volumes. |
 50
Financial Update
Balance Sheet Management
AS OF 12/31/10
•
Total Balance Sheet: $161BN; normalized: $144BN
*
-
Duration gap: 0.53 years
•
Investment Portfolio: $95.3BN
-
Duration: 1.7 years
-
Unrealized after-tax loss of $504MN, down 78%
from 12/31/09
•
Liabilities: Customer driven
•
Reinvestment Strategy
-
Re-invested $7BN of the $11BN from the securities sold in
December, 2010
-
Expect about $15BN to mature or pay down in 2011
-
Expect to purchase primarily Treasuries and Agencies, as
well as AAA-
and AA-rated asset-backed and mortgage-
backed securities
*
Excludes $17BN in excess deposits held at the Federal Reserve and other central
banks. |
 51
ASSUMPTIONS
FOR 2011
•
Worldwide administered rates remain unchanged
•
Steepness of yield curve remains at its current level
•
Average earning assets expected to increase modestly from the 2010 level
•
Ratio of Fixed / Floating assets in the investment portfolio = about 45% / 55%
Financial Update
Net Interest Revenue / Net Interest Margin |
 52
Financial Update
Disciplined Expense Control
Objective
•
Achieve positive operating leverage on an annual basis
Recent Past
•
Focused on expense discipline
–
Streamlined levels of management
–
Implemented Lean processes throughout the organization
–
Ran technology expenses at lower end of 20% to 25% range
Future
•
Implement operations/IT transformational program to achieve:
–
Increased efficiency
–
Improved processes
–
Optimization of global footprint
•
Short-term expect modest pressure from increased regulatory costs
|
 53
Financial Update
•
Continued strength in servicing fee revenue
•
Modest improvement in management fee revenue as investors begin
to re-risk
•
Conservative approach to addressing market-driven revenue
•
Balance sheet to generate 155 to 165 BPS of NIM
•
Increased capital flexibility
•
Disciplined expense control
•
Focused on executing multi-year plan to transform our business model
through technological innovation
Expectations Driving 2011 Outlook |
 54
Extending our Leadership
Agenda |
 55
Summary
•
Global Services
–
Leader in servicing
solutions for asset
managers and
asset owners
•
Global Markets
–
Pioneer in
electronic trading
and portfolio
solutions
•
Global Advisors
–
Well positioned
in high-growth
markets
•
Secular Trends
Support Growth
•
Global Scale
•
Deep Client
Relationships
•
Strong Momentum
in Core Business
CORE BUSINESS
WELL-POSITIONED
Solutions Innovation
Operations & IT Transformation
Global Expansion
Risk and Capital Management
FORWARD FOCUS |

Non-GAAP Financial Measures
This presentation includes financial information presented on a GAAP basis as well as on an operating basis. Operating-basis financial information is a non-GAAP presentation. Management measures and compares certain financial information on an operating basis, as it believes that this presentation supports meaningful comparisons from period to period and the analysis of comparable financial trends with respect to State Street’s normal ongoing business operations. Management believes that operating-basis financial information, which reports revenue from non-taxable sources on a fully taxable-equivalent basis and excludes the impact of revenue and expenses outside of the normal course of business, facilitates an investor’s understanding and analysis of State Street’s underlying financial performance and trends in addition to financial information prepared in accordance with GAAP.
This presentation also includes capital ratios in addition to, or adjusted from, those calculated in accordance with applicable regulatory requirements. These include capital ratios based on tier 1 common capital and capital ratios adjusted to reflect our estimate of the application of the Basel III capital requirements. These non-regulatory and adjusted capital measures are non-GAAP financial measures. Management presently evaluates the non-GAAP capital ratios presented in this presentation to aid in its understanding of State Street’s capital position under a variety of standards, including presently applicable and evolving regulatory requirements. Management believes that the use of the non-GAAP capital ratios described in this presentation similarly aids in an investor’s understanding of State Street’s capital position and therefore is of interest to investors.
In addition to the reconciliations described in the descriptions on the next slide of the capital ratios referenced in this presentation, the Appendix to this presentation also includes reconciliations of the following other non-GAAP financial measures referenced in this presentation: operating-basis results to GAAP-basis results and Basel III-adjusted capital ratios to capital ratios calculated under presently applicable requirements.
Non-GAAP financial measures should be considered in addition to, not as a substitute for or superior to, financial measures determined in accordance with GAAP and capital ratios determined in accordance with presently applicable regulatory requirements.
56
Capital Ratios
The total capital, the tier 1 capital, and the tier 1 leverage ratios are capital ratios used regularly by bank regulatory authorities to evaluate State Street’s capital adequacy. The tier 1 common ratio is sometimes used by the Federal Reserve in connection with its supervisory capital assessment programs. The TCE ratio is another capital ratio management believes provides additional context for understanding and assessing State Street’s capital adequacy.
The total capital, the tier 1 risk-based capital, or tier 1 capital, and tier 1 leverage ratios, as applicable, are each calculated in accordance with applicable bank regulatory requirements.
The tier 1 risk-based common, or tier 1 common, ratio is calculated by dividing (a) tier 1 capital less non-common elements including qualifying perpetual preferred stock, qualifying minority interest in subsidiaries and qualifying trust preferred securities, by (b) total risk-weighted assets, which assets are calculated in accordance with applicable bank regulatory requirements. The tier 1 common ratio is not required by GAAP or on a recurring basis by bank regulations. Management is currently monitoring this ratio, along with the other capital ratios described in this presentation, in evaluating State Street’s capital levels and believes that, at this time, the ratio may be of interest to investors. A reconciliation with respect to tier 1 common capital as of December 31, 2010 is provided in the Appendix.
The ratio of tangible common equity to adjusted tangible assets, or TCE ratio, is calculated by dividing consolidated total common shareholders’ equity by consolidated total assets, after reducing both amounts by goodwill and other intangible assets net of related deferred taxes. Total assets reflected in the TCE ratio also exclude cash balances on deposit at the Federal Reserve Bank and other central banks in excess of required reserves. The TCE ratio is not required by GAAP or by bank regulations, but is a metric used by management to evaluate the adequacy of State Street’s capital levels. Since there is no authoritative requirement to calculate the TCE ratio, our TCE ratio is not necessarily comparable to similar capital measures disclosed or used by other companies in the financial services industry. Tangible common equity and adjusted tangible assets are non-GAAP financial measures and should be considered in addition to, not as a substitute for or superior to, financial measures determined in accordance with GAAP. Reconciliations with respect to the calculation of the TCE ratio as of December 31, 2010 are provided in the Appendix.
57
STATE STREET CORPORATION
RECONCILIATION OF REPORTED RESULTS TO OPERATING-BASIS RESULTS
State Street prepares its consolidated financial statements in accordance with accounting principles generally accepted in the United States, or GAAP.
State Street also presents certain financial information on an “operating” basis as well as a GAAP, or reported, basis. Management measures and compares certain financial information on an operating basis, as it believes that this presentation supports meaningful comparisons from period to period and the analysis of comparable financial trends with respect to State Street’s normal ongoing business operations. Management believes that operating-basis financial information, which reports revenue from non-taxable sources on a fully taxable-equivalent basis and excludes the impact of revenue outside of the normal course of business, facilitates an investor’s understanding and analysis of State Street’s underlying financial performance and trends in addition to financial information prepared in accordance with GAAP.
| (Dollars in millions) |
Year Ended December 31, 2000 | Year Ended December 31, 2010 | % Change | |||||||||||||||||||||||||
| 2010 | ||||||||||||||||||||||||||||
| Reported | Operating - Basis | Reported | Operating - Basis | vs | ||||||||||||||||||||||||
| Results | Adjustments | Results | Results | Adjustments | Results | 2000 | ||||||||||||||||||||||
| Total fee revenue |
$ | 2,690 | $ | (206 | )(1) | $ | 2,484 | $ | 6,540 | $ | 6,540 | |||||||||||||||||
| Net interest revenue |
894 | 65 | (2) | 959 | 2,699 | $ | (583 | )(3) | 2,116 | |||||||||||||||||||
| Gains related to investment securities, net |
2 | 2 | (286 | ) | 344 | (4) | 58 | |||||||||||||||||||||
| Total revenue |
$ | 3,586 | $ | (141 | ) | $ | 3,445 | $ | 8,953 | $ | (239 | ) | $ | 8,714 | 152.9 | % | ||||||||||||
| (1) | Represents revenue associated with the Corporate Trust and Private Management businesses divested in 2002 and 2003, respectively. |
| (2) | Represents tax-equivalent adjustment of $65 million, which is not included in reported results. |
| (3) | Represents tax-equivalent adjustment of $129 million, which is not included in reported results, net of $712 million of discount accretion related to former conduit assets. |
| (4) | Represents a net sale loss related to a restructuring of the investment portfolio. |
58
STATE STREET CORPORATION
Tangible Common Equity and Tier 1 Common Ratios - Reconciliations
As of Period End
The ratio of tangible common equity to adjusted tangible assets, or TCE ratio, is calculated by dividing consolidated total common shareholders’ equity by consolidated total assets, after reducing both amounts by goodwill and other intangible assets net of related deferred taxes. Total assets reflected in the TCE ratio also exclude cash balances on deposit at the Federal Reserve Bank and other central banks in excess of required reserves. The TCE ratio is not required by GAAP or by bank regulations, but is a metric used by management to evaluate the adequacy of State Street’s capital levels. Since there is no authoritative requirement to calculate the TCE ratio, our TCE ratio is not necessarily comparable to similar capital measures disclosed or used by other companies in the financial services industry. Tangible common equity and adjusted tangible assets are non-GAAP financial measures and should be considered in addition to, not as a substitute for or superior to, financial measures determined in accordance with GAAP.
The tier 1 risk-based common, or tier 1 common, ratio is calculated by dividing tier 1 capital, which is calculated in accordance with applicable bank regulatory requirements, less non-common elements, including qualifying trust preferred securities, by total risk-weighted assets, which assets are also calculated in accordance with applicable bank regulatory requirements. The tier 1 common ratio is not required by GAAP or on a recurring basis by bank regulations. However, this ratio has been used by the Federal Reserve in connection with its evaluation of the capital adequacy of certain large U.S. bank holding companies. In addition, management is currently monitoring this ratio, along with the other capital ratios, in evaluating State Street’s capital levels and believes that, at this time, the ratio may be of interest to investors.
The table set forth below presents the calculations of State Street’s ratios of tangible common equity to total tangible assets and tier 1 common capital to total risk-weighted assets.
| December 31, | ||||||||
| (Dollars in millions) |
2010 | |||||||
| Consolidated Total Assets |
$ | 160,505 | ||||||
| Less: |
||||||||
| Goodwill |
5,597 | |||||||
| Other intangible assets |
2,593 | |||||||
| Excess reserves held at central banks |
16,612 | |||||||
| Adjusted assets |
135,703 | |||||||
| Plus deferred tax liabilities |
747 | |||||||
| Total tangible assets |
A | $ | 136,450 | |||||
| Consolidated Total Common Shareholders’ Equity |
$ | 17,787 | ||||||
| Less: |
||||||||
| Goodwill |
5,597 | |||||||
| Intangible assets |
2,593 | |||||||
| Adjusted equity |
9,597 | |||||||
| Plus deferred tax liability |
747 | |||||||
| Total tangible common equity |
B | $ | 10,344 | |||||
| Tangible common equity ratio |
B/A | 7.6 | % | |||||
| Tier 1 capital |
$ | 12,318 | ||||||
| Less trust preferred securities |
1,450 | |||||||
| Tier 1 common capital |
C | $ | 10,868 | |||||
| Total risk-weighted assets |
D | 60,177 | ||||||
| Ratio of tier 1 common capital to total risk-weighted assets |
C/D | 18.1 | % | |||||
59
STATE STREET CORPORATION
BASEL III CAPITAL RECONCILIATION
December 31, 2010
| Current Requirements (1) | Basel III Requirements (3) | |||||||||
| (Dollars in millions) |
||||||||||
| Tier 1 capital |
$ | 12,318 | A | $ | 11,460 | |||||
| Less trust preferred securities |
1,450 | 1,305 | ||||||||
| Tier 1 common capital |
10,868 | B | 10,155 | |||||||
| Total capital |
13,225 | C | 12,441 | |||||||
| Total risk-weighted assets |
60,177 | D | 107,672 | |||||||
| Adjusted quarterly average assets |
150,768 | E | 195,768 | |||||||
| Total tangible common equity (2) |
10,344 | F | 10,344 | |||||||
| Total tangible assets (2) |
136,450 | G | 136,450 | |||||||
| Tier 1 capital ratio |
20.5 | % | A/D | 10.6 | % | |||||
| Total capital ratio |
22.0 | % | C/D | 11.6 | % | |||||
| Tier 1 common ratio |
18.1 | % | B/D | 9.4 | % | |||||
| Tier 1 leverage ratio |
8.2 | % | A/E | 5.9 | % | |||||
| Tangible common equity ratio (2) |
7.6 | % | F/G | 7.6 | % | |||||
| (1) | Actual (unaudited) total capital, tier 1 capital and tier 1 leverage ratios were calculated in accordance with currently applicable bank regulatory requirements. Tier 1 common ratio was calculated by dividing (a) tier 1 capital less non-common elements including qualifying perpetual preferred stock, qualifying minority interest in subsidiaries and qualifying trust preferred securities (tier 1 common capital), by (b) total risk-weighted assets, which were calculated in accordance with currently applicable bank regulatory requirements. |
| (2) | The ratio of tangible common equity to adjusted tangible assets, or TCE ratio, is calculated by dividing consolidated total common shareholders’ equity by consolidated total assets, after reducing both amounts by goodwill and other intangible assets net of related deferred taxes. Total assets reflected in the TCE ratio also exclude cash balances on deposit at the Federal Reserve Bank and other central banks in excess of required reserves. The TCE ratio is not required by GAAP or by bank regulations, but is a metric used by management to evaluate the adequacy of State Street’s capital levels. |
| (3) | For purposes of the calculations in accordance with Basel III (see below), total capital, tier 1 capital and tier 1 leverage ratios and total risk-weighted assets were calculated based on State Street’s estimates, based upon published statements of the Basel Committee and the Federal Reserve, of the effects of the requirements under Basel III affecting capital. The tier 1 common ratio is calculated by dividing (a) tier 1 common capital (as described in footnote (1)), but with tier 1 capital calculated in accordance with Basel III by (b) total risk-weighted assets, which are calculated in accordance with Basel III. State Street reports its financial ratios in accordance with the requirements of the Board of Governors of the Federal Reserve System, which has not yet adopted Basel III. There remains considerable uncertainty concerning the timing for adoption and implementation of Basel III by the Federal Reserve. When adopted, the Federal Reserve may implement Basel III with some or more modifications or adjustments. Therefore, State Street’s current understanding of Basel III, as reflected in the table above, may be different from the ultimate application of Basel III by the Federal Reserve to State Street. |
| • | Tier 1 capital used in the calculation of the tier 1 capital and tier 1 leverage ratios decreased by $858 million, as a result of applying estimated Basel III requirements to tier 1 capital of $12.318 billion as of December 31, 2010. Total capital used in the calculation of the total capital ratio decreased by $784 million, as a result of applying estimated Basel III requirements to total capital of $13.225 billion as of December 31, 2010. |
| • | Tier 1 common capital used in the calculation of the tier 1 common ratio was $10.155 billion, reflecting the adjustments to tier 1 capital described in (A) above. Tier 1 common capital used in the calculation is therefore calculated as adjusted tier 1 capital of $11.460 billion less non-common elements of capital, composed of trust preferred securities of $1.305 billion as of December 31, 2010, resulting in tier 1 common capital of $10.155 billion. At December 31, 2010, there was no qualifying perpetual preferred stock or qualifying minority interest in subsidiaries. |
| • | Total risk-weighted assets used in the calculation of the total capital, tier 1 capital and tier 1 common ratios increased by $47.495 billion as a result of applying estimated Basel III requirements to total risk-weighted assets of $60.203 billion as of December 31, 2010. |
| • | Consolidated adjusted quarterly average assets used in the calculation of the leverage ratio increased by $45.000 billion as a result of applying estimated Basel III requirements to the actual consolidated adjusted quarterly average assets as of December 31, 2010 of $150.896 billion. |
60
 61 |
 62 |