Attached files
| file | filename |
|---|---|
| 8-K - FORM 8-K - NuStar GP Holdings, LLC | d8k.htm |
 2011 Credit Suisse Energy Summit
Steve Blank, Senior Vice President, CFO and Treasurer
February 11, 2011
Exhibit 99.1 |
 Statements
contained
in
this
presentation
that
state
management’s
expectations
or
predictions
of
the
future
are
forward-looking
statements
as
defined
by
federal
securities
law.
The
words
“believe,”
“expect,”
“should,”
“targeting,”
“estimates,”
and
other
similar
expressions
identify
forward-
looking
statements.
It
is
important
to
note
that
actual
results
could
differ
materially
from
those
projected
in
such
forward-looking
statements.
We
undertake
no
duty
to
update
any
forward-looking
statement
to
conform
the
statement
to
actual
results
or
changes
in
the
company’s
expectations.
For
more
information
concerning
factors
that
could
cause
actual
results
to
differ
from
those
expressed
or
forecasted,
see
NuStar
Energy
L.P.’s
and
NuStar
GP
Holdings,
LLC’s
respective
annual
reports
on
Form
10-K
and
quarterly
reports
on
Form
10-Q,
filed
with
the
Securities
and
Exchange
Commission
and
available
on
NuStar’s
websites
at
www.nustarenergy.com
and
www.nustargpholdings.com.
Forward Looking Statements
2 |
 NuStar Overview
3 |
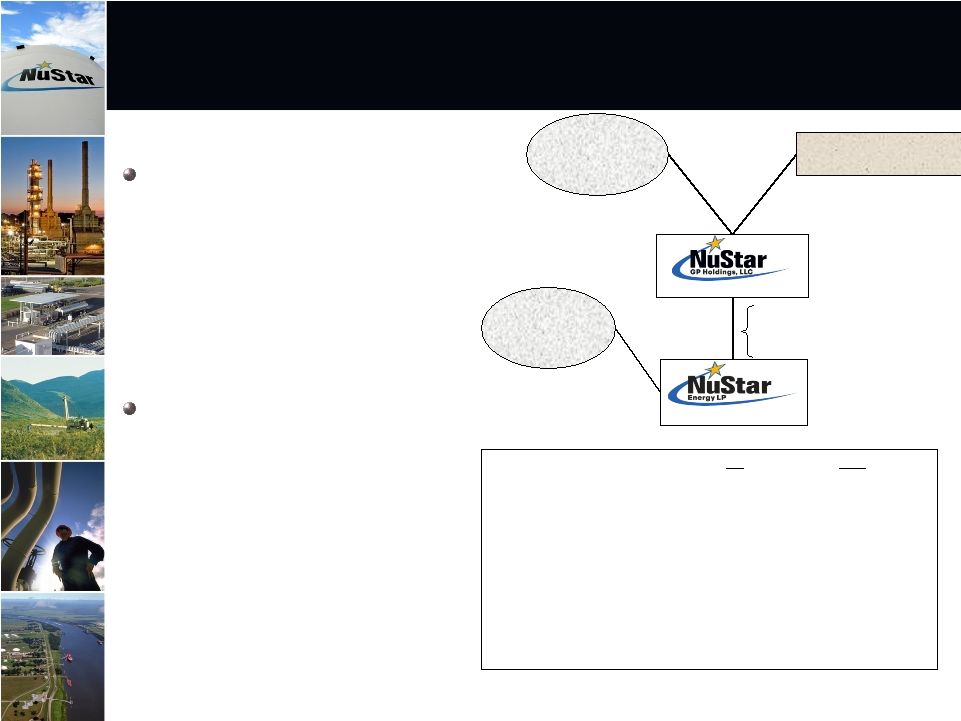 NuStar Energy L.P. (NYSE: NS) is
a leading publicly traded
partnership with a market
capitalization of around $4.4 billion
and an enterprise value of
approximately $6.4 billion
NuStar GP Holdings, LLC (NYSE:
NSH) holds the 2% general
partner interest, incentive
distribution rights and 15.6% of the
common units in NuStar Energy
L.P. with a market capitalization of
around $1.6 billion
Two Publicly Traded Companies
NS
NSH
IPO Date:
4/16/2001
7/19/2006
Unit Price (02/04/11):
$68.26
$36.42
Annual Distribution/Unit:
$4.30
$1.92
Yield (02/04/11):
6.30%
5.27%
Market Capitalization:
$4,410 million
$1,550 million
Enterprise Value
$6,366 million
$1,561 million
Credit Ratings –
Moody’s
Baa3/Stable
n/a
S&P and Fitch
BBB-/Stable
n/a
83.1%
Membership Interest
82.4%
L.P. Interest
Public Unitholders
35.4 Million NSH Units
Public Unitholders
54.3 Million NS Units
16.9%
Membership
Interest
2.0% G.P. Interest
15.6% L.P. Interest
Incentive Distribution Rights
William E. Greehey
7.2 Million NSH Units
NYSE: NSH
NYSE: NS
4 |
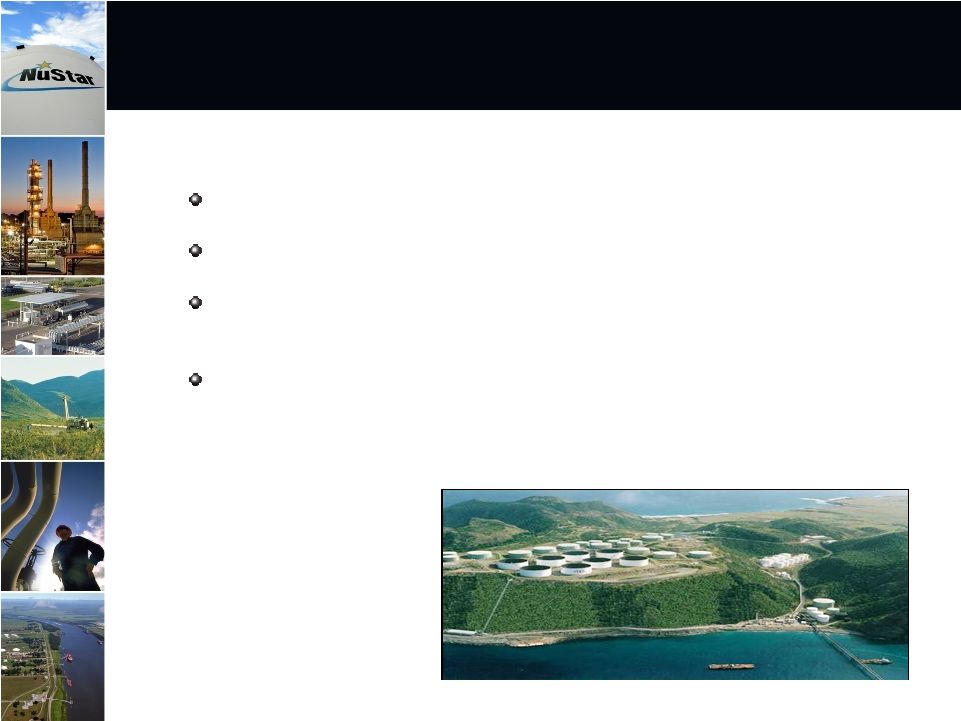
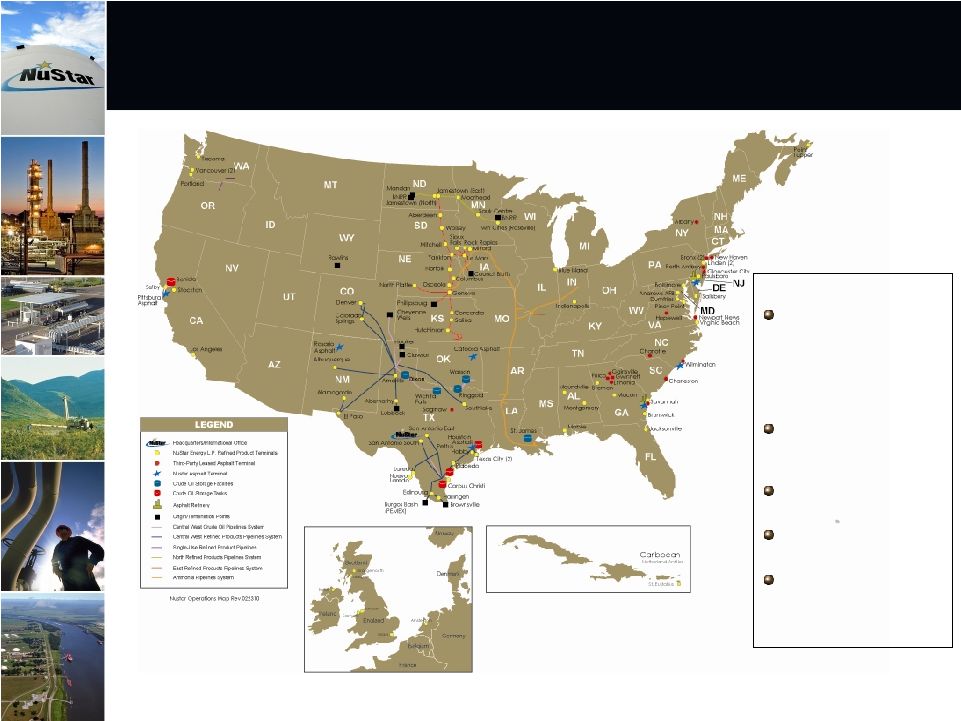 Large
and Diverse Geographic Footprint
with Assets in Key Locations
Asset Stats:
Operations in seven
different countries
including the U.S.,
Mexico, Netherlands,
England, Ireland,
Scotland and Canada
8,417 miles of crude oil
and refined product
pipelines
Own 88 terminal and
storage facilities
Over 93 million barrels of
storage capacity
2 asphalt refineries on
the U.S. East Coast
capable of processing
104,000 bpd of crude oil
5 |
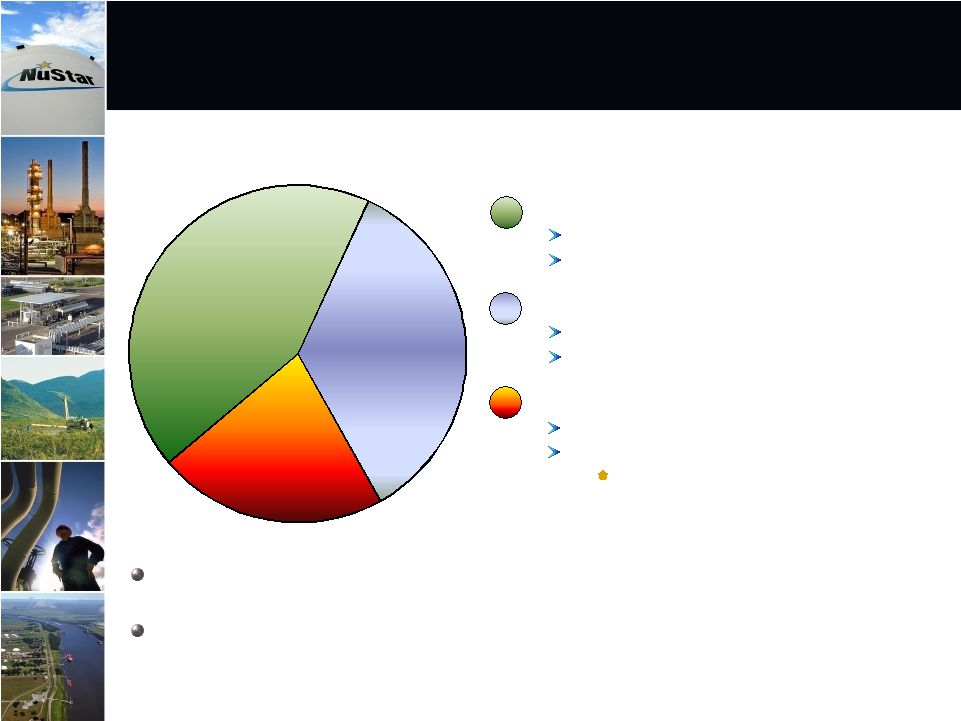 43%
35%
22%
Percentage of 2010
Segment Operating Income
Approximately 78% of NuStar Energy’s 2010 segment operating income came
from fee-based transportation and storage segments
Remainder of 2010 segment operating income was related to margin-based
asphalt and fuels marketing segment
Storage: 43%
Transportation: 35%
Refined Product Terminals
Crude Oil Storage
Refined Product Pipelines*
Crude Oil Pipelines
Asphalt & Fuels Marketing: 22%
Asphalt
Fuels Marketing
Product Supply, Bunkering and Fuel Oil
Marketing
Diversified Operations from Three
Business Segments
* Includes primarily distillates, gasoline, propane, jet fuel, ammonia and
other light products. Does not include natural gas. 6
|
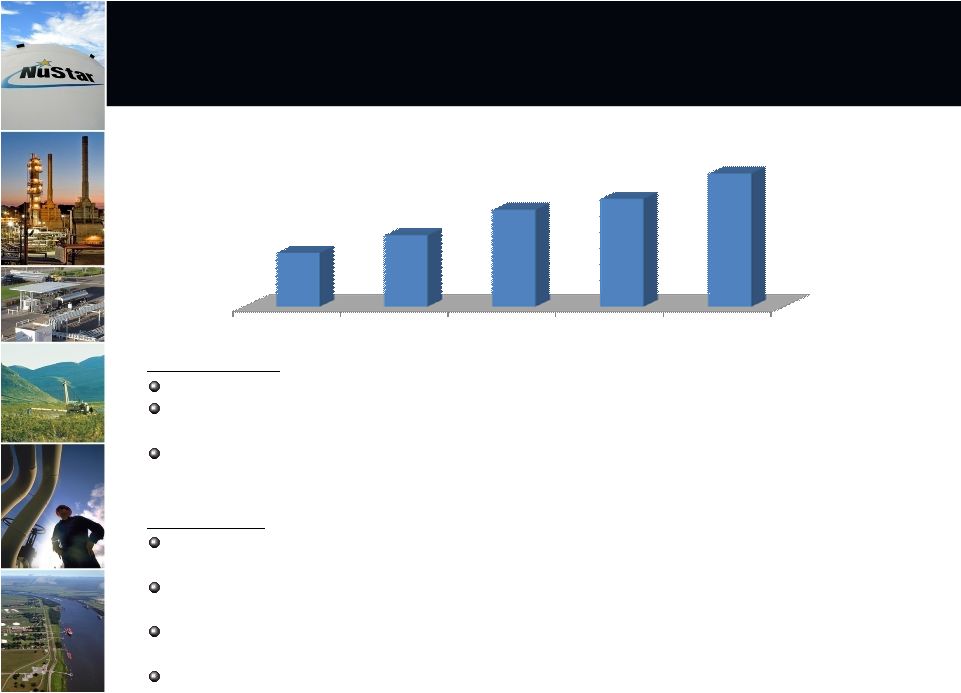
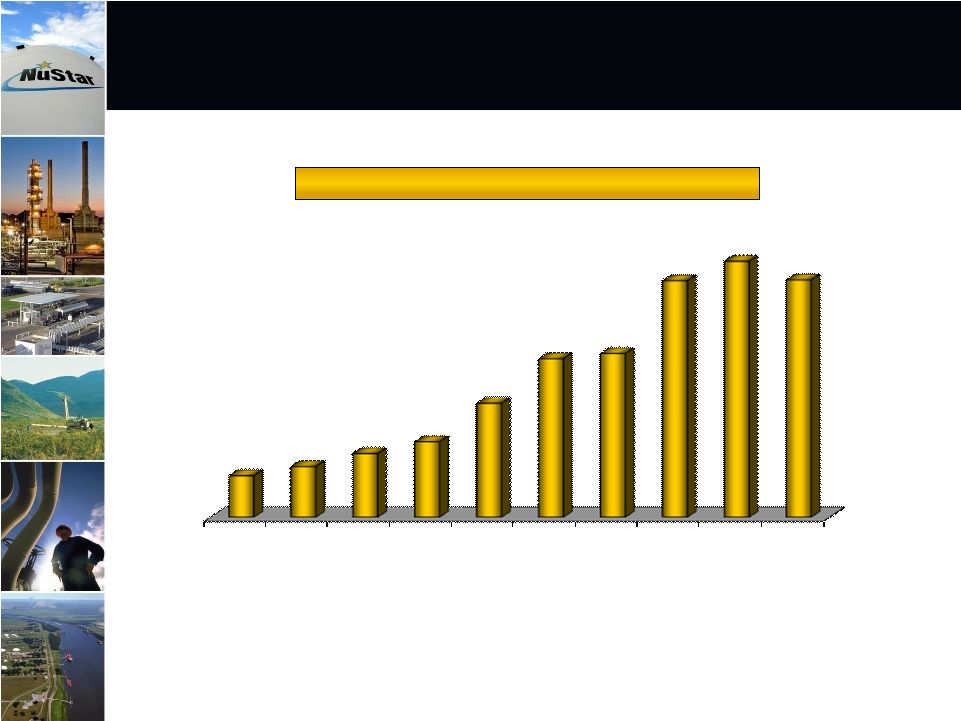 Historical Distributable Cash Flows
7
NS Distributable Cash Flows ($ in Millions)
2001
2002
2003
2004
2005
2006
2007
2008
2009
2010
$56
$68
$86
$102
$154
$214
$221
$319
$346
$320
•
2011
distributable
cash
flows
projected
to
be
higher
than
2009
levels |
 NuStar
Energy L.P.’s Distribution has been Covered
by the Non-Asphalt Operations Distributable Cash
Flows Since Asphalt Acquisition in March 2008
Jan 1, 2008 –
December 31, 2010
Non-Asphalt Operations Distributable Cash
Flows
$896.3*
Total Distribution
835.7
Excess Distributable Cash Flows
$60.6
% of Distribution Covered by
Non-Asphalt Operations Distributable Cash Flows
107%
Asphalt Operations Distributable Cash Flows
$88.5
* Includes transportation, storage and fuels marketing operations
8
(Dollars in Millions) |
 Transportation Segment
Overview
9 |
 2006
2007
2008
2009
2010
$170
$176
$186
$190
$199
10
2010 Transportation Segment Results Improved over 2009..
2011 EBITDA Expected to be lower than 2010
Transportation Segment EBITDA
(in Millions)
2010 Summary
Record EBITDA for transportation segment
Throughputs ~1% higher than 2009. Improving economy and customer turnaround
delayed into 2011.
Higher tariff revenue due to increased tariff rates and increased throughput
volumes on higher tariff long haul pipelines.
2011 Outlook
$1-$5 million of additional EBITDA from internal growth projects. Eagle
Ford shale crude project with Koch Pipeline Company should be
completed in mid-2011. Revised FERC Indexation adjustment of 2.65% takes
effect July 1, 2011. Tariffs projected to increase ~7% on July 1,
2011. Throughputs projected to be down ~4%. Heavy customer turnaround
schedule and changing market conditions could negatively impact
throughputs. Segment EBITDA expected to be $5-$10 million lower in
2011. |
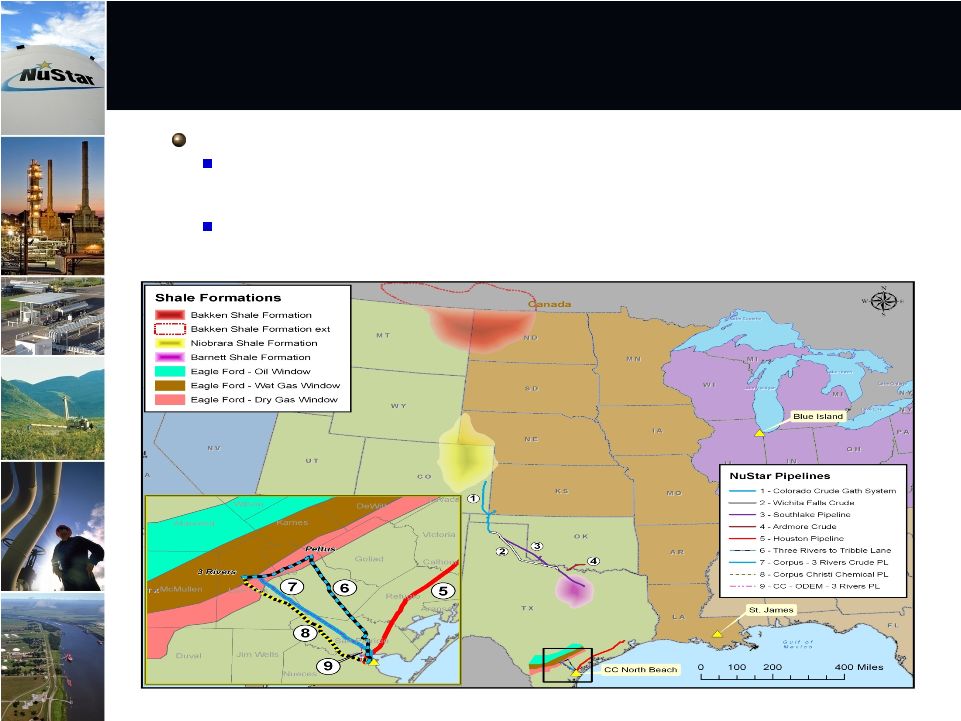 Transportation Segment Assets in close
proximity to key Shale Formations
Transportation Segment Assets in close
proximity to key Shale Formations
Shale Development Strategy
There are four key shale developments located in NuStar’s Mid-Continent and
Gulf Coast regions, including the Bakken, Niobrara, Barnett, and Eagle Ford
developments
Our strategy is to optimize and grow the existing asset base, and maximize the
value of the assets located in or near shale developments
11 |
 Storage Segment Overview
12 |
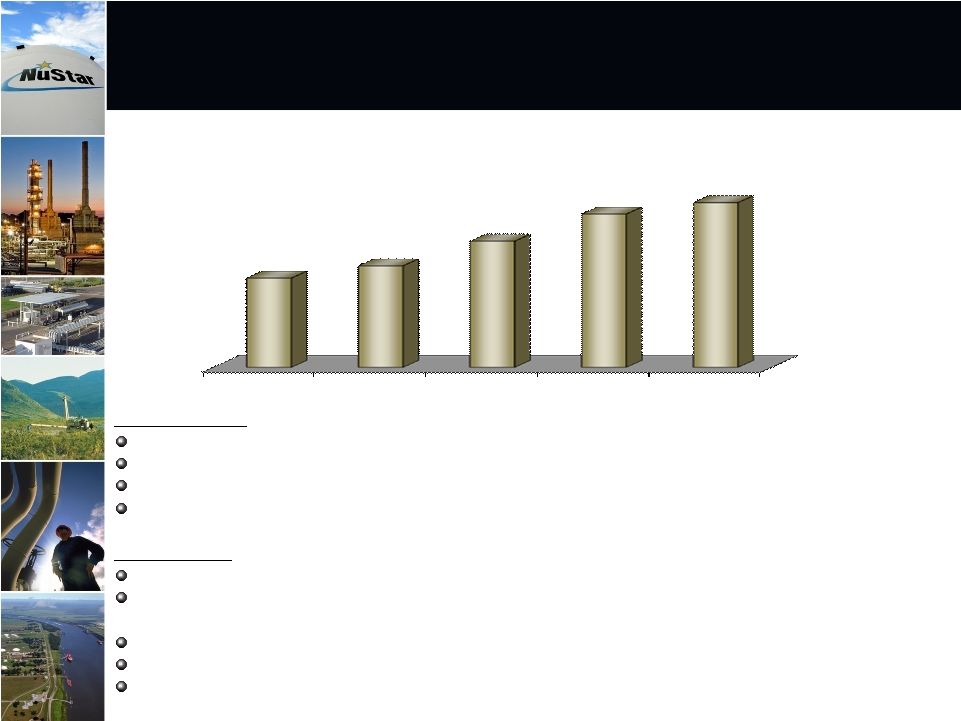 2010
Storage Segment Results Improved over 2009 ..2011 EBITDA Expected to be Higher
than 2010 13
Storage Segment EBITDA
(in Millions)
2010 Summary
Record EBITDA for Storage Segment
Storage
tank
renewals
and
escalations
increased
revenues
during
the
year.
Acquired three storage terminal facilities in Mobile, AL in May, 2010.
St.
Eustatius
terminal
reconfiguration
project
completed
in
4
th
quarter.
2011 Outlook
Demand for storage should remain strong
Expect to close on Joint Venture agreement related to two Turkey storage terminal
facilities in 1
st
quarter 2011.
Benefits
from
St.
James
Phase
1
storage
expansion
project
should
begin
in
3
rd
quarter
2011.
Full year of EBITDA from Mobile, AL acquisition and St. Eustatius terminal project. Segment EBITDA should be $30 to $40 million
higher. 2006
2007
2008
2009
2010
$162
$177
$208
$242
$256 |
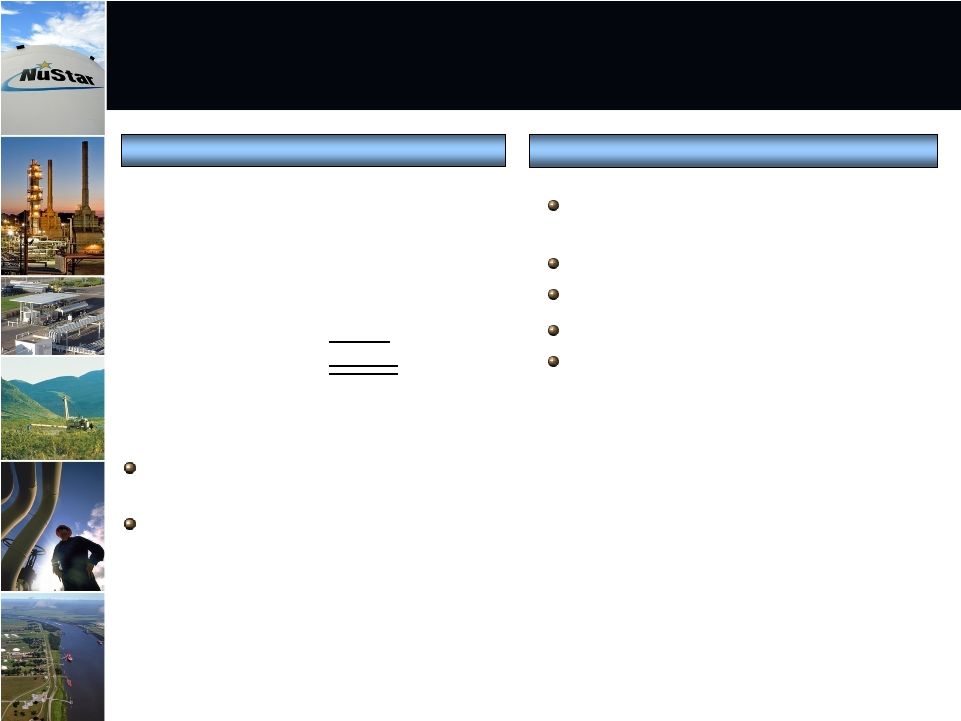
 Plan
to expand our St. James, Louisiana terminal in two phases
Phase 1 –
Third-Party Crude Oil Storage
Construct 3.2 million barrels of crude oil storage
Projected CAPEX of $125 to $145 million, with projected average annual
EBITDA of $15 to $25 million
Expected
in-service
3
rd
quarter
2011
Phase 2 –
Third-Party Crude Oil Storage
Project in early planning stages
Should be similar in size to Phase 1 project
Could grow in size based on customer demand
Expected in-service last half of 2012
14 |
 Plan
to construct new tanks for distillate service at our St. Eustatius
terminal Construct one million barrels of new storage for distillate
service Interested customers include several large oil companies
Projected CAPEX of $40 to $50 million, with projected average
annual EBITDA of $5 to $10 million
Expected
in-service
3
rd
quarter
2012
15 |
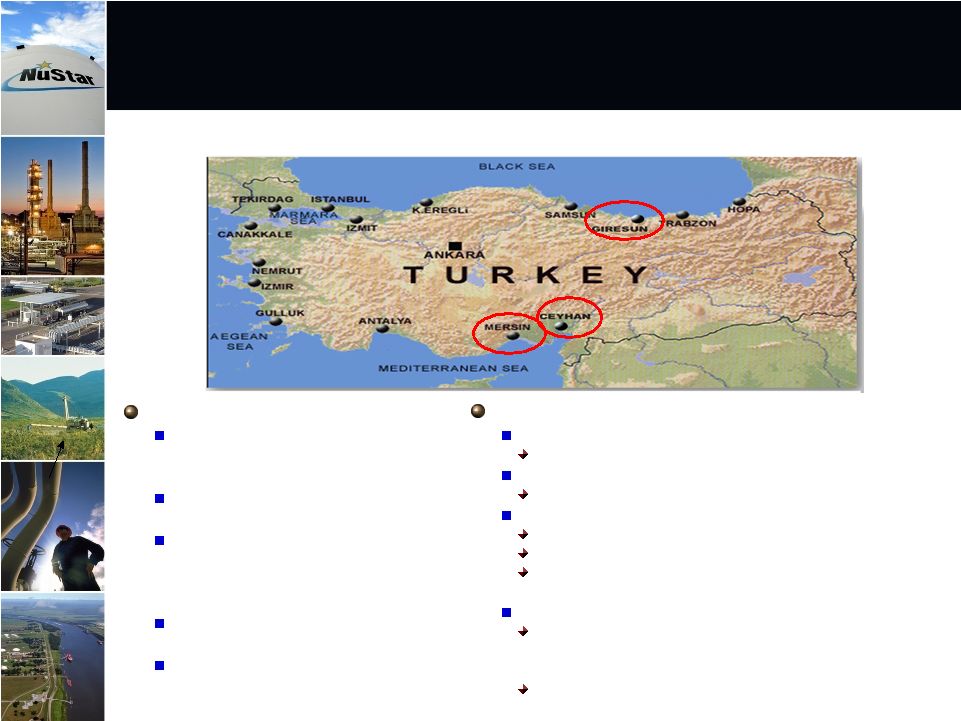 Joint Venture (JV) Overview
NuStar
entered into a JV agreement
with S-Oil and Aves Oil, two Turkish
companies.
Cost of buying stock in JV entity
~$54 million.
The JV should own 100% of two
terminals in Mersin and land in
Giresun
and Ceyhan. Estimated
terminal capacity 1.3 million barrels.
NuStar
should own 75% of the JV
and operate the terminals
Both terminals connect via pipeline
to an offshore platform (SAVKA) 5
km off the Turkish coastline
Upon
Projected
1
st
Quarter
2011
Closing,
Acquired
Assets in Turkey Provide Platform for Internal Growth
Growth Opportunities
Expansion project under development at Mersin
Expands existing storage by about 70 percent
Potential to tie into NATO Pipeline
Provides access to markets for military fuels
New terminal at Giresun
37-acre site with access to Black Sea ports
200,000 barrel fuel oil terminal under development
Second phase build-out to 1.9 million barrels under
evaluation
New terminal at Ceyhan
Ceyhan
is the destination for pipelines delivering
crude from northern Iraq and the Caspian area to
the Mediterranean
173 acre property is well-suited for building up to
6.3 million barrels of storage and marine jetty
16 |
 Asphalt & Fuels Marketing
Segment Overview
17 |
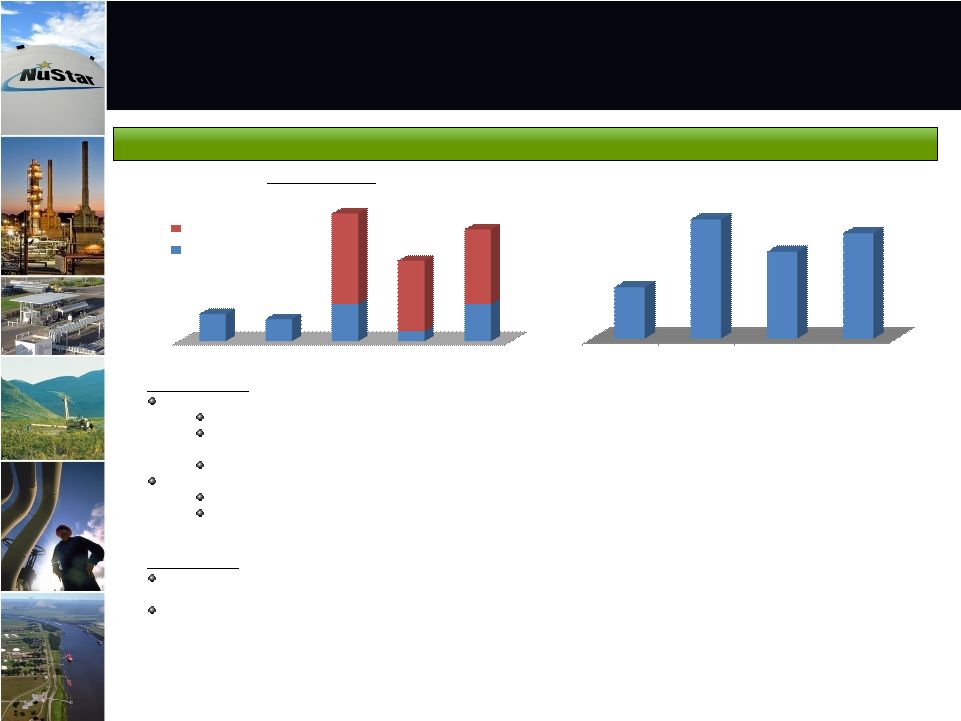 $27
$22
$37
$10
$37
$90
$70
$74
Asphalt
Fuels Marketing
$3.78
$8.75
$6.37
$7.73
Improved Earnings in Bunkering, Heavy Fuels and Asphalt Operations caused
Segment Results to be higher in 2010…
Segment Should See Slightly Improved Results in 2011
Asphalt & Fuels Marketing
U.S. East Coast Product Margin ($ per barrel)
18
2009
Actual
2008
Actual
2000-2007
Average
2010 Summary
Asphalt results slightly higher than 2009.
Total U.S. asphalt demand up ~1% through November.
During
the
3
quarter,
pipeline
disruptions
of
Canadian
crude
supply
reduced
heavy
crude
runs
in
the
Northeast
reducing asphalt supply.
NuStar
higher margin rack asphalt sales volumes were ~ 6% higher than 2009.
Fuels Marketing portion of segment $27 million higher than 2009.
Improved bunker marketing earnings at St. Eustatius and our Texas City facility
contributed to increased earnings. Increased Fuel Oil Trading business
at Texas City, also contributed to year-over-year increase.
•
Increase
primarily
attributable
to
internal
growth
project
coming
online
at
Texas
City
in
the
4
quarter
2011 Outlook
Continued
increase
in
asphalt
demand
and
tighter
Asphalt
supply
in
late
2011,
due
to
Conoco
Wood
River
coker
coming
on-line, should cause asphalt operations EBITDA to be slightly improved.
EBITDA in Fuels Marketing should be slightly higher than 2010.
•
Should
benefit
from
full-year
of
EBITDA
from
Fuel
Oil
trading
at
Texas
City.
EBITDA (MM$)
2010
Actual
2006
2007
2008
2009
2010
$80
$111
$127
th
th |
 Financial Overview
19 |
 20
12/31/10 Revolver Availability
NuStar Revolver Availability has increased due to
Equity Issuances and Senior Note Issuance –
Credit Ratings and Metrics have Improved as a Result
Total Bank Credit
$1,212
Less:
Borrowings
(188)
Letters of Credit
Go Zone Financing
(294)
Other
(5)
Revolver Availability
$725
Standard & Poor’s: BBB-
(Stable
Outlook)
Moody’s: Baa3 (Stable Outlook)
Fitch: BBB-
(Stable Outlook)
Debt/EBITDA (12/31/10): 4.6x
Debt/Capitalization (12/31/10): 44.2%
Credit Ratings/Metrics
(Dollars in Millions)
5.0x Revolver Debt/EBITDA covenant limits true Revolver availability to
~$200 million at 12/31/10
All three Rating Agencies upgraded NuStar to Stable Outlook from
Negative Outlook during 2010 |
 $1.2 billion Credit Facility
$188
GO Zone Bonds
290
NuStar
Logistics Notes (4.80%)
420
NuStar
Logistics Notes (7.65%)
349
NuStar
Logistics Notes (6.875%)
103
NuStar
Logistics Notes (6.05%)
237
NuStar
Pipeline Notes(5.875%)
255
NuStar
Pipeline Notes (7.75%)
259
Other Debt
36
Total Debt
$2,137
(Dollars in Millions)
No Significant Debt Maturities Until 2012
2011
$0.8
2012
$583*
2013
$493
2014
$0
2015
$0
Thereafter
$1,060
* Primarily includes maturity of $188 million revolver
balance and $362 million of senior notes
12/31/10 Debt Structure
12/31/10 Debt Structure Maturities
21
No significant debt maturities until 2012 at which time the revolver and some senior
notes become due
Forward interest rate swaps in place for $500 million of $830 million 2012 and 2013
senior note maturities
New Credit Revolver terms & pricing seem to be improving as economy
improves Current plan is to hold off closing on a new Revolver until
2012 Debt
structure
approximately
50%
fixed
rate
–
50%
variable
rate
No plans to issue additional debt or equity in 2011 |
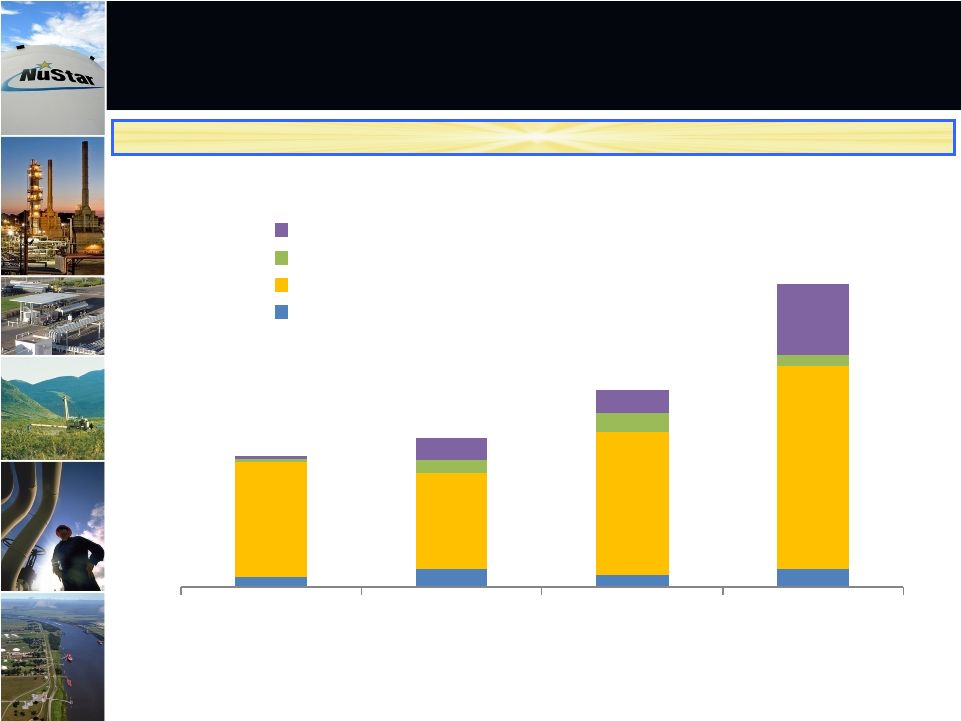 Majority of 2011 Internal Growth Capital
Will to be spent in the Storage Segment
22
(
Dollars in Millions)
Annual Internal Growth Spending By Business Segment
$11
$20
$13
$21
$128
$107
$159
$224
$3
$14
$20
$11
$4
$23
$27
$80
2008 Actual
2009 Actual
2010 Actual
2011 Forecast
Corporate
Asphalt & Fuels Marketing
Storage
Transportation
$164
$146
$219
$336 |
 High quality, large and diverse asset footprint supporting energy infrastructure
both in the U.S. and internationally
Contracted fee-based storage and transportation assets provide stable cash
flows, delivering 78% of 2010 operating income
Fourth largest independent liquids terminal operator in the world
Diverse and high quality customer base composed of large integrated oil companies,
national oil companies and refiners
Strong balance sheet, credit metrics and commitment to maintain investment grade
credit ratings
Lower cost of capital than majority of peers
Experienced and proven management team with substantial equity ownership and
industry experience
Recognized nationally for safety and environmental record as well as one of the
best places to work
Investment Highlights
23 |
 |
 25
Appendix |
 26
Reconciliation of Non-GAAP Financial Information:
EBITDA and Distributable Cash Flow
(Unaudited, Dollars in Thousands)
The following is a reconciliation of net income to EBITDA and distributable cash flow:
2001
2002
2003
2004
2005
2006
2007
2008
2009
2010
Net income
45,873
$
55,143
$
69,593
$
78,418
$
107,675
$
149,906
$
150,298
$
254,018
$
224,875
$
238,970
$
Plus interest expense, net
3,811
4,880
15,860
20,950
41,388
66,266
76,516
90,818
79,384
78,280
Plus income tax expense
-
395
-
-
4,713
5,861
11,448
11,006
10,531
11,741
Plus depreciation and amortization expense
13,390
16,440
26,267
33,149
64,895
100,266
114,293
135,709
145,743
153,802
EBITDA
63,074
76,858
111,720
132,517
218,671
322,299
352,555
491,551
460,533
482,793
Less equity earnings from joint ventures
3,179
3,188
2,416
1,344
2,319
5,882
6,833
8,030
9,615
10,500
Less interest expense, net
3,811
4,880
15,860
20,950
41,388
66,266
76,516
90,818
79,384
78,280
Less reliability capital expenditures
2,786
3,943
10,353
9,701
23,707
35,803
40,337
55,669
45,163
54,031
Less income tax expense
-
-
-
-
4,713
5,861
11,448
11,006
10,531
11,741
Plus mark-to-market impact on hedge transactions
-
-
-
-
-
-
3,131
(9,784)
19,970
(17,640)
Plus charges reimbursed by general partner
-
-
-
-
-
575
-
-
-
-
Plus distributions from joint ventures
2,874
3,590
2,803
1,373
4,657
5,141
544
2,835
9,700
9,625
Plus other non-cash items
-
-
-
-
2,672
-
-
-
-
-
Distributable cash flow
56,172
$
68,437
$
85,894
$
101,895
$
153,873
$
214,203
$
221,096
$
319,079
$
345,510
$
320,226
$
Note: 2005 and 2006 distributable cash flow and EBITDA are from continuing operations.
Year Ended December 31,
NuStar
Energy
L.P.
utilizes
two
financial
measures,
EBITDA
and
distributable
cash
flow,
which
are
not
defined
in
United
States
generally
accepted
accounting
principles
(GAAP).
Management
uses
these
financial
measures
because
they
are
a
widely
accepted
financial
indicators
used
by
investors
to
compare
partnership
performance.
In
addition,
management
believes
that
these
measures
provide
investors
an
enhanced
perspective
of
the
operating
performance
of
the
partnership's
assets
and
the
cash
that
the
business
is
generating.
Neither
EBITDA
nor
distributable
cash
flow
are
intended
to
represent
cash
flows
for
the
period,
nor
are
they
presented
as
an
alternative
to
net
income.
They
should not be considered in isolation or as a substitute for a measure of performance prepared in
accordance with GAAP. |
 Reconciliation of Non-GAAP Financial Information:
Transportation Segment
27
(Unaudited, Dollars in Thousands)
The following is a reconciliation of operating income to EBITDA for the
Transportation Segment: 2006
2007
2008
2009
2010
Operating income
122,714
$
126,508
$
135,086
$
139,869
$
148,571
$
Plus depreciation and amortization expense
47,145
49,946
50,749
50,528
50,617
EBITDA
169,859
$
176,454
$
185,835
$
190,397
$
199,188
$
Projected incremental operating income range
$ 1,000 -
4,000
Plus projected incremental depreciation and
amortization expense range
0 -
1,000
Projected incremental EBITDA range
$ 1,000 -
5,000
Projected decrease in operating income range
($ 5,500 -
11,000)
Plus projected incremental depreciation and
amortization expense range
500 -
1,000
Projected decrease in EBITDA range
($ 5,000 -
10,000)
EBITDA
in
the
following
reconciliations
relate
to
our
reportable
segments
or
a
portion
of
a
reportable
segment.
We
do
not
allocate
general
and
administrative
expenses
to
our
reportable
segments
because
those
expenses
relate
primarily
to
the
overall
management
at
the
entity
level.
Therefore,
EBITDA
reflected
in
the
following
reconciliations
excludes
any
allocation
of
general
and
administrative
expenses
consistent
with
our
policy
for
determining
segmental
operating
income,
the
most
directly
comparable
GAAP
measure.
EBITDA
should
not
be
considered
in
isolation
or
as
a
substitute
for
a
measure
of performance prepared in accordance with GAAP.
Transportation
Segment
Year Ended December 31,
The following is a reconciliation of projected decrease in operating income to
projected decrease in EBITDA for the year ended December 31, 2011 compared
to the year ended December 31, 2010: The following is a reconciliation of
projected incremental operating income to projected incremental EBITDA related to our internal growth program
for the year ended December 31, 2011 compared to the year ended December 31,
2010: Transportation
Segment |
 Reconciliation of Non-GAAP Financial Information:
Storage Segment
28
(Unaudited, Dollars in Thousands)
The following is a reconciliation of operating income to EBITDA for the Storage
Segment: 2006
2007
2008
2009
2010
Operating income
108,486
$
114,635
$
141,079
$
171,245
$
178,947
$
Plus depreciation and amortization expense
53,121
62,317
66,706
70,888
77,071
EBITDA
161,607
$
176,952
$
207,785
$
242,133
$
256,018
$
Projected incremental operating income range
$ 25,000 -
34,000
Plus projected incremental depreciation and
amortization expense range
5,000 -
6,000
Projected incremental EBITDA range
$ 30,000 -
40,000
St. James, LA
Terminal
Expansion
Phase 1
St. Eustatius
Distillate
Project
Projected annual operating income range
$ 11,000 -
20,000
$ 4,000 -
8,000
Plus projected annual depreciation and
amortization expense range
4,000 -
5,000
1,000 -
2,000
Projected annual EBITDA range
$ 15,000 -
25,000
$ 5,000 -
10,000
The
following
is
a
reconciliation
of
projected
annual
operating
income
to
projected
annual
EBITDA
for
certain
projects
in
our
storage
segment
related
to our internal growth program:
The
following
is
a
reconciliation
of
projected
incremental
operating
income
to
projected
incremental
EBITDA
related
to
our
internal
growth
program
for
the year ended December 31, 2011 compared to the year ended December 31,
2010: Storage
Segment
EBITDA
in
the
following
reconciliations
relate
to
our
reportable
segments
or
a
portion
of
a
reportable
segment.
We
do
not
allocate
general
and
administrative
expenses
to
our
reportable
segments
because
those
expenses
relate
primarily
to
the
overall
management
at
the
entity
level.
Therefore,
EBITDA
reflected
in
the
following
reconciliations
excludes
any
allocation
of
general
and
administrative
expenses
consistent
with
our
policy
for
determining
segmental
operating
income,
the
most
directly
comparable
GAAP
measure.
EBITDA
should
not
be
considered
in
isolation
or
as
a
substitute
for
a
measure
of
performance
prepared in accordance with GAAP.
Year Ended December 31, |
 Reconciliation of Non-GAAP Financial Information:
Asphalt & Fuels Marketing Segment
29
(Unaudited, Dollars in Thousands)
Asphalt
Operations
Fuels
Marketing
Operations
Asphalt and
Fuels Marketing
Segment
Operating income
53,977
$
36,884
$
90,861
$
Plus depreciation and amortization expense
20,164
93
20,257
EBITDA
74,141
$
36,977
$
111,118
$
Asphalt
Operations
Fuels
Marketing
Operations
Asphalt and
Fuels Marketing
Segment
Operating income
50,710
$
9,919
$
60,629
$
Plus depreciation and amortization expense
19,463
-
19,463
EBITDA
70,173
$
9,919
$
80,092
$
Year Ended
December 31, 2007
Year Ended
December 31, 2006
Asphalt
Operations
Fuels
Marketing
Operations
Asphalt and
Fuels Marketing
Segment
Asphalt and Fuels
Marketing
Segment
Asphalt and Fuels
Marketing
Segment
Operating income
76,267
$
36,239
$
112,506
$
21,111
$
26,815
$
Plus depreciation and amortization expense
14,182
552
14,734
423
-
EBITDA
90,449
$
36,791
$
127,240
$
21,534
$
26,815
$
Year Ended December 31, 2010
Year Ended December 31, 2009
Year Ended December 31, 2008
The following tables reconcile operating income to EBITDA for asphalt operations and fuels marketing
operations in our asphalt and fuels marketing segment: EBITDA
in
the
following
reconciliations
relate
to
our
reportable
segments
or
a
portion
of
a
reportable
segment.
We
do
not
allocate
general
and
administrative
expenses
to
our
reportable
segments
because
those
expenses
relate
primarily
to
the
overall
management
at
the
entity
level.
Therefore,
EBITDA
reflected
in
the
following
reconciliations
excludes
any
allocation
of
general
and
administrative
expenses
consistent
with
our
policy
for
determining
segmental
operating
income,
the
most
directly
comparable
GAAP
measure.
EBITDA should not be considered in isolation or as a substitute for a measure of performance prepared
in accordance with GAAP. |
 Reconciliation of Non-GAAP Financial Information:
Asphalt Operations Distributable Cash Flow
30
(Unaudited, Dollars in Thousands)
2010
2009
2008
Total
Asphalt operations operating income
53,977
$
50,710
$
76,267
$
180,954
$
Plus depreciation and amortization
20,164
19,463
14,182
53,809
Asphalt operations EBITDA
74,141
70,173
90,449
234,763
Less general & administrative expense
19,954
16,105
18,640
54,699
Less interest expense
27,851
26,056
20,150
74,057
Less income tax expense
120
489
0
609
Less reliability capital expenditures
5,790
6,962
4,126
16,878
Asphalt operations distributable cash flow
20,426
$
20,561
$
47,533
$
88,520
$
EBITDA
in
the
following
reconciliations
relate
to
our
reportable
segments
or
a
portion
of
a
reportable
segment.
We
do
not
allocate
general
and
administrative
expenses
to
our
reportable
segments
because
those
expenses
relate
primarily
to
the
overall
management
at
the
entity
level.
Therefore,
EBITDA
reflected
in
the
following
reconciliations
excludes
any
allocation
of
general
and
administrative
expenses
consistent
with
our
policy
for
determining
segmental
operating
income,
the
most
directly
comparable
GAAP
measure.
EBITDA
should
not
be
considered
in
isolation
or
as
a
substitute
for
a
measure
of
performance
prepared
in accordance with GAAP.
The
following
is
a
reconciliation
of
operating
income
to
projected
annual
adjusted
EBITDA
for
certain
projects
in
our
storage
segment
related
to
our
internal growth program:
Allocated to asphalt operations for
distributable cash flow purposes:
Year Ended December 31, |