Attached files
| file | filename |
|---|---|
| 8-K - GOLUB CAPITAL BDC, Inc. | v210286_8k.htm |
Golub Capital BDC, Inc. First Quarter 2011 Investor
Presentation
Important Notice This presentation contains “forward
looking statements” within the meaning of Section 21E of the Securities Exchange
Act of 1934, as amended, that are subject to risks and uncertainties . Actual
outcomes and results could differ materially from those suggested by this
presentation due to the impact of many factors beyond the control of Golub
Capital BDC, Inc., including those listed in the “Risk Factors” section of our
filings with the Securities and Exchange Commission (“SEC”) . Any such forward
-looking statements are made pursuant to the safe harbor provisions available
under applicable securities laws, and Golub Capital BDC, Inc. assumes no
obligation to update or revise any such forward -looking statements
. The following slides contain summaries
of certain financial and statistical information about Golub Capital BDC, Inc.
The information contained in this presentation is summary information that is
intended to be considered in the context of our SEC filings and other public
announcements that we may make, by press release or otherwise, from time to
time. We undertake no duty or obligation to publicly update or review the
information contained in this presentation . In addition, information related to
past performance, while helpful as an evaluative tool, is not necessarily
indicative of future results, the achievement of which cannot be assured . You
should not view the past performance of Golub Capital BDC, Inc., as indicative
of Golub Capital BDC, Inc.’s future results . This presentation does not
constitute an offer to sell or the solicitation of an offer to buy any
securities of Golub Capital BDC, Inc.
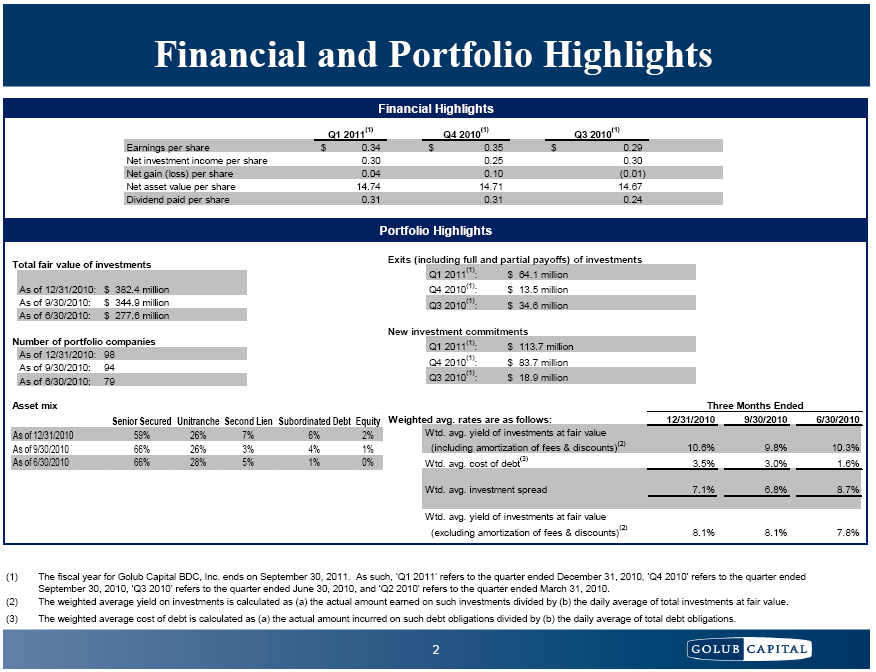
Financial and Portfolio
Highlights
Financial Highlights Q1 2011(1)
Q4 2010(1)
Q3 2010(1)
Earnings per share $ 0.34 $ 0.35 $
0.29 Net investment income per share 0.30 0.25 0.30 Net gain (loss) per share
0.04 0.10 (0.01) Net asset value per share 14.74 14.71 14.67 Dividend paid per
share 0.31 0.31 0.24 Portfolio Highlights Total fair value of
investments
As of 12/31/2010: $ 382.4 million
As of 9/30/2010: $ 344.9 million As of 6/30/2010: $ 277.6 million Number of portfolio
companies
As of 12/31/2010: 98 As of
9/30/2010: 94 As of 6/30/2010: 79 Exits (including full and partial
payoffs) of investments Q1 2011(1): $ 64.1 million Q4 2010(1): $ 13.5 million Q3 2010(1): $ 34.6 million New investment commitments Q1 2011(1): $ 113.7 million Q4 2010(1): $ 83.7 million Q3 2010(1): $ 18.9 million Asset mix Senior Secured Unitranche Second Lien
Subordinated Debt Equity As of 12/31/2010 59% 26% 7% 6% 2% As of
9/30/2010 66% 26% 3% 4% 1% As of 6/30/2010 66% 28% 5% 1% 0% Three Months Ended Weighted avg. rates
are as follows: 12/31/2010 9/30/2010 6/30/2010 Wtd. avg. yield of investments at fair
value (including amortization of fees &
discounts) (2) 10.6% 9.8% 10.3% Wtd. avg. cost of debt(3)
3.5% 3.0% 1.6% Wtd. avg. investment spread 7.1% 6.8%
8.7% Wtd. avg. yield of investments at fair
value (excluding amortization of fees &
discounts) (2) 8.1% 8.1% 7.8% (1) The fiscal year for Golub Capital
BDC, Inc. ends on September 30, 2011. As such, ‘Q1 2011’ refers to the quarter
ended December 31, 2010, ‘Q4 2010’ refers to the quarter ended September 30,
2010, ‘Q3 2010’ refers to the quarter ended June 30, 2010, and ‘Q2 2010’ refers
to the quarter ended March 31, 2010. (2) The weighted average yield on
investments is calculated as (a) the actual amount earned on such investments
divided by (b) the daily average of total investments at fair value. (3) The
weighted average cost of debt is calculated as (a) the actual amount incurred on
such debt obligations divided by (b) the daily average of total debt
obligations.
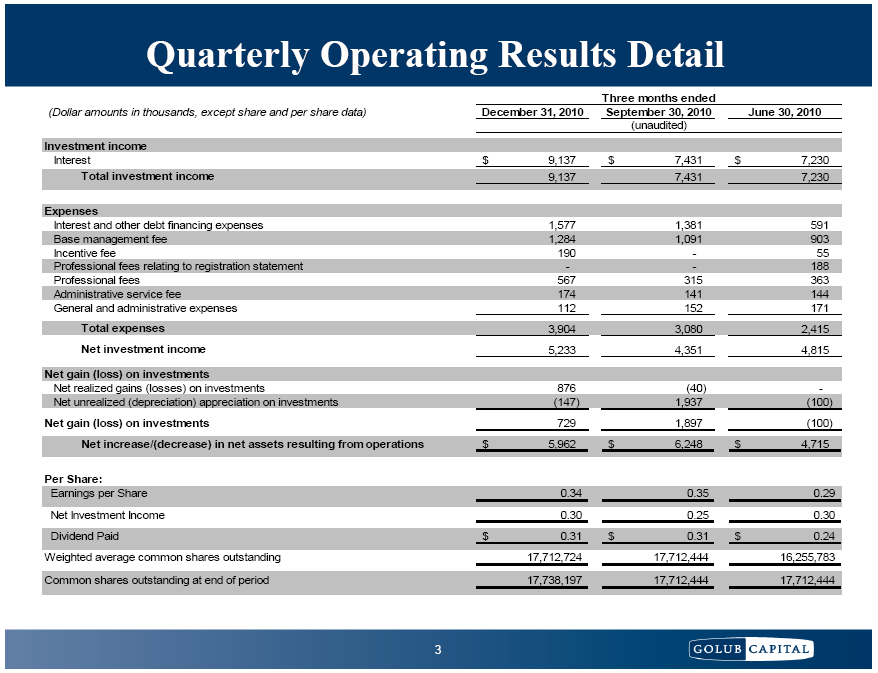
Quarterly Operating Results
Detail Three months ended (Dollar amounts in thousands, except
share and per share data) December 31, 2010 September 30, 2010
June 30, 2010
(unaudited) Investment income Interest $ 9,137 $ 7,431 $
7,230 Total investment income 9,137 7,431 7,230 Expenses Interest and other debt financing
expenses 1,577 1,381 591 Base management fee 1,284 1,091 903 Incentive fee 190 -
55 Professional fees relating to registration statement - - 188 Professional
fees 567 315 363 Administrative service fee 174 141 144 General and
administrative expenses 112 152 171 Total expenses 3,904 3,080 2,415 Net investment income 5,233 4,351 4,815 Net gain (loss) on
investments
Net realized gains (losses) on
investments 876 (40) -Net unrealized (depreciation) appreciation on investments
(147) 1,937 (100) Net gain (loss) on investments
729 1,897 (100)
Net increase/(decrease) in
net assets resulting from operations $ 5,962 $ 6,248 $ 4,715 Per Share: Earnings per Share 0.34 0.35 0.29 Net
Investment Income 0.30 0.25 0.30 Dividend Paid $ 0.31 $ 0.31 $ 0.24 Weighted
average common shares outstanding 17,712,724 17,712,444 16,255,783 Common shares outstanding at end of
period 17,738,197 17,712,444 17,712,444
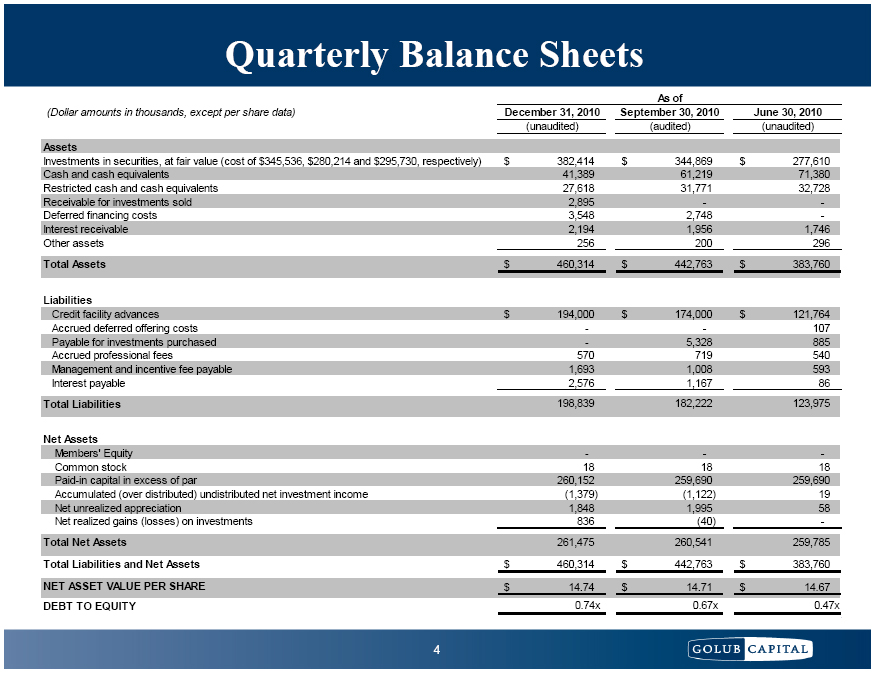
Quarterly Balance Sheets As of (Dollar amounts in thousands, except per
share data) December 31,
2010 September 30, 2010 June 30, 2010 (unaudited) (audited)
(unaudited)
Assets Investments in securities, at fair value
(cost of $345,536, $280,214 and $295,730, respectively) $ 382,414 $ 344,869 $
277,610 Cash and cash equivalents 41,389 61,219 71,380 Restricted cash and cash
equivalents 27,618 31,771 32,728 Receivable for investments sold 2,895 -
-Deferred financing costs 3,548 2,748 -Interest receivable 2,194 1,956 1,746
Other assets 256 200 296 Total Assets $ 460,314 $ 442,763 $
383,760 Liabilities Credit facility advances $ 194,000 $
174,000 $ 121,764 Accrued deferred offering costs - - 107 Payable for
investments purchased - 5,328 885 Accrued professional fees 570 719 540
Management and incentive fee payable 1,693 1,008 593 Interest payable 2,576
1,167 86 Total
Liabilities 198,839 182,222
123,975 Net Assets Members' Equity - - -Common stock 18 18
18 Paid-in capital in excess of par 260,152 259,690 259,690 Accumulated (over
distributed) undistributed net investment income (1,379) (1,122) 19 Net
unrealized appreciation 1,848 1,995 58 Net realized gains (losses) on
investments 836 (40) -Total
Net Assets 261,475 260,541
259,785 Total Liabilities and Net Assets
$ 460,314 $ 442,763 $
383,760 NET ASSET VALUE PER
SHARE $ 14.74 $ 14.71 $
14.67 DEBT TO EQUITY 0.74x 0.67x 0.47x
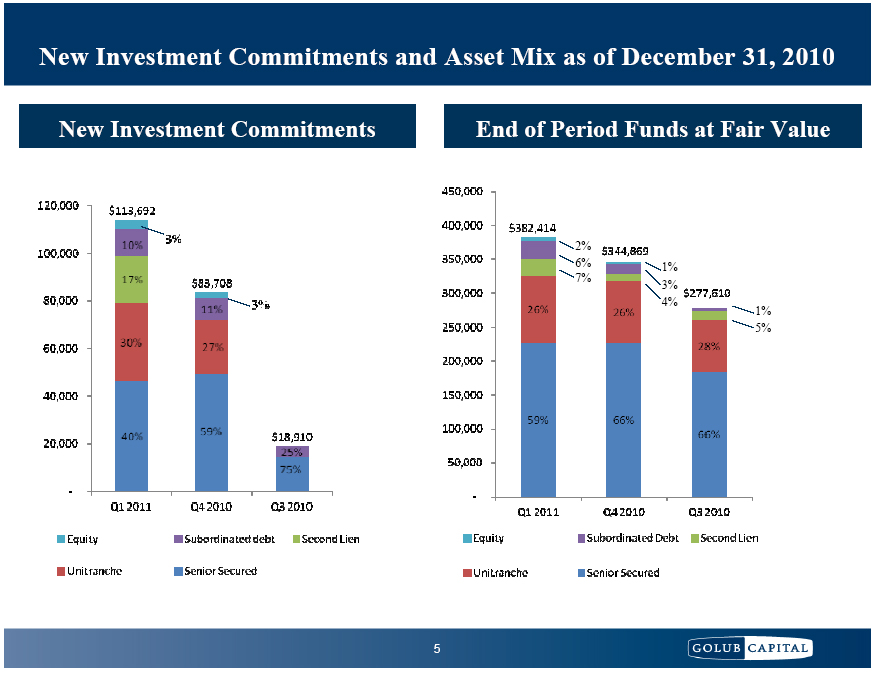
New Investment Commitments and Asset Mix
as of December 31, 2010 New Investment Commitments End of Period
Funds at Fair Value 2% 6% 1% 7% 3% 4% 1% 5%
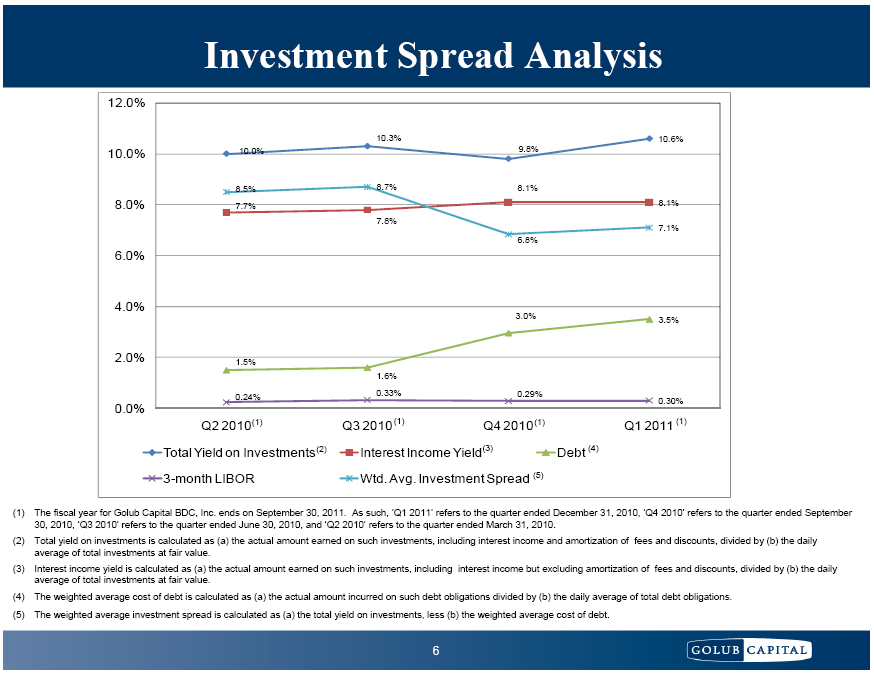
Investment Spread Analysis 12.0% 10.3% 10.6% 10.0% 10.0% 9.8% 8.5% 8.7% 8.1% 8.0% 7.7% 8.1% 7.8% 7.1%
6.8% 6.0% 4.0% 3.0% 3.5% 2.0% 1.5% 1.6% 0.33% 0.29% 0.24% 0.30% 0.0%
Q2 2010 (1) Q3 2010 (1) Q4 2010 (1) Q1
2011 (1) Total Yield on Investments (2) Interest Income Yield(3) Debt (4)
3-month LIBOR Wtd. Avg. Investment Spread (5) (1) The fiscal year for Golub Capital
BDC, Inc. ends on September 30, 2011. As such, ‘Q1 2011’ refers to the quarter
ended December 31, 2010, ‘Q4 2010’ refers to the quarter ended September 30,
2010, ‘Q3 2010’ refers to the quarter ended June 30, 2010, and ‘Q2 2010’ refers
to the quarter ended March 31, 2010. (2) Total yield on investments is
calculated as (a) the actual amount earned on such investments, including
interest income and amortization of fees and discounts, divided by (b) the daily
average of total investments at fair value. (3) Interest income yield is
calculated as (a) the actual amount earned on such investments, including
interest income but excluding amortization of fees and discounts, divided by (b)
the daily average of total investments at fair value. (4) The weighted average
cost of debt is calculated as (a) the actual amount incurred on such debt
obligations divided by (b) the daily average of total debt obligations
. (5) The weighted average investment
spread is calculated as (a) the total yield on investments, less (b) the
weighted average cost of debt.
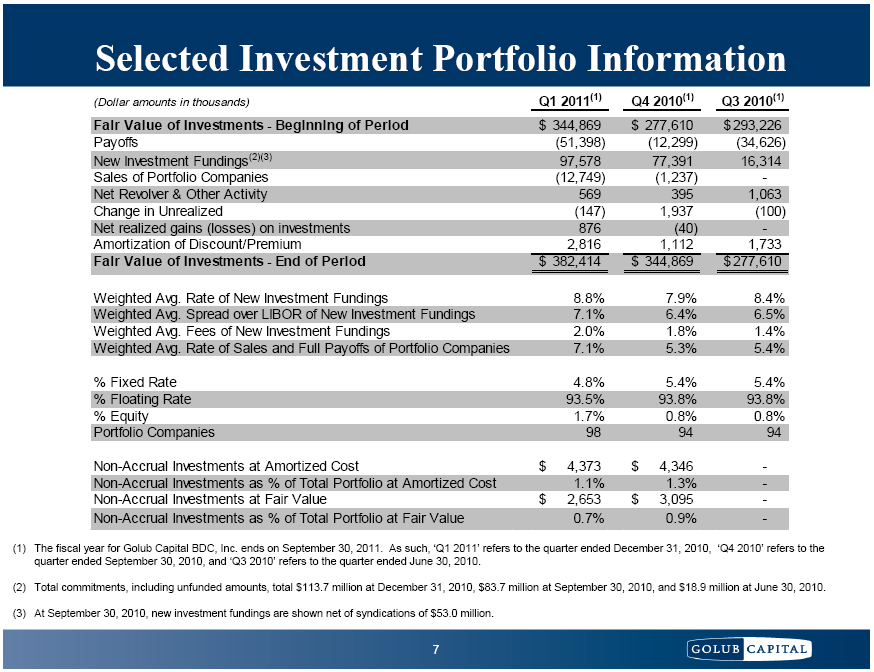
Selected Investment Portfolio
Information
(Dollar amounts in thousands)
Q1 2011(1)
Q4 2010(1)
Q3 2010(1)
Fair Value of Investments -
Beginning of Period $
344,869 $ 277,610 $ 293,226 Payoffs (51,398) (12,299) (34,626) New Investment
Fundings (2)(3) 97,578 77,391 16,314 Sales of Portfolio Companies (12,749)
(1,237) -Net Revolver & Other Activity 569 395 1,063 Change in Unrealized
(147) 1,937 (100) Net realized gains (losses) on investments 876 (40)
-Amortization of Discount/Premium 2,816 1,112 1,733 Fair Value of Investments - End of
Period $ 382,414 $ 344,869
$ 277,610
Weighted Avg. Rate of New
Investment Fundings 8.8% 7.9% 8.4% Weighted Avg. Spread over LIBOR of New
Investment Fundings 7.1% 6.4% 6.5% Weighted Avg. Fees of New Investment Fundings
2.0% 1.8% 1.4% Weighted Avg. Rate of Sales and Full Payoffs of Portfolio
Companies 7.1% 5.3% 5.4% % Fixed Rate 4.8% 5.4% 5.4% % Floating Rate 93.5% 93.8% 93.8% %
Equity 1.7% 0.8% 0.8% Portfolio Companies 98 94 94 Non-Accrual Investments at Amortized
Cost $ 4,373 $ 4,346 -Non-Accrual Investments as % of Total Portfolio at
Amortized Cost 1.1% 1.3% -Non-Accrual Investments at Fair Value $ 2,653 $ 3,095
-Non-Accrual Investments as % of Total Portfolio at Fair Value 0.7% 0.9%
- (1) The fiscal year for Golub Capital
BDC, Inc. ends on September 30, 2011. As such, ‘Q1 2011’ refers to the quarter
ended December 31, 2010, ‘Q4 2010’ refers to the quarter ended September 30,
2010, and ‘Q3 2010’ refers to the quarter ended June 30, 2010. (2) Total commitments, including
unfunded amounts, total $113.7 million at December 31, 2010, $83.7 million at
September 30, 2010, and $18.9 million at June 30, 2010. (3) At September 30, 2010, new
investment fundings are shown net of syndications of $53.0
million.
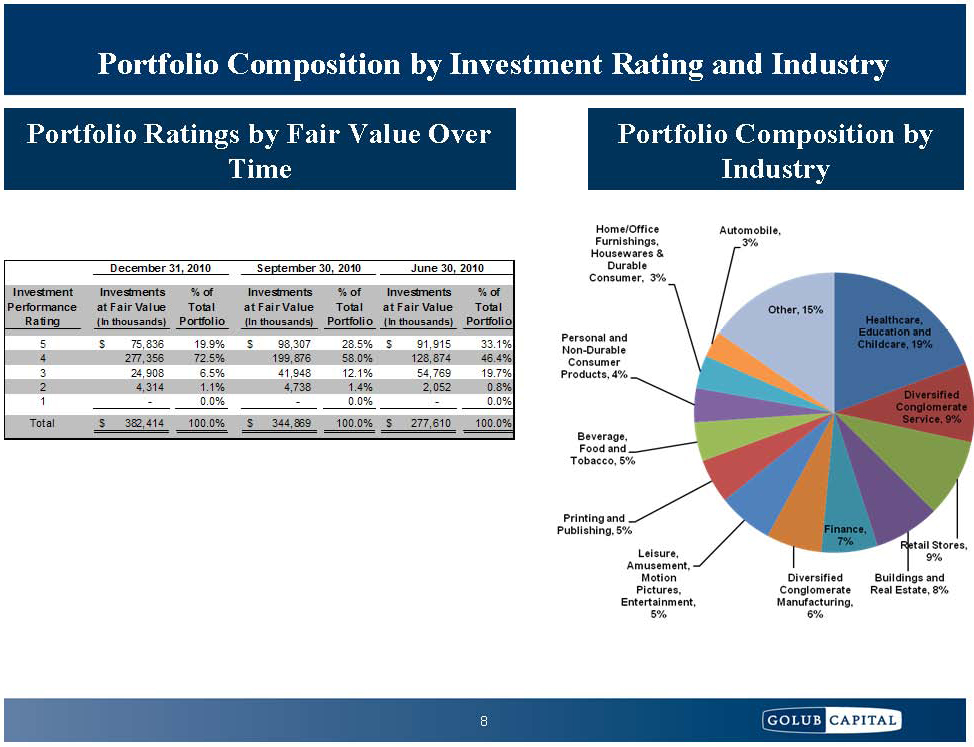
Portfolio Composition by Investment Rating and
Industry Portfolio Ratings by Fair Value Over
Portfolio Composition by Time Industry December 31, 2010 September 30, 2010
June 30, 2010
Investment Investments % of
Investments % of Investments % of Performance at Fair Value Total at Fair Value
Total at Fair Value Total Rating (In thousands) Portfolio (In thousands)
Portfolio (In thousands) Portfolio 5 $ 75,836 19.9% $ 98,307 28.5% $ 91,915
33.1% 4 277,356 72.5% 199,876 58.0% 128,874
46.4% 3 24,908 6.5% 41,948 12.1% 54,769
19.7% 2 4,314 1.1% 4,738 1.4% 2,052
0.8% 1 - 0.0% - 0.0% - 0.0% Total $ 382,414
100.0% $ 344,869 100.0% $ 277,610 100.0%
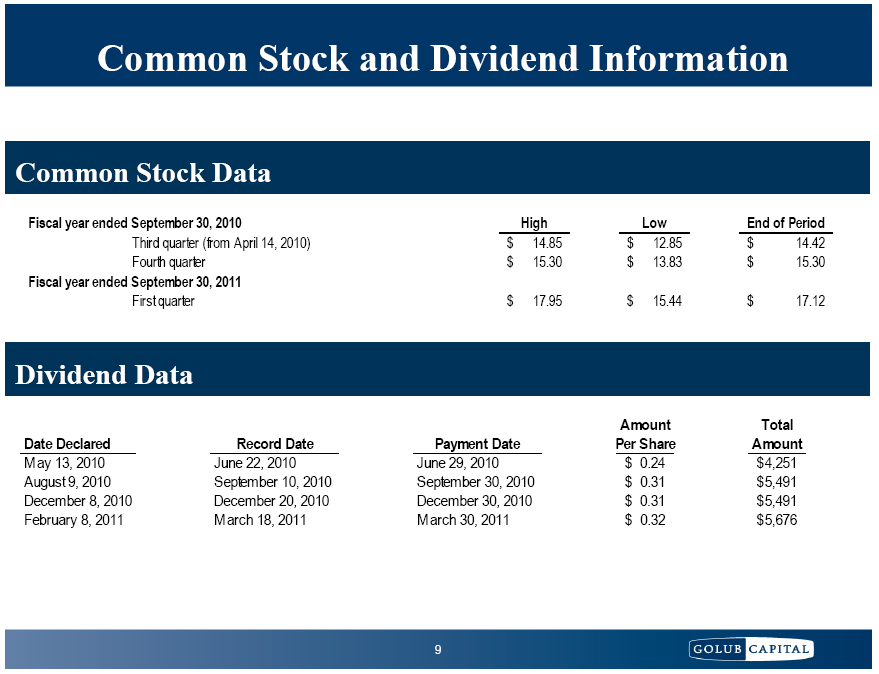
Common Stock and Dividend
Information
Common Stock Data Fiscal year ended September 30, 2010
High Low End of Period Third quarter (from April 14, 2010) $
14.85 $ 12.85 $ 14.42 Fourth quarter $ 15.30 $ 13.83 $ 15.30 Fiscal year ended September 30,
2011 First quarter $ 17.95 $ 15.44 $
17.12 Dividend Data Amount Total Date Declared Record Date
Payment Date Per Share Amount May 13, 2010 June 22, 2010 June 29, 2010
$ 0.24 $ 4,251 August 9, 2010 September 10, 2010 September 30, 2010 $ 0.31 $
5,491 December 8, 2010 December 20, 2010 December 30, 2010 $ 0.31 $ 5,491
February 8, 2011 March 18, 2011 M arch 30, 2011 $ 0.32 $
5,676
Liquidity and Investment
Capacity aCash and cash equivalents totaled $41.4
million as of December 31, 2010. aRestricted cash and cash equivalents
totaled $27.6 million as of December 31, 2010. Restricted cash is available for
investment for deals that qualify for our securitization vehicle. aLiquid
broadly syndicated loans totaled $34.9 million as of December 31, 2010. We
anticipate selling these loans in future periods as we find new opportunities to
deploy capital. aWe have $28.3 million in available debt
commitments from the SBA as December 31, 2010. These commitments may be drawn
upon subject to customary SBA procedures.