Attached files
| file | filename |
|---|---|
| 8-K - FORM 8-K - MOSAIC CO | d8k.htm |
 The Mosaic
Company Goldman Sachs Fifteenth Annual Agricultural Biotech Forum
February 9, 2011
Larry Stranghoener
Executive Vice President and Chief Financial Officer
Exhibit 99.1 |
| Good morning everyone. I’m delighted to have the opportunity
to speak with you today about Mosaic, our strong market
position
in
both
potash
and
phosphate
and
the
outstanding
long-term
outlook
for
the
crop
nutrient
industry.
We’d like to thank Bob Koort
and Lindsey Drucker
Mann
for coverage of the sector and sponsoring this conference.
This is a great time to be in the ag
business. The world needs crop nutrients to meet food demand and Mosaic is
positioned to capitalize on this long-term opportunity.
|
 This presentation
contains forward-looking statements within the meaning of the Private Securities Litigation Reform Act of 1995. Such
statements include, but are not limited to, statements about future strategic plans and other
statements about future financial and operating results, including statements about the
proposed split-off by Cargill, Incorporated of its equity interest in The Mosaic Company and related
transactions
(the
“Split-Off”),
the
terms
and
effects
of
the
proposed
Split-Off,
the
nature
and
impact
of
the
proposed
Split-Off
and
benefits
of
the proposed Split-Off. Such statements are based upon the current beliefs and expectations
of The Mosaic Company’s management and are subject to significant risks and
uncertainties. These risks and uncertainties include but are not limited to risks and uncertainties arising
from the predictability and volatility of, and customer expectations about, agriculture, fertilizer,
raw material, energy and transportation markets that are subject to competitive and other
pressures and economic and credit market conditions; the level of inventories in the
distribution channels for crop nutrients; changes in foreign currency and exchange rates;
international trade risks; changes in government policy; changes in environmental and other
governmental regulation, including greenhouse gas regulation and implementation of the U.S.
Environmental
Protection
Agency’s
numeric
water
quality
standards
for
the
discharge
of
nutrients
into
Florida
lakes
and
streams;
further
developments in the lawsuit involving the federal wetlands permit for the extension of the
Company’s South Fort Meade, Florida, mine into Hardee
County,
including
orders,
rulings,
injunctions
or
other
actions
by
the
court
or
actions
by
the
plaintiffs,
the
Army
Corps
of
Engineers
or
others
in
relation
to
the
lawsuit,
or
any
actions
the
Company
may
identify
and
implement
in
an
effort
to
mitigate
the
effects
of
the
lawsuit;
other
difficulties
or
delays
in
receiving,
or
increased
costs
of,
or
revocation
of,
necessary
governmental
permits
or
approvals;
the
effectiveness of the Company’s processes for managing its strategic priorities; adverse weather
conditions affecting operations in Central Florida
or
the
Gulf
Coast
of
the
United
States,
including
potential
hurricanes
or
excess
rainfall;
actual
costs
of
various
items
differing
from
management’s current estimates, including, among others, asset retirement, environmental
remediation, reclamation or other environmental obligations, or Canadian resource taxes and
royalties; accidents and other disruptions involving Mosaic’s operations, including brine
inflows at its Esterhazy, Saskatchewan, potash mine and other potential mine fires, floods, explosions, seismic events or
releases of hazardous or volatile chemicals; the possibility that the expected timeline for the
proposed Split-Off may be delayed or the proposed Split-Off may not occur, or that
there may be difficulties with realizing the benefits of the proposed Split-Off; and other risks and
uncertainties reported from time to time in The Mosaic Company’s reports filed with the
Securities and Exchange Commission. Actual results may differ from those set forth in the
forward-looking statements. Safe Harbor Statement
2 |
| Before I proceed, I would like to remind you that our presentation
contains forward-looking statements. The statements include, but
are not limited to, statements about future financial and operating results. They are based upon
management’s beliefs and expectations as of today’s date, February 9, 2011
and are subject to significant risks and uncertainties. Actual results
may differ materially from those projected in the forward-looking statements. Additional
information concerning factors that could cause actual results to differ materially
from those in the forward-looking statements is included in our reports
filed with the Securities and Exchange Commission. |
 In connection with
the proposed Split-Off, a registration statement on Form S-4 that has been filed with the
Securities and Exchange Commission includes a preliminary proxy statement/prospectus for the
stockholders of The Mosaic Company.
The Mosaic Company will mail the final proxy statement/prospectus to its
stockholders.
INVESTORS AND SECURITY HOLDERS ARE ADVISED TO READ THE PROXY STATEMENT
WHEN IT BECOMES AVAILABLE. IT WILL CONTAIN IMPORTANT INFORMATION.
Investors and security
holders may obtain a free copy of the proxy statement (when available) and other documents filed by
The Mosaic Company at the Securities and Exchange Commission’s web site at
http://www.sec.gov. Certain Information Regarding Participants:
The Mosaic Company and its directors, executive officers and other members of its management and
employees may be deemed to be participants in the solicitation of proxies from its
stockholders in connection with the proposed Split-Off.
Information concerning the interests of The Mosaic Company’s participants in the
solicitation is set forth in The Mosaic Company’s proxy statements and Annual Reports on Form
10-K, previously filed with the Securities and Exchange Commission, and in the proxy
statement relating to the Split- Off when it becomes available.
Important Information
3 |
| Slide three summarizes important information about the proxy
statement/prospectus that we have filed with the SEC in preliminary form and
that you should read when available in final form. |
 Introduction
•
Strategic overview
–
Mosaic is the leading P&K company in the world
–
Orderly distribution of shares held by Cargill
•
Business overview
–
Potash growth through expansions
–
Largest
integrated
phosphate
producer
–
low
cost
and geographic advantage
•
Market outlook
–
Crop nutrient markets extremely tight due to a
variety of supply and demand factors
–
Healthy farmer economics support continued
investment in crop nutrients
4 |
| This morning I will first review Mosaic’s strategy. We are
very upbeat about the long-term fundamentals of our business and continue
to position ourselves for the growth of this sector. I’ll also provide a
brief overview of the recently announced plan to work with Cargill for an orderly distribution of its
Mosaic shares.
Next, I will review each of our two business lines.
Finally, I will discuss our market outlook and today’s favorable
conditions. |
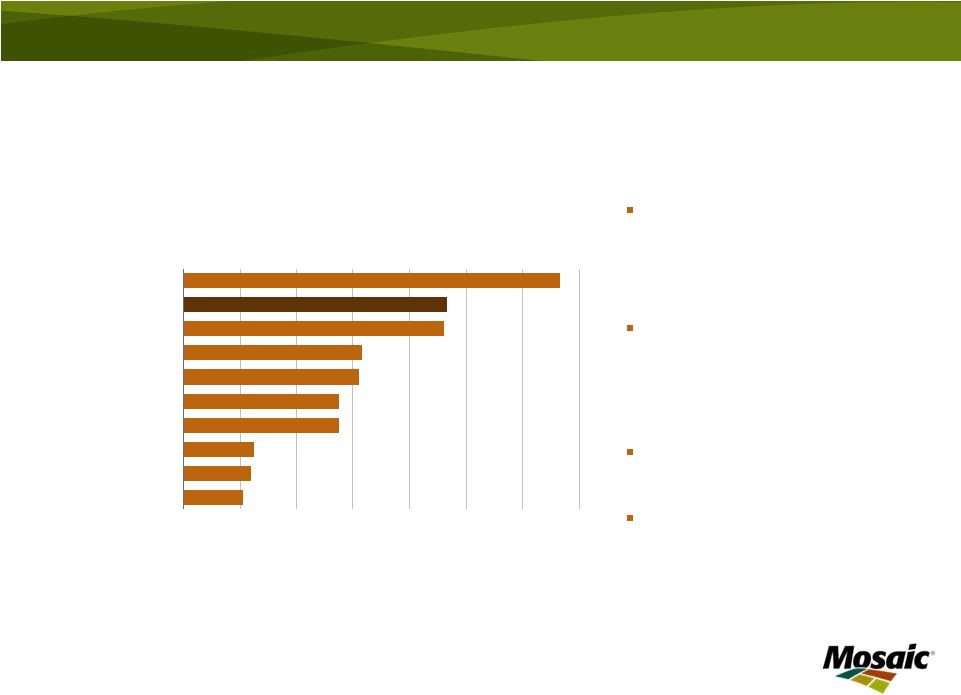
 Leader in Potash and
Phosphate 5
Source: IFA, company reports and Mosaic estimate
WORLD’S LARGEST P&K COMPANIES
0
1
2
3
4
5
6
7
8
9
Mosaic
PotashCorp
Belaruskali
Israel Chemicals
OCP
K+S
Silvinit
Uralkali
GCT
Yuntianhua
MILLION TONNES PRODUCTION, 3 YEAR AVERAGE
K2O
P2O5 |
| As the leading producer of potash and phosphate, there is no company
better positioned to capture the growth in crop nutrient markets.
Farmers need to plant record areas and harvest ever increasing yields to meet the
world’s accelerating appetite for grains and oilseeds. That
implies strong growth in global crop nutrient markets. Strong
agricultural markets have contributed to high demand for our products. This comes at a time when producer
inventories are low and there are growing supply concerns.
|
 Strategic
Overview As a global leader in crop nutrients, Mosaic
is positioned to benefit from attractive long-
term agricultural fundamentals:
Potash –
grow volume
–
Brownfield expansion program
Phosphates –
grow value
–
Leverage scale and geographic location
–
Extend phosphate reserves
Global
distribution assets aligned with
production
6 |
| At
Mosaic,
our
focus
is
on
shareholder
value
creation,
driven
by
the
attractive
fundamentals
of
our
business.
Our
mission
is
to
help
the
world
grow
the
food
it
needs.
We
run
our
business
with
a
long-term
view
–
and
this
view
is
compelling!
We
are
executing
well
on
our
strategy.
In
Potash,
we
are
growing
volume
by
pursuing
brownfield
expansion
opportunities. In Phosphates, we are focusing on growing the value of our
business and maintaining our position as one of the lowest cost phosphate
producers in the world. Our expansive global distribution network, aligned with our
North American production assets, provides us access to the largest global markets
on a counter seasonal basis. Over time, the combination of two strong product
lines has produced great returns for our shareholders. Our balanced
portfolio of both potash and phosphate gives more stability to our sales volumes
and cash flow than single nutrient focused companies.
|
 Transaction
Benefits Enhances long-term strategic and financial flexibility by facilitating exit
of majority shareholder
Increases Mosaic’s public float –
improving attractiveness of stock
Greater stock liquidity, removes Cargill overhang, satisfies public float criteria for
potential future inclusion in S&P 500 index
Number
of
outstanding
shares
unchanged;
no
dilution
to
earnings
per
share
Robust balance sheet remains intact and operations unchanged
7
Mosaic well positioned to capture
positive industry fundamentals |
| As most of you know, Mosaic and Cargill recently agreed to a transaction
that will result in the distribution of Cargill’s 64% stake in Mosaic to
Cargill’s shareholders and debt holders. This transaction will enhance
Mosaic’s long-term strategic and financial flexibility by facilitating the exit of our majority
shareholder.
This transaction came about because of Cargill’s desire to maintain its
private company status while meeting the diversification and distribution
needs of charitable trusts formed through the estate planning of one of Cargill’s largest
shareholders.
The release of these shares will increase Mosaic’s liquidity and public
float. We will also satisfy the 50% public float requirement for
potential inclusion in the S&P 500 index. Note
that
there
will
be
no
change
to
the
number
of
shares
or
the
economic
rights
associated
with
those
shares.
The
transaction has been designed to ensure an orderly distribution and to minimize
disruption to the market. There is significant
investor
interest
in
our
sector
and
we
believe
ample
demand
exists
to
expand
our
shareholder
base.
Finally, this
transaction
will
not
have
any
impact
on
operations
and
our
balance
sheet
will
remain
intact. |
 Cargill’s
286
million
Mosaic
shares
will
be
recapitalized
into
three
new
classes
to
comply
with
IRS
rules
regarding tax free split-offs. Cargill will then distribute all shares to debt holders and
participating Cargill shareholders in a split off transaction.
Recapitalization and Split-Off
8
Amount of shares to be exchanged with Cargill shareholders and debt holders represent estimates
|
| Now, let me give you a very brief overview of the transaction.
The distribution will take place in three steps. Slide seven
illustrates the first two steps. Slide eight summarizes the third
step. First, Mosaic will recapitalize its shares into three classes. Of
Cargill’s 286 million shares, an estimated 179 million will be
converted into Class A and Class B restricted shares. These shares will have the same economic rights as common
shares but will be subject to transferability restrictions. To comply with
tax rules regarding tax free split offs, the Class B shares will be high
vote shares solely with respect to the election of directors. The Class B shares can be converted
to Class A shares at the discretion of Mosaic’s Board of Directors post
closing. Next, Cargill will exchange its Mosaic shares with its debt holders,
the charitable trusts and other Cargill shareholders in a split off
transaction. |
 Orderly
Distribution 9
Formation Offerings
Post –
Formation Offerings
Up to approximately 107 million shares
from debt/equity exchange, 49.5 million
shares from Charitable Trusts.
Offerings to take place within 15 months
after closing
Beginning 2 ½
years from closing, 1/3
shares remaining after formation offerings
held by Charitable Trusts and other Cargill
shareholders become eligible to be
distributed annually
Closing
6-9 months
<15 months
2.5 years
3.5 years
4.5 years
Initial
Formation
Offering
Second
Formation
Offering
Additional
offerings until
157 million
shares sold
Released
share offering
Released
share offering
Released
share offering
Amount of shares to be exchanged with Cargill shareholders and debt holders represent estimates
|
| In the third step, we have planned for an orderly distribution of all 286
million shares to occur over the next several years. These shares will
be distributed to the public markets in a series of registered secondary offerings.
The first offering, which we expect to be the largest, will occur at the closing of
the recapitalization and split off. We anticipate closing will take
place in the second calendar quarter of this year. Remaining shares may be made available
in
a
series
of
offerings
designed
to
minimize
disruptions
to
the
market.
A
total
of
up
to
157
million
shares
will
be
distributed within the first 15 months from closing.
In summary, this transaction will give us a freer hand to control our own
destiny. We will all benefit from the long-term strategic
and
financial
flexibility
that,
as
a
fully
independent
company,
will
enable
us
to
capitalize
on
the
dynamic
crop
nutrient environment in which we operate.
Now, I would like to move to a review of our phosphate and potash businesses before
I finish with an overview of the market. |
 MURIATE OF POTASH CAPACITY
MILLION TONNES KCL
0
2
4
6
8
10
12
14
PotashCorp
Mosaic
Belaruskali
Silvinit
ICL
Uralkali
K+S
Qinghai
APC
Agrium
A Leading Global Potash Producer
10
World capacity
approximates 74 million
tonnes
(all potash
products)
Mosaic FY10 MOP
production share
–
12% Global
–
38% North America
World scale & efficient
operations
Brownfield expansions
underway
Peaking capacity for PotashCorp, Mosaic and K+S
Source: Fertecon, Mosaic |
| First, let’s talk about potash.
Mosaic
is
one
of
the
world’s
top
producers
of
potash
with
an
estimated
12%
of
global
market
share.
Potash
is
produced in only 14 countries in the world, and agricultural giants such as China,
India and Brazil depend on imports. |
 Potash –
Grow Volume
Projected additional annual capacity of 5.1
million tonnes
Multiple projects spanning a decade
Reversion of 1.3 million tonnes
currently
produced for a third party under a tolling
agreement expected soon
11 |
| The
world
will
need
substantially
more
potash
this
decade.
In
the
long
term,
we
forecast
demand
growth
of
3.5
–
4%
per year.
We
believe
the
best
way
to
meet
long-term
demand
growth
is
through
brownfield
expansions
at
existing
mine
sites.
Our
ongoing
expansions
in
Canada
are
expected
to
increase
annual
capacity
by
over
five
million
tonnes
by
2020,
ensuring
that
we
will
maintain
our
position
as
one
of
the
premier
potash
companies
in
the
world.
In
addition,
we
have
allocated
up
to
1.3
million
tonnes
of
annual
peaking
capacity
for
Potash
Corp
under
a
tolling
agreement. As many of you know, the expiration date for this agreement is the
subject of a dispute currently pending before
the
Saskatchewan
courts.
We
believe
that
our
obligation
to
provide
tonnes
to
PCS
ends
this
coming
summer,
at
which time these tonnes
revert to us. |
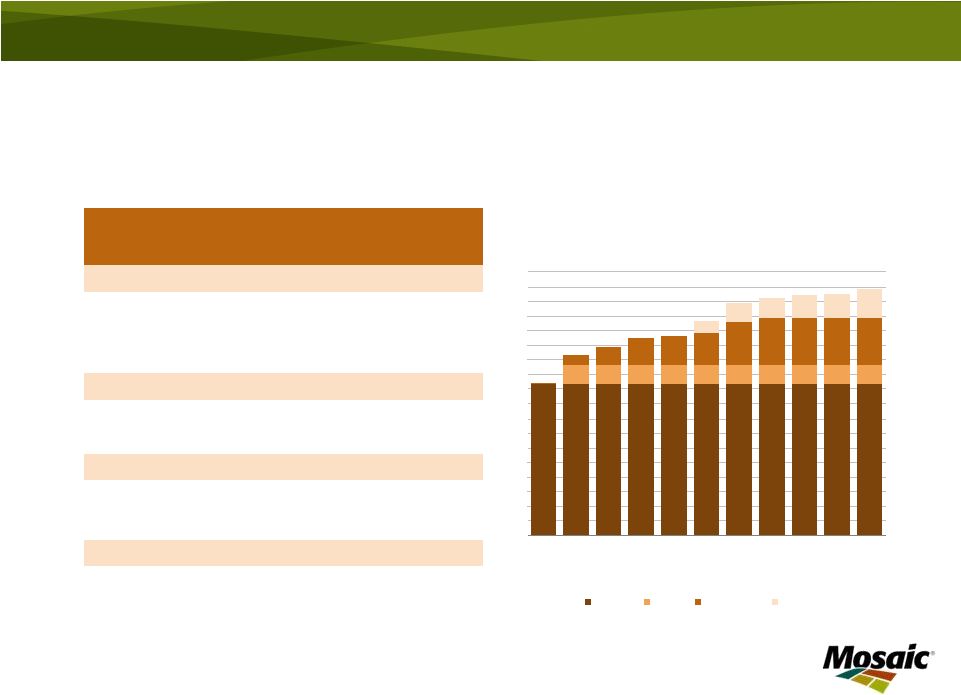 Potash Capacity
Expansions 12
PROJECTED CAPACITY
MILLION TONNES
0
2
4
6
8
10
12
14
16
18
2011
2013
2015
2017
2019
2021
FISCAL YEAR
Existing
Tolling
In progress
Future
INVESTMENT
($ IN BILLIONS)
PEAKING
CAPACITY
(MILLION TONNES)
ESTIMATED
CONSTRUCTION
COMPLETION
(FISCAL YEAR)
IN PROCESS
Belle Plaine
0.5
0.6
2012
Colonsay
0.7
0.7
2014
Esterhazy
2.0
1.8
2011-17
FUTURE
Belle Plaine
1.4
2016-19
Colonsay
0.6
2016
5.1
Tolling agreement
1.3
Capacity at May 31, 2010
10.4
16.8 |
| Our potash expansion program consists of nearly a dozen separate,
multi-year projects at our three Canadian mines. We have made good
progress on a number of these projects and we can adjust the pace of these projects in response
to supply/demand dynamics.
We expect this additional capacity to begin coming on-line over the next few
years. Within a decade, we expect our capacity to reach almost 17
million tonnes of finished product.
Our biggest project is the construction of the K3 shaft at Esterhazy. We are
currently drilling freeze holes and anticipate shaft sinking to begin
in calendar 2012. As our expansions come on line, we expect our
increased sales and production volumes to lead to lower per tonne
costs.
Our
industry
leadership,
together
with
our
investments
to
expand
capacity,
places
us
in
a
strong
competitive
position
to
leverage the growth of this market. |
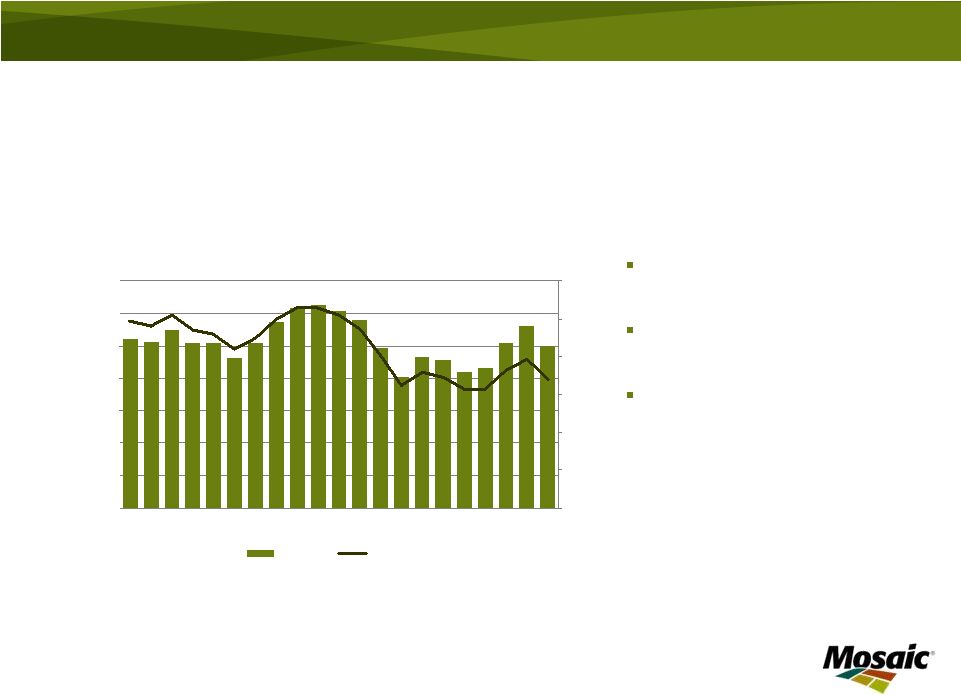
 Rebounding Potash
Demand Positive potash market
fundamentals:
Producers running hard to
keep up
Lean inventories
Healthy farmer economics
Expect 2011 global
shipments of 53 to 56 million
tonnes
13
Source: Fertecon
and Mosaic
WORLD MOP DEMAND
MILLION TONNES
0
10
20
30
40
50
60
00
01
02
03
04
05
06
07
08
09
10F
11F
CALENDAR YEAR |
| Turning
to
demand,
the
potash
market
is
very
tight
and
we
expect
2011
global
shipments
to
rival
the
record
of
2007.
Producers are running hard to keep up with strong demand and inventories remain
low. The strong North American fall season was a catalyst for potash demand
and we see this trend continuing through this spring.
Export
prices
are
increasing
and
narrowing
the
gap
with
domestic
prices
as
demonstrated
by
the
recent
agreement between Canpotex
and our Chinese customers.
Lean
inventories,
solid
crop
prices
and
healthy
farmer
economics
all
point
to
a
great
future
for
potash.
As
we
bring
on
new
capacity
to
meet
increased
potash
demand
over
the
coming
years,
we
expect
the
higher
sales
volume from our Potash business to favorably contribute to our profitability and
company valuation. |
 FINISHED PHOSPHATE CAPACITY
MILLION TONNES
0
2
4
6
8
10
Mosaic
YTH
OCP
Kailin
IFFCO
PhosAgro
Wengfu
GCT
Eurochem
Vale
Crop Nutrients
Feed
World’s Largest Phosphate Producer
World capacity
approximates 80 million
tonnes
(DAP/MAP/TSP)
Mosaic FY10 phosphate
production share
–
13% Global
–
56% North America
World scale & efficient
operations
Source: company reports, Mosaic
14 |
| Now, let’s move to phosphate.
Mosaic produces more phosphate crop nutrient and animal feed products than any other
company in the world by a wide margin. We rank among the lowest cost
producers in the industry today due to: •The tight vertical integration
of our phosphate rock mining and processing operations; •The large scale
of our mines and chemical plants; •The
important
location
advantages
we
have
from
being
situated
on
the
Gulf
of
Mexico
and
the
Mississippi
River;
•And, our international distribution business. |
 Phosphates
– Grow
Value
Leverage scale and location
–
Low cost producer
–
Cost advantaged sulfur, competitive ammonia
–
Procurement leverage
Operational excellence
–
Maintenance practices
–
Capital deployment
–
Energy use and co-generation capacity
–
Improve coordination of sales and operations
planning
Grow MicroEssentials
®
sales
Extend phosphate reserves
15 |
| In order to strengthen our competitive advantage, we are focusing on four
strategic priorities for our Phosphates business:
First, we are working on several initiatives to leverage our scale and
geographic location. We have a strong competitive position due to
low rock and conversion costs as well as preferential geographic access to sulfur and
ammonia.
Next, we are focused on operational efficiency. We are implementing
improved processes for maintenance, capital deployment, energy use and
co-generation capacity. Our global sales and operations teams are working closely
together to optimize production planning in order to reduce operating costs.
Another highlight of our Phosphates segment is MicroEssentials
®
, a premium product that incorporates sulfur and other
micronutrients. We have over ten years of research trials demonstrating value
to famers through higher yields. We are on pace to sell over one
million tonnes this fiscal year and are converting existing capacity to
produce up to two million tonnes
annually.
Finally, we continue work to secure the mineral resource base for our U.S.
operations and to obtain advantaged access to rock reserves elsewhere in the
world. One recent example is our joint venture rock mine in Peru. As many of you
know, a permit needed to continue operations at our South Fort Meade mine is the
subject of a lawsuit. We are pursuing a number of strategies to
mitigate the impacts of this lawsuit. The process for the South Fort Meade permit
was robust and we believe it is not a matter of if we receive the permit, but
rather a matter of when. |
 Record Phosphate
Demand Positive phosphate market
fundamentals:
Strong demand
Lean inventories
Healthy farmer economics
Expect 2011 global
shipments of 59 to 61 million
tonnes
16
Source: Fertecon
and Mosaic
WORLD PROCESSED PHOSPHATE DEMAND
MILLION TONNES
0
10
20
30
40
50
60
70
00
01
02
03
04
05
06
07
08
09
10F
11F
CALENDAR YEAR |
| Phosphate fundamentals are constructive and we expect the phosphate
market to remain snug for several years. In 2011, we expect record
demand coupled with supply uncertainties to keep this market tight during the remainder of this
fertilizer year.
Large shipments to both domestic and offshore destinations have tightened the global
phosphate market. Producer stocks remain at low levels and grain
prices have been supportive. Since
last
summer,
prices
have
rebounded
and
stayed
at
levels
around
$600
per
tonne
FOB
Tampa.
Now,
dealers
are
positioning product for the North American spring season.
We
forecast
processed
phosphate
demand
will
grow
to
a
record
59
to
61
million
tonnes
in
2011.
In addition to strong demand, several supply uncertainties are exacerbating the
situation. Questions about the Ma’aden startup in Saudi Arabia,
shut down of Agrifos and Fertiberia
phosphate operations, raw material uncertainty, changes in
China’s export duties and permit litigation at our own South Fort Meade mine
have all contributed to the tight market conditions.
|
 Solid Financial
Position TOTAL CASH AND CASH EQUIVALENTS LESS DEBT*
$ IN BILLIONS
(3)
(2)
(1)
-
1
2
3
31-May-06
31-May-07
31-May-08
31-May-09
31-May-10
30-Nov-10
PERIOD END
17
*
See appendix for reconciliation of Cash and Cash Equivalents less Debt |
| As we have noted, our overall strategy is to capitalize on attractive
long-term agricultural fundamentals by investing in and reengineering our
Potash and Phosphate businesses. Through the ups and downs of the
markets we serve, we have created long-term value through sound capital allocation
decisions. Our strong cash flow has allowed us to build one of the strongest
balance sheets in the industry despite the economic downturn. We have
demonstrated our willingness and ability to make investments, to divest non-strategic
assets and to return cash to shareholders, as appropriate.
Our cash allocation priorities include investing in our business, maintaining a
large liquidity buffer, funding strategic opportunities, maintaining our
credit rating and distributing cash to shareholders. In addition, when
Cargill is no longer a majority shareholder, we will have additional flexibility as we evaluate M&A
opportunities and shareholder distributions. |
 Accelerated Grain
and Oilseed Use 18
Disappointing global
harvests
Strong agricultural
commodity prices
Need to re-stock crop
nutrients in the
distribution pipeline and in
many farm fields
Source: USDA, lighter bars indicate recession years
WORLD GRAIN AND OILSEED PRODUCTION
AND USE
BILLION TONNES
1.8
2.0
2.2
2.4
2.6
2.8
00/01
02/03
04/05
06/07
08/09
10/11F
CROP YEAR
Use
Production |
| Let me finish with a few thoughts on the market outlook which look great
from any angle we can see. As you can see, grain and oilseed use has grown
slowly, but consistently. History has proven that economic
slowdowns
don’t
have
a
large
negative
impact
on
food
consumption
–
people
need
to
eat
regardless
of
the
economic
climate. The most recent global economic downturn was no exception.
On the production side, we have seen significant increases over the past three
years. This growth has come from increased harvested land and above
trend yields. However, we need to continue this above trend growth just to stay
even with projected use. |
 Stocks Remain at Low
Levels 19
Days of use remains at
low levels
Stocks still not at secure
levels
2011 new crop prices
signaling farmers to
expand planted area and
intensify cropping
practices
WORLD GRAIN AND OILSEED STOCKS
MILLION TONNES
0
100
200
300
400
500
600
700
90/91
94/95
98/99
02/03
06/07
10/11F
CROP YEAR
0
20
40
60
80
100
120
Stocks
Days of Use
DAYS OF USE
Source: USDA |
| Dramatic improvement in production has not translated into improving
stocks. World grain and oilseed stocks continue to remain at low
levels. We believe global grain and oilseed stocks still are not at levels secure enough to withstand
weather or other shocks over a period of time.
Over this past year, we have seen droughts in Russia and the Southern Cone, and
floods in Australia that have affected grain and oilseed production.
Corn
looks
especially
tight
at
only
56
days
of
use
estimated
for
the
end
of
this
crop
year.
That
is
the
second
lowest
ratio since the early 1970s. This ratio is even lower if you exclude India
and China which hold large strategic reserves. |
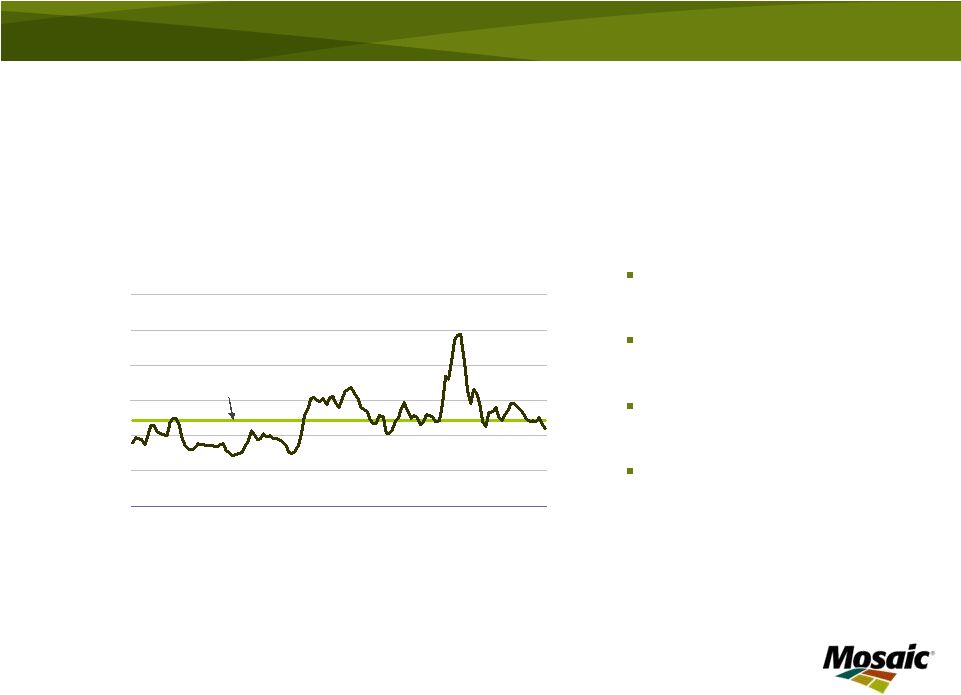 Farmer
Economics 20
CROP NUTRIENT AFFORDABILITY IN THE U.S
CROP NUTRIENT PRICE INDEX/CROP PRICE INDEX
0.0
0.5
1.0
1.5
2.0
2.5
3.0
2000
2002
2004
2006
2008
2010
CALENDAR YEAR
Average
Farmer profitability remains
at healthy levels:
Grain prices high relative
to historical prices
Input costs well below
their highs
Similar conditions for
cotton, rice and palm oil
China, Brazil and India
farm economics at, or
near, record levels
Crop Nutrient Price Index: NPK weighting based on US nutrient use from 2005/06 thru
2007/08, indexed to average prices in 2000 = 100
Crop Price Index: Crop price weighting based on Corn/Wheat/Soybean US acreage in
2007, indexed to average prices in 2000 = 100
Source: Mosaic |
| Another factor we keep an eye on is grain pricing. Farm
profitability remains at healthy levels. Grain prices are at relatively
high levels compared to historical prices. At the same time, farmer input costs have fallen
from their high levels of 2008 and 2009. This has allowed farmers to remain
profitable. The graph on this slide shows that the cost of crop nutrients,
relative to grain prices, is well within historic norms. Similar
conditions exist for other crops such as cotton, rice and palm oil. In
China,
Brazil
and
India,
farm
economics
are
at
record
or
near
record
levels
due
to
high
domestic
crop
prices
and,
in
the case of India, subsidized input costs. |
 Key Points
Cargill distribution will give us additional
flexibility to pursue M&A and shareholder
distributions in the future
Potash brownfield
expansions on track to
add five million tonnes
additional capacity
Largest integrated phosphate producer –
low cost, geographic advantage and
expanding reserves
Confluence of supply and demand factors
keeping crop nutrient markets extremely
tight
Healthy farmer economics support
continued investment in crop nutrients
21 |
| Let me recap with a few key points.
First, Cargill’s exit as majority shareholder will give us additional
flexibility to pursue strategic opportunities and shareholder
distributions. We will ensure this exit is accomplished in an orderly manner.
Second, expected potash demand growth requires that we continue to expand our
production capacity. Third, we are the largest integrated phosphate producer
in the world. We have very low production costs, we have advantaged
access to raw materials through our location on the US Gulf coast, and, we are expanding our sources of
rock.
Fourth,
a
confluence
of
supply
and
demand
factors
will
keep
crop
nutrient
markets
extremely
tight
until
new
supply
comes on-line.
Finally,
crop
prices
are
providing
farmers
with
the
incentive
to
apply
optimal
amounts
of
crop
nutrient
in
order
to
maximize yield.
Mosaic is well positioned in both potash and phosphate to take advantage of these
favorable market conditions. |
 Thank you
|
| Thank you for your time today. Now, I will be glad to answer any
questions you may have. |
 Appendix
23
As of Period End
Cash and Cash
Equivalents
Short-Term Debt
Current
Maturities
Long-Term Debt
Total Debt
Net (Debt) Cash
31-May-06
173.3
152.8
69.3
2,388.1
2,610.2
(2,436.9)
31-May-07
420.6
138.6
403.8
1,818.1
2,360.5
(1,939.9)
31-May-08
1,960.7
133.1
43.3
1,375.0
1,551.4
409.3
31-May-09
2,703.2
92.7
43.3
1,256.5
1,392.5
1,310.7
31-May-10
2,523.0
83.1
15.2
1,245.6
1,343.9
1,179.1
30-Nov-10
3,659.4
54.5
466.3
788.4
1,309.2
2,350.2
Reconciliation of Cash and Cash Equivalents less Debt
Source: Cash and cash equivalents from 10Q/10K as filed. Total debt includes Short term debt,
current maturities of long-term debt, long-term debt less current maturities and
long-term debt due to Cargill Inc. and Affiliates. We believe this non-GAAP
measure provides additional information regarding the liquidity and financial position of the
Company. |