Attached files
| file | filename |
|---|---|
| EX-99.01 - EXHIBIT 99.01 - GLU MOBILE INC | a6598289ex99-01.htm |
| 8-K - GLU MOBILE INC. 8-K - GLU MOBILE INC | a6598289.htm |
| EX-99.02 - EXHIBIT 99.02 - GLU MOBILE INC | a6598289ex99-02.htm |
| EX-99.04 - EXHIBIT 99.04 - GLU MOBILE INC | a6598289ex99-04.htm |
Exhibit 99.03

Glu Mobile: Corporate Update Niccolo de Masi, CEO Eric R. Ludwig, SVP & CFO February 7, 2011
Safe-Harbor Statement This presentation contains "forward-looking" statements including those regarding projected growth in users of mobile phones generally and smartphones in particular as well as projected growth in social mobile gaming, our expectations regarding the number of games we will release during the year, our planned initiatives with respect to our global social gaming community and our expectations regarding when our smartphone revenues will exceed our feature phone revenues. These forward-looking statements are subject to material risks and uncertainties that could cause actual results to differ materially from those in the forward-looking statements. Investors should consider important risk factors, which include: the risk that growth of smartphones and advanced networks does not grow as significantly as we anticipate or that we will be unable to capitalize on any such growth; the risk that we do not realize a sufficient return on our investment with respect to our efforts to develop persistent-state, freemium games for smartphones and advanced platforms, the risk that our development expenses for games for smartphones are greater than we anticipate; the risk that our recently and newly launched games are less popular than anticipated; the risk that our newly released games will be of a quality less than desired by reviewers and consumers; the risk that the mobile games market, particularly with respect to social, persistent gaming, is smaller than anticipated; the risk that the slowdown in sales of feature phones in our traditional carrier-based business accelerates more rapidly than we anticipate; and other risks detailed under the caption "Risk Factors" in our Form 10-Q filed with the Securities and Exchange Commission on November 10, 2010 and our other SEC filings. You can locate these reports through our website at http://www.glu.com/investors. These "forward-looking" statements are based on estimates and information available to us on February 7, 2011 and we are under no obligation, and expressly disclaim any obligation, to update or alter our forward-looking statements whether as a result of new information, future events or otherwise.
Use of Non-GAAP Financial Measures Glu uses in this presentation certain non-GAAP measures of financial performance. The presentation of these non-GAAP financial measures is not intended to be considered in isolation from, as a substitute for, or superior to, the financial information prepared and presented in accordance with GAAP, and may be different from non-GAAP financial measures used by other companies. In addition, these non-GAAP measures have limitations in that they do not reflect all of the amounts associated with Glu's results of operations as determined in accordance with GAAP. The non-GAAP financial measures used by Glu include non-GAAP revenues, non-GAAP smartphone revenues, non-GAAP gross margins and non-GAAP freemium revenues. These non-GAAP financial measures exclude the following items from Glu's unaudited consolidated statements of operations: Change in deferred revenues and costs of revenues;Amortization of intangible assets; Stock-based compensation expense; Restructuring charges; MIG earnout expenses; andForeign currency exchange gains and losses primarily related to the revaluation of assets and liabilities. Glu believes that these non-GAAP financial measures, when taken together with the corresponding GAAP financial measures, provide meaningful supplemental information regarding Glu's performance by excluding certain items that may not be indicative of Glu's core business, operating results or future outlook. Glu's management uses, and believes that investors benefit from referring to, these non-GAAP financial measures in assessing Glu's operating results, as well as when planning, forecasting and analyzing future periods. These non-GAAP financial measures also facilitate comparisons of Glu's performance to prior periods. For a reconciliation of these non-GAAP financial measures to their most directly comparable GAAP financial measures, please refer to the tables attached to Glu’s earnings press release for the quarter and year ended December 31, 2010, which is available on our website at http://www.glu.com/investors.

Social Mobile Gaming For All
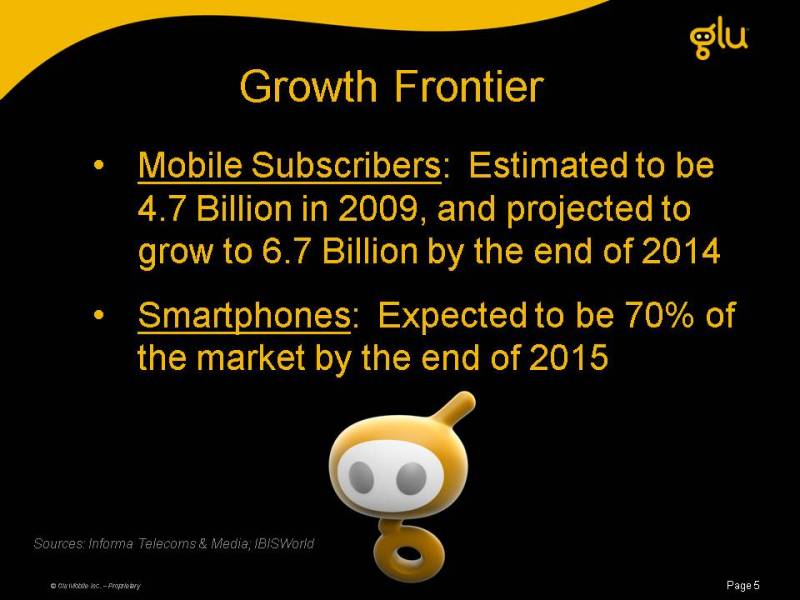
Growth Frontier Mobile Subscribers: Estimated to be 4.7 Billion in 2009, and projected to grow to 6.7 Billion by the end of 2014Smartphones: Expected to be 70% of the market by the end of 2015 Sources: Informa Telecoms & Media; IBISWorld
Intersection of Two Rising Tides Growth in gaming on mobile devices Growth in social gaming
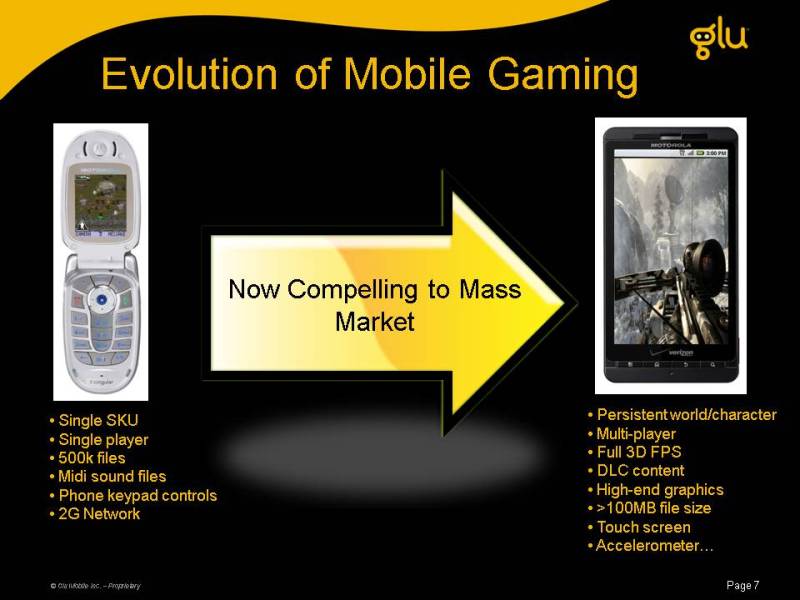
Now Compelling to Mass Market Single SKU Single player 500k files Midi sound files Phone keypad controls 2G Network Persistent world/character Multi-player Full 3D FPS DLC content High-end graphics >100MB file size Touch screen Accelerometer… Evolution of Mobile Gaming
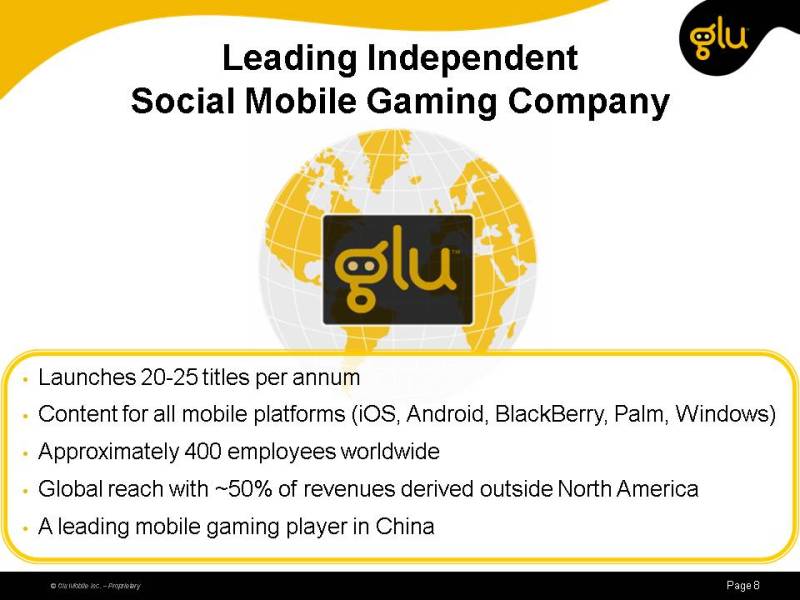
Launches 20-25 titles per annumContent for all mobile platforms (iOS, Android, BlackBerry, Palm, Windows)Approximately 400 employees worldwideGlobal reach with ~50% of revenues derived outside North AmericaA leading mobile gaming player in China Leading Independent Social Mobile Gaming Company
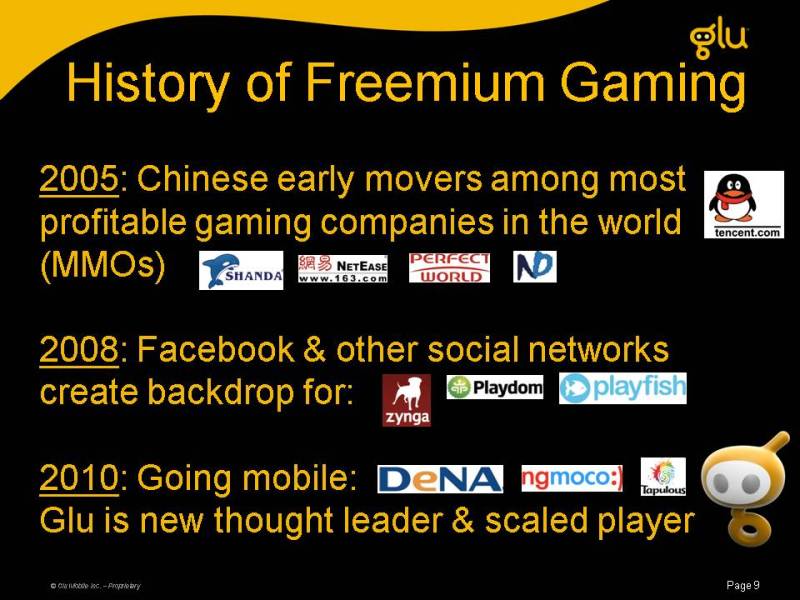
History of Freemium Gaming 2005: Chinese early movers among most profitable gaming companies in the world (MMOs)2008: Facebook & other social networks create backdrop for:2010: Going mobile:Glu is new thought leader & scaled player
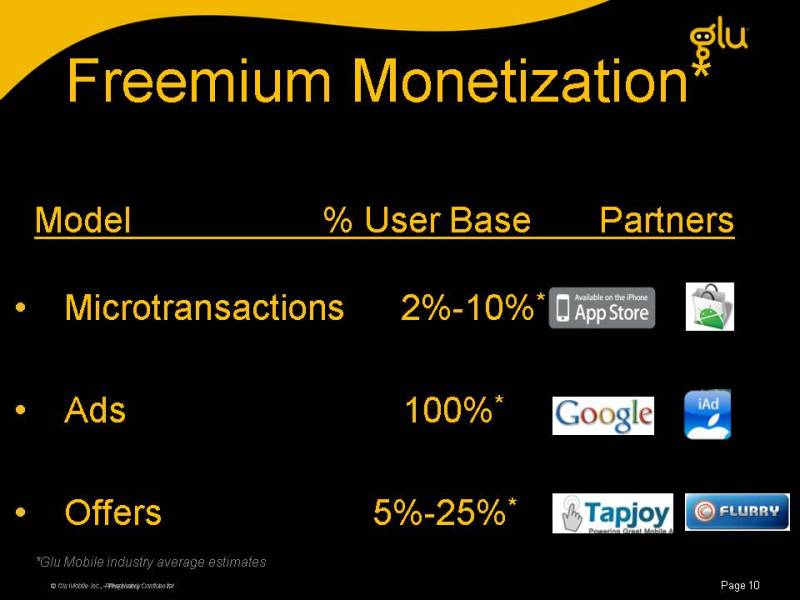
Freemium Monetization* © Glu Mobile Inc., Private and Confidential Microtransactions 2%-10%*Ads 100%*Offers 5%-25%* Model % User Base PartnersOther Placeholder:*Glu Mobile industry average estimates
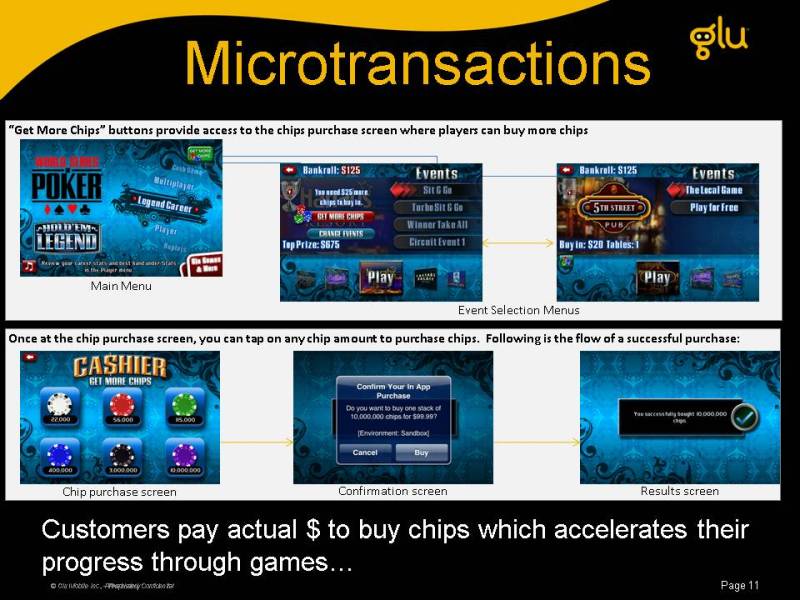
“Get More Chips” buttons provide access to the chips purchase screen where players can buy more chips Main Menu Event Selection Menus (Gp:) Chip purchase screen (Gp:) Confirmation screen (Gp:) Results screen (Gp:) Once at the chip purchase screen, you can tap on any chip amount to purchase chips. Following is the flow of a successful purchase: Microtransactions Customers pay actual $ to buy chips which accelerates their progress through games

In-Game Advertising Ads in Menus (don’t block gameplay) Ads integrated into game

Offers Customers that don’t want to pay can “earn” goods through specific actions User needs currency to purchase items Consumer earns virtual currencyGlu earns bounty paid by third party User earns currency by completing Offers
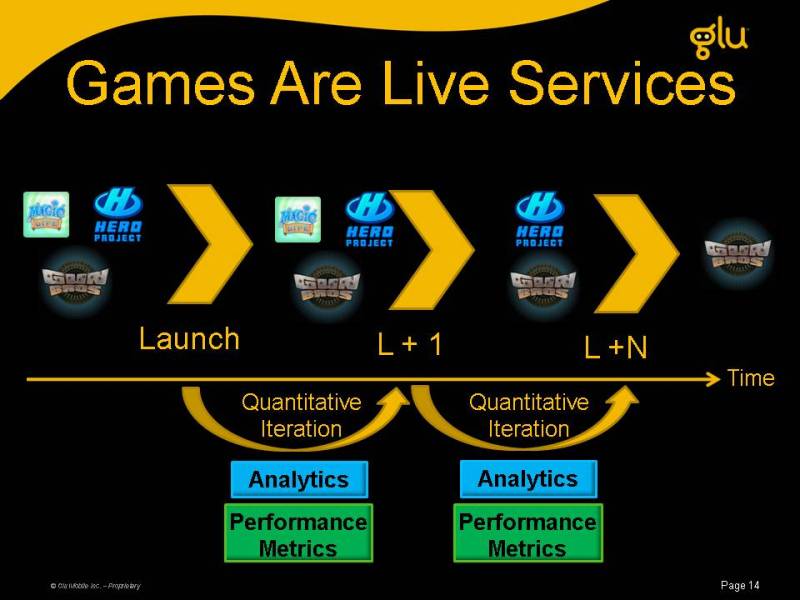
Games Are Live Services Launch L + 1 L +N Analytics Performance Metrics Analytics Performance Metrics Time Quantitative Iteration Quantitative Iteration
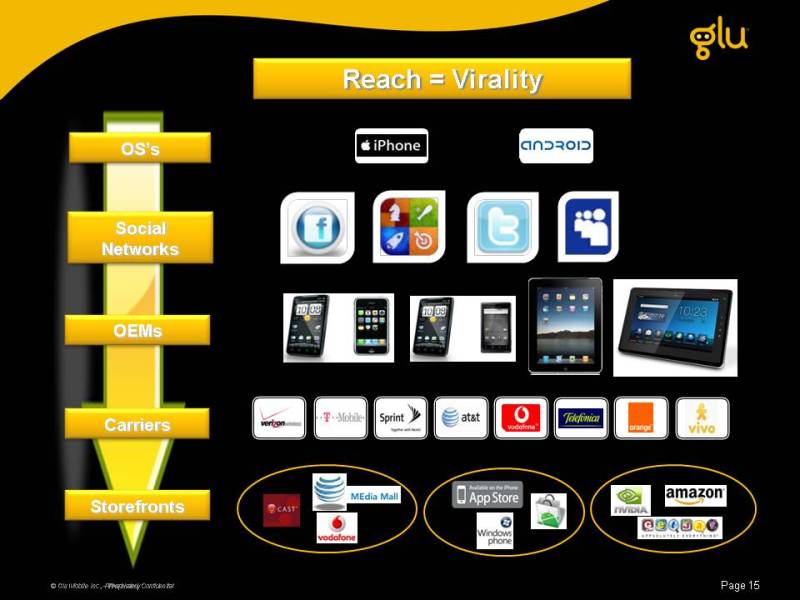
Reach = Virality OS’s OEMs Carriers Storefronts Social Networks
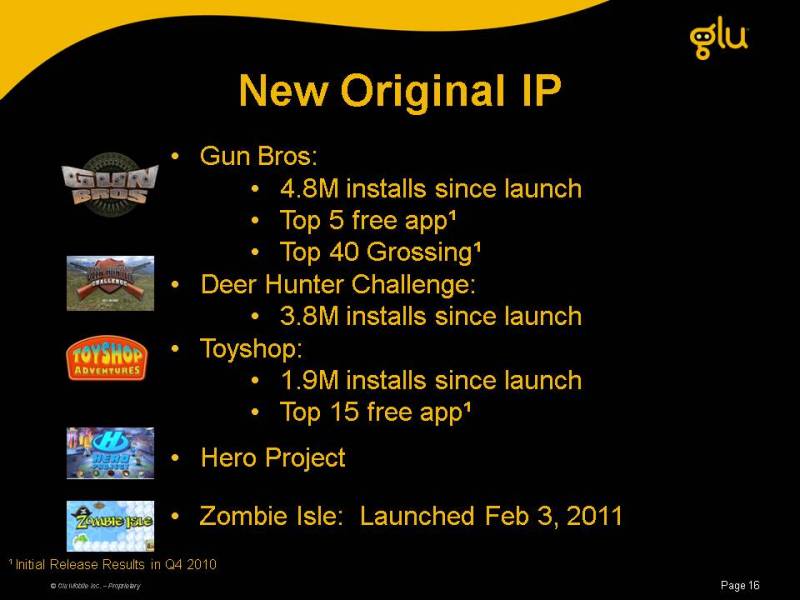
Gun Bros: 4.8M installs since launchTop 5 free app¹Top 40 Grossing¹Deer Hunter Challenge:3.8M installs since launchToyshop: 1.9M installs since launchTop 15 free app¹Hero ProjectZombie Isle: Launched Feb 3, 2011 New Original IP Initial Release Results in Q4 2010

Platform Strategy Find Winners Port Winners
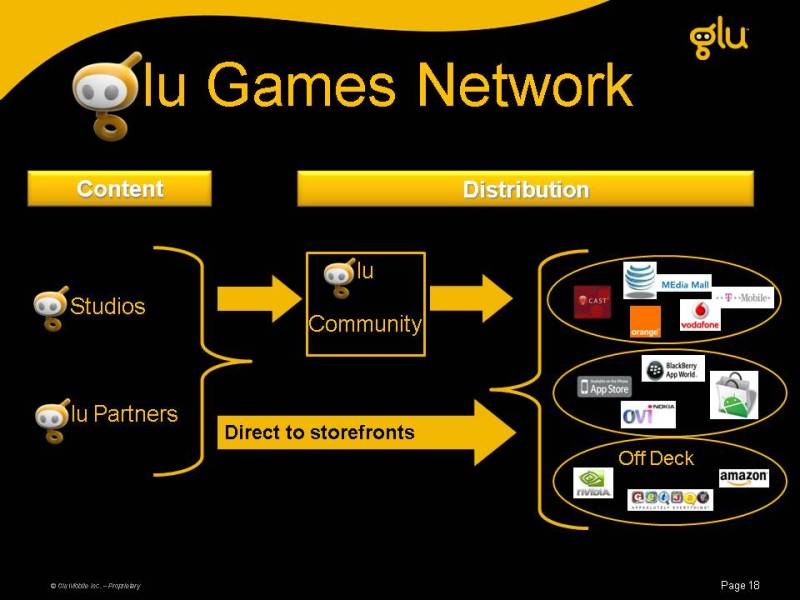
Glu Games Network Studios Glu Partners Content Distribution Glu Community Direct to storefronts Off Deck
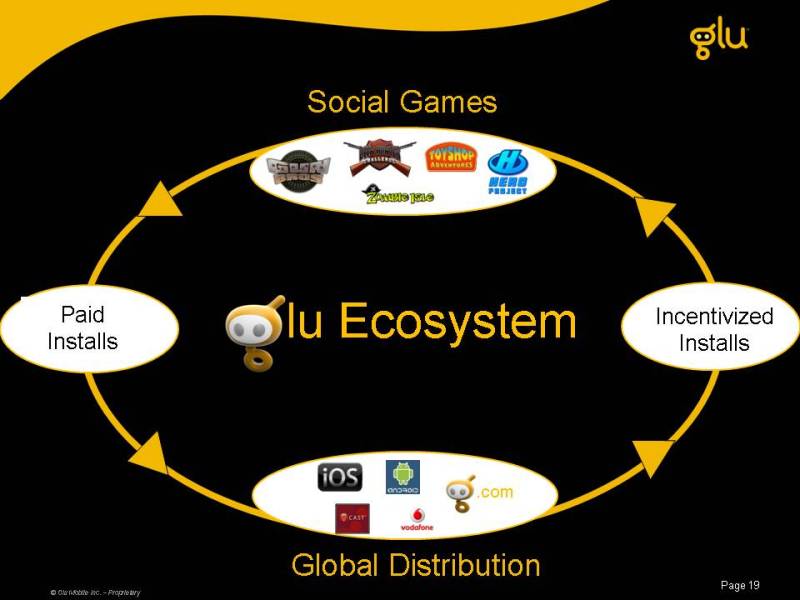
G lu Ecosystem .com Incentivized Installs Paid Installs Social Games Global Distribution

Rich HTML5 site and standalone app for smartphone and tabletsVersion 1.0 (Feb 2011)StorefrontLoyalty ProgramUser ProfilesVersion 1.1 (Expected May 2011)Enhanced community featuresLocalized versions Glu Community

Glu Partners Phase 1:External development of Glu conceptsExtending Glu titles to other digital platformsProviding global distribution for independent developers
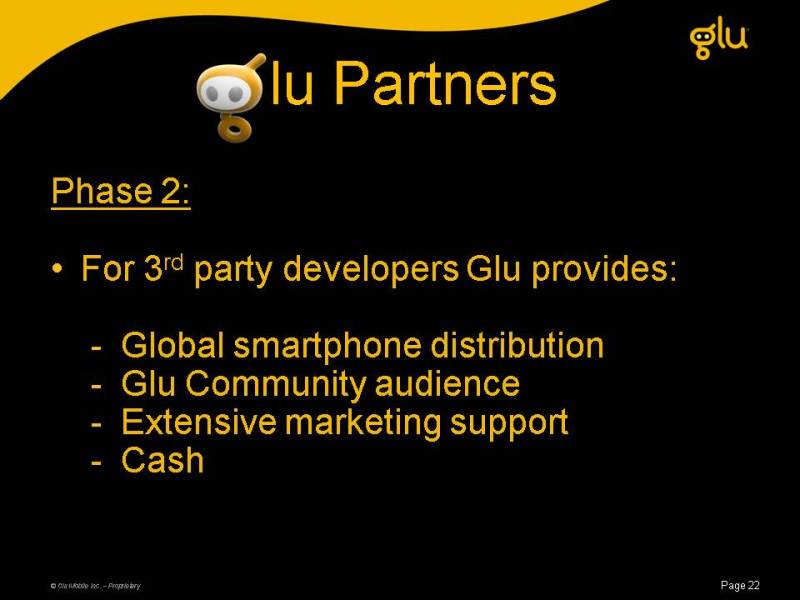
Phase 2:For 3rd party developers Glu provides:Global smartphone distributionGlu Community audienceExtensive marketing supportCash Glu Partners
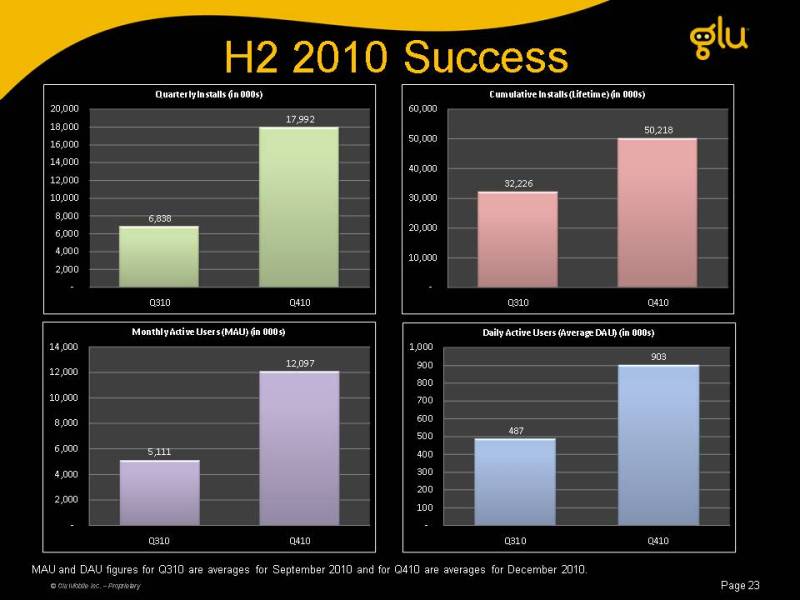
H2 2010 Success MAU and DAU figures for Q310 are averages for September 2010 and for Q410 are averages for December 2010.
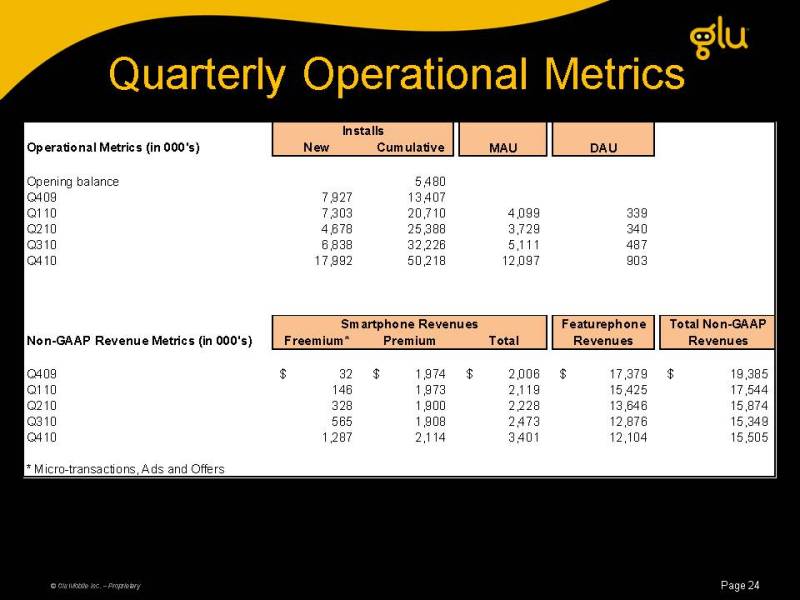
Quarterly Operational Metrics
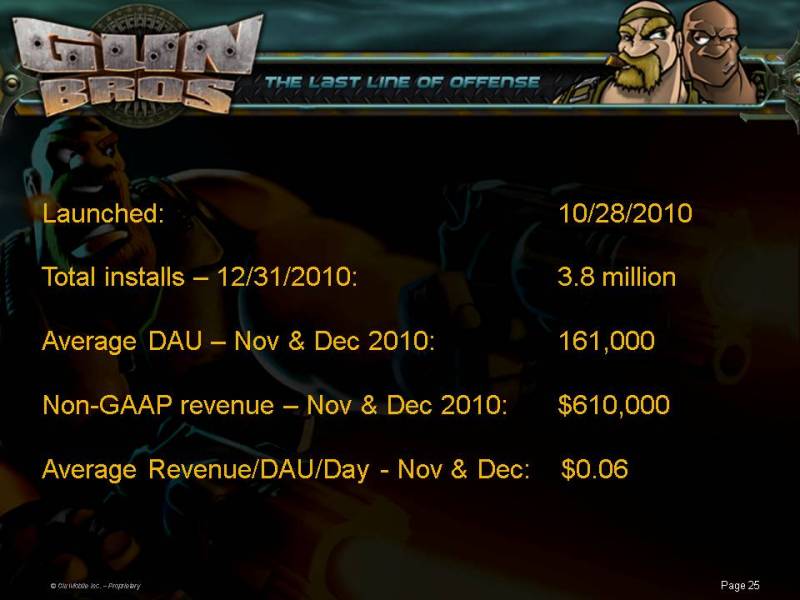
Launched: 10/28/2010Total installs – 12/31/2010: 3.8 millionAverage DAU – Nov & Dec 2010: 161,000Non-GAAP revenue – Nov & Dec 2010: $610,000Average Revenue/DAU/Day - Nov & Dec: $0.06
Financial Overview
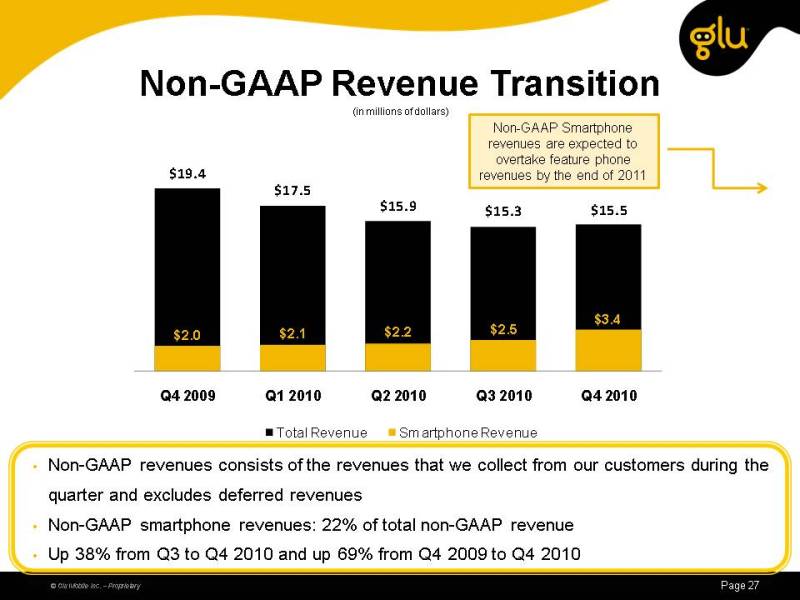
(Gp:) Non-GAAP revenues consists of the revenues that we collect from our customers during the quarter and excludes deferred revenuesNon-GAAP smartphone revenues: 22% of total non-GAAP revenueUp 38% from Q3 to Q4 2010 and up 69% from Q4 2009 to Q4 2010 (in millions of dollars) Non-GAAP Revenue Transition Non-GAAP Smartphone revenues are expected to overtake feature phone revenues by the end of 2011
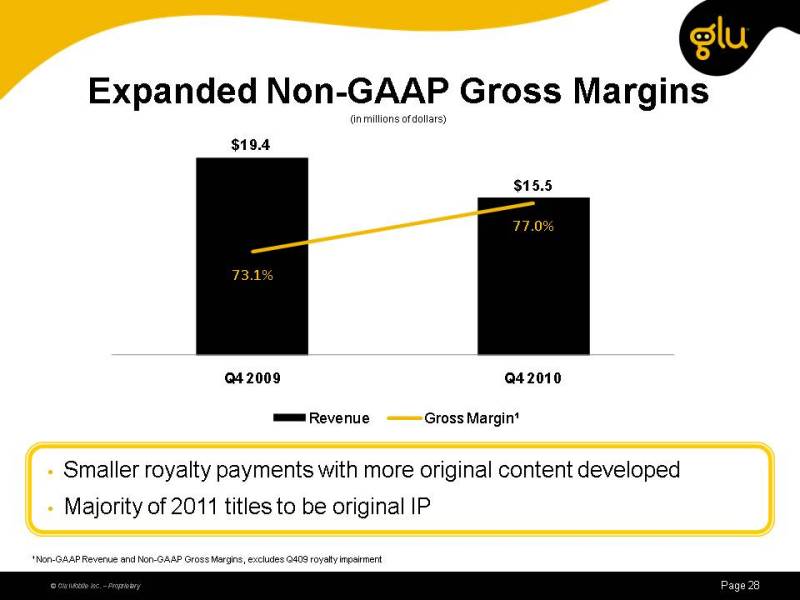
Expanded Non-GAAP Gross Margins (Gp:) Smaller royalty payments with more original content developedMajority of 2011 titles to be original IP (in millions of dollars) Non-GAAP Revenue and Non-GAAP Gross Margins, excludes Q409 royalty impairment
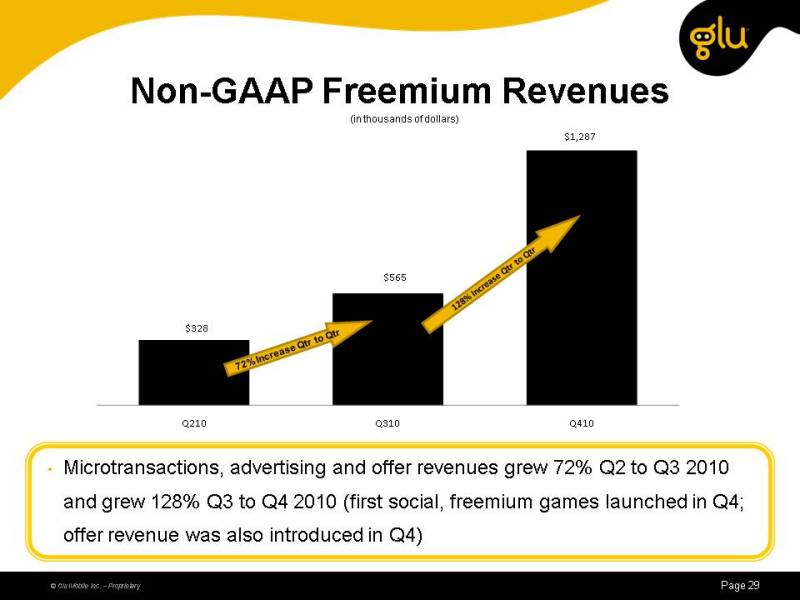
(Gp:) Microtransactions, advertising and offer revenues grew 72% Q2 to Q3 2010 and grew 128% Q3 to Q4 2010 (first social, freemium games launched in Q4; offer revenue was also introduced in Q4) Non-GAAP Freemium Revenues (in thousands of dollars)
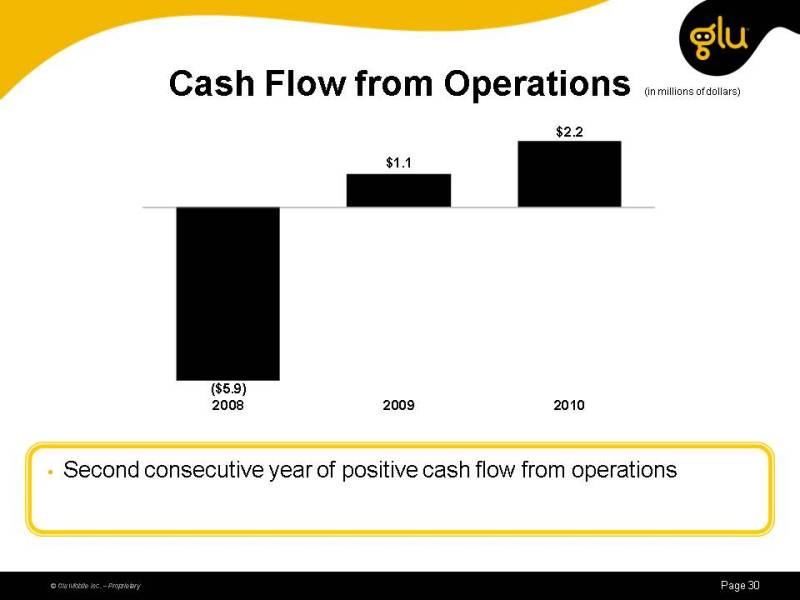
Second consecutive year of positive cash flow from operations (in millions of dollars) Cash Flow from Operations
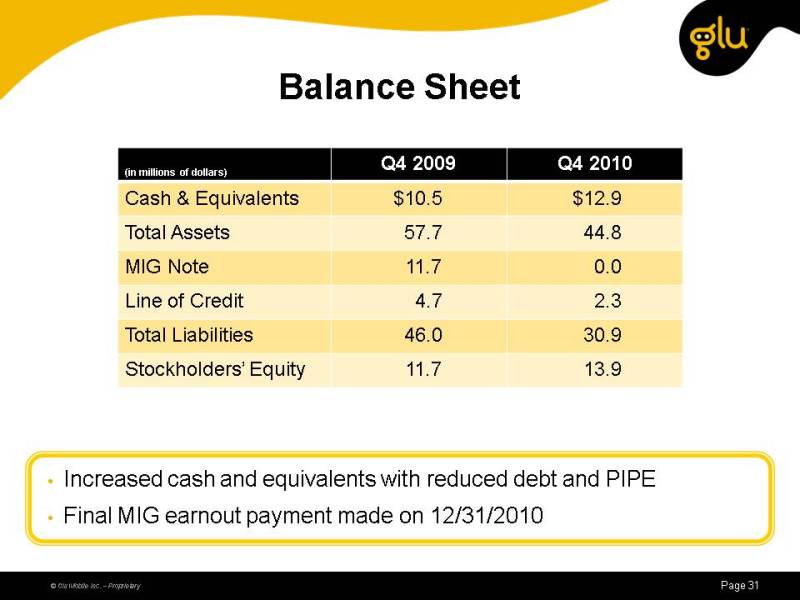
Increased cash and equivalents with reduced debt and PIPEFinal MIG earnout payment made on 12/31/2010 Balance Sheet
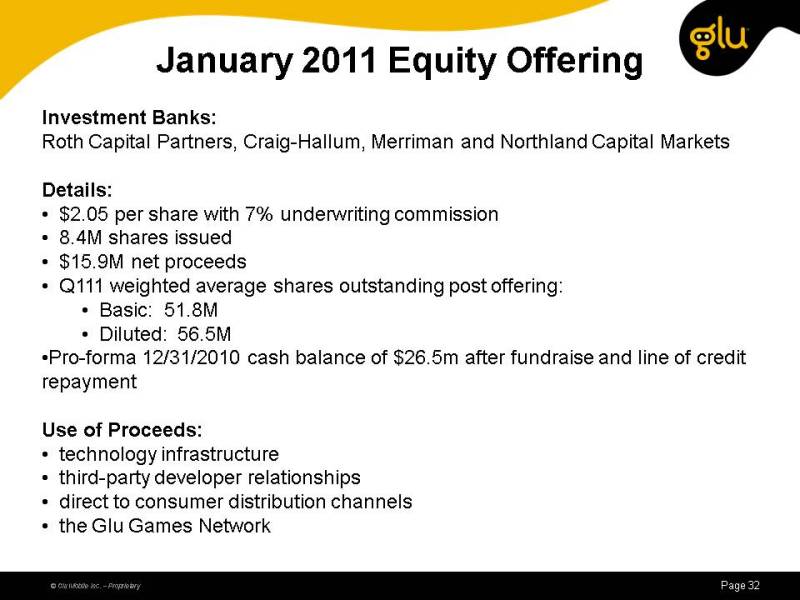
Investment Banks:Roth Capital Partners, Craig-Hallum, Merriman and Northland Capital Markets Details: $2.05 per share with 7% underwriting commission 8.4M shares issued $15.9M net proceeds Q111 weighted average shares outstanding post offering: Basic: 51.8M Diluted: 56.5MPro-forma 12/31/2010 cash balance of $26.5m after fundraise and line of credit repaymentUse of Proceeds: technology infrastructure third-party developer relationships direct to consumer distribution channels the Glu Games Network

Niccolo de Masi, Chief Executive Officer and PresidentFormer CEO of Hands-On MobileFormer CEO of Monstermob GroupCambridge University (M.A. and Msci degrees)Eric R. Ludwig, Chief Financial Officer and Senior Vice PresidentFormer CFO of Instill CorporationFormer Controller of Camstar SystemsPrice Waterhouse L.L.P. Santa Clara University (B.S. in Commerce) and CPA (inactive)Kal Iyer, Senior Vice President Research and DevelopmentFormer VP Tech Services of Glu MobileMobile architecture and infrastructure at PumatechB.S. in Mathematics from Jabalpur University, India.Giancarlo Mori, Chief Creative OfficerOver 20 years of software development experienceFormer Vice President of Production at ActivisionSelect titles include: Tony Hawk, Shrek, Gun (best selling new IP of 2005)Electronic Arts and Microsoft Game StudiosUniversity of Florence (MSc degree) Experienced Management
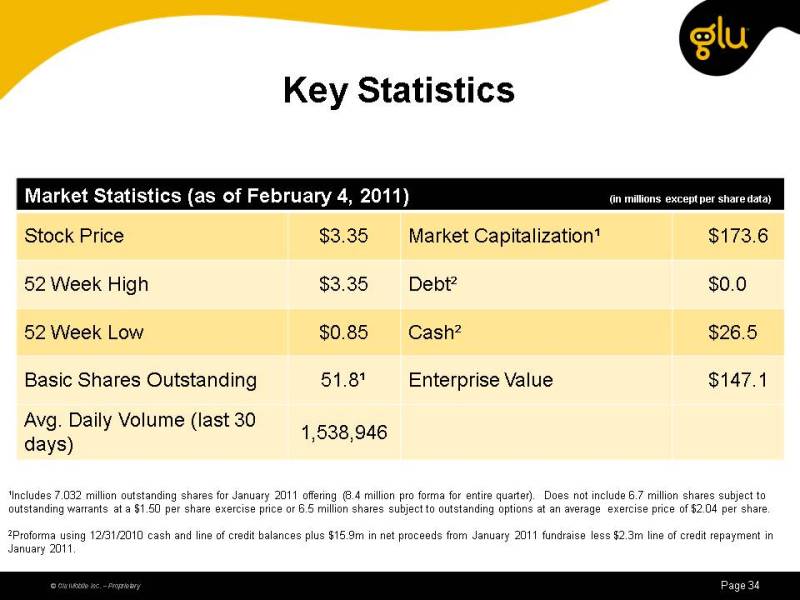
Includes 7.032 million outstanding shares for January 2011 offering (8.4 million pro forma for entire quarter). Does not include 6.7 million shares subject to outstanding warrants at a $1.50 per share exercise price or 6.5 million shares subject to outstanding options at an average exercise price of $2.04 per share.2Proforma using 12/31/2010 cash and line of credit balances plus $15.9m in net proceeds from January 2011 fundraise less $2.3m line of credit repayment in January 2011. Key Statistics
Highlights Recap Glu is leading at the intersection of two rising tides: Growth in mobile gaming Growth in social gaming Smartphone installed base expected to grow rapidly over next 4 years Recent fundraising allows Glu to invest in growing its platform and installed user baseOther Placeholder: