Attached files
| file | filename |
|---|---|
| 8-K - FORM 8-K - ORRSTOWN FINANCIAL SERVICES INC | d8k.htm |
 The 18
th
Annual
Emerald Groundhog Day Investment Forum
February 2, 2011
The Radisson Plaza-
Warwick Hotel
Philadelphia, Pennsylvania
Jeffrey W. Embly
Jeffrey W. Embly
Embly
EVP, Chief Credit /Risk Officer
EVP, Chief Credit /Risk Officer
Bradley S. Everly
Bradley S. Everly
Everly
EVP, Chief Financial Officer
EVP, Chief Financial Officer
Thomas R. Quinn, Jr.
Thomas R. Quinn, Jr.
President & Chief Executive Officer
President & Chief Executive Officer
NASDAQ: ORRF
Exhibit 99.1 |
 2
Safe Harbor Regarding Forward-Looking Statements
This
presentation
may
contain
forward-looking
information
about
Orrstown
Financial
Services,
Inc.
that
is
intended
to
be
covered
by
the
safe
harbor
for
forward-looking
statements
provided
by
the
Private
Securities
Litigation
Reform
Act
of
1995.
Actual
results
and
trends
could
differ
materially from those set forth in such statements due to various risks,
uncertainties and other factors. Such risks, uncertainties and other
factors
that
could
cause
actual
results
and
experience
to
differ
from
those
projected
include,
but
are
not
limited
to,
the
following:
ineffectiveness of the Company’s business strategy due to changes in current
or future market conditions; the effects of competition, including industry
consolidation and development of competing financial products and services; changes in laws and regulations, including the recent
Dodd-Frank Wall Street Reform and Consumer Protection Act; interest rate
movements; changes in credit quality; volatilities in the securities
markets;
and
deteriorating
economic
conditions,
and
other
risks
and
uncertainties,
including
those
detailed
in
Orrstown
Financial
Services,
Inc.’s
filings
with
the
Securities
and
Exchange
Commission.
The
statements
are
valid
only
as
of
the
date
hereof
and
Orrstown
Financial
Services, Inc. disclaims any obligation to update this information.
Non-GAAP Financial Measures
This presentation contains the non-GAAP financial measures, ratio of
tangible common equity to tangible assets and return on average
tangible equity. In order to calculate tangible common equity and tangible
assets, the Company's management subtracts intangible assets
from
both
common
equity
and
assets.
The
Company
calculates
the
return
on
average
tangible
equity
by
excluding
the
balance
of
intangible
assets and their related amortization expense from the calculation of return on
average equity. Reconciliations of these non-GAAP measures to the
most directly comparable GAAP measures are set forth in the Appendix. Legal
Disclaimers |
 3
(1)
Ranking based on 3 year ROAE of publicly traded banks and thrifts of major
exchanges, pink sheets, and bulletin boards. Private companies that file
with the SEC are also included. Source: SNL Financial (2)
As published by the Central Penn Business Journal (Based on
minimum revenue of $500,000 for 3 years. Companies were first ranked by dollar growth year
one to year three, combined with percentage of growth year one to year three.)
Franchise Overview
•
Headquartered in Shippensburg, PA
•
Founded in 1919
•
20 branches in Pennsylvania and Maryland
–
8 branches in Cumberland County, PA
–
7 branches in Franklin County, PA
–
4 branches in Perry County, PA
–
1 branch in Washington County, MD
•
$1.512 billion in assets and $1.188 billion in
deposits at December 31, 2010
•
In addition to community banking services, provides
trust and investment services to individuals,
businesses, non-profits and municipalities ($929
million of trust and brokerage assets at 12/31/2010)
•
Ranked as one of the top 200 best performing
community
banks
in
the
nation
since
2006
(1)
•
Recognized
for
the
8
th
time
by
the
Central
Penn
Business Journal as one of the 50 Fastest Growing
Companies
(2) |
 4
•
Listed
on
the
NASDAQ
Capital
Market
–
April,
2009
•
Included
in
the
Russell
2000
&
3000
Indices
–
June,
2009
and
June,
2010
•
Selected as one of the top 200 best performing community banks in the
nation by US Banker Magazine for 5 consecutive years
•
Recognized as one of the 50 Fastest Growing Companies by the Central
Pennsylvania
Business
Journal
for
the
8
time
•
Raised
net
capital
proceeds
of
$37.6
million
–
March,
2010
•
Posted record net income, by quarter, for all four quarters of 2010
Highlights
th |
 5
•
In a challenging environment earnings up 24% year-over-year to
$16,581,000 •
Excellent Return Ratios:
–
ROA: 1.21% for 2010
–
ROE: 11.22% for 2010
–
ROTE: 13.19% for 2010
(1)
•
Asset Growth 12/31/09-12/31/10 up 26.4%
•
Deposit Growth 12/31/09-12/31/10 up 29.9%
•
Reduced NPAs
by 32% (3/31/10 –
12/31/10)
•
Reduced NPLs
by 35% (3/31/10 –
12/31/10)
•
NPAs/ Assets 1.07% at 12/31/2010
•
NPLs/ Loans 1.56% at 12/31/2010
Highlights
(1) See Appendix regarding non-GAAP financial measures.
Source: Company Documents as of 12/31/10 |
 6
Highlights
•
Net Interest Margin up 6 bps to 3.72% for 2010 vs. 3.66% in 2009
•
Lowered
Cost
of
Funds
for
24
consecutive months to 85 bps at December
2010
•
Increased dividends for over 20 consecutive years, with a 10 year annual
dividend CAGR
(1)
of 14.9%.
•
Announced an increase in our quarterly cash dividend from 22.5 to 23
cents per share for the first quarter 2011
•
Efficiency ratio 54.89% for the 12 months ended 12/31/2010
(1) Compound annual growth rate
Source: Company Documents |
 7
•
Continued to take advantage of market dislocation to hire talented bankers
•
Recently hired commercial lenders have generated $86 million in new loan
volume since March, 2009
•
Emphasis on growing mortgage business has resulted in 29% increase in
total volume 2010 vs. 2009
–
Expanded mortgage origination team in our East Shore market
–
Began accepting mortgage applications online in 4Q ’10
•
Trust/Brokerage assets grew 25.6% in 2010 to $929 million at 12/31/10
•
Orrstown Financial Advisors net income up 40.4% & revenue up 27.3%
2010 vs. 2009
Highlights |
 8
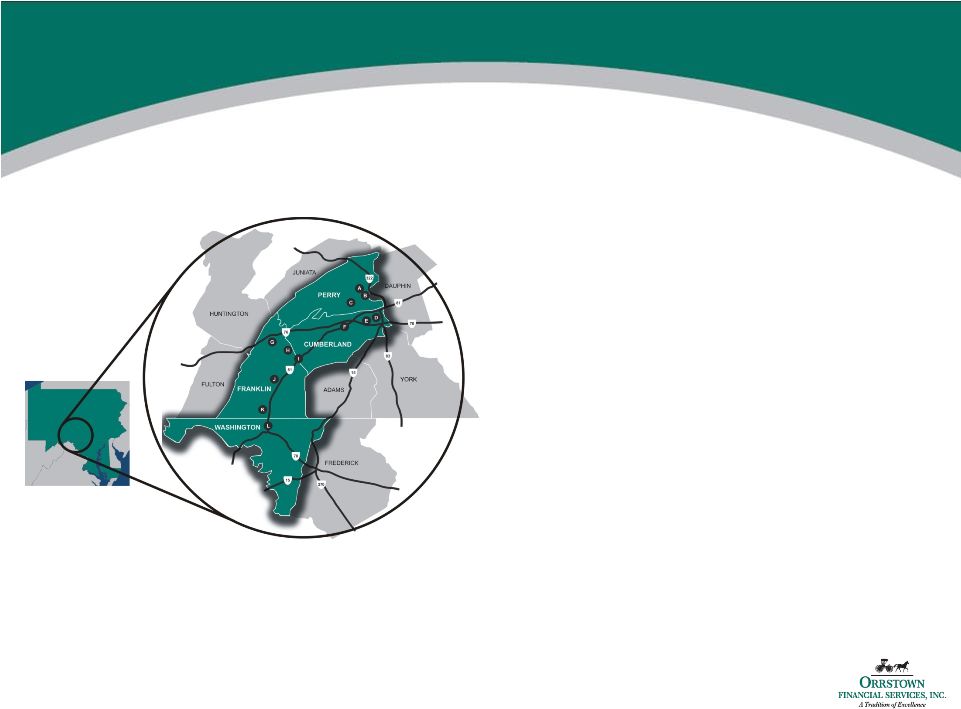
Targeted Market Area
•
The combined population of the current
market area is approximately 578,401.
Over the next 5 years the Household
Income
is
expected
to
grow
12.4%
(1)
•
The current combined market has over
$9.6 billion in total deposits as of June
30, 2010
•
Orrstown
has $1.188 billion deposits at
December 31, 2010, or approximately
12.3% of the total share in its market
area
(2)
•
The four eastern contiguous counties
have total market deposits of $16.2
billion. Over the next 5 years the
Household Income is expected to grow
10.1%
(1)
(1)
U.S.
Census
Bureau,
2009
Population
Estimates,
2000
Census,
1990
Census
(2)
Based on June 30, 2010 total deposits in market as reported by the FDIC
Source: SNL Financial; Company Documents as of 12/31/10
PENNSYLVANIA |
 9
Market Share & Demographics
(1) Based on FDIC data as of June 30, 2010
Source: SNL Financial
*
Based
on
FDIC
data.
Includes
20
full
service
branches;
one
drive
up
location
in
Perry
County;
and
1
branch
in
Washington
County
that
was
closed
as
of
November
30,
2010
Total
County
2010
Pop. Growth
Institutions
Deposit
Deposits
Mkt. Share
County
Population
'00 -
'10
'10 -
'15 Est.
'00 -
'10
'10 -
'15 Est.
in Market
Totals
($000)
Branches
(%)
Rank
Current
Counties
of
Operations
Cumberland, PA
234,508
9.8%
4.2%
31.0%
14.2%
102
$5,184,059
$700,517
8
14.21
3
Franklin, PA
147,089
13.8%
5.8%
26.5%
11.9%
59
$1,924,968
$272,268
7
14.14
5
Perry, PA
45,900
5.3%
2.0%
20.6%
10.5%
21
$613,918
$93,675
5
15.26
4
Washington, MD
150,904
14.4%
6.0%
20.6%
12.8%
57
$1,922,271
$24,537
2
1.28
11
Aggregate / Median
578,401
11.8%
5.0%
23.5%
12.4%
$9,645,216
$1,090,997
Contiguous
Counties
York, PA
434,017
13.7%
5.1%
29.2%
10.7%
149
$6,151,520
Dauphin, PA
259,828
3.2%
1.5%
31.4%
14.5%
98
$5,274,611
Adams, PA
102,759
12.6%
2.6%
24.8%
9.5%
30
$1,191,582
Frederick, MD
232,704
19.2%
4.7%
28.2%
13.6%
87
$3,591,861
Aggregate / Median
1,029,308
7.9%
2.1%
27.0%
10.1%
$16,209,574
Maryland
5,730,892
8.2%
1.9%
26.4%
13.7%
1,800
$112,624,504
$24,537
2
0.02%
116
Pennsylvania
12,574,407
2.4%
0.5%
31.5%
13.3%
4,717
$285,614,733
$1,066,460
20
0.37%
29
US
311,212,863
10.6%
3.9%
29.1%
12.4%
98,180
$6,911,804,490
$1,090,997
22
0.02%
442
Household Inc. Growth
ORRF Market Share
(1)
*
22
* |
 10
Favorable Performance Relative
to Regional Peers
(1)
(1) Includes publicly-traded Mid-Atlantic commercial banks with assets
between $1bn and $2bn as identified in the Appendix (2) See note in Appendix
regarding non-GAAP financial measures Source: Company Documents; SNL
Financial Peer
Metric
ORRF
High
Low
Average
YTD ROA
1.23%
1.42%
(1.24)%
0.45%
YTD ROE
11.47%
15.76%
(43.83)%
3.50%
YTD ROTCE
13.57%
18.81%
(43.83)%
4.60%
Net Interest Margin
3.72%
5.00%
2.77%
3.70%
Efficiency Ratio
53.97%
101.37%
53.57%
66.55%
Non-Interest Income/ Revenue
30.96%
46.26%
5.83%
21.56%
Tangible Common Equity Ratio
(2)
9.80%
9.90%
2.90%
7.30%
Total Risk-Based Capital Ratio
14.90%
21.20%
7.20%
14.00%
Reserves/ Gross Loans
1.67%
3.91%
0.87%
1.63%
Reserves/ NPLs
107.00%
393.99%
23.46%
100.65%
Reserves/ NPAs
90.75%
393.99%
17.45%
95.38%
NPLs/ Gross Loans
1.57%
13.39%
0.32%
3.04%
NPAs/ Assets
1.15%
8.89%
0.15%
2.15%
NCOs/ Average Loans
0.48%
2.95%
0.02%
0.78%
Peer Range
As of 9/30/2010 |
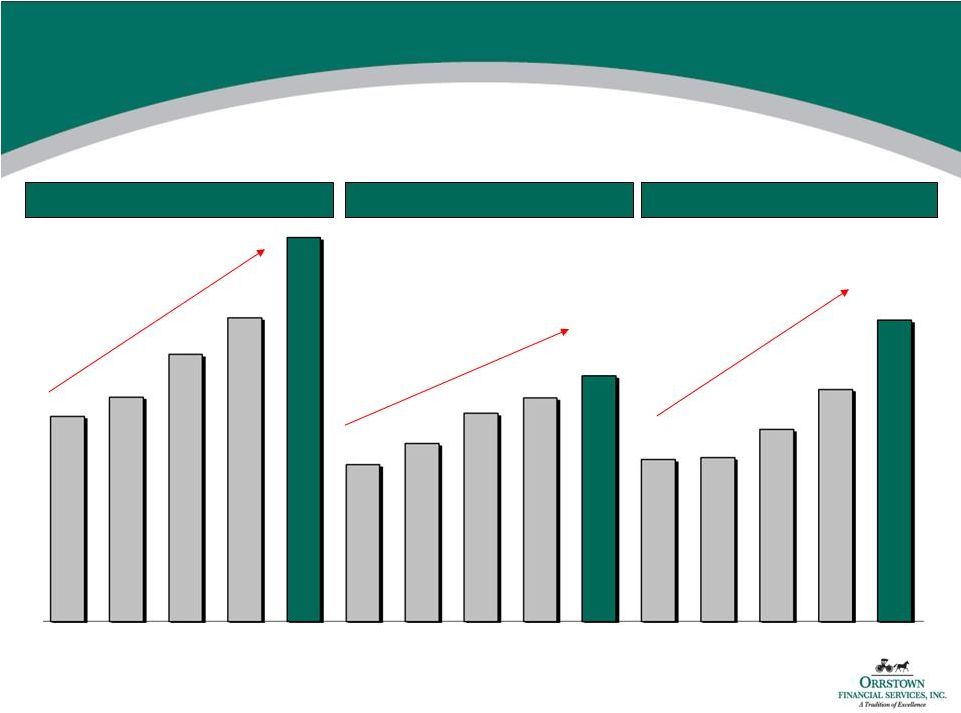 (1)
2006 reflects the acquisition of the First National Bank of Newport ($120mm of
assets and $106mm of deposits) (2)
NOTE: CAGR calculated from 12/31/05-12/31/2010: ‘05 Assets: 601,460;
‘05 Loans: 460,386; ‘05 Deposits: 462,822 Note: Dollar values in
thousands Source: Company Documents as of 12/31/10
Track Record of Strong Growth
Assets
Loans
Deposits
2006¹
2007
2008
2009
2010
2006¹
2007
2008
2009
2010
2006¹
2007
2008
2009
2010
CAGR: 15.99%
CAGR: 20.74%
CAGR: 20.23%
$809,031
$884,979
$1,051,783
$1,196,432
$1,511,722
$618,827
$701,964
$820,468
$881,074
$966,986
$638,719
$646,356
$757,368
$915,170
$1,188,377
11 |
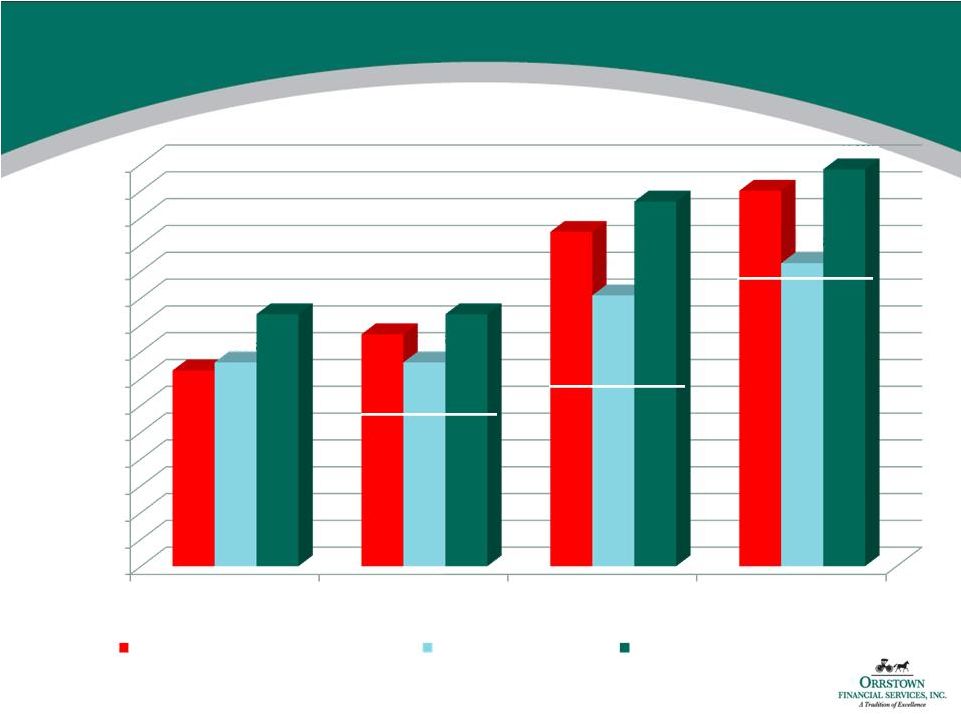 Capital Ratios
(1) See note in appendix regarding non-GAAP financial measures
(2) Calculated in accordance with bank regulatory requirements
Source: Company documents as of 12/31/10, SNL Financial
(2)
(2)
(2)
(1)
-
White line represents regulatory standard for being well capitalized
(before Capital Raise)
(after Capital Raise)
0.00%
1.00%
2.00%
3.00%
4.00%
5.00%
6.00%
7.00%
8.00%
9.00%
10.00%
11.00%
12.00%
13.00%
14.00%
15.00%
TCE/ TA
Tier 1 Leverage
Tier 1 RBC
Total RBC
Peer Group Average 9/30/10
ORRF 12/31/09
ORRF 12/31/10
7.30%
7.60%
9.40%
8.65%
7.60%
9.40%
12.47%
10.10%
13.60%
14.00%
11.30%
14.80%
12 |
 13
Deposit Composition
Source: Company Documents as of 12/31/10
(Dollars in Thousands)
December 31, 2007
December 31, 2008
December 31, 2009
December 31, 2010
Deposit Type
Amount
% of Total
Amount
% of Total
Amount
% of Total
Amount
% of Total
Period End Balances
Non-Interest Bearing DDA
$91,365
14.1%
$84,261
11.1%
$90,676
9.9%
$104,646
8.8%
Interest Bearing DDA
231,413
35.8%
272,372
36.0%
353,428
38.6%
427,085
35.9%
Savings deposits
64,292
9.9%
60,846
8.0%
60,032
6.6%
66,664
5.6%
Time deposits < $100,000
147,211
22.9%
211,354
27.9%
233,299
25.5%
415,516
35.0%
Time deposits > $100,000
112,075
17.3%
128,535
17.0%
177,735
19.4%
174,466
14.7%
Total
$646,356
100.0%
$757,368
100.0%
$915,170
100.0%
$1,188,377
100.0%
Annual Growth
1.2%
17.2%
20.8%
29.9%
Average Total Deposit Cost
2.89%
2.07%
1.52%
0.94%
•
Lowered Cost of Funds for 24 consecutive months
•
Core Deposit growth of 13% |
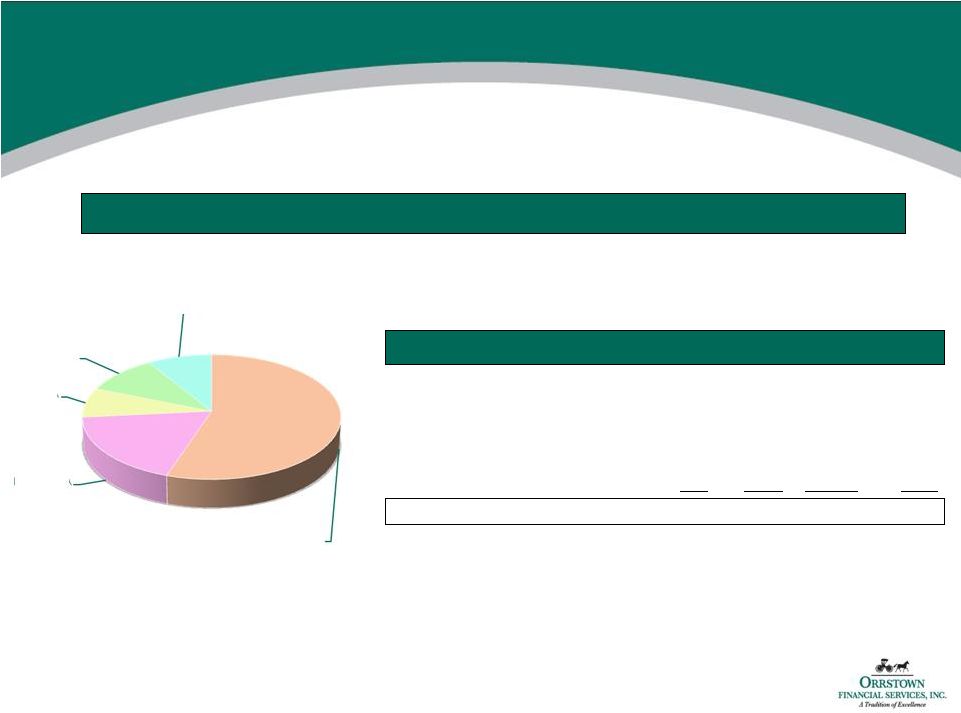
 Investment Portfolio
Current Par Distribution
Source: Company Documents 12/31/2010
•
As of December 31, 2010, the market value of the investment portfolio was
approximately $432 million •
Duration of 4.7 years and average life of 5.6 years
•
Investment portfolio is comprised of 99% A or better rated securities
•
Currently do not hold any corporate or high-yield instruments
Debt Portfolio Breakdown by Rating
AAA
79.9%
AA
18.0%
A
1.2%
BBB
0.4%
NR
0.5%
Gov't
Agency
27%
CMO
17%
MBS
33%
Municipal
22%
Cert. of Dep.
1%
14 |
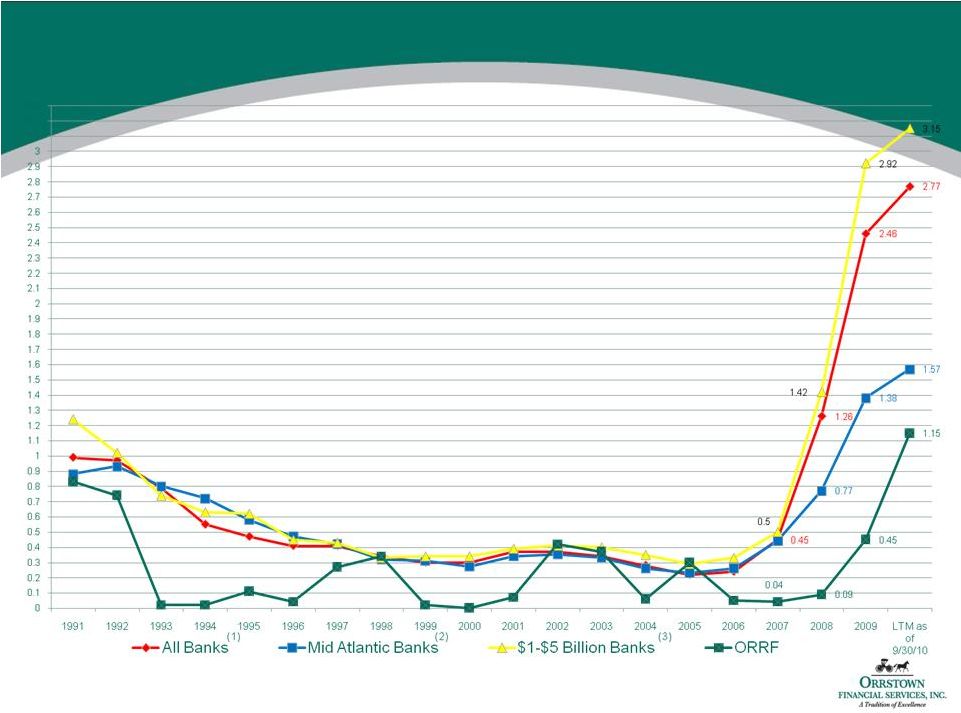
 15
Historical Credit Cycle Analysis
NCOs/ Average Loans
(1)
All Banks as defined by SNL Financial
(2)
Mid-Atlantic Banks as defined by SNL Financial
(3)
$1-$5 Billion Banks as defined by SNL Financial
Source: Company Documents as of 12/31/10; SNL Financial
(3) |
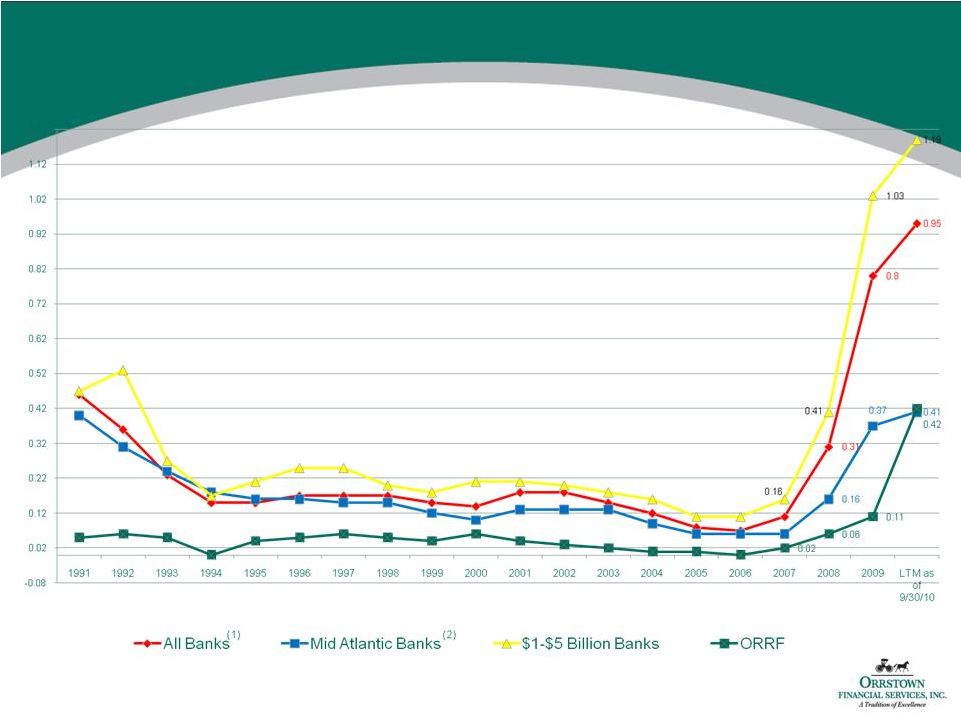
 16
Historical Credit Cycle Analysis
NPAs/ Assets
(1)
All Banks as defined by SNL Financial
(2)
Mid-Atlantic Banks as defined by SNL Financial
(3)
$1-$5 Billion Banks as defined by SNL Financial
Source: Company Documents as of 12/31/10; SNL Financial
|
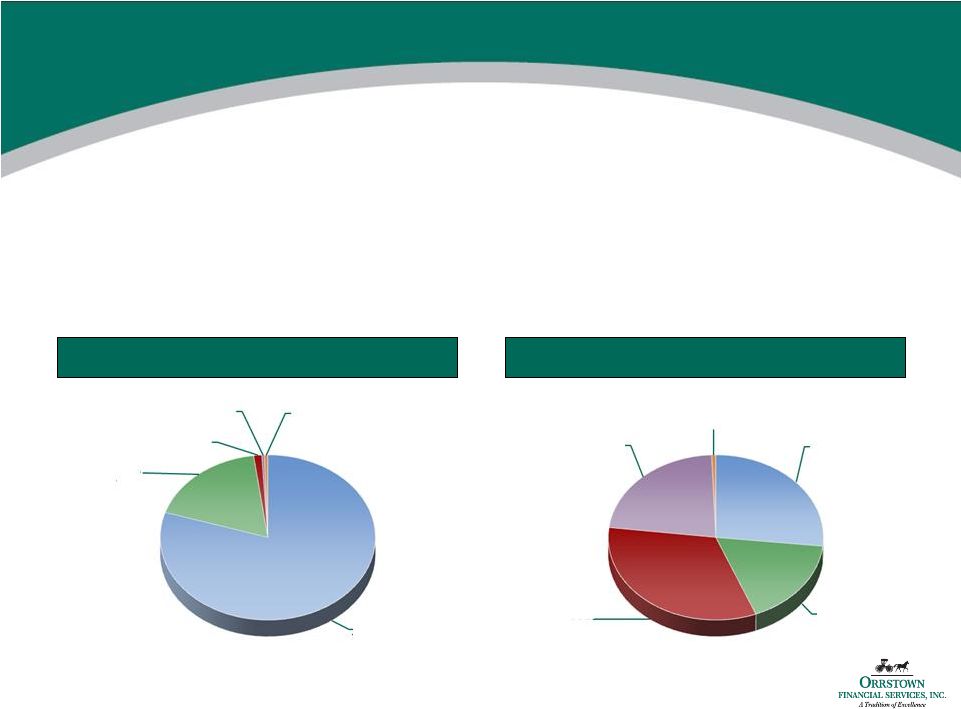
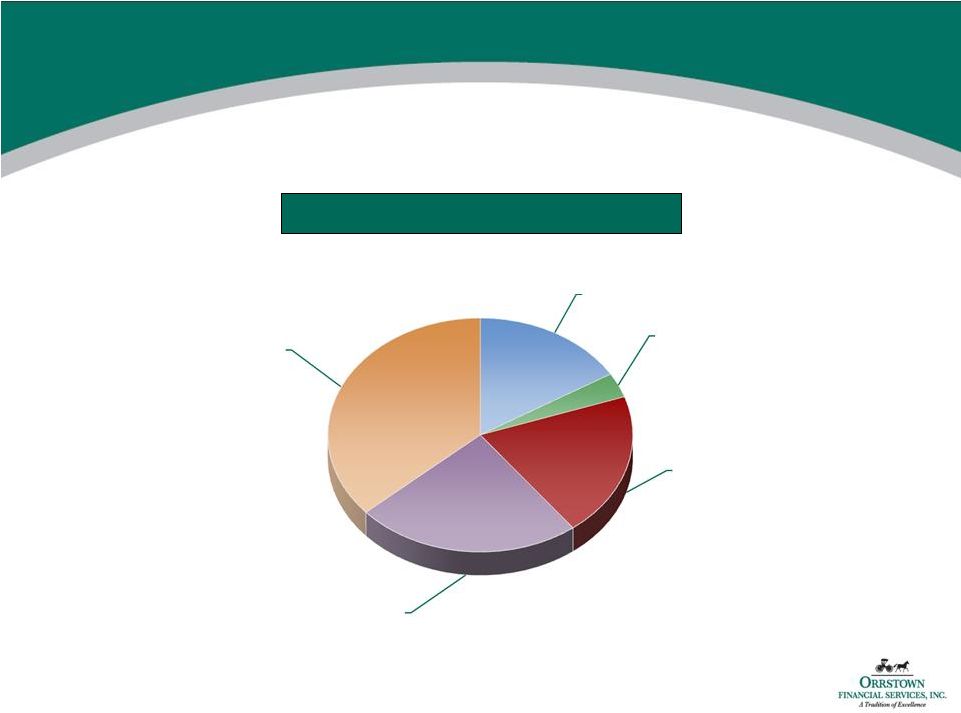
 Loan Portfolio Overview
Loan Stratification by Purpose
Gross Loans: $967 million
Most Recent Quarter Yield: 5.24%
Year to Date Yield: 5.42%
Source: Company Documents as of 12/31/10
17
Commercial
74%
Residential
Mortgage
13%
Home Equity
Loans & Lines
12%
Consumer
1% |
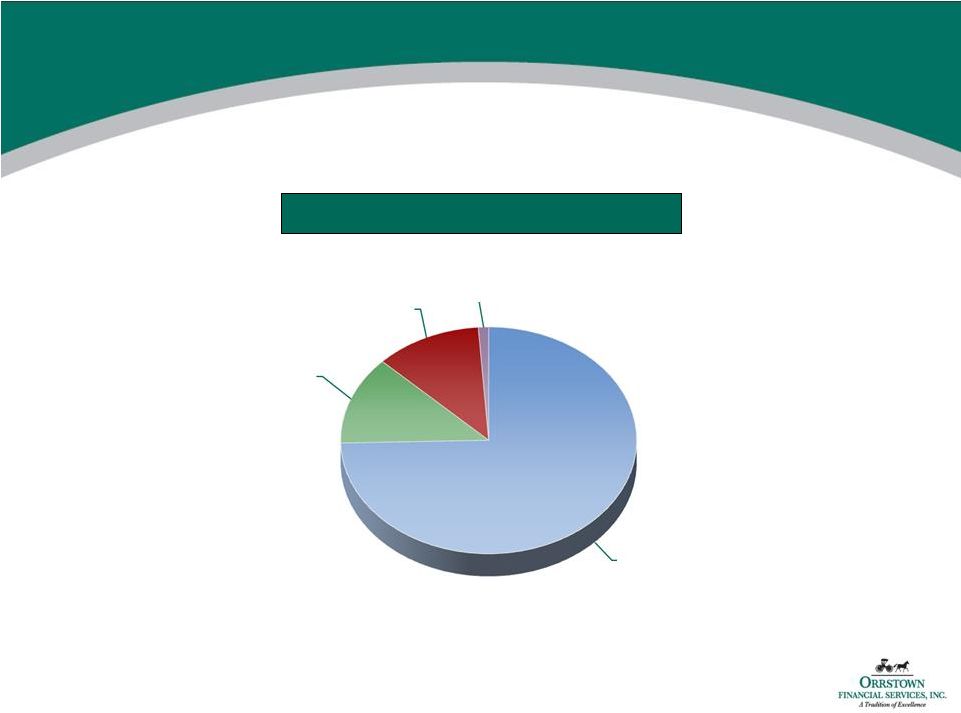
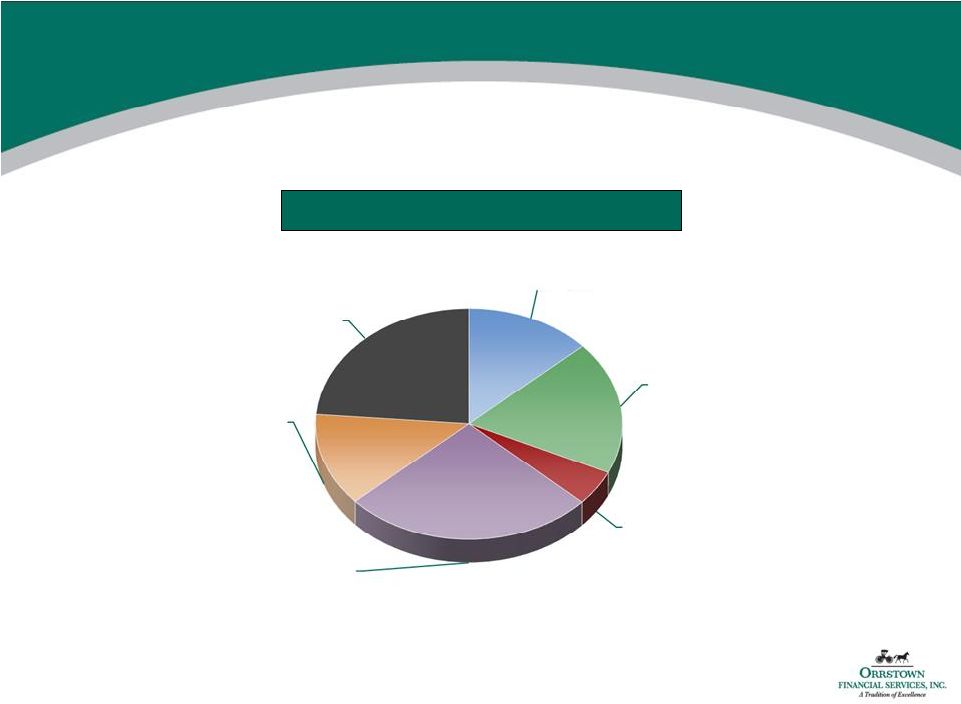
 Loan Portfolio Overview
Source: Company Documents as of 12/31/10
Commercial Loans by Purpose
Commercial Loans: $721 million
Construction &
Land
Development
16%
Multifamily
3%
Non-Owner
Occupied
20%
Owner Occupied
24%
C&I, Term and
Other
37%
18 |
 Construction & Land Development Portfolio: $117 Million
Loan Portfolio Overview
Construction & Land Development Breakdown
Source: Company Documents as of 12/31/10
Commercial
Raw Land
13%
Residential
Raw Land
19%
Commercial
Land
Development
5%
Residential
Land
Development
26%
Commercial
Vertical
Construction
13%
Residential
Vertical
Construction
24%
19 |
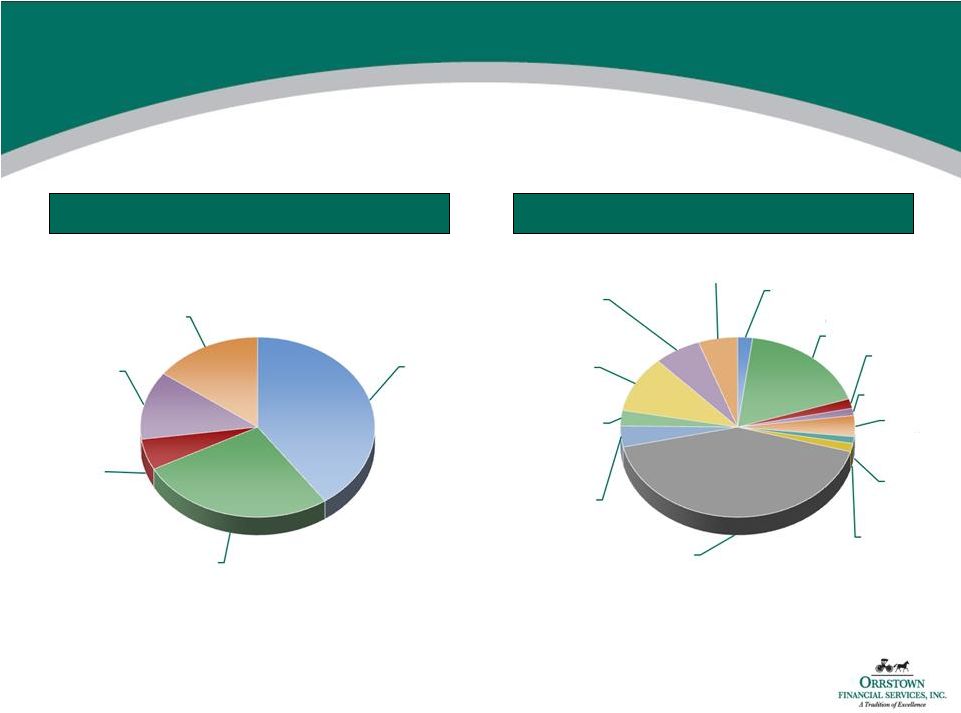 Loan Portfolio
Overview Geographic Distribution¹
Commercial Loans by Industry
(1) Based on location where the borrower resides
Source: Company Documents as of 12/31/10
Cumberland,
PA
40%
Franklin, PA
27%
Perry, PA
6%
Washington,
MD
12%
Other
15%
Agriculture
2%
Construction &
Development
18%
Manufacturing
2%
Wholesale Trade
1%
Retail Trade
4%
Transport
1%
Finance
2%
CRE -
Owner-Occ.
and Non Owner-
Occ.
42%
Professional
4%
Healthcare
3%
Service &
Entertainment
10%
Public Admin.
6%
Other
5%
20 |
 21
Asset Quality Summary
Source: Company Documents as of 12/31/10, SNL Financial
Calendar Year to Date
(Dollars in Thousands)
12/31/2008
12/31/2009
3/31/2010
6/30/2010
9/30/2010
12/31/2010
Loans on a Nonaccrual (cash) Basis
341
$
4,267
$
23,020
$
14,496
$
14,427
$
13,896
$
Loans whose Terms have been Renegotiated
-
-
-
-
-
1,180
Total Non-Performing Loans
341
4,267
23,020
14,496
14,427
15,076
Other Real Estate Owned
608
1,065
873
1,264
2,528
1,112
Total Non-Performing Assets
949
5,332
23,893
15,760
16,955
16,188
90 Days Past Due and Still Accruing
6,176
6,155
8,929
7,255
3,526
2,249
Total Non-Performing and Other Risk Assets
7,125
$
11,487
$
32,822
$
23,015
$
20,481
$
18,437
$
Non-Performing Loans / Total Loans
0.04%
0.48%
2.56%
1.61%
1.57%
1.56%
Non-Performing Assets / Total Assets
0.09%
0.45%
1.82%
1.16%
1.15%
1.07%
Loan Loss Reserve
7,140
$
11,067
$
12,020
$
14,582
$
15,386
$
16,020
$
Loan Loss Reserves / Gross Loans
0.87%
1.26%
1.34%
1.62%
1.67%
1.66%
Reserves / NPLs
2,094%
259%
52%
101%
107%
106%
Net Charge-Offs
451
938
467
2,905
3,231
3,972
Net Charge-Offs / Average Loans
0.06%
0.11%
0.21%
0.65%
0.48%
0.44%
Provision / Net Charge-Offs
322%
519%
304%
221%
234%
225% |
 Nonperforming Assets
NPAs
by Market¹
(1) Based on location where the borrower resides
Source: Company Documents as of 12/31/10
(Dollar Values in Thousands)
Non-Acc.
Total
Gross
NPAs /
County
Loans
TDRs
OREO
NPAs
Loans
Loans+REO
Cumberland, PA
$8,801
$0
$126
$8,927
$389,376
2.29%
Franklin, PA
$1,543
$710
$711
$2,964
$261,050
1.13%
Perry, PA
$1,251
$0
$0
$1,251
$53,822
2.32%
Washington, MD
$1,100
$470
$50
$1,620
$118,951
1.36%
Other
$1,201
$0
$225
$1,426
$143,787
0.99%
Total
$13,896
$1,180
$1,112
$16,188
$966,986
1.67%
Cumberland, PA
55%
Franklin, PA
18%
Perry, PA
8%
Washington,
MD
10%
Other
9%
22 |
 23
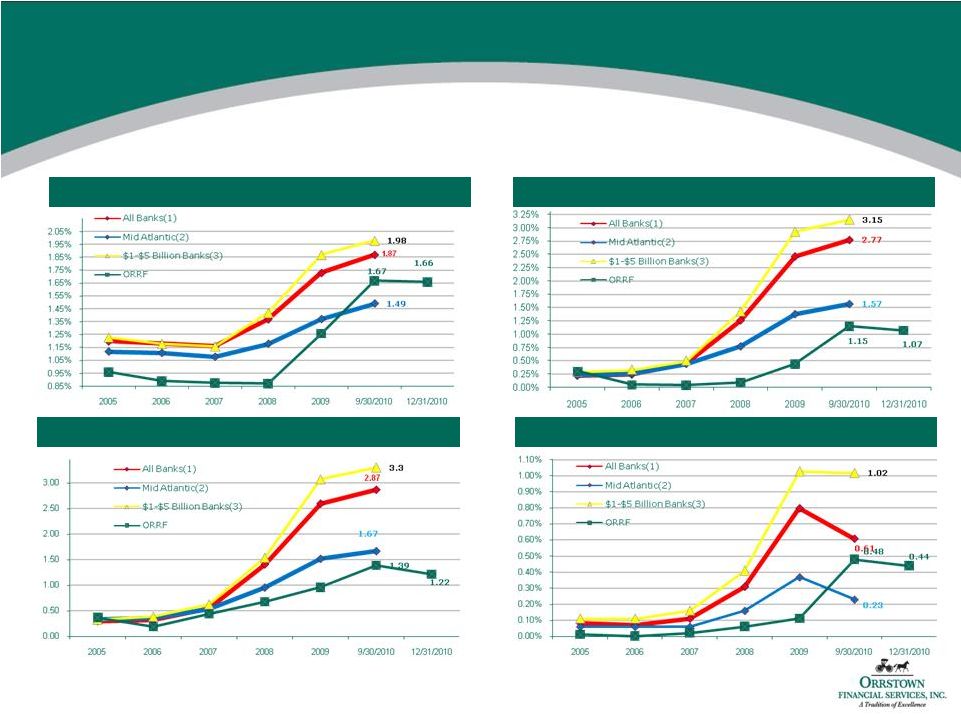
Credit Quality Trends
Net Charge-Offs / Average Loans
Non-Performing Assets / Total Assets
Reserves / Loans
(1)
All Banks as defined by SNL Financial
(2)
Mid Atlantic Banks as defined by SNL Financial
(3)
$1-$5 Billion Dollar Banks as defined by SNL Financial
Source: Company Documents as of 12/31/10; SNL Financial
NPAs
+90days Delinq/ Assets |
 24
•
Established South Central Pennsylvania bank with a history
of strong performance
•
Emphasis on credit quality, return to shareholders, solid
financial performance, and delivering peer-group leading
results
•
Well-positioned for future growth throughout the region, both
organically and through acquisitions
•
Deep and experienced management team with strong
community ties and operational ability
Compelling Investment Considerations |
 25
APPENDIX |
 26
Experienced Management Team
Executive
Title
Thomas R. Quinn, Jr.
President / CEO
2
Years
20
Years
Jeffrey W. Embly
Executive Vice President / Chief Credit/Risk Officer
14
Years
20
Years
Bradley S. Everly
Executive Vice President / Chief Financial Officer
14
Years
33
Years
Philip E. Fague
Executive Vice President / Mortgage & Consumer Business
23
Years
23
Years
Jeffrey S. Gayman
Senior Vice President / Chief Commercial Officer
15
Years
16
Years
Barbara E. Brobst
Senior Vice President, Senior Trust Officer, Orrstown Financial Advisors
14
Years
29
Years
Gary R. Holder
Senior Vice President / Chief Retail Officer
8
Years
19
Years
Michelle N. Paulnock
Senior Vice President of Operations
2
Years
34
Years
Benjamin S. Stoops
Senior Vice President / Chief Technology Officer
13
Years
40
Years
Douglas P. Barton
Senior Vice President & Chief Accounting Officer
1
Years
7
Years
Mark G. Bayer
Vice President & Director of Marketing
4
Years
25
Years
Stephen C. Caldwell
Vice President & Director of Human Resources
10
Years
10
Years
Years with ORRF
Banking Experience |
 27
Summary Financial Highlights
(1) See note in Appendix regarding non-GAAP financial measures
Source: Company Documents as of 12/31/10
Year Ended December 31,
(Dollar Values in Thousands)
2005
2006
2007
2008
2009
2010
Total Assets
$601,460
$809,031
$884,979
$1,051,783
$1,196,432
$1,511,722
Gross Loans
$460,386
$618,827
$701,964
$820,468
$881,074
$966,986
Total Deposits
$462,822
$638,719
$646,356
$757,368
$915,170
$1,188,377
Total Shareholder's Equity
$57,310
$89,388
$96,124
$103,347
$110,886
$160,484
Net Income
$9,987
$11,632
$12,558
$13,103
$13,373
$16,581
Basic Earnings Per Share
$1.76
$1.87
$1.95
$2.04
$2.09
$2.18
Diluted Earnings Per Share
$1.74
$1.86
$1.94
$2.03
$2.07
$2.17
Return on Average Assets
1.81%
1.61%
1.50%
1.38%
1.19%
1.21%
Return on Average Equity
18.69%
15.10%
13.64%
13.20%
12.48%
11.22%
Return on Average Tangible Equity
(1)
19.28%
18.98%
18.02%
17.02%
15.73%
13.19%
Net Interest Margin
4.55%
4.32%
4.08%
3.93%
3.66%
3.72%
Efficiency Ratio
52.86%
53.98%
55.58%
56.73%
58.85%
54.89%
Non-Interest Expense / Avg. Assets
3.14%
2.94%
2.96%
2.97%
2.82%
2.76%
Tang. Common Equity / Tang. Assets
(1)
9.2%
8.6%
8.7%
8.0%
7.6%
9.4%
Total Risk-Based Capital Ratio
12.8%
12.0%
11.6%
10.9%
11.3%
14.8%
Non-Performing Assets / Assets
0.30%
0.05%
0.04%
0.09%
0.45%
1.07%
Loan Loss Reserves / Gross Loans
0.96%
0.89%
0.87%
0.87%
1.26%
1.66% |
 28
Regional Peer Analysis
(1) See note in appendix regarding non-GAAP financial measures
Note:
Includes publicly-traded commercial banks with assets between $1bn and $2bn
headquartered in the Mid Atlantic Financial data as of September 30, 2010;
Market data as of January 7, 2011 Source: Company Documents and SNL
Financial Balance Sheet
Non-
Total
Int. Inc./
Res./
NCOs/
NPAs/
Total
Total
Gross
TCE /
RBC
Eff.
Total
Gross
Res./
Ave
Total
Market
Dividend
Assets
Deposits
Loans
TA
(1)
Ratio
ROAA
ROAE
NIM
Ratio
Rev.
Loans
NPAs
Loans
Assets
Cap.
Yield
Company
St.
Ticker
($mm)
($mm)
($mm)
(%)
(%)
(%)
(%)
(%)
(%)
(%)
(%)
(%)
(%)
(%)
($mm)
(%)
Arrow Financial Corporation
NY
AROW
1,960
1,547
1,155
7.0
15.4
1.19
14.95
3.67
57.23
21.65
1.27
393.99
0.06
0.18
300.1
3.74
Eagle Bancorp, Inc.
MD
EGBN
2,006
1,646
1,602
8.8
12.7
0.82
7.91
4.05
62.04
7.54
1.39
68.67
0.37
1.65
267.4
0.00
Suffolk Bancorp
NY
SUBK
1,690
1,475
1,142
8.9
12.8
0.86
10.41
5.00
54.25
11.84
1.92
46.52
0.56
2.68
245.1
2.37
First United Corporation
MD
FUNC
1,795
1,386
1,044
3.2
12.3
(0.43)
(7.56)
2.77
73.14
23.28
2.33
37.58
0.78
3.70
26.7
0.92
First of Long Island Corporation
NY
FLIC
1,685
1,308
883
9.9
21.2
1.16
14.25
3.85
53.62
10.72
1.41
274.65
0.05
0.15
247.4
3.09
State Bancorp, Inc.
NY
STBC
1,645
1,386
1,114
7.2
13.3
0.64
6.88
4.26
62.92
5.83
2.92
208.16
0.78
0.48
154.1
2.16
Canandaigua National Corporation
NY
CNND
1,665
1,478
1,219
6.4
14.0
1.12
15.76
4.28
59.70
30.38
1.29
60.23
0.36
1.59
158.9
3.39
Peapack-Gladstone Financial Corporation
NJ
PGC
1,480
1,320
944
6.5
13.6
0.52
6.69
3.65
66.66
22.28
1.49
48.07
0.87
2.11
117.4
1.50
Tower Bancorp, Inc.
PA
TOBC
1,619
1,356
1,334
9.4
13.2
0.48
4.51
3.65
69.56
16.19
0.95
86.89
0.21
0.72
158.5
5.08
Alliance Financial Corporation
NY
ALNC
1,447
1,125
903
6.6
14.3
0.82
9.38
3.58
65.69
29.96
1.16
115.70
0.33
0.73
154.6
3.65
First Mariner Bancorp
MD
FMAR
1,333
1,107
985
2.9
7.2
(1.24)
(43.83)
2.86
99.04
46.26
1.54
17.45
1.78
6.00
9.2
0.00
Royal Bancshares of Pennsylvania, Inc.
PA
RBPAA
1,118
743
620
6.3
17.0
(0.89)
(10.18)
2.88
101.37
14.65
3.91
19.53
2.95
8.89
25.4
0.00
Citizens & Northern Corporation
PA
CZNC
1,308
984
727
9.9
16.8
1.42
12.28
3.75
53.57
24.10
1.18
89.21
0.02
0.69
187.8
3.10
VIST Financial Corp.
PA
VIST
1,361
1,078
931
5.2
12.7
0.26
2.69
3.43
69.83
32.91
1.55
33.97
0.76
2.61
53.7
2.43
Bryn Mawr
Bank Corporation
PA
BMTC
1,714
1,260
1,181
8.0
13.2
0.34
3.76
3.81
66.53
32.68
0.87
76.13
1.14
1.02
214.2
3.19
Center Bancorp, Inc.
NJ
CNBC
1,221
837
702
7.9
14.1
0.50
5.52
3.34
61.67
8.57
1.25
51.49
0.55
0.78
144.3
1.35
CNB Financial Corporation
PA
CCNE
1,363
1,115
757
7.9
15.9
0.88
12.20
3.70
58.93
18.59
1.43
58.71
0.28
0.80
179.4
4.50
Shore Bancshares, Inc.
MD
SHBI
1,135
982
906
9.4
13.0
(0.29)
(2.66)
3.98
62.15
30.73
1.45
29.94
2.12
3.86
91.9
2.20
High
2,006
1,646
1,602
9.9
21.2
1.42
15.76
5.00
101.37
46.26
3.91
393.99
2.95
8.89
300.1
5.08
Low
1,118
743
620
2.9
7.2
(1.24)
(43.83)
2.77
53.57
5.83
0.87
17.45
0.02
0.15
9.2
0.00
Mean
1,530
1,230
1,008
7.3
14.0
0.45
3.50
3.70
66.55
21.56
1.63
95.38
0.78
2.15
152.0
2.37
Median
1,550
1,284
964
7.5
13.5
0.58
6.79
3.69
62.54
21.96
1.42
59.47
0.56
1.31
156.5
2.40
Orrstown
Financial Services, Inc.
PA
ORRF
1,478
1,139
922
9.8
14.9
1.23
11.47
3.72
53.97
30.96
1.67
90.75
0.48
1.15
220.4
3.26
Asset Quality
Profitability
Valuation |
 29
Ratio of Tangible Common Equity to Tangible
Assets
The ratio of tangible common equity to tangible assets is a non-GAAP-based financial measure
calculated using non-GAAP- based
amounts.
The
most
directly
comparable
GAAP-based
measure
is
the
ratio
of
stockholders’
equity to assets. In order to
calculate tangible common equity and tangible assets, the Company’s management subtracts
intangible assets from both common equity and assets. Tangible common equity is then
divided by tangible assets to arrive at the ratio of tangible common equity to tangible
assets. Management uses the ratio of tangible common equity to tangible assets to assess the
strength of the Company’s capital position. This is consistent with the treatment by bank
regulatory agencies, which exclude goodwill and other intangible assets from the calculation of
risk-based capital ratios. However, these non-GAAP financial measures are supplemental
and are not a substitute for an analysis based on GAAP measures. A reconciliation of the ratio of
stockholders’
equity to assets and tangible common equity to tangible assets is set forth below.
(Dollar Values in Thousands)
2005
2006
2007
2008
2009
9/30/2010
12/31/2010
Common Equity
57,310
89,388
96,124
103,347
110,886
163,933
160,484
Intangible Assets
1,935
21,567
21,368
21,186
20,938
20,751
20,698
Tangible Common Equity
55,375
67,821
74,756
82,161
89,948
143,182
139,786
Assets
601,460
809,031
884,979
1,051,783
1,196,432
1,477,780
1,511,722
Intangible Assets
1,935
21,567
21,368
21,186
20,938
20,751
20,698
Tangible Assets
599,525
787,464
863,611
1,030,597
1,175,494
1,457,029
1,491,024
Equity/ Assets
9.53%
11.05%
10.86%
9.83%
9.27%
11.09%
10.62%
Tangible Common Equity/ Tangible Assets
9.24%
8.61%
8.66%
7.97%
7.65%
9.83%
9.38%
Year Ended December 31, |
 30
Return on Average Tangible Equity
Return on average tangible equity is a non-GAAP-based financial measure
calculated using non-GAAP-based amounts. The most directly
comparable measure is return on average equity, which is calculated using GAAP-based amounts. The
Company calculates the return on average tangible equity by excluding the balance
of intangible assets and their related amortization expense from the
calculation of return on average equity. Management uses the return on average tangible
equity to assess the Company’s core operating results and believes that this
is a better measure of our performance. Management
uses
the
return
on
average
tangible
assets
and
equity
to assess the Company’s core operating results and
believes that this is a better measure of our operating performance, as it is based
on the Company’s tangible assets and capital. Further we believe
that by excluding the impact of purchase accounting adjustments it allows for a more meaningful
comparison with the Company’s peers; particularly those that may have not have
acquired other companies. Lastly, the exclusion of goodwill and
intangible assets is consistent with the treatment by bank regulatory agencies, which exclude these
amounts from the calculation of risk-based capital ratios. However, these
non-GAAP financial measures are supplemental and are not a substitute
for an analysis based on GAAP measures. A reconciliation of return on average equity to the return on
average tangible equity is set forth below.
(Dollar Values in Thousands, Except PerShare)
2005
2006
2007
2008
2009
9/30/2010
12/31/2010
18.69%
15.10%
13.64%
13.20%
12.48%
11.47%
11.22%
0.59%
3.88%
4.38%
3.82%
3.25%
2.10%
1.97%
19.28%
18.98%
18.02%
17.02%
15.73%
13.57%
13.19%
Year Ended December 31,
Return on average equity (GAAP basis)
Effect of excluding average intangible assets and related amortization
Return on average tangible equity |
 Jeffrey W. Embly
EVP, Chief Credit /Risk Officer
jembly@orrstown.com
Thomas R. Quinn, Jr.
President & Chief Executive Officer
tquinn@orrstown.com
Bradley S. Everly
EVP, Chief Financial Officer
beverly@orrstown.com
717-530-3521
31 |