Attached files
| file | filename |
|---|---|
| EX-99.1 - MANAGEMENT'S PRESENTATION - Mueller Water Products, Inc. | dex991.htm |
| 8-K - FORM 8-K - Mueller Water Products, Inc. | d8k.htm |
 Earnings
Conference Call For The First Quarter Ended
December 31, 2010
These slides are not intended to be a stand-
alone presentation, but are for use in
conjunction with the Earnings Call.
February 2, 2011
Exhibit 99.2 |
 Earnings Conference Call for Quarter Ended December 31, 2010
2
Non-GAAP Financial Measures
The Company presents adjusted income (loss) from operations, adjusted EBITDA, adjusted
net income (loss), adjusted net income (loss) per share, free cash flow and net
debt as non-GAAP measures. Adjusted income (loss) from operations
represents income (loss) from operations excluding restructuring. Adjusted EBITDA represents
income (loss) from operations excluding restructuring, depreciation and amortization.
The Company presents adjusted EBITDA because it is a measure management believes
is frequently used by securities analysts, investors and interested parties in
the evaluation of financial performance. Adjusted net income (loss) and adjusted net
income (loss) per share exclude restructuring, certain costs from settled interest rate
swap contracts and the income tax effects of the previously mentioned
items. These items are excluded because they are not considered indicative
of recurring operations. Free cash flow represents cash flow from operating activities less
capital expenditures. It is presented as a measurement of cash flow because it is
commonly used by the investment community. Net debt represents total debt
less cash and cash equivalents. Net debt is commonly used by the
investment community as a measure of indebtedness. Adjusted income (loss) from operations,
adjusted EBITDA, adjusted net income (loss), adjusted net income
(loss) per share, free cash flow and net debt
have limitations as analytical tools, and securities analysts, investors and interested
parties should not consider any of these non-GAAP measures in isolation or
as a substitute for analysis of the Company's results as reported under
accounting principles generally accepted in the United States ("GAAP").
A reconciliation of GAAP to non-GAAP results is included as an attachment to the
applicable press release and has been posted online at
www.muellerwaterproducts.com Non-GAAP Financial Measures
|
 Earnings Conference Call for Quarter Ended December 31, 2010
3
Safe Harbor Statement
This press release contains certain statements that may be deemed
“forward-looking statements” within the
meaning of the Private Securities Litigation Reform Act of 1995.
All statements that address activities, events or
developments that we intend, expect, plan, project, believe or anticipate will or may
occur in the future are forward-looking statements. Examples of
forward-looking statements include, but are not limited to, statements
we
make
regarding
benefits
we
expect
to
realize
from
operational
savings,
reduced
fixed
costs
associated
with
operational excellence initiatives and our U.S. Pipe plant closure and the impact of
these factors on our businesses. Forward-looking statements are based
on certain assumptions and assessments made by us in light of our experience and
perception of historical trends, current conditions and expected future developments. Actual
results and the timing of events may differ materially from those contemplated by the
forward-looking statements due to a number of factors, including regional,
national or global political, economic, business, competitive, market and
regulatory conditions and the following: •the spending level for water and wastewater infrastructure;
•the demand
level of manufacturing and construction activity; •our ability to service our debt obligations; and
•the other
factors that are described in the section entitled “RISK
FACTORS”
in Item 1A of our most recently
filed Annual Report on Form 10-K.
Undue reliance should not be placed on any forward-looking statements. We do not
have any intention or obligation to update forward-looking statements,
except as required by law. Safe Harbor Statement |
 Earnings Conference Call for Quarter Ended December 31, 2010
4
Consolidated Non-GAAP Results
•
Financial results at both U.S. Pipe and Anvil improved year-over-year
•
Mueller Co. shipment volumes declined due to higher distributor inventory levels coming
into the quarter as well as uncertainty in the municipal market
•
Plant closure, manufacturing and other cost savings benefitted U.S. Pipe
•
Higher sales prices benefitted all three business segments; offset increased raw
material costs $ in millions (except per share amounts)
2011
2010
Net sales
$287.6
$313.1
Adj. income (loss) from operations
($2.4)
$0.7
Adj. operating income (loss) % of net sales
(0.8%)
0.2%
Adj. net loss per share
($0.06)
($0.07)
Adj. EBITDA
$17.7
$21.5
Adj. EBITDA % of net sales
6.2%
6.9%
First Quarter Fiscal
FY 1Q11 results exclude restructuring $1.9 million, $1.2 million net of tax; and interest rate swap
costs of $1.9 million, $1.2 million net of tax. FY 1Q10 results exclude restructuring $0.4
million, $0.2 million net of tax. |
 Earnings Conference Call for Quarter Ended December 31, 2010
5
Consolidated GAAP Results
•
Net sales
–
Essentially flat excluding $24.9 million of first quarter 2010 sales related to two
divested Anvil businesses –
Benefitted from $12.8 million from higher sales prices across all three business
segments, $0.7 million favorable Canadian currency exchange rates, reduced by
$14.1 million lower shipment volumes •
Gross profit
–
$13.7 million higher manufacturing and other cost savings and $12.8 million higher
sales prices partially offset by $10.0 million higher raw material costs, $9.2
million higher per-unit overhead costs due to lower production, and $6.3
million lower shipment volumes •
SG&A
–
1Q10 included $1.6 million gain from the Anvil business sold
$ in millions (except per share amounts)
2011
2010
Net sales
$287.6
$313.1
Gross profit
$49.6
$55.9
Gross profit % of net sales
17.2%
17.9%
Income (loss) from operations
($4.3)
$0.3
Net loss per share
($0.08)
($0.07)
First Quarter Fiscal |
 Earnings Conference Call for Quarter Ended December 31, 2010
6
Consolidated Non-GAAP Results
•
Adjusted income (loss) from operations
–
$10.0 million higher raw material costs, $9.2 million higher per-unit overhead
costs due to lower production,
$6.3
million
lower
shipment
volumes
and
$1.6
million
gain
on
sale
of
business
–
Partially offset by $13.7 manufacturing and other cost savings and $12.8 million
higher sales prices •
Interest expense, net
–
Net interest expense included $1.9 million non-cash costs related to interest rate
swap contracts $ in millions (except per share amounts)
2011
2010
Adj. income (loss) from operations
($2.4)
$0.7
Adj. operating income (loss) % of net sales
(0.8%)
0.2%
Adj. EBITDA
$17.7
$21.5
Adj. EBITDA % of net sales
6.2%
6.9%
SG&A
$52.0
$55.2
Interest expense, net
$15.9
$16.8
Adj. net loss per share
($0.06)
($0.07)
First Quarter Fiscal
FY 1Q11 results exclude restructuring $1.9 million, $1.2 million net of tax; and interest rate swap
costs of $1.9 million, $1.2 million net of tax. FY 1Q10 results exclude restructuring $0.4
million, $0.2 million net of tax. |
 Earnings Conference Call for Quarter Ended December 31, 2010
7
Mueller Co. Segment
•
Net sales
–
$3.7 million from higher prices and $0.7 million of favorable Canadian exchange
rates –
More than offset by $7.9 million lower shipment volumes
•
Adjusted income from operations and adjusted EBITDA
–
$5.4 million of higher per-unit overhead costs due to lower production,
$4.0 million of higher raw material
costs and $3.0 million of lower shipment volumes
–
Partially offset by $3.7 million of higher sales prices and $3.2
million of manufacturing and other cost
savings
FY 1Q11 results exclude restructuring $0.4 million FY 1Q10 results exclude
restructuring $0.1 million $ in millions
2011
2010
Net sales
$129.8
$133.3
Adj. income from operations
$8.8
$16.0
Adj. operating income % of net sales
6.8%
12.0%
Adj. EBITDA
$20.5
$28.4
Adj. EBITDA % of net sales
15.8%
21.3%
First Quarter Fiscal |
 Earnings Conference Call for Quarter Ended December 31, 2010
8
U.S. Pipe Segment
•
Net sales
–
$11.7 million lower shipment volumes partially offset by $6.4 million from higher
prices –
Prices for ductile iron pipe increased 19% year-over-year and 4% sequentially
•
Adjusted loss from operations and adjusted EBITDA
–
$7.5 million of manufacturing and other cost savings and $6.4 million higher sales
prices –
Partially offset by $4.2 million of higher costs due to lower production, $3.7 million
lower shipment volumes and $3.2 million higher raw material costs
FY 1Q11 results exclude restructuring $0.9 million FY 1Q10 results exclude
restructuring $0.3 million $ in millions
2011
2010
Net sales
$74.4
$79.7
Adj. loss from operations
($9.4)
($11.9)
Adj. operating loss % of net sales
(12.6%)
(14.9%)
Adj. EBITDA
($4.9)
($7.5)
Adj. EBITDA % of net sales
(6.6%)
(9.4%)
First Quarter Fiscal |
 Earnings Conference Call for Quarter Ended December 31, 2010
9
Anvil Segment
•
Net sales
–
Increased by $8.2 million year-over-year excluding $24.9 million of first
quarter 2010 net sales due to two
businesses divested early in 2010
–
$5.5 million higher shipment volumes and $2.7 million from higher prices
•
Adjusted income from operations and adjusted EBITDA
–
$3.0 million manufacturing and other cost savings, $2.7 million higher sales prices,
partially offset by $2.8 million higher raw material costs
–
First quarter 2010 included a gain of $1.6 million from the sale
of a business
FY 1Q11 results exclude restructuring $0.6 million
$ in millions
2011
2010
Net sales
$83.4
$100.1
Adj. income from operations
$6.5
$4.5
Adj. operating income % of net sales
7.8%
4.5%
Adj. EBITDA
$10.2
$8.4
Adj. EBITDA % of net sales
12.2%
8.4%
First Quarter Fiscal |
 Earnings Conference Call for Quarter Ended December 31, 2010
10
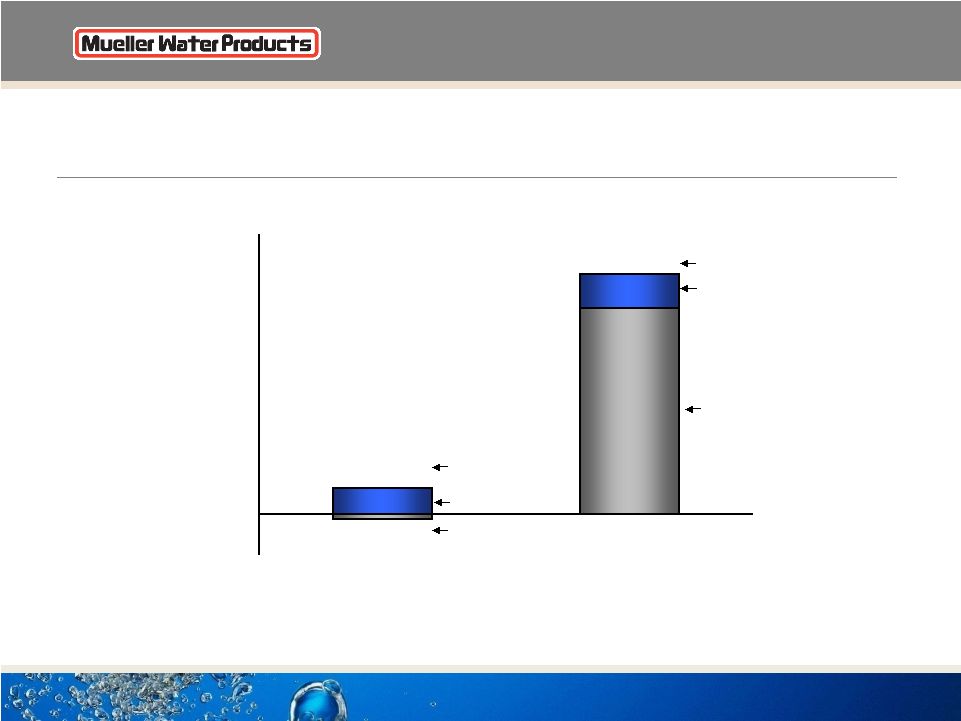
•
Year-over-year change in free cash flow due to timing of cash collections from
customers and an income tax refund of $26.7 million in the 2010 first
quarter Free Cash Flow
$5.2
$60.1
Capital
Expenditures
Cash Flow from
Operations
Free Cash Flow
Cash Flow from
Operations
Free Cash Flow
Capital
Expenditures
Quarter ended December 31,
2010
2009
($1.2)
$51.4
$6.4
$8.7
($10.0)
$0.0
$10.0
$20.0
$30.0
$40.0
$50.0
$60.0
$70.0
2010
2009 |
 Earnings Conference Call for Quarter Ended December 31, 2010
11
Net Debt
$692.5
$737.4
Net Debt
Cash
December 31,
$ in Millions
2010
ABL Revolver (LIBOR + 300 Basis Points)
$49.0
Senior Subordinated Notes (7
3
/
8
%)
420.0
Senior Unsecured Notes (8
3
/
4
%)
221.5
Other
2.0
Total Debt
$692.5
$620.6
$613.4
$71.9
$124.0
$0
$100
$200
$300
$400
$500
$600
$700
$800
12/31/2010
12/31/2009
($ in Millions) |
 Earnings Conference Call for Quarter Ended December 31, 2010
12
Second Quarter Comments
and 2011 Outlook
End of formal slide presentation. Appendix slides to follow.
|
 |
 Earnings Conference Call for Quarter Ended December 31, 2010
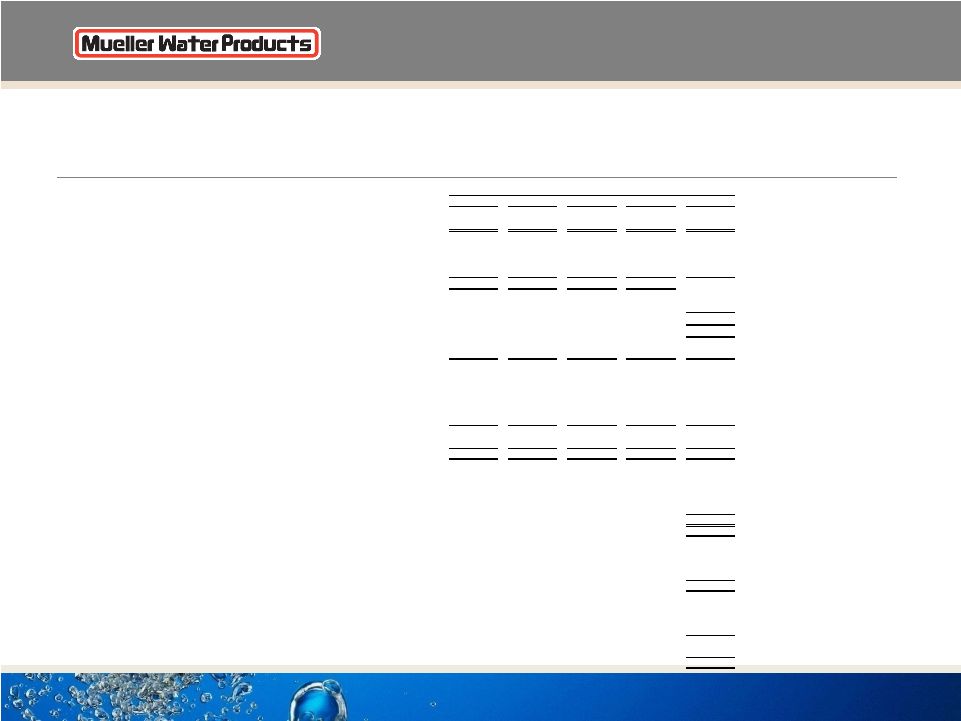
14
Segment Results and Reconciliation of Non-GAAP to
GAAP Performance Measures
(in millions, except per share amounts)
Three months ended December 31, 2010
Mueller Co.
U.S. Pipe
Anvil
Corporate
Total
GAAP results:
Net sales
129.8
$
74.4
$
83.4
$
-
$
287.6
$
Gross profit (loss)
29.2
$
(2.4)
$
22.4
$
0.4
$
49.6
$
Selling, general and administrative expenses
20.4
7.0
15.9
8.7
52.0
Restructuring
0.4
0.9
0.6
-
1.9
Income (loss) from operations
8.4
$
(10.3)
$
5.9
$
(8.3)
$
(4.3)
Interest expense, net
15.9
Income tax benefit
(8.1)
Net loss
(12.1)
$
Net loss per diluted share
(0.08)
$
Capital expenditures
3.2
$
1.4
$
1.4
$
0.4
$
6.4
$
Non-GAAP results:
Adjusted income (loss) from operations and EBITDA:
Income (loss) from operations
8.4
$
(10.3)
$
5.9
$
(8.3)
$
(4.3)
$
Impairment
-
-
-
-
-
Restructuring
0.4
0.9
0.6
-
1.9
Adjusted income (loss) from operations
8.8
(9.4)
6.5
(8.3)
(2.4)
Depreciation and amortization
11.7
4.5
3.7
0.2
20.1
Adjusted EBITDA
20.5
$
(4.9)
$
10.2
$
(8.1)
$
17.7
$
Adjusted net loss:
Net loss
(12.1)
$
Interest rate swap settlement costs, net of tax
1.2
Restructuring, net of tax
1.2
Adjusted net loss
(9.7)
$
Adjusted net loss per diluted share
(0.06)
$
Free cash flow:
Net cash provided by operating activities
5.2
$
Capital expenditures
(6.4)
Free cash flow
(1.2)
$
Net debt (end of period):
Current portion of long-term debt
0.8
$
Long-term debt
691.7
Total debt
692.5
Less cash and cash equivalents
(71.9)
Net debt
620.6
$ |
 Earnings Conference Call for Quarter Ended December 31, 2010
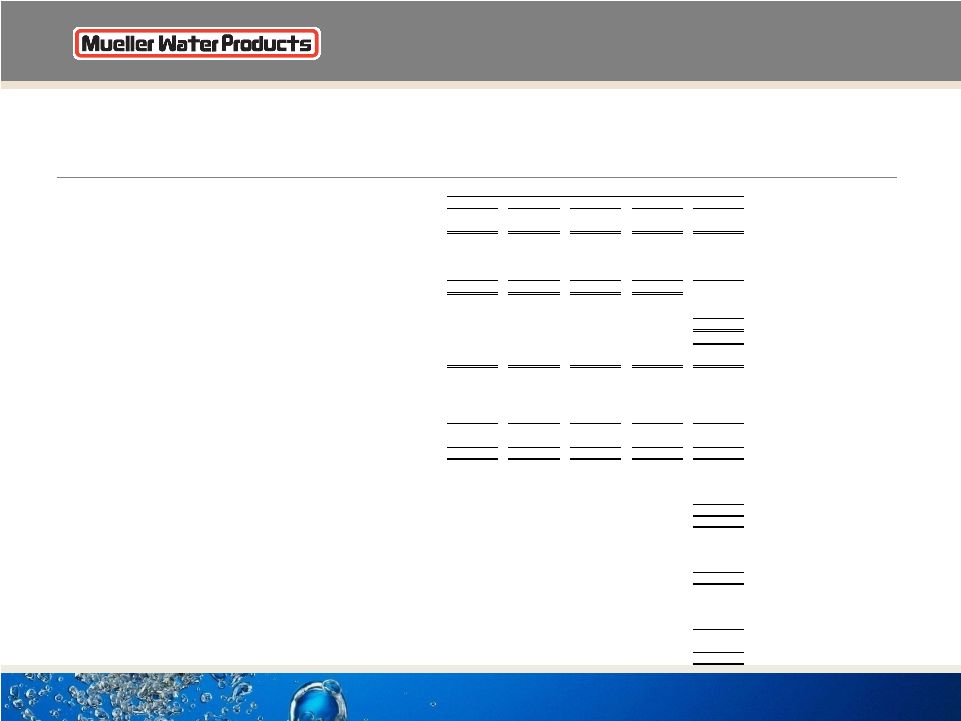
15
Segment Results and Reconciliation of Non-GAAP to
GAAP Performance Measures
(in millions, except per share amounts)
Three months ended December 31, 2009
Mueller Co.
U.S. Pipe
Anvil
Corporate
Total
GAAP results:
Net sales
133.3
$
79.7
$
100.1
$
-
$
313.1
$
Gross profit (loss)
36.9
$
(4.0)
$
23.0
$
-
$
55.9
$
Selling, general and administrative expenses
20.9
7.9
18.5
7.9
55.2
Restructuring
0.1
0.3
-
-
0.4
Income (loss) from operations
15.9
$
(12.2)
$
4.5
$
(7.9)
$
0.3
Interest expense, net
16.8
Income tax benefit
(5.8)
Net loss
(10.7)
$
Net loss per diluted share
(0.07)
$
Capital expenditures
3.7
$
4.0
$
1.0
$
-
$
8.7
$
Non-GAAP results:
Adjusted income (loss) from operations and EBITDA:
Income (loss) from operations
15.9
$
(12.2)
$
4.5
$
(7.9)
$
0.3
$
Restructuring
0.1
0.3
-
-
0.4
Adjusted income (loss) from operations
16.0
(11.9)
4.5
(7.9)
0.7
Depreciation and amortization
12.4
4.4
3.9
0.1
20.8
Adjusted EBITDA
28.4
$
(7.5)
$
8.4
$
(7.8)
$
21.5
$
Adjusted net loss:
Net loss
(10.7)
$
Restructuring, net of tax
0.2
Adjusted net loss
(10.5)
$
Adjusted net loss per diluted share
(0.07)
$
Free cash flow:
Net cash provided by operating activities
60.1
$
Capital expenditures
(8.7)
Free cash flow
51.4
$
Net debt (end of period):
Current portion of long-term debt
11.7
$
Long-term debt
725.7
Total debt
737.4
Less cash and cash equivalents
(124.0)
Net debt
613.4
$ |
 |