Attached files
| file | filename |
|---|---|
| 8-K - ARROW ELECTRONICS, INC. 8-K - ARROW ELECTRONICS INC | a6595728.htm |
| EX-99.1 - EXHIBIT 99.1 - ARROW ELECTRONICS INC | a6595728ex99-1.htm |
EXHIBIT 99.2
Fourth-Quarter 2010 CFO Commentary
As reflected in our earnings release, there are a number of items that impact the comparability of our results with those in the trailing quarter and the fourth quarter of last year. Any discussion of our results will exclude these items to give you a better sense of our operating results. As always, the operating information we provide to you should be used as a complement to GAAP numbers. For a complete reconciliation between our GAAP and Non-GAAP results, please refer to our earnings release or the earnings reconciliation found at the end of this document.
Fourth-Quarter Summary
We finished 2010 with a very strong close, reporting record level revenue and earnings per share and extremely strong cash flow generation in a period of substantial growth. Our results once again demonstrate the significant leverage in the business, as operating income growth outpaced sales growth by almost 3x year over year and earnings per share doubled over the same time period. Our returns reflect our ability to create shareholder value:
● Return on invested capital is up 400 basis points year over year
● Return on working capital of 40% is a new record level for our company
Consolidated Overview – Fourth Quarter
P&L Highlights
($ in millions, except per share data, may reflect rounding)
| 4Q10 |
Q/Q Change |
Y/Y Change | |||
| Sales | $5,238 |
+12% |
+25% | ||
| Gross Profit Margin | 13.0% | Flat | +120bps | ||
| Operating Exp/Sales | 8.5% | -30bps | Flat | ||
| Operating Income | $237.9 | +20% | +70% | ||
| Operating Margin | 4.5% | +20bps | +120bps | ||
| Net Income | $151.6 | +19% | +96% | ||
| Diluted EPS | $1.29 | +19% | +102% |
● Fourth quarter sales of $5.2 billion were in line with our expectations
o Increased 25% year over year
o Increased 12% on a sequential basis
■ Pro forma for acquisitions and excluding FX, sales were up 21% year over year and 10% sequentially
o This is quite a milestone for us as we have achieved our first $5 billion quarter
● Consolidated gross profit margin was 13.0%
o Increased 120 basis year over year, driven by solid increases in almost all of our businesses and regions
o On a sequential basis gross margin was flat, which is above normal seasonality
o Gross margin in our core customer base of small and medium size customers increased 10 basis points from the third quarter
● Operating expenses as a percentage of sales was 8.5%
o Flat year over year
o Decreased 30 basis points sequentially
o On an absolute dollar basis, operating expenses increased 25% year over year and 9% sequentially, primarily driven by the recent acquisitions and higher expenses to support increased sales
■ Pro forma for acquisitions, operating expenses were up only 12% year over year, well below sales growth, and were up 4% sequentially
● Operating income was $237.9 million
o Increased 70% year over year
o Increased 20% sequentially
o Operating income growth once again outpaced sales growth, increasing almost 3x faster than sales on a year-over-year basis
● Operating income as a percentage of sales was 4.5%
o Increased 120 basis points year over year
o Increased 20 basis points sequentially.
● Effective tax rate for the quarter was 30.0%
● Net income was $151.6 million
o Increased 96% compared with last year
o Increased 19% sequentially
● Earnings per share were $1.31 and $1.29 on a basic and diluted, respectively
o This is a record level of quarterly earnings per share for Arrow
Global Components
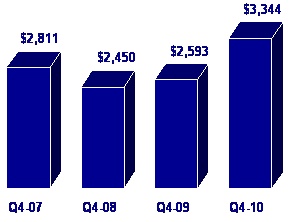
Sales ($ in millions)
● Sales increased 29% year over year and declined 3% sequentially
o Increased 31% year over year and declined 4% sequentially, excluding the impact of foreign exchange
● Gross margin increased 130 basis points year over year led by strength in the Americas and Asia Pacific
o Sequentially, gross margin increased 20 basis points
● Lead times are returning to more normal levels, with the exception of a few specific areas
o No meaningful changes in cancellation rates
● Our quarterly survey of approximately 300 customers in North America shows that the outlook for purchase requirements heading into the first quarter remained positive
o The majority of the surveyed customers believe they have the appropriate level of inventory heading into the first quarter
● Operating profit grew more than 2.5x faster than sales on a year-over-year basis, again demonstrating the operating leverage in the business
● Return on working capital increased 600 basis points year over year
Americas Components
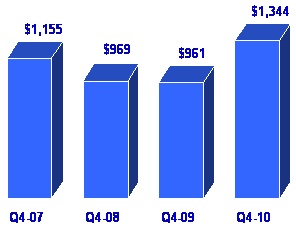
Sales ($ in millions)
● Sales increased 40% year over year and declined 2% sequentially
o Sales at high end of normal seasonality
● Vertical markets continued to exhibit very strong year-over-year growth, with lighting increasing in excess of 30% and medical and alternative energy increasing 15%
o In 2010 we outgrew the market in lighting, medical, aerospace & defense, and alternative energy
● Operating income grew faster than sales year over year
o Operating margin increased 40 basis points year over year
● Looking ahead to the first quarter, we would expect our organic growth to be at the low end of normal seasonality
Europe Components
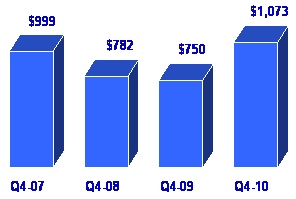
Sales ($ in millions)
● Sales increased 43% year over year and 2% sequentially
o Sales ahead of normal seasonality
● Excluding the impact of foreign exchange, sales were up 52% year over year and down 3% quarter over quarter
● Performance in Central Europe remains solid driven by a strong export market
● Continued strength in vertical markets with automotive and lighting increasing more than 40% year over year and medical and aerospace and defense up 35%
● Operating income grew almost 5x faster than sales on a year over year basis
o Operating margin increased 270 basis points year over year
● Return on working capital doubled year over year
● Looking forward, we would expect sales growth to be in line with normal seasonality in the first quarter
Asia Pacific Components
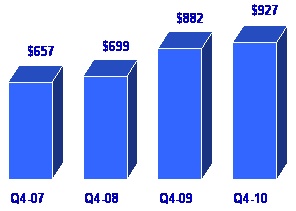
Sales ($ in millions)
● Sales increased 5% year over year and declined 9% sequentially
● Growth in our core business was still strong, increasing almost 29% year over year, with good performance in greater China and south Asia
o Sequentially, the core business declined 4%, in line with normal seasonality
o Total Asia sales below normal seasonality due to a slowdown in the low-end handset market
● Strong performance in a number of vertical markets including lighting and auto, which increased 55% and 65% year over year, respectively.
o Lighting sales reached $100 million in the region
● Operating profit was up 45% year over year and increased almost 9x faster than sales
o Operating margin in our core business increased 120 basis points year over year
● Looking ahead to the first quarter, we would expect sales to be in line with the high end of normal seasonality. Visibility into Q1 is somewhat limited given the impact of Chinese New Year.
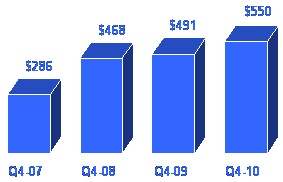
Global Enterprise Computing Solutions
Sales ($ in millions)
● Sales increased 18% year over year and 55% sequentially
● Sales well ahead of normal seasonality
o Extremely strong double-digit sequential growth in all products
■ ISS (60%+), proprietary (55%+), storage (40%+), software (65%+)
o Very strong double-digit year over year growth in ISS, storage, software, and services
● Gross margin increased 110 basis points year over year and was up 40 basis points sequentially, driven by changes in mix
● Operating income grew 29% year over year and increased 151% from the third quarter
o Operating margin increased 40 basis points year over year
● Looking ahead to the first quarter we would expect sales to be in line with normal seasonality
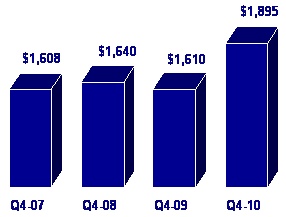
ECS America
Sales ($ in millions)
● Sales increased 20% year over year and 47% sequentially
● Sales growth well ahead of normal seasonality driven by continued strong performance in storage, software, industry-standard servers, and services
o Acquisitions (Shared Technologies) added 5% to sales growth year over year
● Gross profit increased 180 basis points year over year and 60 basis points sequentially primarily due to improved product mix and the addition of Shared Technologies
● A combination of top-line growth and improved gross profit resulted in an increase in operating income growth of 33% year over year and 81% sequentially
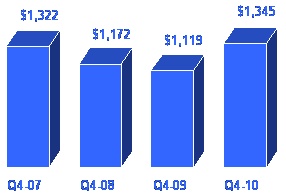
ECS Europe
Sales ($ in millions)
● Sales increased 12% year over year and 79% sequentially
o Excluding the impact of FX, sales increased 23% year over year and 72% sequentially
● Sales growth ahead of normal seasonality
o We saw strong performance in all regions, led by the UK and Nordic region
o Acquisitions (Diasa and Sphinx) added 8% to sales growth year over year
● On a year-over-year basis, operating profit increased 18% to a record high level
o Operating margin is in line with the North America level
● Return on working capital is almost 2x the corporate average
Cash Flow and Balance Sheet Highlights
|
● |
Working Capital |
| We continue to effectively manage all levers of our working capital and working capital to sales of $.11 remains significantly better than our long-term target range. Return on working capital increased 860 basis points year over year and is 40% on a consolidated basis. This is a key driver in creating shareholder value. | |
|
● |
Return on Invested Capital |
| Our return on invested capital increased 400 basis points year over year to 15.4%, again demonstrating our commitment to generating superior returns for our shareholders. ROIC is now higher than the upper end of our long-term target. | |
|
● |
Cash Flow from Operations |
| We generated more than $460 million in cash from operations during the quarter. For the full year, cash flow from operations was $221 million, which is quite impressive in a year of 28% revenue growth. This marks our 10th consecutive year of positive cash flow generation. This remains a critical aspect of our strategy as it creates flexibility for us as we go forward. | |
|
● |
Share Buyback |
| During the fourth quarter we executed on $42 million of share repurchases, and completed a total of $167 million throughout 2010. We now have $33 million remaining under our $200 million authorization that can be spent on future buybacks. |
|
● |
Debt and Liquidity |
| In the beginning of the quarter we successfully completed a $500 million bond offering of two tranches of senior notes due 2015 and 2021 at near all time low rates while extending our maturity profile and improving liquidity. Our balance sheet and capital structure remain strong with conservative debt levels, and a net debt to EBITDA ratio of approximately 1x. Our financial position remains extremely strong, and with our recent upsizing of the asset securitization we now have $1.4 billion in committed liquidity facilities in addition to our cash of more than $900 million. Thus we now have the flexibility to take advantage of opportunities in the marketplace. |
Consolidated Overview – Full Year 2010
P&L Highlights
($ in millions, except per share data, may reflect rounding)
| 2010 | Y/Y Change | |||
| Sales | $18,745 | +28% | ||
| Gross Profit Margin | 12.9% | +100bps | ||
| Operating Exp/Sales | 8.7% | -60bps | ||
| Operating Income | $784.3 | +107% | ||
| Operating Margin | 4.2% | +160bps | ||
| Net Income | $493.5 | +144% | ||
| Diluted EPS | $4.13 | +146% |
● 2010 sales of $18.7 billion increased 28% year over year
o Driven primarily by strong organic growth in all regions
■ Pro forma for acquisitions and excluding FX, sales were up 25% year over year
● Consolidated gross profit margin was 12.9%
o Increased 100 basis points year over year driven by strength in the components segment and a change in geographic mix
● Operating expenses as a percentage of sales was 8.7%
o Decreased 60 basis points year over year
o On an absolute dollar basis, operating expenses increased 19% year over year, driven by the recent acquisitions, higher expenses to support increased sales, and the reinstatement of certain employee-related costs that were temporarily suspended during the global economic downturn
■ Pro forma for acquisitions, operating expenses were up only 11% year over year
● Operating income was $784.3 million
o Increased 107% year over year
o Operating income grew almost 4x faster than sales year over year
● Operating income as a percentage of sales was 4.2%
o Increased 160 basis points year over year
o Within the range of our long-term targets
● Effective tax rate for the year was 30.5%
● Net income was $493.5 million
o Increased 144% compared with last year
● Earnings per share were $4.18 and $4.13 on a basic and diluted, respectively
o This marks the highest level ever reported
● Returns increased significantly year over year
o Return on working capital of nearly 36% is almost 2x greater than last year
o Return on invested capital also almost doubled to 14%
First Quarter 2011 Guidance
● Consolidated Sales $4.75Bn to $5.15Bn
o Global Components $3.55Bn to $3.75Bn
o Global ECS $1.2Bn to $1.4Bn
● Diluted EPS* $1.06 to $1.16
*Excluding charges, including $.04 estimated amortization of intangible assets.
On an organic basis, we would expect growth in both of our business segments to track in line with normal seasonality in the first quarter. The addition of our recently acquired businesses will result in above seasonal growth in global components. Our guidance does not include the pending acquisition of the RF, Wireless & Power Division of Richardson Electronics, Ltd.
Risk Factors
The discussion of the company’s business and operations should be read together with the risk factors contained in Item 1A of its 2010 Annual Report on Form 10-K, filed with the Securities and Exchange Commission, which describe various risks and uncertainties to which the company is or may become subject. If any of the described events occur, the company’s business, results of operations, financial condition, liquidity, or access to the capital markets could be materially adversely affected.
Certain Non-GAAP Financial Information
In addition to disclosing results that are determined in accordance with Generally Accepted Accounting Principles ("GAAP"), the company provides certain non-GAAP financial information relating to operating income, net income attributable to shareholders and net income per basic and diluted share, each as adjusted for certain charges, credits and losses that the company believes impact the comparability of its results of operations. These charges, credits and losses arise out of the company's efficiency enhancement initiatives, acquisitions, prepayment of debt, and certain legal and tax matters. A reconciliation of the company's non-GAAP financial information to GAAP is set forth in the table below.
The company believes that such non-GAAP financial information is useful to investors to assist in assessing and understanding the company's operating performance and underlying trends in the company's business because management considers the charges, credits and losses referred to above to be outside the company's core operating results. This non-GAAP financial information is among the primary indicators management uses as a basis for evaluating the company's financial and operating performance. In addition, the company's Board of Directors may use this non-GAAP financial information in evaluating management performance and setting management compensation.
The presentation of this additional non-GAAP financial information is not meant to be considered in isolation or as a substitute for, or alternative to, operating income, net income and net income per basic and diluted share determined in accordance with GAAP. Analysis of results and outlook on a non-GAAP basis should be used as a complement to, and in conjunction with, data presented in accordance with GAAP.
Earnings Reconciliation
($ in thousands, except per share data)
|
Q410 |
Q409 |
2010 |
2009 |
||||||||||||
|
Operating income, as Reported |
$ | 231,795 | $ | 115,296 | $ | 750,775 | $ | 272,787 | |||||||
|
Restructuring, integration, and other charges |
6,070 | 24,661 | 33,494 | 105,514 | |||||||||||
|
Operating income, as Adjusted |
$ | 237,865 | $ | 139,957 | $ | 784,269 | $ | 378,301 | |||||||
|
Net income attributable to shareholders, as Reported |
$ | 157,889 | $ | 63,093 | $ | 479,630 | $ | 123,512 | |||||||
|
Restructuring, integration, and other charges |
5,459 | 14,452 | 24,605 | 75,720 | |||||||||||
| Loss on prepayment of debt | - | - | 964 | 3,228 | |||||||||||
| Impact of settlement of tax matters | |||||||||||||||
| Income tax | (9,404 | ) | - | (9,404 | ) | - | |||||||||
| Interest (net of taxes) | (2,312 | ) | - | (2,312 | ) | - | |||||||||
|
Net income attributable to shareholders, as Adjusted |
$ | 151,632 | $ | 77,545 | $ | 493,483 | $ | 202,460 | |||||||
|
Diluted EPS, as Reported |
$ | 1.34 | $ | .52 | $ | 4.01 | $ | 1.03 | |||||||
|
Restructuring, integration, and other charges |
.05 | .12 | .21 | .63 | |||||||||||
| Loss on prepayment of debt | - | - | .01 | .03 | |||||||||||
| Impact of settlement of tax matters | |||||||||||||||
| Income tax | (.08 | ) | - | (.08 | ) | - | |||||||||
| Interest (net of taxes) | (.02 | ) | - | (.02 | ) | - | |||||||||
|
Diluted EPS, as Adjusted |
$ | 1.29 | $ | .64 | $ | 4.13 | $ | 1.68 | |||||||
The sum of the components for net income per share, as Adjusted, may not agree to totals, as presented, due to rounding.
Earnings Reconciliation
References to restructuring and other charges refer to the following incremental charges taken in the periods indicated:
Q4-10 Restructuring, Integration, and Other Charges: During the fourth quarter of 2010, the company recorded restructuring, integration, and other charges of $6.1 million ($5.5 million net of related taxes or $.05 per share on both a basic and diluted basis) primarily related to initiatives taken by the company to improve operating efficiencies.
Q4-10 Impact of Settlement of Tax Matters: During the fourth quarter of 2010, the company recorded a net reduction of the provision for income taxes of $9.4 million ($.08 per share on both a basic and diluted basis) and a reduction in interest expense of $3.8 million ($2.3 million net of related taxes or $.02 per share on both a basic and diluted basis) primarily related to the settlement of certain income tax matters covering multiple years.
Q4-09 Restructuring, Integration, and Other Charges: During the fourth quarter of 2010, the company recorded restructuring, integration, and other charges of $24.7 million ($14.5 million net of related taxes or $.12 per share on both a basic and diluted basis) primarily related to initiatives taken by the company to improve operating efficiencies.
2010 Restructuring, Integration, and Other Charges: During 2010, the company recorded restructuring, integration, and other charges of $33.5 million ($24.6 million net of related taxes or $.21 per share on both a basic and diluted basis) primarily related to initiatives taken by the company to improve operating efficiencies.
2010 Loss on Prepayment of Debt: During 2010, the company recorded a loss on prepayment of debt of $1.6 million ($1.0 million net of related taxes or $.01 per share on both a basic and diluted basis).
2010 Impact of Settlement of Tax Matters: During 2010, the company recorded a net reduction of the provision for income taxes of $9.4 million ($.08 per share on both a basic and diluted basis) and a reduction in interest expense of $3.8 million ($2.3 million net of related taxes or $.02 per share on both a basic and diluted basis) primarily related to the settlement of certain income tax matters covering multiple years.
2009 Restructuring, Integration, and Other Charges: During 2009, the company recorded restructuring, integration, and other charges of $105.5 million ($75.7 million net of related taxes or $.63 per share on both a basic and diluted basis) primarily related to initiatives taken by the company to improve operating efficiencies.
2009 Loss on Prepayment of Debt: During 2009, the company recorded a loss on prepayment of debt of $5.3 million ($3.2 million net of related taxes or $.03 per share on both a basic and diluted basis).
14