Attached files
| file | filename |
|---|---|
| 8-K - FORM 8-K - ABRAXAS PETROLEUM CORP | axas8k020211.htm |
| EX-99.1 - NEWS RELEASE - ABRAXAS PETROLEUM CORP | nr020111.htm |
| EX-99.2 - NEWS RELEASE - ABRAXAS PETROLEUM CORP | nr020211.htm |
February 3-4, 2011
Hollywood, Florida
Exhibit 99.3

2
Forward-Looking Statements
The information presented herein may contain predictions, estimates and
other forward-looking statements within the meaning of Section 27A of the
Securities Act of 1933 and Section 21E of the Securities Exchange Act of
1934. Although the Company believes that its expectations are based on
reasonable assumptions, it can give no assurance that its goals will be
achieved.
other forward-looking statements within the meaning of Section 27A of the
Securities Act of 1933 and Section 21E of the Securities Exchange Act of
1934. Although the Company believes that its expectations are based on
reasonable assumptions, it can give no assurance that its goals will be
achieved.
Important factors that could cause actual results to differ materially from
those included in the forward-looking statements include the timing and
extent of changes in commodity prices for oil and gas, the need to develop
and replace reserves, environmental risks, competition, government
regulation and the ability of the Company to meet its stated business
goals.
those included in the forward-looking statements include the timing and
extent of changes in commodity prices for oil and gas, the need to develop
and replace reserves, environmental risks, competition, government
regulation and the ability of the Company to meet its stated business
goals.

3
AXAS Highlights
§ NASDAQ: AXAS
§ Fully diluted shares outstanding: ~88.4 million (PF offering)
§ ~50% institutional
§ ~10% insider
§ Current average trading volume: ~840,000 shares per day
§ Market capitalization: ~$400 million (PF offering)
§ Total long-term debt: ~$87 million (PF offering)
§ High quality assets
§ Unparalleled upside opportunities
§ Significant hedge position
§ Expanded 2011 CapEx: $60 million (PF offering)
§ Recent equity offering: 20.5 million shares at $4.40
§ (12 million primary and 8.5 million secondary)
4
AXAS Assets
§ 50,000+ net acres in unconventional oil plays
§ Large inventory of unconventional and conventional drilling locations
§ Undeveloped leasehold has been largely de-risked by industry and offset operator activity
§ Undeveloped leasehold is primarily held by production
§ Substantial base of MLP-like producing properties
§ 2011 expanded budget of $60 million is 100% oil or liquids weighted
§ Secondary component of recent equity offering eliminated overhang perception
§ PF offering - 3.3 million shares(1) held by the MLP investors are freely tradable
(1) Excludes 5.2 MM shares held by Lehman and 2.4 MM shares subject to lock-ups that extend to January 2012

5
AXAS Hedges
|
|
|
2011
|
2012
|
2013
|
AVE.
|
|
OIL - weighted average price
|
|
$81.33
|
$70.89
|
$80.79
|
$75.69
|
|
% OIL PDP(1)
|
|
84%
|
84%
|
69%
|
|
|
|
|
|
|
|
|
|
GAS - weighted average price
|
|
$6.52
|
$6.77
|
$6.84
|
$6.69
|
|
% GAS PDP(1)
|
|
82%
|
81%
|
66%
|
|
NYMEX-based fixed price swaps:
(1) As of December 31, 2009
6
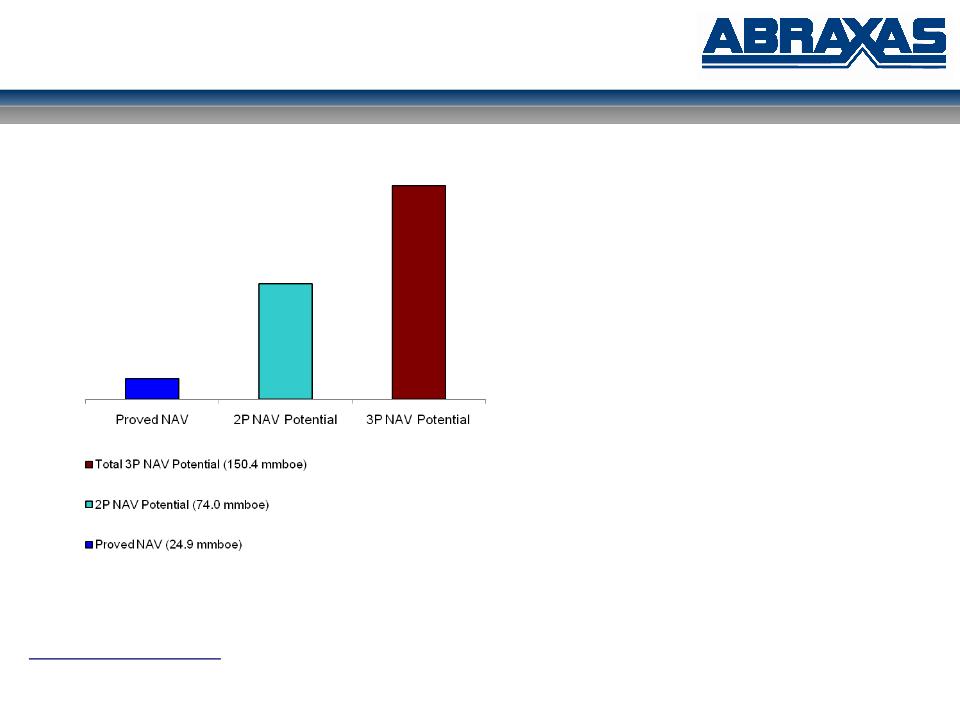
Pro Forma Net Asset Value
(1) Includes identified and resource potential on Bakken, Niobrara, Eagle Ford, Pekisko and Texas oil plays. Excludes identified and resource reserves in Alberta Basin Bakken
and $50MM value of Eagle Ford Joint Venture drilling carry.
and $50MM value of Eagle Ford Joint Venture drilling carry.
Pro Forma Net Asset Value per Share(1)
Proved Reserves Only
$ 2.69
Proved PLUS Probable Reserves
$ 15.19
Proved PLUS Probable PLUS
Possible
Possible
$ 28.14
7
ND
MT
WY
CO
UT
TX
OK
LA
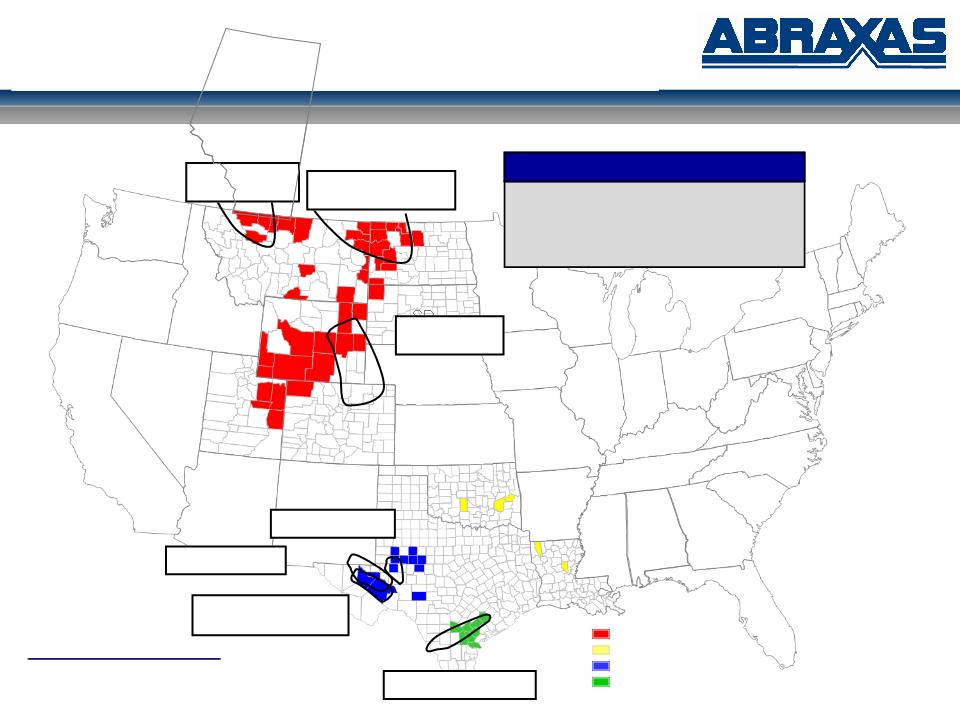
Proved Reserves (MMBoe)(1):
24.9
24.9
- Proved Developed: 56%
- Oil %: 35%
- Operated: 82%
- Operated: 82%
Abraxas Petroleum Corporation
(1) Net proved reserves as of December 31, 2009
Bakken / Three Forks
Play
Barnett / Woodford
Shale Play
Wolfberry Trend
Rocky Mountain
Mid-Continent
Permian Basin
Gulf Coast
Eagle Ford Shale Play
High Quality Assets
Alberta
Niobrara Play
Alberta Basin
Bakken Play
Alberta
Wolfbone Play
8
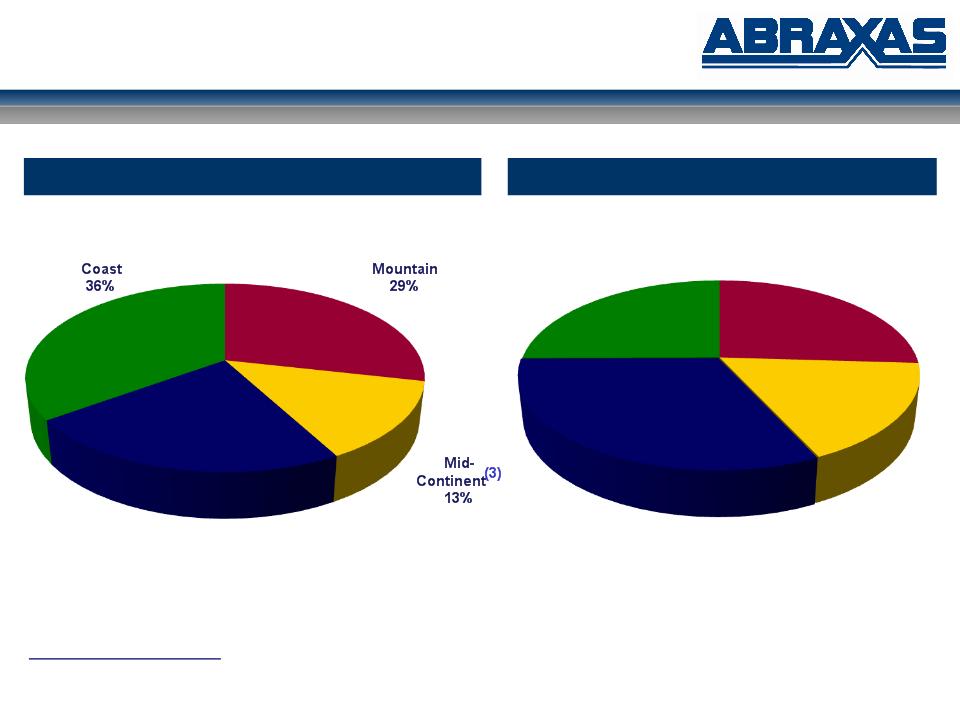
Reserve / Production Summary
Proved Reserves(1) - 24.9 MMBoe
Production(2) - 3,875 Boepd
(1) Net proved reserves as of December 31, 2009
(2) Daily net production for the quarter ended September 30, 2010
(3) 2010 divestitures of non-core assets, primarily in the Mid-Continent region, represented ~2.0 mmboe of proved reserves
Rocky
Permian
Basin
22%
Onshore Gulf
Rocky
Mountain
28%
Mid-
Continent
13%
Permian
Basin
32%
Onshore Gulf
Coast
27%

9
2011 Capital Budget
§ Large inventory of drilling locations in unconventional and conventional oil plays
§ 1H:11 oil weighted drilling program focused on low-risk / high-return Texas conventional
oil projects
oil projects
§ 2H:11 accelerate operated drilling activity in the Bakken and Three Forks plays
§ Approximately 70% of undeveloped acreage is held by production
(1) Unrisked locations based on six wells (three Bakken and three Three Forks) per 1,280 acre units; 160 acre spacing assumptions in both the Eagle Ford and Niobrara Shale
plays
plays
(2) Eagle Ford Shale acreage and locations are gross to the Blue Eagle JV which Abraxas currently owns a 50% equity interest. At full funding Abraxas will own a 25% equity
interest in the JV
interest in the JV
|
Project Area
|
|
Net Acres
|
|
Net Unrisked
Locations(1) |
|
2011 Drilling
Program |
|
2011 Net Capital
($MM) |
|
|
|
|
|
|
|
|
Gross
|
Net
|
|
|
|
Bakken / Three Forks
|
|
20,835
|
|
98
|
|
15.0
|
3.0
|
|
$21.8
|
|
Eagle Ford Shale(2)
|
|
8,333
|
|
52
|
|
4.0
|
4.0
|
|
$0.0
|
|
Niobrara Shale
|
|
18,700
|
|
117
|
|
1.0
|
1.0
|
|
$5.0
|
|
Pekisko Fairway
|
|
9,120
|
|
10
|
|
4.0
|
4.0
|
|
$12.0
|
|
Alberta Bakken
|
|
10,000
|
|
-
|
|
-
|
-
|
|
-
|
|
Texas Oil Plays
|
|
8,700
|
|
65
|
|
14.0
|
14.0
|
|
$10.4
|
|
Other
|
|
n/a
|
|
n/a
|
|
6.0
|
6.0
|
|
$10.8
|
|
Total:
|
|
75,688
|
|
342
|
|
44.0
|
32.0
|
|
$60.0
|
10
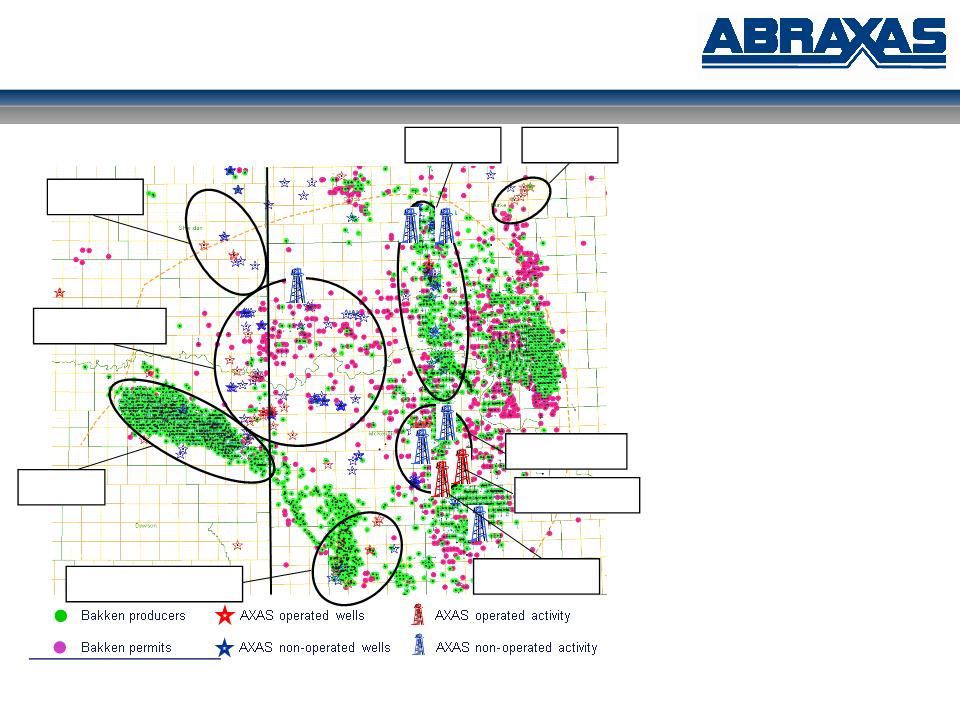
Bakken / Three Forks
Montana North Dakota
Nesson
2,270 net acres
Elm Coulee
440 net acres
Elkhorn Ranch / Lewis & Clark
2,035 net acres
Harding / Rough Rider
7,010 net acres
Carter
3,200 net acres
Sheridan
2,340 net acres
1
North Fork / Nesson
3,540 net acres
§ Gross / Net Acres:
§ 109,658 / 20,835
§ ~100% held by production
§ Drilling Inventory (1,280 acre units):
§ ~514 gross / 98 net
§ 3 Bakken / 3 Three Forks wells per
unit
unit
§ Economics:
§ D&C Cost: $7.5 MM
§ EUR: 500 mboe
§ Recent Activity:
§ 1st operated Three Forks well (Ravin
26-35 1H; 60% w.i.) - 1,705 boe/d
unrestricted rate
26-35 1H; 60% w.i.) - 1,705 boe/d
unrestricted rate
§ 1st operated Middle Bakken well
(Stenehjem 27-34 1H; 79% w.i.) -
completion expected in 1Q:11
(Stenehjem 27-34 1H; 79% w.i.) -
completion expected in 1Q:11
§ 10 gross / 0.35 net non-operated wells
§ 2011 Planned Activity:
§ $22.0 MM budget
§ 5.0 gross / 2.5 net operated wells
§ 10.0 gross / 0.5 net non-operated
wells
wells
Ravin 26-35 1H - TFS
1,705 boe/d
Stenehjem 27-34 1H
Bakken - WOC
11
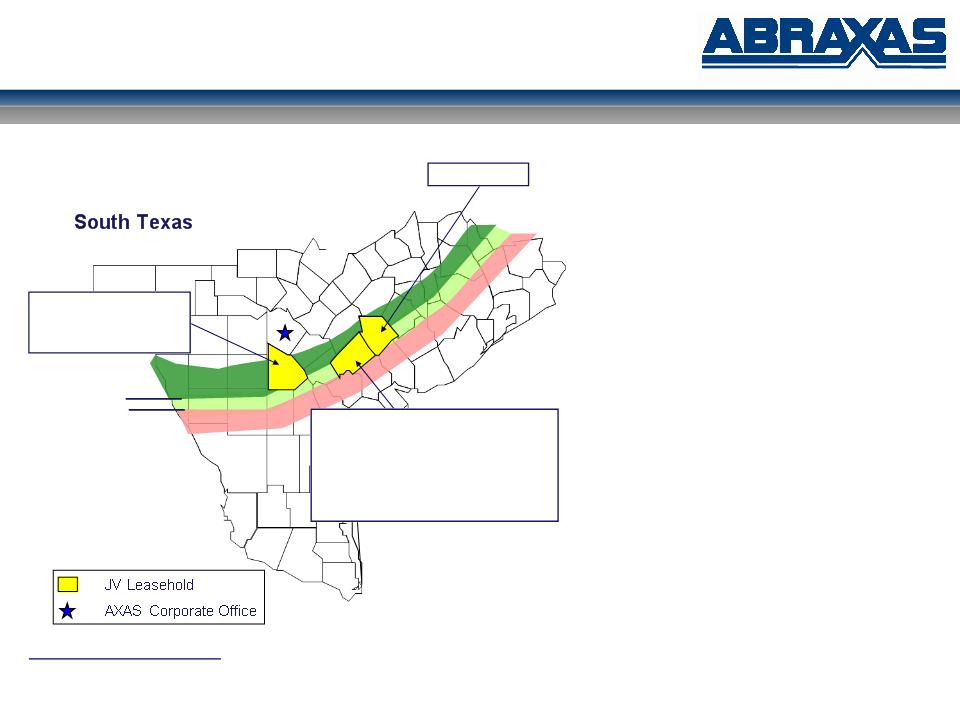
Eagle Ford Shale
§ Acreage(1):
§ 8,333
§ Atascosa, DeWitt, and Lavaca Counties, TX
§ Drilling Inventory(1):
§ 52 net JV locations
§ 160 acre spacing
§ Economics:
§ D&C Cost: $7.0 MM
§ EUR: 500 mboe
§ Blue Eagle Joint Venture:
§ AXAS operator
§ AXAS contributed 8,333 net acres
§ 50% equity interest
§ Rock Oil contributed $25 MM at closing
§ Rock Oil committed additional $50 MM
§ Upon full funding, AXAS equity interest - 25%
§ Recent Activity:
§ 1st well: T Bird 1H - 15 stage frac: flowing back
§ 2nd well: Grass Farms 1H - 2Q:11
§ 2011 Planned Activity(1):
§ $28 MM to drill 4.0 wells
§ Funded 100% by Rock Oil
(1) AXAS held 8,333 net acres prior to entering into the Blue Eagle Joint Venture. At formation of the JV, AXAS held a 50% equity interest in the JV which will decrease to 25% upon
partner fully funding the additional $50MM capital commitment
partner fully funding the additional $50MM capital commitment
Lavaca County
Atascosa County IP Rates:
EOG: Peeler 2H: 605 bo/d
EOG: Peeler 10H: 342 bo/d
EOG: Hundley 2H: 493 bo/d
DeWitt County IP Rates:
Enduring: Keach GU 1: 3,633 boe/d
TLM: Halepeska Gas Unit 1: 2,665 boe/d
PXD: Charles Riedesel GU 1: 2,616 boe/d
HK: Oliver B 1H: 1,968 boe/d
HK: Krause 1H: 1,667 boe/d
HK: Lanik 1H: 1,404 boe/d
AXAS: T-Bird 1H: 15-stage frac: flowing back
oil window
gas window
gas/condensate
window
12
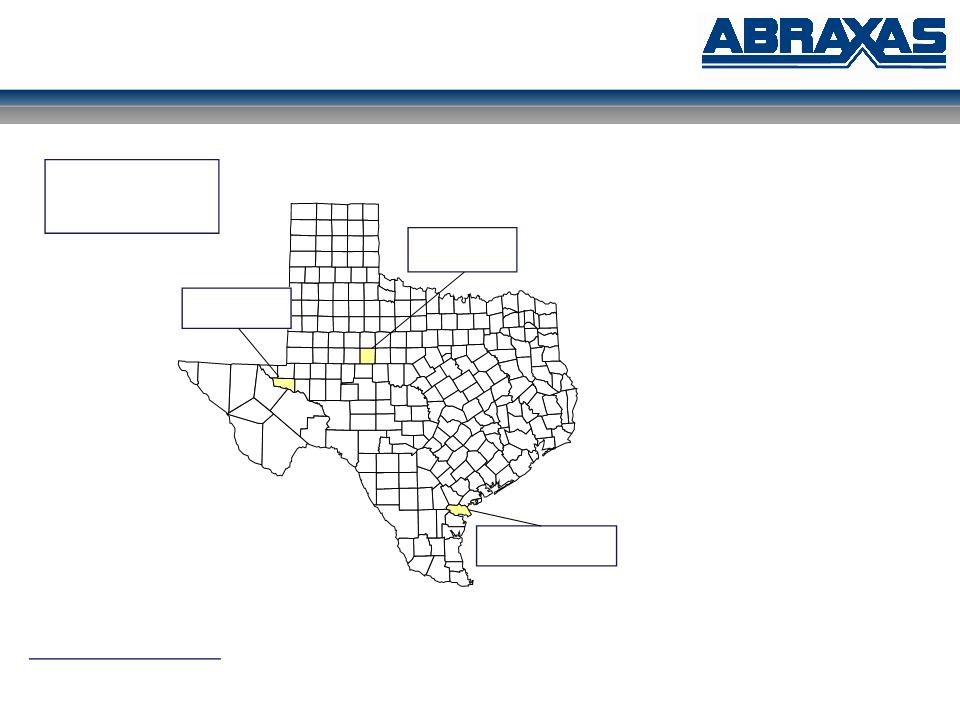
Low Risk Oil Development
West Texas - Spires Ranch
§ Gross / Net Acres: 5,600 (100% w.i.)
§ County / Formation: Nolan / Strawn
§ Locations: 10
§ D&C: $1.6 MM / EUR: 112 mboe
§ 2011 Capex / Activity:
§ $3.2 MM to drill 2.0 wells in 1H:11
West Texas - Shallow Howe
§ Gross / Net Acres: 2,000 (100% w.i.)
§ County / Formation: Ward / Yates
§ Locations: 40
§ D&C: $400K / EUR: 40 mboe
§ 2011 Capex / Activity:
§ $1.6 MM to drill 4.0 wells in 1H:11
South Texas - Portilla
§ Gross / Net Acres: 1,100 (100% w.i.)
§ County / Formation: San Patricio / Frio
7,400 and 8,100 sands
7,400 and 8,100 sands
§ Locations: 15
§ D&C: $700K - $900K / EUR: 47 - 88 mboe
§ 2011 Capex / Activity:
§ $5.6 MM to drill 8.0 infill wells in 1H:11
Portilla;
San Patricio County
Spires Ranch;
Nolan County
Shallow Howe;
Ward County
ROR%:
Spires Ranch: 145%
Shallow Howe: >1,000%
Portilla: 646%
13
Campbell
Converse
Niobrara
Weston
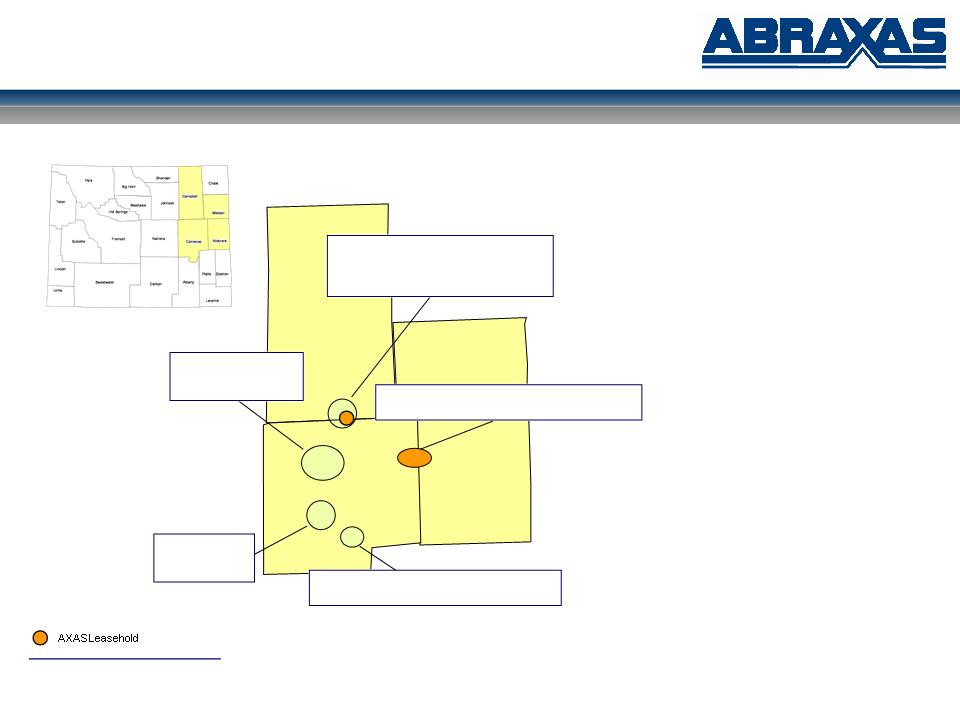
Niobrara Shale
Converse / Niobrara Counties, Wyoming
CHK / EOG:
Niobrara Permit
activity
activity
§ Gross / Net Acres:
§ 20,800 / 18,700
§ Primarily in Converse and
Niobrara Counties
Niobrara Counties
§ ~90% held by production
§ ~3,000 net acres in Campbell
County directly offsetting EOG
producing well
County directly offsetting EOG
producing well
§ Drilling Inventory:
§ 130 gross / 117 net locations
§ 160 acre spacing
§ Economics:
§ D&C Cost: $5.0 MM
§ EUR: 250 mboe
§ Recent Activity:
§ 12 wells drilled to date
(7 horizontal / 5 vertical)
(7 horizontal / 5 vertical)
§ 1 vertical Niobrara
§ 2011 Planned Activity:
§ $5.0 MM to drill 1.0 gross/net well
§ Other:
§ 23 sq. miles proprietary 3D
seismic data
seismic data
§ Full-diameter core data
EOG Crossbow Area:
3-19H: (Cum Oil 34 mbo / Gas 145 mmcf)
2-18H: (Cum Oil 57 mbo / Gas 428 mmcf)
15 Permits
SWN / Samson / Helis:
10 Hrz. Permits;
1 completion
1 completion
CHK:
Sims 15-26H: (Cum Oil 19 mbo / Gas 634 mmcf)
AXAS Activity:
Sage Grouse 3H: (Cum Oil 25 mbo / 50 mbo EUR)
14
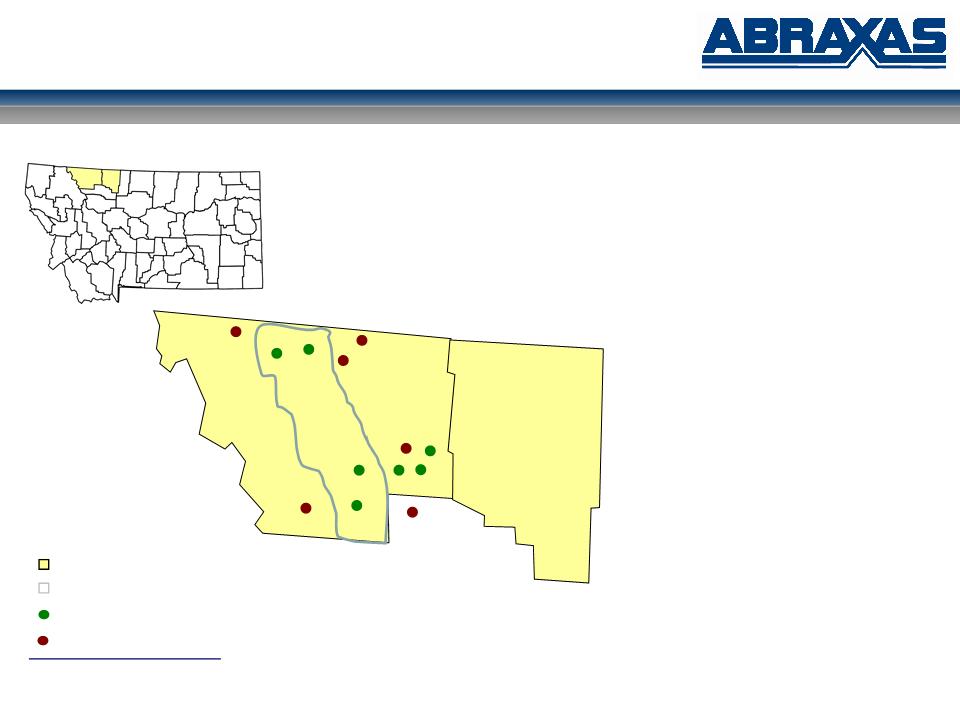
Southern Alberta Basin - Bakken
§ Gross / Net Acres:
§ >10,000 net acres
§ 800 net mineral acres
§ Glacier and Toole Counties, Montana
§ Leases have 5-10 year primary terms
§ 2011 Planned Activity:
§ Continue to add to leasehold position in
geologically specific areas
geologically specific areas
§ Monitor industry drilling activity
AXAS Leasing Area
Blackfoot Nation Territory
Newfield Wells
Rosetta & Others Wells
Toole
Glacier
Glacier / Toole Counties, Montana

15
Business Plan
§ Expanded 2011 CapEx: $60 MM
§ oil development
§ Bakken/TFS - Prudence
§ Eagle Ford - Acceleration with JV
§ Completed divestiture program: ~$33 MM
§ non-core, predominately non-operated
§ pay down debt & accelerate CapEx
§ Target 50/50 oil/gas production mix
§ Target greater than 90% operated
§ NOL preservation
§ Increase investor interest
§ recent equity offering (150+ accounts)
§ Increase analyst coverage
§ 5 new equity analyst

16
Appendix

17
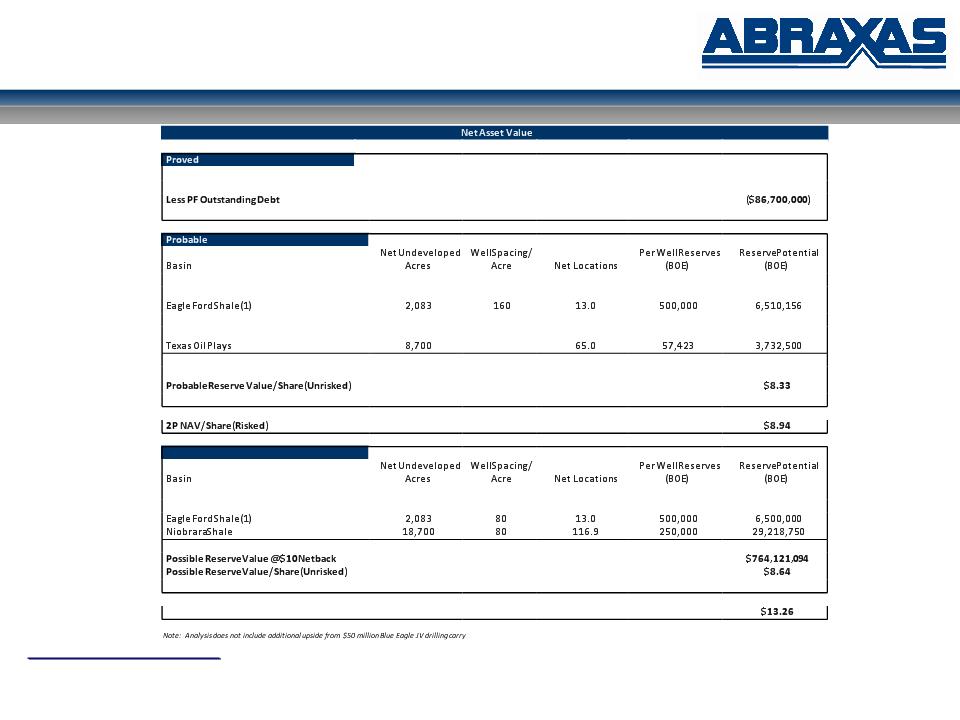
(1) Eagle Ford Shale acreage and locations are net to Abraxas’ 25% equity interest in the Blue Eagle JV at full funding
(2) Possible Bakken/Three Forks locations are based on two additional Bakken and three additional Three Forks wells per 1,280 acre unit
Pro Forma NAV - Undiscounted
2009 PV-10 at Current Pricing
$323,000,000
PF Net Cash
$2,060,000
Proved NAV/Share (Assumes Pro Forma Share Count of 88.4 Million)
$2.69
Bakken / Three Forks
20,835
1280
16.3
500,000
8,138,672
Niobrara Shale
18,700
160
116.9
250,000
29,218,750
Pekisko Fairway
9,120
10.0
150,000
1,500,000
Total Probable Reserve Potential
49,100,078
Probable Reserve Value @$30 Netback
$1,473,002,344
Probable Reserve Value/Share (Risked at 75%)
$12.49
Possible
Bakken / Three Forks(2)
20,835
1280
81.4
500,000
40,693,359
Total Possible Reserve Potential
76,412,109
Possible Reserve Value/Share (Risked at 50%)
$12.96
3P NAV/Share (Risked)
Note: Based on Abraxas estimates
Note: Assumes pro forma share count of 88.4 million
18
(1) Eagle Ford Shale acreage and locations are net to Abraxas’ 25% equity interest in the Blue Eagle JV at full funding
(2) Possible Bakken/Three Forks locations are based on two additional Bakken and three additional Three Forks wells per 1,280 acre unit
Pro Forma NAV - PV Equivalent
2009 PV-10 at Current Pricing
$323,000,000
PF Net Cash
$2,060,000
Proved NAV/Share (Assumes Pro Forma Share Count of 88.4 Million)
$2.69
Bakken / Three Forks
20,835
1280
16.3
500,000
8,138,672
Niobrara Shale
18,700
160
116.9
250,000
29,218,750
Pekisko Fairway
9,120
10.0
150,000
1,500,000
Total Probable Reserve Potential
49,100,078
Probable Reserve Value @$15 Netback
$736,501,172
Probable Reserve Value/Share (Risked at 75%)
$6.25
Possible
Bakken / Three Forks(2)
20,835
1280
81.4
500,000
40,693,359
Total Possible Reserve Potential
76,412,109
Possible Reserve Value/Share (Risked at 50%)
$4.32
3P NAV/Share (Risked)
Note: Based on Abraxas estimates
Note: Assumes pro forma share count of 88.4 million

19
Canada Oil Development - Pekisko
§ Gross / Net Acres:
§ 9,120 (100% w.i.)
§ Drilling Inventory:
§ 10 gross / net locations
§ Economics:
§ D&C Cost: $3.0 MM
§ EUR: 150 mboe
§ Recent Activity:
§ Drilled two horizontal wells to earn
leasehold position
leasehold position
§ 1 shut-in pending recompletion
§ 1 shut-in pending pipeline build out
§ 2011 Planned Activity:
§ $12.0 MM to drill 4.0 gross / net
horizontal wells
horizontal wells
§ Other:
§ Horizontal development of
conventional field
conventional field
§ 5,400’ vertical depth / 4,000’
lateral length
lateral length
Tomahawk
Twining
Pekisko Trend
Alberta, Canada
20
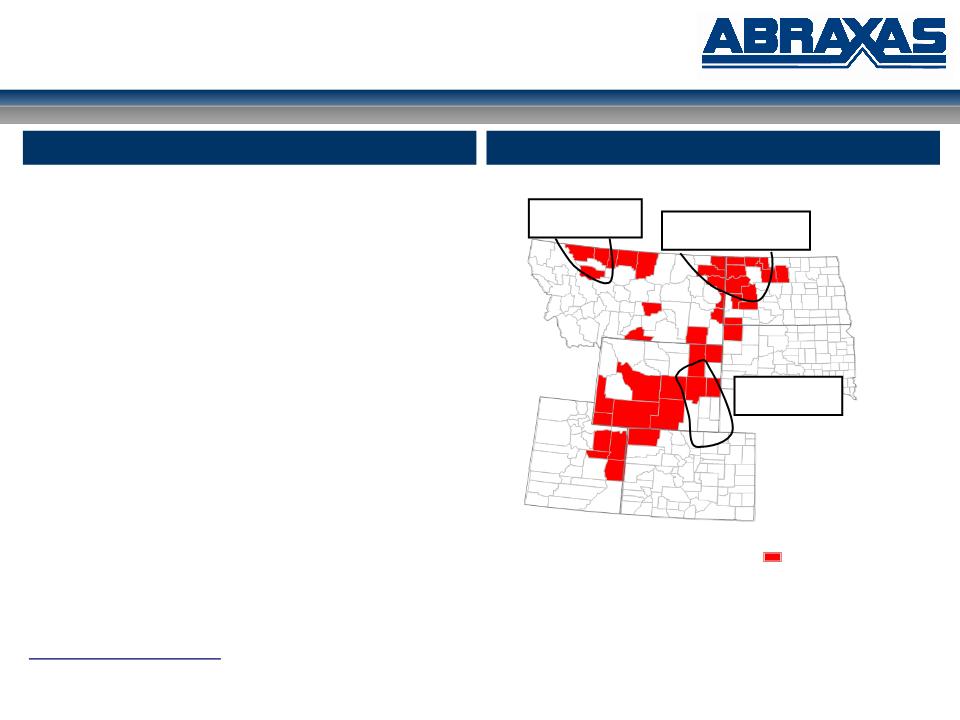
Rocky Mountain
Ø 7.2 MMBoe of proved reserves
Ø 63% proved developed
Ø 82% crude oil
Ø 1,063 Boepd of production
Ø 19.0 R/P ratio
Ø 900 gross (110 net) producing wells
Ø 66 PUD locations
Ø 90,362 net acres
Ø Primary producing basins include:
§ Williston Basin (MT and ND)
§ Powder River & Green River Basins (WY)
§ Uinta Basin (UT)
Ø Bakken / Three Forks - HBP
Rocky Mountain
ND
SD
MT
WY
CO
UT
Area of Operations
Overview
Net proved reserves, well count and acreage as of December 31, 2009
Daily net production for the quarter ended September 30, 2010
Alberta Basin
Bakken Play
Bakken / Three Forks
Play
Niobrara Play
21
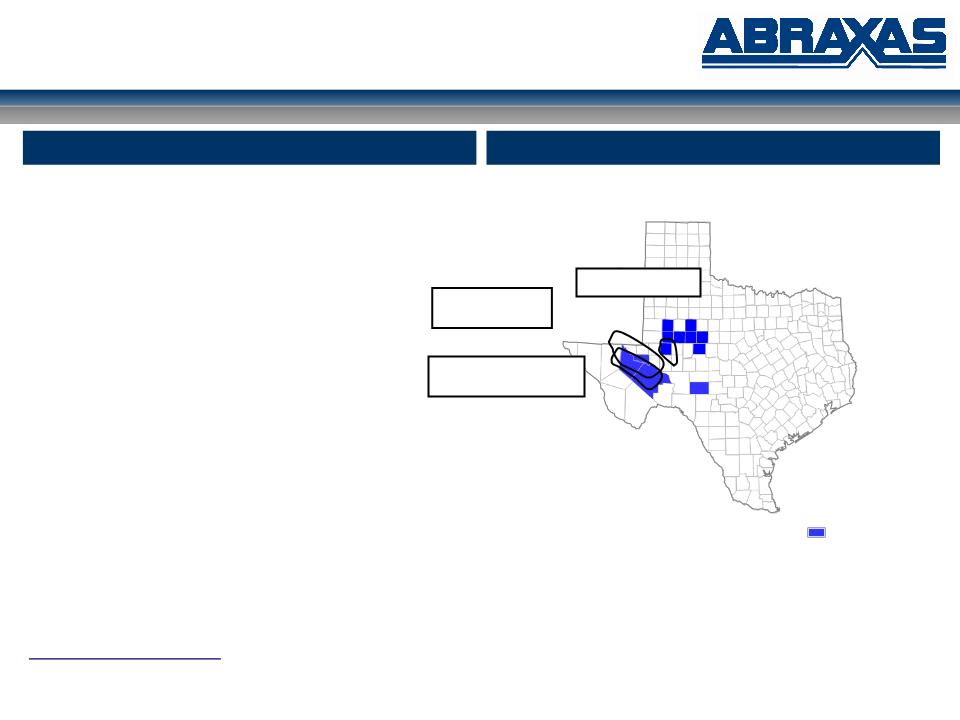
Permian Basin
Permian Basin
Ø 5.6 MMBoe of proved reserves
Ø 66% proved developed
Ø 70% natural gas
Ø 1,254 Boepd of production
Ø 11.9 R/P ratio
Ø 237 gross (158 net) producing wells
Ø 13 PUD locations
Ø 36,064 net acres
Ø Primary producing sub-basins:
§ Delaware Basin
§ Eastern Shelf
TX
Area of Operations
Overview
Barnett / Woodford
Shale Play
Wolfberry Trend
Net proved reserves, well count and acreage as of December 31, 2009
Daily net production for the quarter ended September 30, 2010
Wolfbone Play

22
Gulf Coast
Gulf Coast
Ø 9.0 MMBoe of proved reserves
Ø 38% proved developed
Ø 91% natural gas
Ø 1,044 Boepd of production
Ø 24.5 R/P ratio
Ø 74 gross (48 net) producing wells
Ø 17 PUD locations
Ø 11,414 net acres
Ø Primary producing sub-basin:
§ Onshore Gulf Coast
TX
Area of Operations
Overview
Eagle Ford
Shale Play
Net proved reserves, well count and acreage as of December 31, 2009
Daily net production for the quarter ended September 30, 2010

23
NASDAQ: AXAS