Attached files
| file | filename |
|---|---|
| 8-K - WTNY 4TH QTR 2010 RESULTS 8-K - WHITNEY HOLDING CORP | wtny4thqtr8k.htm |
WHITNEY HOLDING CORPORATION
228 ST. CHARLES AVENUE
NEW ORLEANS, LA 70130
www.whitneybank.com
NEWS RELEASE
|
CONTACT:
|
Thomas L. Callicutt, Jr., CFO
|
FOR IMMEDIATE RELEASE
|
|
|
Trisha Voltz Carlson, Investor Relations
|
January 27, 2011
|
||
|
504/299-5208
|
|||
|
tcarlson@whitneybank.com
|
WHITNEY REPORTS FOURTH QUARTER 2010 FINANCIAL RESULTS
New Orleans, Louisiana. Whitney Holding Corporation (NASDAQ—WTNY) (the “Company”) reported a net loss of $88.5 million for the fourth quarter of 2010, compared to a net loss of $29.0 million in the third quarter of 2010 and net income of $.3 million in the fourth quarter of 2009. Including the $4.1 million dividend paid each quarter to the U.S. Treasury on the preferred stock issued under TARP, the loss per diluted common share was $.96 for the fourth quarter of 2010, $.34 for the third quarter of 2010 and $.04 for the fourth quarter of 2009.
“The results for the fourth quarter were in line with our previously announced problem credit resolution strategy,” said John C. Hope, III, Chairman and CEO. “Operating results outside of credit also were in line with expectations. I continue to believe we are in a position to return to full-year profitability beginning in the first quarter of 2011, excluding any merger-related items. I also expect the Company to contribute meaningfully to the long-term success of the Hancock/Whitney combination.”
On December 21, 2010, Whitney Holding Corporation entered into a definitive agreement with Hancock Holding Company ("Hancock"), headquartered in Gulfport, Mississippi, for the Company to merge into Hancock. The transaction is expected to be completed in the second quarter of 2011, subject to customary closing conditions and shareholder and regulatory approval.
On January 24, 2011 the Company closed a bulk sale of $179 million of nonperforming loans ($163 million, net of reserves, at September 30, 2010). The previously announced bulk sale did not close as expected and a different agreement was signed with a different buyer. Proceeds
-MORE-
2
from the new sale totaled $88 million. While the bulk sale transaction did not close until January 2011, the accounting impact of the sale is reflected in the results for the fourth quarter of 2010.
During the fourth quarter the Company also transferred $124 million of nonperforming loans ($112 million net of reserves at September 30, 2010) to held for sale. These loans were marked to a total estimated fair value of $75 million.
“While some of the components of the bulk sale and reclassification to held for sale changed slightly from our original announcement, the resulting impact on our credit metrics and provision for credit losses was in line with our expectations,” said Hope.
HIGHLIGHTS OF FOURTH QUARTER FINANCIAL RESULTS
Loans and Earning Assets
Total loans at the end of the fourth quarter of 2010 were $7.2 billion, down approximately $500 million, or 6%, from September 30, 2010. The linked-quarter decline includes $163 million (net) in loans transferred to held for sale, $161.5 million in gross charge-offs, $27 million in foreclosures and approximately $17 million in proceeds from problem loan sales. The remaining decrease of $131 million reflects payoffs and paydowns during the quarter, including some larger oil and gas credits in Louisiana and Texas and commercial real estate credits in Texas. While overall demand for credit remained weak during the fourth quarter, the Company did fund several new commercial and industrial relationships, located mainly in the Tampa market.
Average loans for the fourth quarter of 2010 totaled $7.6 billion, down $243 million, or 3%, compared to the third quarter of 2010. Average earning assets of $10.5 billion were up $150 million from the third quarter.
Deposits and Funding
Average deposits in the fourth quarter of 2010 were $9.1 billion, up $194 million, or 2%, from the third quarter of 2010. Total period-end deposits at December 31, 2010 of $9.4 billion were up $537 million, or 6%, compared to September 30, 2010. Approximately $140 million of the increase was related to seasonal public fund deposits, approximately $100 million was related to movement from sweep repurchase agreement products to demand deposits and the remainder was related in part to year-end deposits of certain commercial relationships as well as to organic growth. Compared to year-end 2009, total deposits increased $253 million, or 3%.
Average and period-end noninterest-bearing deposits totaled $3.4 billion and $3.5 billion, respectively, in the fourth quarter of 2010, up 4% and 9%, respectively, compared to the third quarter of 2010. Noninterest-bearing demand deposits comprised 37% of total average deposits and
-MORE-
3
funded approximately 32% of average earning assets for the fourth quarter. The percentage of earning assets funded by all noninterest-bearing sources totaled 36% for the fourth quarter.
Net Interest Income
Net interest income (TE) for the fourth quarter of 2010 was virtually unchanged from the third quarter of 2010. The net interest margin (TE) declined 6 basis points to 3.99%, while average earnings assets were up 1.5% from the third quarter of 2010. This margin compression during the fourth quarter reflected both a shift in the mix of earning assets and a decline in the investment portfolio yield.
Provision for Credit Losses and Credit Quality
Whitney provided $148.5 million for credit losses in the fourth quarter of 2010, compared to $70.0 million in the third quarter of 2010, and $39.5 million in the fourth quarter of 2009. The majority of the fourth quarter’s provision, $112 million, reflects the move of loans to held for sale, as detailed in the accompanying supplemental slides. As the Company noted in the third quarter, this impact to the provision reflects the costs associated with aggressively dealing with problem credits in bulk sale transactions versus individual problem credit resolutions. Approximately $23 million of the provision was related to increases in the qualitative and quantitative loss factors which were impacted in part by the valuation of loans held for sale.
Classified loans decreased $262 million, net, during the fourth quarter, and totaled $860 million at December 31, 2010. The decrease mainly reflects the transfer of loans to held for sale. Management continues to believe that the current portfolio of classified loans has lower loss potential compared to the losses incurred on loans impacted by the significant real estate market issues in Florida.
Nonperforming loans totaled $299 million at December 31, 2010, a net decrease of $129 million from September 30, 2010. Included in the year-end total are $158 million of nonaccrual loans held for sale. Foreclosed assets totaled $88 million at December 31, 2010, down $4 million from September 30, 2010.
Net loan charge-offs in the fourth quarter of 2010 were $155 million, or 8.14% of average loans on an annualized basis, compared to $77 million, or 3.89% of average loans in the third quarter. Approximately $90 million of the gross charge-offs in the fourth quarter were related to the loans included in the bulk sale, $49 million were charge-offs on the additional loans transferred to held for sale and approximately $23 million were charge-offs on the remaining loan portfolio.
-MORE-
4
The allowance for loan losses represented 3.00% of total loans at December 31, 2010, compared to 2.89% at September 30, 2010 and 2.66% at December 31, 2009.
Noninterest Income
Noninterest income for the fourth quarter of 2010 totaled $31.8 million, an increase of $3.2 million, or 11%, from the third quarter of 2010.
Most recurring sources of income increased, reflecting improved market conditions, the benefit of recent marketing campaigns and seasonal transaction activity. Deposit service charge income was up $.4 million, bankcard fees increased $.4 million, trust service fees increased $.3 million and secondary mortgage market income was up $.7 million during the quarter.
Other noninterest income increased $1.4 million during the fourth quarter of 2010, which included a $.6 million distribution from an investment in a local small business investment company and $.3 million in sales of grandfathered assets.
Noninterest Expense
Total noninterest expense of $130.4 million for the fourth quarter of 2010 was up $17.2 million from the third quarter of 2010. The total for the fourth quarter included $4.1 million of merger-related expenses.
Total personnel expense increased $2.9 million from the third quarter of 2010, related mainly to an increase in share-based incentive compensation and severance pay associated with the technology upgrade project. No management cash bonus was accrued during 2010 or 2009.
Loan collection costs, together with foreclosed asset management expenses, provisions for valuation losses on foreclosed assets, and legal fees associated with problem credits, totaled $20.5 million in the fourth quarter of 2010, up $9.2 million from the third quarter of 2010. The legal fees associated with problem credits totaled $3.0 million in the fourth quarter, an increase of $.2 million from the third quarter of 2010. As noted previously, many of these expenses are expected to be reduced as the Company disposes of the loans held for sale.
Legal and professional fees excluding those associated with problem credits remained at an elevated level and totaled $7.0 million for the fourth quarter of 2010. Costs associated with regulatory matters and the technology upgrade project totaled approximately $4 million. For the full-year 2010, these costs totaled approximately $12 million.
Other noninterest expense increased $1.6 million compared to the third quarter of 2010. Training expenses related to the technology upgrade project increased approximately $1.0 million.
-MORE-
5
Capital
The Company’s tangible common equity ratio was 6.90% at December 31, 2010, compared to 8.10% at September 30, 2010. The Company’s leverage ratio at December 31, 2010 was 8.69% compared to 10.09% at September 30, 2010. The declines in the Company’s capital ratios are mainly related to the impact of the reclassification of loans to held for sale during the fourth quarter. Both the Company and Whitney National Bank remain in compliance with all regulatory capital requirements.
This earnings release, including additional financial tables and a slide presentation related to fourth quarter results, is posted in the Investor Relations section of the Company's website at http://investor.whitneybank.com/releases.cfm?ReleasesType=Earnings&Year=2011.
Whitney Holding Corporation, through its banking subsidiary Whitney National Bank, serves the five-state Gulf Coast region stretching from Houston, Texas; across southern Louisiana and the coastal region of Mississippi; to central and south Alabama; the panhandle of Florida; and the Tampa Bay metropolitan area of Florida.
-----
Forward-Looking Statements
This news release contains “forward-looking statements” within the meaning of section 27A of the Securities Act of 1933, as amended, and section 21E of the Securities Exchange Act of 1934, as amended, and we intend such forward-looking statements to be covered by the safe harbor provisions therein and are including this statement for purposes of invoking these safe-harbor provisions. Forward-looking statements provide projections of results of operations or of financial condition or state other forward-looking information, such as expectations about future conditions and descriptions of plans and strategies for the future. The forward-looking statements made in this release include, but may not be limited to, expectations regarding credit quality metrics in the loan portfolio and specific industry and geographic segments within the loan portfolio, future profitability, the timing and strength of the economic recovery, the loss potential for currently classified credits, the overall capital strength of Whitney, its ability to dispose of, and the expense of disposing of, problem assets, the timing or actual results of such disposal on Whitney’s operations and the timing, completion and long-term success of the Hancock Holding Company/Whitney transaction.
Whitney’s ability to accurately project results or predict the effects of future plans or strategies is inherently limited. Although Whitney believes that the expectations reflected in its forward-looking statements are based on reasonable assumptions, actual results and performance could differ materially from those set forth in the forward-looking statements. Factors that could cause Whitney’s or the combined company’s actual results to differ from those expressed in Whitney’s forward-looking statements include, but are not limited to, those risk factors outlined in Whitney’s and Hancock’s public filings with the Securities and Exchange Commission, which are available at the SEC’s internet site (http://www.sec.gov), as well as the following factors, among others: the possibility that the proposed transaction does not close when expected or at all because required regulatory, shareholder or other approvals and other conditions to
-MORE-
6
closing are not received or satisfied on a timely basis or at all; the terms of the proposed transaction may need to be modified to satisfy such approvals or conditions; the anticipated benefits from the proposed transaction such as it being accretive to earnings, expanding our geographic presence and synergies are not realized in the time frame anticipated or at all as a result of changes in general economic and market conditions, interest and exchange rates, monetary policy, laws and regulations (including changes to capital requirements) and their enforcement, and the degree of competition in the geographic and business areas in which the companies operate; the ability to promptly and effectively integrate the businesses of Whitney and Hancock; reputational risks and the reaction of the companies’ customers to the transaction; and diversion of management time on merger-related issues.
You are cautioned not to place undue reliance on these forward-looking statements. Whitney does not intend, and undertakes no obligation, to update or revise any forward-looking statements, whether as a result of differences in actual results, changes in assumptions or changes in other factors affecting such statements, except as required by law.
ADDITIONAL INFORMATION ABOUT THE HANCOCK HOLDING COMPANY/WHITNEY HOLDING CORPORATION TRANSACTION
Hancock Holding Company (“Hancock”) and Whitney Holding Corporation (“Whitney”) have filed a joint proxy statement/prospectus and other relevant documents concerning the merger with the United States Securities and Exchange Commission (the “SEC”). This communication does not constitute an offer to sell or the solicitation of an offer to buy any securities or a solicitation of any vote or approval. WE URGE INVESTORS TO READ THE JOINT PROXY STATEMENT/PROSPECTUS AND ANY OTHER DOCUMENTS TO BE FILED WITH THE SEC IN CONNECTION WITH THE MERGER OR INCORPORATED BY REFERENCE IN THE JOINT PROXY STATEMENT/PROSPECTUS BECAUSE THEY WILL CONTAIN IMPORTANT INFORMATION.
Investors will be able to obtain these documents free of charge at the SEC’s Web site (www.sec.gov). In addition, documents filed with the SEC by Hancock will be available free of charge from Paul D. Guichet, Investor Relations at (228) 563-6559. Documents filed with the SEC by Whitney will be available free of charge from Whitney by contacting Trisha Voltz Carlson, Investor Relations at (504) 299-5208.
The directors, executive officers, and certain other members of management and employees of Whitney are participants in the solicitation of proxies in favor of the merger from the shareholders of Whitney. Information about the directors and executive officers of Whitney is included in the proxy statement for its 2010 annual meeting of shareholders, which was filed with the SEC on April 14, 2010. Additional information regarding the interests of such participants will be included in the joint proxy statement/prospectus and the other relevant documents filed with the SEC when they become available.
The directors, executive officers, and certain other members of management and employees of Hancock are participants in the solicitation of proxies in favor of the merger from the shareholders of Hancock. Information about the directors and executive officers of Hancock is included in the proxy statement for its 2010 annual meeting of shareholders, which was filed with the SEC on February 17, 2010. Additional information regarding the interests of such participants will be included in the joint proxy statement/prospectus and the other relevant documents filed with the SEC when they become available.
(WTNY-E)
-MORE-
| 7 | |||||||||||||||||||||||
|
WHITNEY HOLDING CORPORATION AND SUBSIDIARIES
|
|||||||||||||||||||||||
|
FINANCIAL HIGHLIGHTS
|
|||||||||||||||||||||||
|
Fourth
|
Third
|
Fourth
|
Year Ended
|
||||||||||||||||||||
|
Quarter
|
Quarter
|
Quarter
|
December 31
|
||||||||||||||||||||
|
(dollars in thousands, except per share data)
|
2010 | 2010 | 2009 | 2010 | 2009 | ||||||||||||||||||
|
INCOME DATA
|
|||||||||||||||||||||||
|
Net interest income
|
$ | 104,101 | $ | 104,246 | $ | 111,391 | $ | 420,845 | $ | 443,432 | |||||||||||||
|
Net interest income (tax-equivalent)
|
105,166 | 105,186 | 112,396 | 424,746 | 448,115 | ||||||||||||||||||
|
Provision for credit losses
|
148,500 | 70,000 | 39,500 | 315,000 | 259,000 | ||||||||||||||||||
|
Noninterest income
|
31,847 | 28,651 | 29,026 | 120,506 | 119,950 | ||||||||||||||||||
|
Net securities gains in noninterest income
|
- | - | 139 | - | 334 | ||||||||||||||||||
|
Noninterest expense
|
130,358 | 113,118 | 104,143 | 463,329 | 416,394 | ||||||||||||||||||
|
Net income (loss)
|
(88,489 | ) | (29,004 | ) | 318 | (141,766 | ) | (62,146 | ) | ||||||||||||||
|
Net income (loss) to common shareholders
|
(92,556 | ) | (33,071 | ) | (3,749 | ) | (158,034 | ) | (78,372 | ) | |||||||||||||
|
QUARTER-END BALANCE SHEET DATA
|
|||||||||||||||||||||||
|
Loans
|
$ | 7,234,726 | $ | 7,733,932 | $ | 8,403,443 | $ | 7,234,726 | $ | 8,403,443 | |||||||||||||
|
Investment securities
|
2,609,602 | 2,297,338 | 2,050,440 | 2,609,602 | 2,050,440 | ||||||||||||||||||
|
Earning assets
|
10,488,071 | 10,246,178 | 10,699,847 | 10,488,071 | 10,699,847 | ||||||||||||||||||
|
Total assets
|
11,798,779 | 11,517,194 | 11,892,141 | 11,798,779 | 11,892,141 | ||||||||||||||||||
|
Noninterest-bearing deposits
|
3,523,518 | 3,245,123 | 3,301,354 | 3,523,518 | 3,301,354 | ||||||||||||||||||
|
Total deposits
|
9,403,403 | 8,865,916 | 9,149,894 | 9,403,403 | 9,149,894 | ||||||||||||||||||
|
Shareholders' equity
|
1,524,334 | 1,638,661 | 1,681,064 | 1,524,334 | 1,681,064 | ||||||||||||||||||
|
AVERAGE BALANCE SHEET DATA
|
|||||||||||||||||||||||
|
Loans
|
$ | 7,638,375 | $ | 7,881,160 | $ | 8,434,397 | $ | 7,943,629 | $ | 8,775,662 | |||||||||||||
|
Investment securities
|
2,344,312 | 2,115,549 | 2,025,103 | 2,123,231 | 1,946,241 | ||||||||||||||||||
|
Earning assets
|
10,481,277 | 10,331,541 | 10,635,573 | 10,402,101 | 10,867,461 | ||||||||||||||||||
|
Total assets
|
11,774,859 | 11,563,331 | 11,733,149 | 11,624,685 | 11,955,596 | ||||||||||||||||||
|
Noninterest-bearing deposits
|
3,354,893 | 3,224,881 | 3,222,748 | 3,274,020 | 3,134,811 | ||||||||||||||||||
|
Total deposits
|
9,078,371 | 8,884,439 | 9,017,220 | 8,971,214 | 9,106,002 | ||||||||||||||||||
|
Shareholders' equity
|
1,649,829 | 1,670,244 | 1,629,312 | 1,670,174 | 1,542,293 | ||||||||||||||||||
|
COMMON SHARE DATA
|
|||||||||||||||||||||||
|
Earnings (loss) per share
|
|||||||||||||||||||||||
|
Basic
|
$ | ( .96 | ) | $ | ( .34 | ) | $ | ( .04 | ) | $ | ( 1.64 | ) | $ | ( 1.08 | ) | ||||||||
|
Diluted
|
( .96 | ) | ( .34 | ) | ( .04 | ) | ( 1.64 | ) | ( 1.08 | ) | |||||||||||||
|
Cash dividends per share
|
$ | .01 | $ | .01 | $ | .01 | $ | .04 | $ | .04 | |||||||||||||
|
Book value per share
|
$ | 12.71 | $ | 13.89 | $ | 14.37 | $ | 12.71 | $ | 14.37 | |||||||||||||
|
Tangible book value per share
|
$ | 8.11 | $ | 9.28 | $ | 9.71 | $ | 8.11 | $ | 9.71 | |||||||||||||
|
Trading data
|
|||||||||||||||||||||||
|
High sales price
|
$ | 14.43 | $ | 10.04 | $ | 9.69 | $ | 15.29 | $ | 16.16 | |||||||||||||
|
Low sales price
|
7.84 | 7.04 | 7.78 | 7.04 | 7.78 | ||||||||||||||||||
|
End-of-period closing price
|
14.15 | 8.17 | 9.11 | 14.15 | 9.11 | ||||||||||||||||||
|
Trading volume
|
64,981,238 | 67,483,532 | 79,863,609 | 275,320,068 | 240,128,345 | ||||||||||||||||||
|
RATIOS
|
|||||||||||||||||||||||
|
Return on average assets
|
(2.98 | )% | (1.00 | )% | .01 | % | (1.22 | )% | (.52 | )% | |||||||||||||
|
Return on average common equity
|
(27.13 | ) | (9.55 | ) | (1.11 | ) | (11.50 | ) | (6.28 | ) | |||||||||||||
|
Net interest margin (TE)
|
3.99 | 4.05 | 4.20 | 4.08 | 4.12 | ||||||||||||||||||
|
Average loans to average deposits
|
84.14 | 88.71 | 93.54 | 88.55 | 96.37 | ||||||||||||||||||
|
Efficiency ratio
|
95.14 | 84.52 | 73.71 | 84.98 | 73.34 | ||||||||||||||||||
|
Annualized expenses to average assets
|
4.43 | 3.91 | 3.55 | 3.99 | 3.48 | ||||||||||||||||||
|
Allowance for loan losses to loans
|
3.00 | 2.89 | 2.66 | 3.00 | 2.66 | ||||||||||||||||||
|
Annualized net charge-offs to average loans
|
8.14 | 3.89 | 2.59 | 4.06 | 2.22 | ||||||||||||||||||
|
Nonperforming assets to loans (including nonaccrual
|
|||||||||||||||||||||||
|
loans held for sale) plus foreclosed assets
|
|||||||||||||||||||||||
|
and surplus property
|
5.16 | 6.64 | 5.52 | 5.16 | 5.52 | ||||||||||||||||||
|
Average shareholders' equity to average total assets
|
14.01 | 14.44 | 13.89 | 14.37 | 12.90 | ||||||||||||||||||
|
Tangible common equity to tangible assets
|
6.90 | 8.10 | 8.18 | 6.90 | 8.18 | ||||||||||||||||||
|
Leverage ratio
|
8.69 | 10.09 | 11.05 | 8.69 | 11.05 | ||||||||||||||||||
|
Tax-equivalent (TE) amounts are calculated using a federal income tax rate of 35%.
|
|||||||||||||||||||||||
|
The efficiency ratio is noninterest expense to total net interest (TE) and noninterest income (excluding securities gains and losses).
|
|||||||||||||||||||||||
|
The tangible common equity to tangible assets ratio is total shareholders' equity less preferred stock and intangible assets divided by
|
|||||||||||||||||||||||
|
total assets less intangible assets.
|
|||||||||||||||||||||||
-MORE-
| 8 | |||||||||||||||||||||||
|
WHITNEY HOLDING CORPORATION AND SUBSIDIARIES
|
|||||||||||||||||||||||
| QUARTERLY HIGHLIGHTS | |||||||||||||||||||||||
|
Fourth
|
Third
|
Second
|
First
|
Fourth
|
|||||||||||||||||||
|
Quarter
|
Quarter
|
Quarter
|
Quarter
|
Quarter
|
|||||||||||||||||||
|
(dollars in thousands, except per share data)
|
2010 | 2010 | 2010 | 2010 | 2009 | ||||||||||||||||||
|
INCOME DATA
|
|||||||||||||||||||||||
|
Net interest income
|
$ | 104,101 | $ | 104,246 | $ | 105,869 | $ | 106,629 | $ | 111,391 | |||||||||||||
|
Net interest income (tax-equivalent)
|
105,166 | 105,186 | 106,810 | 107,584 | 112,396 | ||||||||||||||||||
|
Provision for credit losses
|
148,500 | 70,000 | 59,000 | 37,500 | 39,500 | ||||||||||||||||||
|
Noninterest income
|
31,847 | 28,651 | 31,761 | 28,247 | 29,026 | ||||||||||||||||||
|
Net securities gains in noninterest income
|
- | - | - | - | 139 | ||||||||||||||||||
|
Noninterest expense
|
130,358 | 113,118 | 110,147 | 109,706 | 104,143 | ||||||||||||||||||
|
Net income (loss)
|
(88,489 | ) | (29,004 | ) | (17,993 | ) | (6,280 | ) | 318 | ||||||||||||||
|
Net income (loss) to common shareholders
|
(92,556 | ) | (33,071 | ) | (22,060 | ) | (10,347 | ) | (3,749 | ) | |||||||||||||
|
QUARTER-END BALANCE SHEET DATA
|
|||||||||||||||||||||||
|
Loans
|
$ | 7,234,726 | $ | 7,733,932 | $ | 7,979,371 | $ | 8,073,498 | $ | 8,403,443 | |||||||||||||
|
Investment securities
|
2,609,602 | 2,297,338 | 2,076,313 | 2,042,307 | 2,050,440 | ||||||||||||||||||
|
Earning assets
|
10,488,071 | 10,246,178 | 10,214,267 | 10,395,252 | 10,699,847 | ||||||||||||||||||
|
Total assets
|
11,798,779 | 11,517,194 | 11,416,761 | 11,580,806 | 11,892,141 | ||||||||||||||||||
|
Noninterest-bearing deposits
|
3,523,518 | 3,245,123 | 3,229,244 | 3,298,095 | 3,301,354 | ||||||||||||||||||
|
Total deposits
|
9,403,403 | 8,865,916 | 8,819,051 | 8,961,957 | 9,149,894 | ||||||||||||||||||
|
Shareholders' equity
|
1,524,334 | 1,638,661 | 1,674,166 | 1,676,240 | 1,681,064 | ||||||||||||||||||
|
AVERAGE BALANCE SHEET DATA
|
|||||||||||||||||||||||
|
Loans
|
$ | 7,638,375 | $ | 7,881,160 | $ | 8,051,668 | $ | 8,210,283 | $ | 8,434,397 | |||||||||||||
|
Investment securities
|
2,344,312 | 2,115,549 | 2,021,359 | 2,008,095 | 2,025,103 | ||||||||||||||||||
|
Earning assets
|
10,481,277 | 10,331,541 | 10,314,161 | 10,482,211 | 10,635,573 | ||||||||||||||||||
|
Total assets
|
11,774,859 | 11,563,331 | 11,503,150 | 11,656,777 | 11,733,149 | ||||||||||||||||||
|
Noninterest-bearing deposits
|
3,354,893 | 3,224,881 | 3,255,019 | 3,260,794 | 3,222,748 | ||||||||||||||||||
|
Total deposits
|
9,078,371 | 8,884,439 | 8,895,731 | 9,026,703 | 9,017,220 | ||||||||||||||||||
|
Shareholders' equity
|
1,649,829 | 1,670,244 | 1,676,468 | 1,684,537 | 1,629,312 | ||||||||||||||||||
|
COMMON SHARE DATA
|
|||||||||||||||||||||||
|
Earnings (loss) per share
|
|||||||||||||||||||||||
|
Basic
|
$ | ( .96 | ) | $ | ( .34 | ) | $ | ( .23 | ) | $ | ( .11 | ) | $ | ( .04 | ) | ||||||||
|
Diluted
|
( .96 | ) | ( .34 | ) | ( .23 | ) | ( .11 | ) | ( .04 | ) | |||||||||||||
|
Cash dividends per share
|
$ | .01 | $ | .01 | $ | .01 | $ | .01 | $ | .01 | |||||||||||||
|
Book value per share
|
$ | 12.71 | $ | 13.89 | $ | 14.29 | $ | 14.32 | $ | 14.37 | |||||||||||||
|
Tangible book value per share
|
$ | 8.11 | $ | 9.28 | $ | 9.65 | $ | 9.67 | $ | 9.71 | |||||||||||||
|
Trading data
|
|||||||||||||||||||||||
|
High sales price
|
$ | 14.43 | $ | 10.04 | $ | 15.29 | $ | 14.53 | $ | 9.69 | |||||||||||||
|
Low sales price
|
7.84 | 7.04 | 9.25 | 9.05 | 7.78 | ||||||||||||||||||
|
End-of-period closing price
|
14.15 | 8.17 | 9.25 | 13.79 | 9.11 | ||||||||||||||||||
|
Trading volume
|
64,981,238 | 67,483,532 | 75,477,402 | 67,377,896 | 79,863,609 | ||||||||||||||||||
|
RATIOS
|
|||||||||||||||||||||||
|
Return on average assets
|
(2.98 | )% | (1.00 | )% | (.63 | )% | (.22 | )% | .01 | % | |||||||||||||
|
Return on average common shareholders' equity
|
(27.13 | ) | (9.55 | ) | (6.41 | ) | (3.02 | ) | (1.11 | ) | |||||||||||||
|
Net interest margin (TE)
|
3.99 | 4.05 | 4.15 | 4.15 | 4.20 | ||||||||||||||||||
|
Average loans to average deposits
|
84.14 | 88.71 | 90.51 | 90.96 | 93.54 | ||||||||||||||||||
|
Efficiency ratio
|
95.14 | 84.52 | 79.49 | 80.77 | 73.71 | ||||||||||||||||||
|
Annualized expenses to average assets
|
4.43 | 3.91 | 3.83 | 3.76 | 3.55 | ||||||||||||||||||
|
Allowance for loan losses to loans
|
3.00 | 2.89 | 2.88 | 2.77 | 2.66 | ||||||||||||||||||
|
Annualized net charge-offs to average loans
|
8.14 | 3.89 | 2.65 | 1.81 | 2.59 | ||||||||||||||||||
|
Nonperforming assets to loans (including nonaccrual
|
|||||||||||||||||||||||
|
loans held for sale) plus foreclosed assets
|
|||||||||||||||||||||||
|
and surplus property
|
5.16 | 6.64 | 6.73 | 6.12 | 5.52 | ||||||||||||||||||
|
Average shareholders' equity to average total assets
|
14.01 | 14.44 | 14.57 | 14.45 | 13.89 | ||||||||||||||||||
|
Tangible common equity to tangible assets
|
6.90 | 8.10 | 8.49 | 8.38 | 8.18 | ||||||||||||||||||
|
Leverage ratio
|
8.69 | 10.09 | 10.48 | 10.61 | 11.05 | ||||||||||||||||||
|
Tax-equivalent (TE) amounts are calculated using a federal income tax rate of 35%.
|
|||||||||||||||||||||||
|
The efficiency ratio is noninterest expense to total net interest (TE) and noninterest income (excluding securities gains and losses).
|
|||||||||||||||||||||||
|
The tangible common equity to tangible assets ratio is total shareholders' equity less preferred stock and intangible assets divided by
|
|||||||||||||||||||||||
|
total assets less intangible assets.
|
|||||||||||||||||||||||
-MORE-
| 9 | |||||||||||||||||||||||
| WHITNEY HOLDING CORPORATION AND SUBSIDIARIES | |||||||||||||||||||||||
| DAILY AVERAGE CONSOLIDATED BALANCE SHEETS | |||||||||||||||||||||||
|
Fourth
|
Third
|
Fourth
|
Year Ended
|
||||||||||||||||||||
|
Quarter
|
Quarter
|
Quarter
|
December 31
|
||||||||||||||||||||
|
(dollars in thousands)
|
2010 | 2010 | 2009 | 2010 | 2009 | ||||||||||||||||||
|
ASSETS
|
|||||||||||||||||||||||
|
EARNING ASSETS
|
|||||||||||||||||||||||
|
Loans
|
$ | 7,638,375 | $ | 7,881,160 | $ | 8,434,397 | $ | 7,943,629 | $ | 8,775,662 | |||||||||||||
|
Investment securities
|
|||||||||||||||||||||||
|
Securities available for sale
|
2,047,483 | 1,957,481 | 1,846,305 | 1,926,195 | 1,754,831 | ||||||||||||||||||
|
Securities held to maturity
|
296,829 | 158,068 | 178,798 | 197,036 | 191,410 | ||||||||||||||||||
|
Total investment securities
|
2,344,312 | 2,115,549 | 2,025,103 | 2,123,231 | 1,946,241 | ||||||||||||||||||
|
Federal funds sold and short-term investments
|
447,555 | 296,485 | 147,575 | 300,599 | 108,234 | ||||||||||||||||||
|
Loans held for sale
|
51,035 | 38,347 | 28,498 | 34,642 | 37,324 | ||||||||||||||||||
|
Total earning assets
|
10,481,277 | 10,331,541 | 10,635,573 | 10,402,101 | 10,867,461 | ||||||||||||||||||
|
NONEARNING ASSETS
|
|||||||||||||||||||||||
|
Goodwill and other intangible assets
|
445,095 | 446,308 | 450,567 | 446,989 | 453,770 | ||||||||||||||||||
|
Accrued interest receivable
|
32,798 | 32,764 | 37,871 | 34,097 | 38,682 | ||||||||||||||||||
|
Other assets
|
1,044,410 | 983,823 | 843,680 | 974,221 | 811,693 | ||||||||||||||||||
|
Allowance for loan losses
|
(228,721 | ) | (231,105 | ) | (234,542 | ) | (232,723 | ) | (216,010 | ) | |||||||||||||
|
Total assets
|
$ | 11,774,859 | $ | 11,563,331 | $ | 11,733,149 | $ | 11,624,685 | $ | 11,955,596 | |||||||||||||
|
LIABILITIES
|
|||||||||||||||||||||||
|
INTEREST-BEARING LIABILITIES
|
|||||||||||||||||||||||
|
Interest-bearing deposits
|
|||||||||||||||||||||||
|
NOW account deposits
|
$ | 1,163,000 | $ | 1,128,756 | $ | 1,157,068 | $ | 1,171,517 | $ | 1,163,820 | |||||||||||||
|
Money market investment deposits
|
1,834,234 | 1,811,326 | 1,822,403 | 1,801,689 | 1,659,663 | ||||||||||||||||||
|
Savings deposits
|
887,331 | 865,229 | 843,277 | 867,697 | 883,803 | ||||||||||||||||||
|
Other time deposits
|
703,277 | 716,245 | 821,667 | 732,103 | 844,236 | ||||||||||||||||||
|
Time deposits $100,000 and over
|
1,135,636 | 1,138,002 | 1,150,057 | 1,124,188 | 1,419,669 | ||||||||||||||||||
|
Total interest-bearing deposits
|
5,723,478 | 5,659,558 | 5,794,472 | 5,697,194 | 5,971,191 | ||||||||||||||||||
|
Short-term borrowings
|
732,669 | 707,892 | 760,881 | 677,906 | 991,958 | ||||||||||||||||||
|
Long-term debt
|
218,499 | 199,731 | 199,687 | 204,462 | 195,571 | ||||||||||||||||||
|
Total interest-bearing liabilities
|
6,674,646 | 6,567,181 | 6,755,040 | 6,579,562 | 7,158,720 | ||||||||||||||||||
|
NONINTEREST-BEARING LIABILITIES
|
|||||||||||||||||||||||
|
Noninterest-bearing deposits
|
3,354,893 | 3,224,881 | 3,222,748 | 3,274,020 | 3,134,811 | ||||||||||||||||||
|
Accrued interest payable
|
8,835 | 11,543 | 11,402 | 10,453 | 16,653 | ||||||||||||||||||
|
Other liabilities
|
86,656 | 89,482 | 114,647 | 90,476 | 103,119 | ||||||||||||||||||
|
Total liabilities
|
10,125,030 | 9,893,087 | 10,103,837 | 9,954,511 | 10,413,303 | ||||||||||||||||||
|
SHAREHOLDERS' EQUITY
|
|||||||||||||||||||||||
|
Preferred
|
296,088 | 295,770 | 294,819 | 295,616 | 294,347 | ||||||||||||||||||
|
Common
|
1,353,741 | 1,374,474 | 1,334,493 | 1,374,558 | 1,247,946 | ||||||||||||||||||
|
Total shareholders' equity
|
1,649,829 | 1,670,244 | 1,629,312 | 1,670,174 | 1,542,293 | ||||||||||||||||||
|
Total liabilities and shareholders' equity
|
$ | 11,774,859 | $ | 11,563,331 | $ | 11,733,149 | $ | 11,624,685 | $ | 11,955,596 | |||||||||||||
|
EARNING ASSETS LESS
|
|||||||||||||||||||||||
|
INTEREST-BEARING LIABILITIES
|
$ | 3,806,631 | $ | 3,764,360 | $ | 3,880,533 | $ | 3,822,539 | $ | 3,708,741 | |||||||||||||
-MORE-
| 10 | |||||||||||||||||||||||
|
WHITNEY HOLDING CORPORATION AND SUBSIDIARIES
|
|||||||||||||||||||||||
|
CONSOLIDATED BALANCE SHEETS
|
|||||||||||||||||||||||
|
December 31
|
September 30
|
June 30
|
March 31
|
December 31
|
|||||||||||||||||||
|
(dollars in thousands)
|
2010 | 2010 | 2010 | 2010 | 2009 | ||||||||||||||||||
|
ASSETS
|
|||||||||||||||||||||||
|
Cash and due from financial institutions
|
$ | 210,368 | $ | 244,331 | $ | 200,075 | $ | 198,912 | $ | 216,347 | |||||||||||||
|
Federal funds sold and short-term investments
|
445,392 | 165,746 | 130,113 | 256,505 | 212,219 | ||||||||||||||||||
|
Loans held for sale
|
198,351 | 49,162 | 28,470 | 22,942 | 33,745 | ||||||||||||||||||
|
Investment securities
|
|||||||||||||||||||||||
|
Securities available for sale
|
1,968,245 | 2,140,882 | 1,915,587 | 1,877,653 | 1,875,495 | ||||||||||||||||||
|
Securities held to maturity
|
641,357 | 156,456 | 160,726 | 164,654 | 174,945 | ||||||||||||||||||
|
Total investment securities
|
2,609,602 | 2,297,338 | 2,076,313 | 2,042,307 | 2,050,440 | ||||||||||||||||||
|
Loans
|
7,234,726 | 7,733,932 | 7,979,371 | 8,073,498 | 8,403,443 | ||||||||||||||||||
|
Allowance for loan losses
|
(216,843 | ) | (223,254 | ) | (229,884 | ) | (223,890 | ) | (223,671 | ) | |||||||||||||
|
Net loans
|
7,017,883 | 7,510,678 | 7,749,487 | 7,849,608 | 8,179,772 | ||||||||||||||||||
|
Bank premises and equipment
|
232,475 | 228,696 | 227,620 | 226,105 | 223,142 | ||||||||||||||||||
|
Goodwill
|
435,678 | 435,678 | 435,678 | 435,678 | 435,678 | ||||||||||||||||||
|
Other intangible assets
|
8,922 | 10,009 | 11,284 | 12,621 | 14,116 | ||||||||||||||||||
|
Accrued interest receivable
|
29,078 | 30,161 | 29,783 | 33,277 | 32,841 | ||||||||||||||||||
|
Other assets
|
611,030 | 545,395 | 527,938 | 502,851 | 493,841 | ||||||||||||||||||
|
Total assets
|
$ | 11,798,779 | $ | 11,517,194 | $ | 11,416,761 | $ | 11,580,806 | $ | 11,892,141 | |||||||||||||
|
LIABILITIES
|
|||||||||||||||||||||||
|
Noninterest-bearing demand deposits
|
$ | 3,523,518 | $ | 3,245,123 | $ | 3,229,244 | $ | 3,298,095 | $ | 3,301,354 | |||||||||||||
|
Interest-bearing deposits
|
5,879,885 | 5,620,793 | 5,589,807 | 5,663,862 | 5,848,540 | ||||||||||||||||||
|
Total deposits
|
9,403,403 | 8,865,916 | 8,819,051 | 8,961,957 | 9,149,894 | ||||||||||||||||||
|
Short-term borrowings
|
543,492 | 681,152 | 599,106 | 610,344 | 734,606 | ||||||||||||||||||
|
Long-term debt
|
219,571 | 199,755 | 199,764 | 199,722 | 199,707 | ||||||||||||||||||
|
Accrued interest payable
|
9,722 | 11,600 | 9,794 | 12,598 | 11,908 | ||||||||||||||||||
|
Other liabilities
|
98,257 | 120,110 | 114,880 | 119,945 | 114,962 | ||||||||||||||||||
|
Total liabilities
|
10,274,445 | 9,878,533 | 9,742,595 | 9,904,566 | 10,211,077 | ||||||||||||||||||
|
SHAREHOLDERS' EQUITY
|
|||||||||||||||||||||||
|
Preferred stock
|
296,242 | 295,925 | 295,608 | 295,291 | 294,974 | ||||||||||||||||||
|
Common stock
|
2,800 | 2,800 | 2,800 | 2,800 | 2,800 | ||||||||||||||||||
|
Capital surplus
|
620,547 | 618,475 | 620,111 | 618,392 | 617,038 | ||||||||||||||||||
|
Retained earnings
|
628,546 | 722,081 | 756,127 | 779,158 | 790,481 | ||||||||||||||||||
|
Accumulated other comprehensive income (loss)
|
(11,104 | ) | 12,077 | 12,217 | (6,704 | ) | (11,532 | ) | |||||||||||||||
|
Treasury stock at cost
|
(12,697 | ) | (12,697 | ) | (12,697 | ) | (12,697 | ) | (12,697 | ) | |||||||||||||
|
Total shareholders' equity
|
1,524,334 | 1,638,661 | 1,674,166 | 1,676,240 | 1,681,064 | ||||||||||||||||||
|
Total liabilities and shareholders' equity
|
$ | 11,798,779 | $ | 11,517,194 | $ | 11,416,761 | $ | 11,580,806 | $ | 11,892,141 | |||||||||||||
-MORE-
| 11 | ||||||||||||||||||||||
|
WHITNEY HOLDING CORPORATION AND SUBSIDIARIES
|
||||||||||||||||||||||
|
CONSOLIDATED STATEMENTS OF INCOME
|
||||||||||||||||||||||
|
Fourth
|
Third
|
Fourth
|
Year Ended
|
|||||||||||||||||||
|
Quarter
|
Quarter
|
Quarter
|
December 31
|
|||||||||||||||||||
|
(dollars in thousands, except per share data)
|
2010 | 2010 | 2009 | 2010 | 2009 | |||||||||||||||||
|
INTEREST INCOME
|
||||||||||||||||||||||
|
Interest and fees on loans
|
$ | 95,379 | $ | 96,836 | $ | 105,695 | $ | 391,123 | $ | 435,613 | ||||||||||||
|
Interest and dividends on investments
|
20,473 | 20,002 | 20,919 | 81,053 | 83,075 | |||||||||||||||||
|
Interest on federal funds sold and
|
||||||||||||||||||||||
|
short-term investments
|
302 | 195 | 125 | 833 | 610 | |||||||||||||||||
|
Total interest income
|
116,154 | 117,033 | 126,739 | 473,009 | 519,298 | |||||||||||||||||
|
INTEREST EXPENSE
|
||||||||||||||||||||||
|
Interest on deposits
|
9,071 | 9,998 | 12,561 | 40,887 | 63,345 | |||||||||||||||||
|
Interest on short-term borrowings
|
273 | 294 | 296 | 1,098 | 2,531 | |||||||||||||||||
|
Interest on long-term debt
|
2,709 | 2,495 | 2,491 | 10,179 | 9,990 | |||||||||||||||||
|
Total interest expense
|
12,053 | 12,787 | 15,348 | 52,164 | 75,866 | |||||||||||||||||
|
NET INTEREST INCOME
|
104,101 | 104,246 | 111,391 | 420,845 | 443,432 | |||||||||||||||||
|
PROVISION FOR CREDIT LOSSES
|
148,500 | 70,000 | 39,500 | 315,000 | 259,000 | |||||||||||||||||
|
NET INTEREST INCOME AFTER PROVISION
|
||||||||||||||||||||||
|
FOR CREDIT LOSSES
|
(44,399 | ) | 34,246 | 71,891 | 105,845 | 184,432 | ||||||||||||||||
|
NONINTEREST INCOME
|
||||||||||||||||||||||
|
Service charges on deposit accounts
|
8,568 | 8,208 | 9,077 | 33,920 | 37,699 | |||||||||||||||||
|
Bank card fees
|
6,738 | 6,305 | 5,621 | 24,934 | 19,886 | |||||||||||||||||
|
Trust service fees
|
3,080 | 2,804 | 2,966 | 11,868 | 11,984 | |||||||||||||||||
|
Secondary mortgage market operations
|
3,317 | 2,600 | 2,237 | 9,849 | 9,406 | |||||||||||||||||
|
Other noninterest income
|
10,144 | 8,734 | 8,986 | 39,935 | 40,641 | |||||||||||||||||
|
Securities transactions
|
- | - | 139 | - | 334 | |||||||||||||||||
|
Total noninterest income
|
31,847 | 28,651 | 29,026 | 120,506 | 119,950 | |||||||||||||||||
|
NONINTEREST EXPENSE
|
||||||||||||||||||||||
|
Employee compensation
|
43,171 | 40,277 | 38,300 | 163,211 | 158,116 | |||||||||||||||||
|
Employee benefits
|
9,325 | 9,344 | 11,177 | 38,724 | 43,223 | |||||||||||||||||
|
Total personnel
|
52,496 | 49,621 | 49,477 | 201,935 | 201,339 | |||||||||||||||||
|
Net occupancy
|
9,685 | 9,922 | 9,391 | 39,258 | 38,810 | |||||||||||||||||
|
Equipment and data processing
|
8,064 | 7,448 | 6,318 | 29,029 | 25,770 | |||||||||||||||||
|
Legal and other professional services
|
9,986 | 9,643 | 5,621 | 34,190 | 19,556 | |||||||||||||||||
|
Deposit insurance and regulatory fees
|
5,523 | 5,385 | 5,515 | 23,412 | 24,260 | |||||||||||||||||
|
Telecommunication and postage
|
2,304 | 3,024 | 2,993 | 11,435 | 12,288 | |||||||||||||||||
|
Corporate value and franchise taxes
|
1,439 | 1,720 | 1,817 | 6,445 | 8,684 | |||||||||||||||||
|
Amortization of intangibles
|
1,087 | 1,275 | 1,734 | 5,194 | 8,767 | |||||||||||||||||
|
Provision for valuation losses on foreclosed assets
|
14,189 | 4,372 | 3,768 | 25,128 | 11,660 | |||||||||||||||||
|
Nonlegal loan collection and other foreclosed asset costs
|
3,342 | 4,150 | 2,446 | 13,225 | 8,418 | |||||||||||||||||
|
Merger-related expense
|
4,086 | - | - | 4,086 | - | |||||||||||||||||
|
Other noninterest expense
|
18,157 | 16,558 | 15,063 | 69,992 | 56,842 | |||||||||||||||||
|
Total noninterest expense
|
130,358 | 113,118 | 104,143 | 463,329 | 416,394 | |||||||||||||||||
|
Income (loss) before income taxes
|
(142,910 | ) | (50,221 | ) | (3,226 | ) | (236,978 | ) | (112,012 | ) | ||||||||||||
|
Income tax expense
|
(54,421 | ) | (21,217 | ) | (3,544 | ) | (95,212 | ) | (49,866 | ) | ||||||||||||
|
Net income (loss)
|
$ | (88,489 | ) | $ | (29,004 | ) | $ | 318 | $ | (141,766 | ) | $ | (62,146 | ) | ||||||||
|
Preferred stock dividends
|
4,067 | 4,067 | 4,067 | 16,268 | 16,226 | |||||||||||||||||
|
Net income (loss) to common shareholders
|
$ | (92,556 | ) | $ | (33,071 | ) | $ | (3,749 | ) | $ | (158,034 | ) | $ | (78,372 | ) | |||||||
|
EARNINGS (LOSS) PER COMMON SHARE
|
||||||||||||||||||||||
|
Basic
|
$ | (.96 | ) | $ | (.34 | ) | $ | (.04 | ) | $ | (1.64 | ) | $ | (1.08 | ) | |||||||
|
Diluted
|
(.96 | ) | (.34 | ) | (.04 | ) | (1.64 | ) | (1.08 | ) | ||||||||||||
|
WEIGHTED-AVERAGE COMMON
|
||||||||||||||||||||||
|
SHARES OUTSTANDING
|
||||||||||||||||||||||
|
Basic
|
96,724,267 | 96,707,562 | 88,402,754 | 96,626,872 | 72,824,964 | |||||||||||||||||
|
Diluted
|
96,724,267 | 96,707,562 | 88,402,754 | 96,626,872 | 72,824,964 | |||||||||||||||||
|
CASH DIVIDENDS PER COMMON SHARE
|
$ | .01 | $ | .01 | $ | .01 | $ | .04 | $ | .04 | ||||||||||||
-MORE-
| 12 | ||||||||||||||||||||||
|
WHITNEY HOLDING CORPORATION AND SUBSIDIARIES
|
||||||||||||||||||||||
|
SUMMARY OF INTEREST RATES (TAX-EQUIVALENT)*
|
||||||||||||||||||||||
|
Fourth
|
Third
|
Fourth
|
Year Ended
|
|||||||||||||||||||
|
Quarter
|
Quarter
|
Quarter
|
December 31
|
|||||||||||||||||||
| 2010 | 2010 | 2009 | 2010 | 2009 | ||||||||||||||||||
|
EARNING ASSETS
|
||||||||||||||||||||||
|
Loans**
|
4.94 | % | 4.86 | % | 4.96 | % | 4.91 | % | 4.95 | % | ||||||||||||
|
Investment securities
|
3.64 | 3.94 | 4.32 | 3.98 | 4.48 | |||||||||||||||||
|
Federal funds sold and short-term investments
|
.27 | .26 | .34 | .28 | .56 | |||||||||||||||||
|
Total interest-earning assets
|
4.45 | % | 4.54 | % | 4.77 | % | 4.58 | % | 4.82 | % | ||||||||||||
|
INTEREST-BEARING LIABILITIES
|
||||||||||||||||||||||
|
Interest-bearing deposits
|
||||||||||||||||||||||
|
NOW account deposits
|
.27 | % | .30 | % | .36 | % | .32 | % | .37 | % | ||||||||||||
|
Money market investment deposits
|
.59 | .69 | .82 | .71 | .94 | |||||||||||||||||
|
Savings deposits
|
.12 | .15 | .15 | .14 | .16 | |||||||||||||||||
|
Other time deposits
|
1.18 | 1.26 | 1.48 | 1.29 | 1.98 | |||||||||||||||||
|
Time deposits $100,000 and over
|
1.11 | 1.18 | 1.51 | 1.22 | 1.79 | |||||||||||||||||
|
Total interest-bearing deposits
|
.63 | % | .70 | % | .86 | % | .72 | % | 1.06 | % | ||||||||||||
|
Short-term borrowings
|
.15 | .16 | .15 | .16 | .26 | |||||||||||||||||
|
Long-term debt
|
4.96 | 5.00 | 4.99 | 4.98 | 5.11 | |||||||||||||||||
|
Total interest-bearing liabilities
|
.72 | % | .77 | % | .90 | % | .79 | % | 1.06 | % | ||||||||||||
|
NET INTEREST SPREAD (tax-equivalent)
|
||||||||||||||||||||||
|
Yield on earning assets less cost of interest-
|
||||||||||||||||||||||
|
bearing liabilities
|
3.73 | % | 3.77 | % | 3.87 | % | 3.79 | % | 3.76 | % | ||||||||||||
|
NET INTEREST MARGIN (tax-equivalent)
|
||||||||||||||||||||||
|
Net interest income (tax equivalent) as a
|
||||||||||||||||||||||
|
percentage of average earning assets
|
3.99 | % | 4.05 | % | 4.20 | % | 4.08 | % | 4.12 | % | ||||||||||||
|
COST OF FUNDS
|
||||||||||||||||||||||
|
Interest expense as a percentage of average interest-
|
||||||||||||||||||||||
|
bearing liabilities plus interest-free funds
|
.46 | % | .49 | % | .57 | % | .50 | % | .70 | % | ||||||||||||
|
* Based on a 35% tax rate.
|
||||||||||||||||||||||
|
** Net of unearned income, before deducting the allowance for loan losses and including loans
|
||||||||||||||||||||||
|
held for sale and loans accounted for on a nonaccrual basis.
|
||||||||||||||||||||||
-MORE-
| 13 | ||||||||||||||||||||||
|
WHITNEY HOLDING CORPORATION AND SUBSIDIARIES
|
||||||||||||||||||||||
|
LOAN QUALITY
|
||||||||||||||||||||||
|
Fourth
|
Third
|
Fourth
|
Year Ended
|
|||||||||||||||||||
|
Quarter
|
Quarter
|
Quarter
|
December 31
|
|||||||||||||||||||
|
(dollars in thousands)
|
2010 | 2010 | 2009 | 2010 | 2009 | |||||||||||||||||
|
ALLOWANCE FOR LOAN LOSSES
|
||||||||||||||||||||||
|
Allowance at beginning of period
|
$ | 223,254 | $ | 229,884 | $ | 238,600 | $ | 223,671 | $ | 161,109 | ||||||||||||
|
Provision for credit losses
|
149,000 | 70,000 | 39,600 | 315,600 | 257,600 | |||||||||||||||||
|
Loans charged off
|
(161,466 | ) | (80,062 | ) | (57,699 | ) | (339,463 | ) | (203,602 | ) | ||||||||||||
|
Recoveries on loans previously charged off
|
6,055 | 3,432 | 3,170 | 17,035 | 8,564 | |||||||||||||||||
|
Net loans charged off
|
(155,411 | ) | (76,630 | ) | (54,529 | ) | (322,428 | ) | (195,038 | ) | ||||||||||||
|
Allowance at end of period
|
$ | 216,843 | $ | 223,254 | $ | 223,671 | $ | 216,843 | $ | 223,671 | ||||||||||||
|
Allowance for loan losses to loans
|
3.00 | % | 2.89 | % | 2.66 | % | 3.00 | % | 2.66 | % | ||||||||||||
|
Annualized net charge-offs to average loans
|
8.14 | 3.89 | 2.59 | 4.06 | 2.22 | |||||||||||||||||
|
Annualized gross charge-offs to average loans
|
8.46 | 4.06 | 2.74 | 4.27 | 2.32 | |||||||||||||||||
|
Recoveries to gross charge-offs
|
3.75 | 4.29 | 5.49 | 5.02 | 4.21 | |||||||||||||||||
|
RESERVE FOR LOSSES ON
|
||||||||||||||||||||||
|
UNFUNDED CREDIT COMMITMENTS
|
||||||||||||||||||||||
|
Reserve at beginning of period
|
$ | 2,100 | $ | 2,100 | $ | 2,300 | $ | 2,200 | $ | 800 | ||||||||||||
|
Provision for credit losses
|
(500 | ) | - | (100 | ) | (600 | ) | 1,400 | ||||||||||||||
|
Reserve at end of period
|
$ | 1,600 | $ | 2,100 | $ | 2,200 | $ | 1,600 | $ | 2,200 | ||||||||||||
|
December 31
|
September 30
|
June 30
|
March 31
|
December 31
|
||||||||||||||||||
|
(dollars in thousands)
|
2010 | 2010 | 2010 | 2010 | 2009 | |||||||||||||||||
|
NONPERFORMING ASSETS
|
||||||||||||||||||||||
|
Nonaccrual loans:
|
||||||||||||||||||||||
|
Held for investment
|
$ | 140,519 | $ | 428,012 | $ | 451,405 | $ | 436,680 | $ | 414,075 | ||||||||||||
|
Held for sale
|
158,044 | - | - | - | - | |||||||||||||||||
|
Restructured loans accruing
|
- | - | - | - | - | |||||||||||||||||
|
Total nonperforming loans
|
298,563 | 428,012 | 451,405 | 436,680 | 414,075 | |||||||||||||||||
|
Foreclosed assets and surplus property
|
87,696 | 91,770 | 91,506 | 60,879 | 52,630 | |||||||||||||||||
|
Total nonperforming assets
|
$ | 386,259 | $ | 519,782 | $ | 542,911 | $ | 497,559 | $ | 466,705 | ||||||||||||
|
Loans 90 days past due still accruing
|
$ | 14,283 | $ | 28,518 | $ | 10,539 | $ | 17,591 | $ | 23,386 | ||||||||||||
|
Nonperforming assets to loans (including
|
||||||||||||||||||||||
|
nonaccrual loans held for sale) plus foreclosed
|
||||||||||||||||||||||
|
assets and surplus property
|
5.16 | % | 6.64 | % | 6.73 | % | 6.12 | % | 5.52 | % | ||||||||||||
|
Nonaccrual loans held for investment to loans
|
||||||||||||||||||||||
|
(excluding nonaccrual loans held for sale)
|
1.94 | 5.53 | 5.66 | 5.41 | 4.93 | |||||||||||||||||
|
Allowance for loan losses to nonperforming loans
|
||||||||||||||||||||||
|
(excluding nonaccrual loans held for sale)
|
154.32 | 52.16 | 50.93 | 51.27 | 54.02 | |||||||||||||||||
|
Loans 90 days past due still accruing to loans
|
.20 | .37 | .13 | .22 | .28 | |||||||||||||||||
-MORE-
| 14 | ||||||||||||||||||||||||||
|
WHITNEY HOLDING CORPORATION AND SUBSIDIARIES
|
||||||||||||||||||||||||||
|
LOAN PORTFOLIO DETAIL
|
||||||||||||||||||||||||||
|
LOAN PORTFOLIO AT QUARTER-END
|
||||||||||||||||||||||||||
| 2010 | 2009 | |||||||||||||||||||||||||
|
(dollars in millions)
|
December
|
September
|
June
|
March
|
December
|
|||||||||||||||||||||
|
Commercial, financial & agricultural
|
$ | 2,789 | $ | 2,846 | $ | 2,895 | $ | 2,869 | $ | 3,075 | ||||||||||||||||
|
Owner-occupied real estate
|
1,003 | 1,070 | 1,053 | 1,069 | 1,080 | |||||||||||||||||||||
|
Total commercial & industrial
|
3,792 | 3,916 | 3,948 | 3,938 | 4,155 | |||||||||||||||||||||
|
Commercial real estate:
|
||||||||||||||||||||||||||
|
Construction, land & land development
|
946 | 1,175 | 1,396 | 1,479 | 1,537 | |||||||||||||||||||||
|
CRE - other
|
1,123 | 1,223 | 1,197 | 1,217 | 1,246 | |||||||||||||||||||||
|
Total commercial real estate
|
2,069 | 2,398 | 2,593 | 2,696 | 2,783 | |||||||||||||||||||||
|
Residential mortgage
|
953 | 994 | 1,007 | 1,015 | 1,035 | |||||||||||||||||||||
|
Consumer
|
421 | 426 | 431 | 424 | 430 | |||||||||||||||||||||
|
Total loans
|
$ | 7,235 | $ | 7,734 | $ | 7,979 | $ | 8,073 | $ | 8,403 | ||||||||||||||||
|
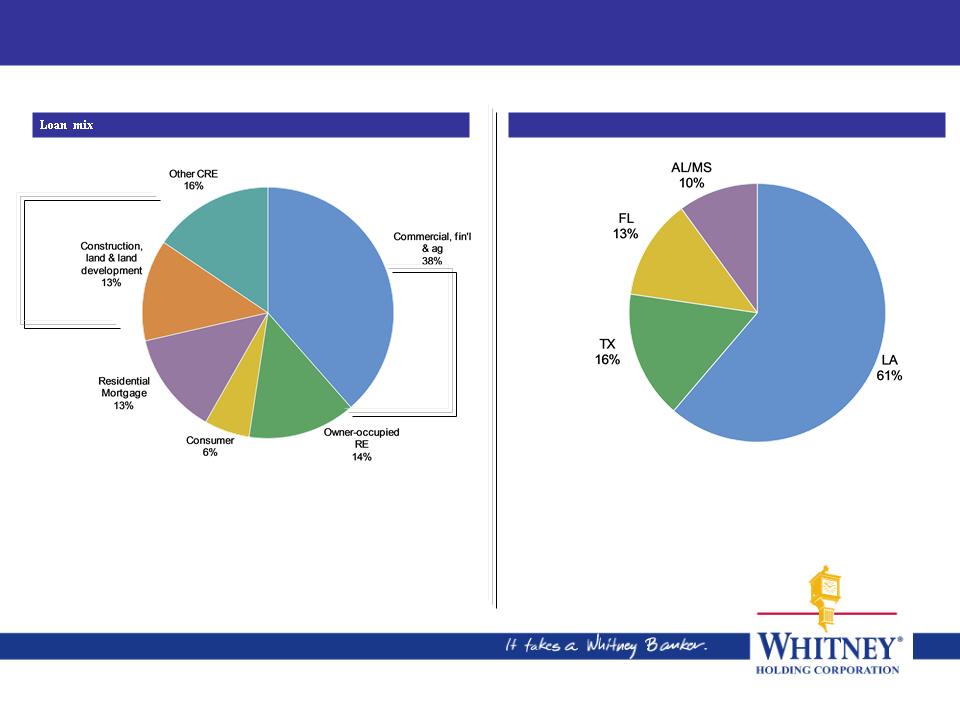
GEOGRAPHIC DISTRIBUTION OF LOAN PORTFOLIO AT DECEMBER 31, 2010
|
||||||||||||||||||||||||||
|
Alabama/
|
Percent
|
|||||||||||||||||||||||||
|
(dollars in millions)
|
Louisiana
|
Texas
|
Florida
|
Mississippi
|
Total
|
of total
|
||||||||||||||||||||
|
Commercial, financial & agricultural
|
$ | 2,055 | $ | 390 | $ | 124 | $ | 220 | $ | 2,789 | 38 | % | ||||||||||||||
|
Owner-occupied real estate
|
622 | 126 | 166 | 89 | 1,003 | 14 | % | |||||||||||||||||||
|
Total commercial & industrial
|
2,677 | 516 | 290 | 309 | 3,792 | 52 | % | |||||||||||||||||||
|
Commercial real estate:
|
||||||||||||||||||||||||||
|
Construction, land & land development
|
352 | 315 | 161 | 118 | 946 | 13 | % | |||||||||||||||||||
|
CRE - other
|
597 | 148 | 236 | 142 | 1,123 | 16 | % | |||||||||||||||||||
|
Total commercial real estate
|
949 | 463 | 397 | 260 | 2,069 | 29 | % | |||||||||||||||||||
|
Residential mortgage
|
520 | 155 | 160 | 118 | 953 | 13 | % | |||||||||||||||||||
|
Consumer
|
289 | 25 | 65 | 42 | 421 | 6 | % | |||||||||||||||||||
|
Total
|
$ | 4,435 | $ | 1,159 | $ | 912 | $ | 729 | $ | 7,235 | 100 | % | ||||||||||||||
|
Percent of total
|
61 | % | 16 | % | 13 | % | 10 | % | 100 | % | ||||||||||||||||
|
CLASSIFIED LOANS AT DECEMBER 31, 2010
|
||||||||||||||||||||||||||
|
Percent
|
||||||||||||||||||||||||||
|
of loan
|
||||||||||||||||||||||||||
|
Alabama/
|
category
|
|||||||||||||||||||||||||
|
(dollars in millions)
|
Louisiana
|
Texas
|
Florida
|
Mississippi
|
Total
|
total
|
||||||||||||||||||||
|
Commercial, financial & agricultural
|
$ | 83 | $ | 70 | $ | 10 | $ | 36 | $ | 199 | 7 | % | ||||||||||||||
|
Owner-occupied real estate
|
55 | 26 | 27 | 28 | 136 | 14 | % | |||||||||||||||||||
|
Total commercial & industrial
|
138 | 96 | 37 | 64 | 335 | 9 | % | |||||||||||||||||||
|
Commercial real estate:
|
||||||||||||||||||||||||||
|
Construction, land & land development
|
38 | 160 | 58 | 16 | 272 | 29 | % | |||||||||||||||||||
|
CRE - other
|
43 | 49 | 25 | 31 | 148 | 13 | % | |||||||||||||||||||
|
Total commercial real estate
|
81 | 209 | 83 | 47 | 420 | 20 | % | |||||||||||||||||||
|
Residential mortgage
|
42 | 13 | 29 | 11 | 95 | 10 | % | |||||||||||||||||||
|
Consumer
|
2 | 2 | 5 | 1 | 10 | 2 | % | |||||||||||||||||||
|
Total
|
$ | 263 | $ | 320 | $ | 154 | $ | 123 | $ | 860 | 12 | % | ||||||||||||||
|
Percent of regional loan total
|
6 | % | 28 | % | 17 | % | 17 | % | 12 | % | ||||||||||||||||
-END-

4Q10 Supplemental Data
January 27, 2011
January 27, 2011
2
2
Commercial and Business Banking Focus
Total Loans: $7.2B
4Q10 Average Yield: 4.94%
4Q10 Average Yield: 4.94%
Note: Financial data as of December 31, 2010
Geographic Distribution
C&I
CRE
Reclassification Of Loans To Held For Sale
3
|
|
($s in millions)
|
|
Loans Included in Bulk Sale Transaction*
|
|
|
Book Value
|
$179
|
|
Reserves as of 9/30/10
|
(16)
|
|
Net Book Value
|
$163
|
|
Estimated Net Proceeds
|
88
|
|
4Q10 Provision Impact
|
$75
|
|
Additional Notes Reclassified to Held For Sale
|
|
|
Book Value
|
$124
|
|
Reserves as of 9/30/10
|
(12)
|
|
Net Book Value
|
$112
|
|
Estimated Net Proceeds
|
$75
|
|
4Q10 Provision Impact
|
$37
|
|
|
|
|
Total direct provision impact
|
$112
|
*Bulk Sale transaction closed January 24, 2011.
4
4
Loans Held For Sale (excluding Bulk Sale loans)
Note: Financial data as of December 31, 2010
|
($s in millions)
|
Louisiana
|
Texas
|
Florida
|
Alabama/
Mississippi |
Total
|
|
Commercial, financial,
agricultural |
$ 1
|
$ 1
|
$ 2
|
$ --
|
$ 4
|
|
Owner-occupied real estate
|
10
|
1
|
6
|
3
|
20
|
|
CRE: Construction, land, land
development |
10
|
8
|
11
|
6
|
35
|
|
CRE - Other
|
4
|
1
|
3
|
--
|
8
|
|
Residential Mortgage
|
2
|
--
|
4
|
2
|
8
|
|
Consumer
|
--
|
--
|
--
|
--
|
--
|
|
|
|
|
|
|
|
|
Total
|
$ 27
|
$ 11
|
$ 26
|
$ 11
|
$ 75
|
5
5
CRE: Construction, Land & Land Development Loans
Note: Financial data as of December 31, 2010
Excludes loans held for sale
|
($s in millions)
|
Louisiana
|
Texas
|
Florida
|
Alabama/
Mississippi |
Total
|
|
Residential
construction |
$ 69
|
$ 47
|
$ 21
|
$ 11
|
$ 148
|
|
Land & Lots:
|
|
|
|
|
|
|
Residential
|
101
|
15
|
57
|
39
|
212
|
|
Commercial
|
84
|
86
|
36
|
39
|
245
|
|
Retail
|
14
|
87
|
2
|
4
|
107
|
|
Office Buildings
|
6
|
4
|
17
|
1
|
28
|
|
Hotel/motel
|
--
|
--
|
15
|
--
|
15
|
|
Multifamily
|
19
|
49
|
--
|
--
|
68
|
|
Industrial/
warehouse |
12
|
5
|
2
|
2
|
21
|
|
Other
|
47
|
22
|
11
|
22
|
102
|
|
Total
|
$ 352
|
$ 315
|
$ 161
|
$ 118
|
$ 946
|
6
6
CRE: Other Commercial Real Estate Loans
Note: Financial data as of December 31, 2010
Excludes loans held for sale
|
($s in millions)
|
Louisiana
|
Texas
|
Florida
|
Alabama/
Mississippi |
Total
|
|
Retail
|
$ 188
|
$ 80
|
$ 58
|
$ 31
|
$ 357
|
|
Office Buildings
|
108
|
24
|
52
|
29
|
213
|
|
Hotel/motel
|
104
|
4
|
43
|
23
|
174
|
|
Multifamily
|
68
|
27
|
20
|
42
|
157
|
|
Industrial/
warehouse |
64
|
12
|
30
|
10
|
116
|
|
Other
|
65
|
1
|
33
|
7
|
106
|
|
Total
|
$ 597
|
$ 148
|
$ 236
|
$ 142
|
$ 1,123
|

C&I: Oil & Gas Portfolio
• Oil and gas
portfolio 10%
of total loans
portfolio 10%
of total loans
• Approximately
$40 million in
classified, no
nonaccruals
$40 million in
classified, no
nonaccruals
7
|
Sector
|
$ Outstanding
|
% of
Total |
|
Exploration &
Production |
$227
|
32%
|
|
Drilling & pre-drilling
|
173
|
24%
|
|
Transportation
|
166
|
23%
|
|
Service & Supply
|
125
|
18%
|
|
Other
|
21
|
3%
|
|
Total
|
$712
|
100%
|
$s in millions
Note: Financial data as of December 31, 2010
8
8
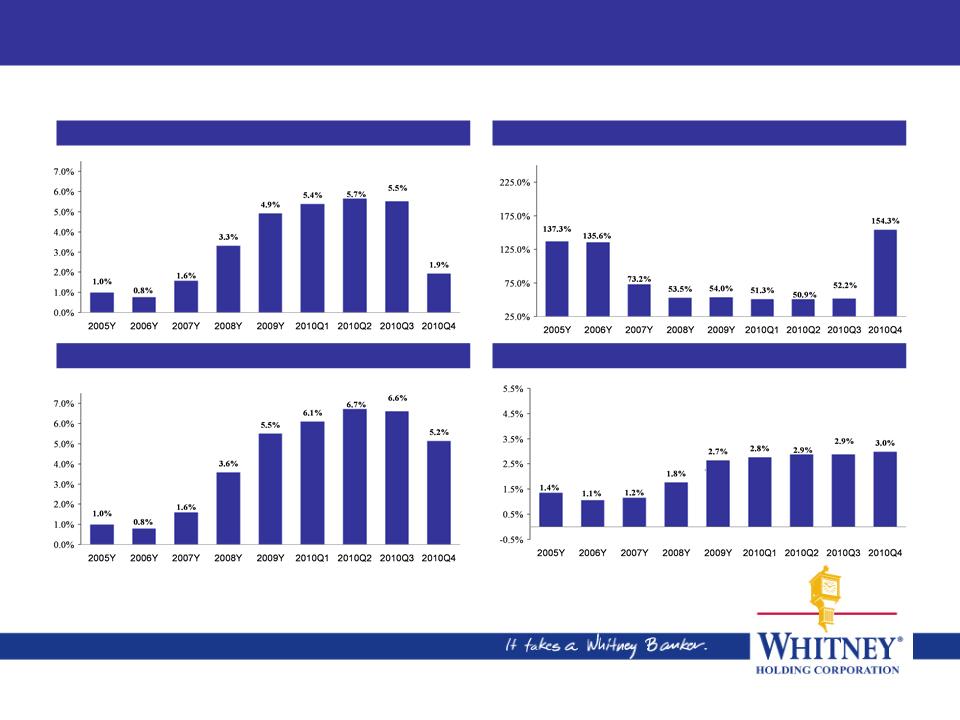
Summary Credit Statistics
Nonaccrual loans to loans (excluding nonaccrual loans held for sale)
Allowance for loan losses/loans
NPAs/loans + OREO (including nonaccrual loans held for sale)
Reserves/NPLs (excluding nonaccrual loans held for sale)
Note: Financial data as of December 31, 2010
9
9
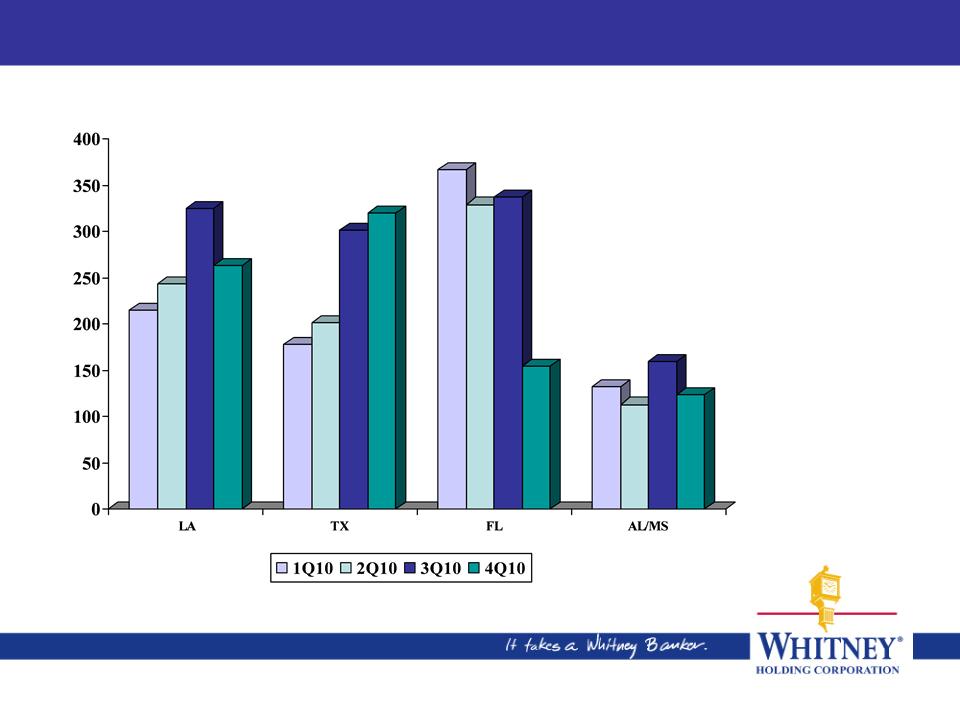
Classified Portfolio By Geography
NPLs are included in total classified portfolio
Excludes loans held for sale
Excludes loans held for sale
Note: Financial data as of December 31, 2010
10
10
Construction, Land & Land Development Classified Loans
|
($s in millions)
|
Louisiana
|
Texas
|
Florida
|
Alabama/
Mississippi |
Total
|
% of
Portfolio Total |
|
Residential
construction |
$ 3
|
$ 7
|
$ 4
|
$ 1
|
$ 15
|
10%
|
|
Land & Lots:
|
|
|
|
|
|
|
|
Residential
|
15
|
3
|
28
|
12
|
58
|
27%
|
|
Commercial
|
17
|
66
|
13
|
2
|
98
|
40%
|
|
Retail
|
--
|
41
|
--
|
--
|
41
|
38%
|
|
Office
Buildings |
--
|
--
|
12
|
--
|
12
|
43%
|
|
Hotel/motel
|
--
|
--
|
--
|
--
|
--
|
--
|
|
Multifamily
|
--
|
27
|
--
|
--
|
27
|
40%
|
|
Industrial/
warehouse |
--
|
--
|
1
|
--
|
1
|
5%
|
|
Other
|
3
|
16
|
--
|
1
|
20
|
20%
|
|
Total
|
$ 38
|
$ 160
|
$ 58
|
$ 16
|
$ 272
|
29%
|
Note: Financial data as of December 31, 2010
Excludes loans held for sale
11
11
Other Commercial Real Estate Classified Loans
|
($s in millions)
|
Louisiana
|
Texas
|
Florida
|
Alabama/
Mississippi |
Total
|
% of
Portfolio Total |
|
Retail
|
$ 5
|
$ 25
|
$ 5
|
$ 7
|
$ 42
|
12%
|
|
Office
Buildings |
9
|
7
|
4
|
1
|
21
|
10%
|
|
Hotel/motel
|
3
|
4
|
2
|
--
|
9
|
5%
|
|
Multifamily
|
11
|
13
|
4
|
20
|
48
|
31%
|
|
Industrial/
warehouse |
5
|
--
|
5
|
1
|
11
|
9%
|
|
Other
|
10
|
--
|
5
|
2
|
17
|
16%
|
|
Total
|
$ 43
|
$ 49
|
$ 25
|
$ 31
|
$ 148
|
13%
|
Note: Financial data as of December 31, 2010
Excludes loans held for sale
|
|
LA
|
TX
|
FL
|
AL/MS
|
|
Loans
|
$4,435
|
$1,159
|
$912
|
$729
|
|
Reserve/NPLs
|
155%
|
115%
|
206%
|
120%
|
|
NPLs/Loans
|
1%
|
2%
|
4%
|
3%
|
12
12
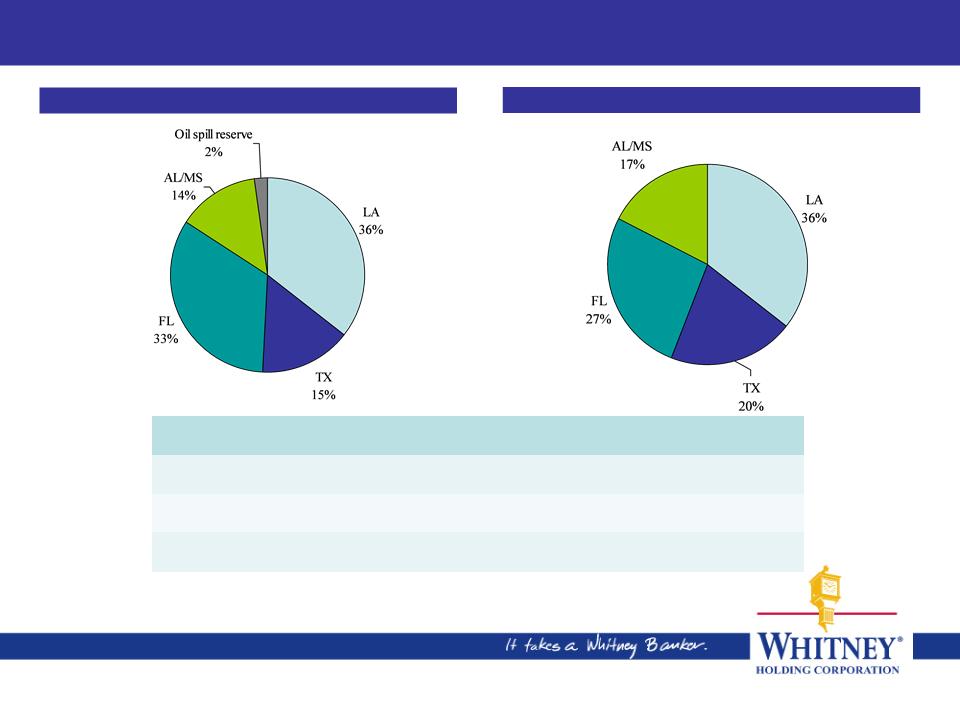
Nonperforming Loans Declined 67%
Geographic distribution of allowance for loan losses
Geographic distribution of NPLs (held for investment)
($s in millions)
Note: Financial data as of December 31, 2010
NPLs exclude nonaccrual loans held for sale
13
13
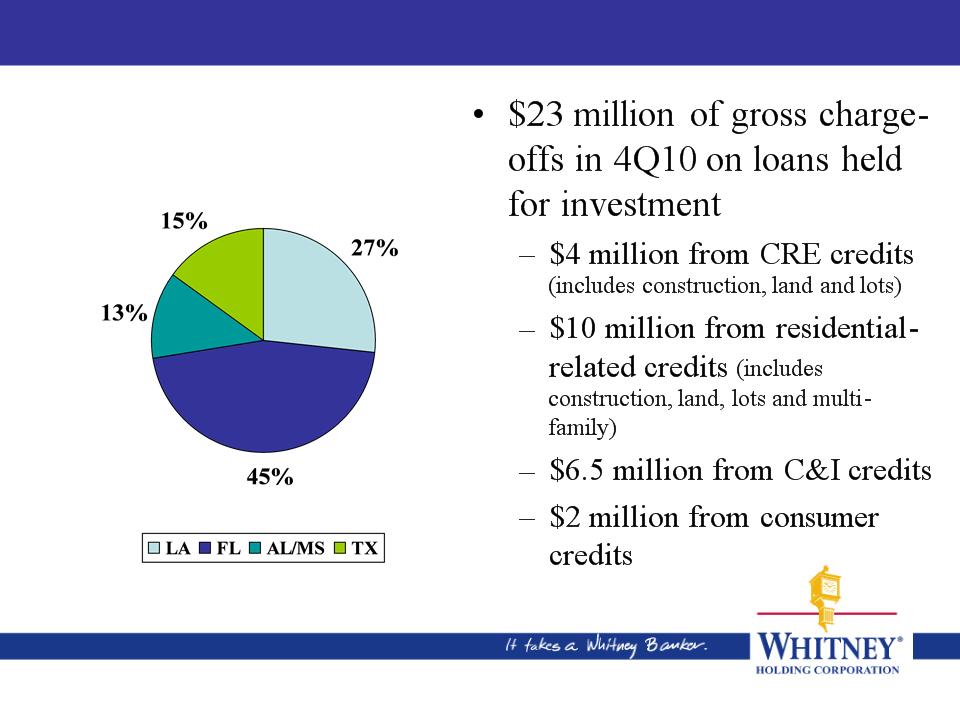
Charge-Offs On Loans (excluding held for sale)
Gross Charge-offs by
Geography: 4Q10
Geography: 4Q10
Note: Financial data as of December 31, 2010
Classified To Total Loans By Geography
As of September 30, 2010
|
$s in millions
|
LA
|
TX
|
FL
|
AL/MS
|
Total
|
% of
Total |
|
C&I
|
$152
|
$61
|
$69
|
$68
|
$350
|
31
|
|
% Classified to Total
Loans |
6%
|
11%
|
23%
|
22%
|
9%
|
|
|
CRE
|
121
|
231
|
214
|
75
|
641
|
57
|
|
% Classified to Total
Loans |
12%
|
43%
|
38%
|
24%
|
27%
|
|
|
Residential Mortgage
& Consumer |
52
|
9
|
54
|
16
|
131
|
12
|
|
% Classified to Total
Loans |
6%
|
5%
|
23%
|
10%
|
9%
|
|
|
Total Classified
Loans |
$325
|
$301
|
$337
|
$159
|
$1,122
|
100
|
|
% of Total
Classified Loans |
29%
|
27%
|
30%
|
14%
|
100%
|
|
|
$s in millions
|
LA
|
TX
|
FL
|
AL/MS
|
Total
|
% of
Total |
|
C&I
|
$138
|
$96
|
$37
|
$64
|
$335
|
39
|
|
% Classified to Total
Loans |
5%
|
19%
|
13%
|
21%
|
9%
|
|
|
CRE
|
81
|
209
|
83
|
47
|
420
|
49
|
|
% Classified to Total
Loans |
9%
|
45%
|
21%
|
18%
|
20%
|
|
|
Residential Mortgage
& Consumer |
44
|
15
|
34
|
12
|
105
|
12
|
|
% Classified to Total
Loans |
5%
|
8%
|
15%
|
8%
|
8%
|
|
|
Total Classified
Loans |
$263
|
$320
|
$154
|
$123
|
$860
|
100
|
|
% of Total
Classified Loans |
31%
|
37%
|
18%
|
14%
|
100%
|
|
14
Classified loans include: Substandard and Doubtful, which are inclusive of Nonperforming/Impaired.
Excludes loans held for sale
Classified Loans Reduced 23%
As of December 31, 2010
(Classified CRE loans in Florida decreased 61%)

4Q10 Supplemental Data
January 27, 2011
January 27, 2011