Attached files
| file | filename |
|---|---|
| 8-K - NATIONAL PENN BANCSHARES, INC. FORM 8-K - NATIONAL PENN BANCSHARES INC | npb8k.htm |
EXHIBIT 99.1
SLIDE PRESENTATION

National Penn Bancshares, Inc.
4th Quarter & Year End 2010
Earnings Webcast
Earnings Webcast

1
This presentation, including the attached Financial Highlights and financial data tables, contains supplemental financial information determined by methods other
than in accordance with Accounting Principles Generally Accepted in the United States of America (“GAAP”). National Penn’s management uses these non-GAAP
measures in its analysis of National Penn’s performance. These measures should not be considered a substitute for GAAP basis measures nor should they be viewed
as a substitute for operating results determined in accordance with GAAP. Management believes the presentation of the following non-GAAP financial measures, which
exclude the impact of the specified items, provides useful supplemental information that is essential to a proper understanding of the financial results of National Penn.
– Annualized return on average tangible common equity excludes the average balance of acquisition-related goodwill and intangible assets and the
average balance of preferred equity in determining average tangible shareholders’ equity. Annualized return on average tangible equity provides a
method to assess management’s success in utilizing the company’s tangible common capital.
average balance of preferred equity in determining average tangible shareholders’ equity. Annualized return on average tangible equity provides a
method to assess management’s success in utilizing the company’s tangible common capital.
– Tangible book value excludes from total equity goodwill, intangible assets and preferred stock. Banking and financial institution regulators also exclude
goodwill and intangible assets from shareholders’ equity when assessing the capital adequacy of a financial institution. Tangible book value provides a
method to assess the level of tangible net assets on a per share basis.
goodwill and intangible assets from shareholders’ equity when assessing the capital adequacy of a financial institution. Tangible book value provides a
method to assess the level of tangible net assets on a per share basis.
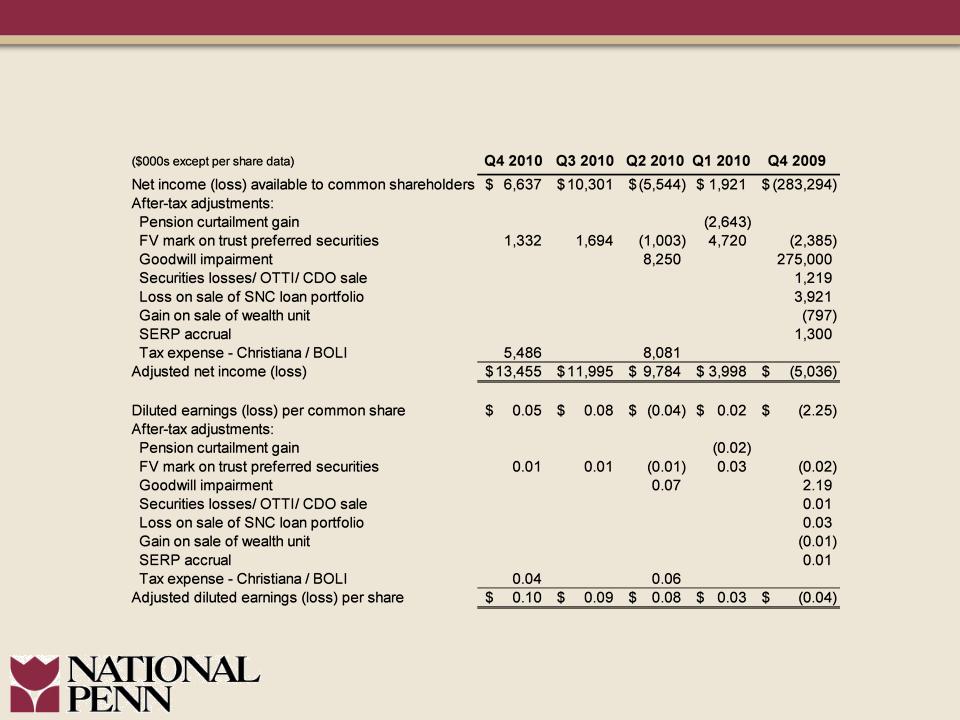
– Adjusted net income excludes the effects of certain gains and losses adjusted for applicable taxes. Adjusted net income provides a method to assess
earnings performance by excluding items that management believes are not comparable among the periods presented.
earnings performance by excluding items that management believes are not comparable among the periods presented.
– Efficiency ratio expresses operating expenses as a percentage of fully-taxable equivalent net interest income plus non-interest income. Operating
expenses exclude items from non-interest expense that management believes are not comparable among the periods presented. Non-interest income is
adjusted to also exclude items that management believes are not comparable among the periods presented. Efficiency ratio is used as a method for
management to assess its operating expense level and to compare to financial institutions of varying sizes.
Management believes the use of non-GAAP measures will help readers compare National Penn’s current results to those of prior periods as presented in the
accompanying Financial Highlights and financial data tables.
accompanying Financial Highlights and financial data tables.
Non-GAAP Financial Measures
Safe Harbor Regarding Forward Looking Statements
This presentation contains forward-looking information about National Penn Bancshares, Inc. that is intended to be covered by the safe harbor for forward-looking
statements provided by the Private Securities Litigation Reform Act of 1995. Forward-looking statements are statements that are not historical facts. These
statements can be identified by the use of forward-looking terminology such as “believe,” “expect,” “may,” “will,” “should,’’ “project,” ”could,” “plan,’’ “goal,” “potential,”
“pro forma,” “seek,” “intend,’’ or “anticipate’’ or the negative thereof or comparable terminology, and include discussions of strategy, financial projections, guidance
and estimates (including their underlying assumptions), statements regarding plans, objectives, expectations or consequences of announced transactions, and
statements about the future performance, operations, products and services of National Penn and its subsidiaries. National Penn cautions readers not to place undue
reliance on these statements.
National Penn’s business and operations, as well as its business and operations following the completion of transactions described in this presentation, are
subject to a variety of risks, uncertainties and other factors. Consequently, actual results and experience may materially differ from those contained in any forward-
looking statements. Such risks, uncertainties and other factors that could cause actual results and experience to differ from those projected include, but are not
limited to, the following: increased capital requirements and other requirements or actions mandated by National Penn’s regulators, National Penn’s inability to meet
the requirements of the memorandum of understanding or the individual minimum capital ratio requirements issued by its primary regulator, National Penn’s inability
to successfully implement its “self-improvement plan”, National Penn’s ability to raise capital and maintain capital levels, variations in interest rates, deterioration in
the credit quality of loans, the effect of credit risk exposure, declines in the value of National Penn’s assets and the effect of any resulting impairment charges, recent
and ongoing changes to the state and federal regulatory schemes under which National Penn and other financial services companies operate (including the recently
passed Dodd-Frank Act and regulations to be adopted to implement that Act), competition from other financial institutions, interruptions or breaches of National
Penn’s security systems, and the development and maintenance of National Penn’s information technology. These risks and others are described in greater detail in
National Penn’s Annual Report on Form 10-K for the fiscal year ended December 31, 2009, as well as in National Penn’s Quarterly Reports on Form 10-Q and other
documents filed by National Penn with the SEC after the date thereof. National Penn makes no commitment to revise or update any forward-looking statements in
order to reflect events or circumstances occurring or existing after the date any forward-looking statement is made.

2
Executing the Strategic Plan
l Asset quality continues to improve
l Fundamentals remain strong
l Strong capital levels further enhanced
l Strategic initiatives achieved
– Divestiture of Christiana Bank & Trust Company -
December 3, 2010
December 3, 2010
– Completion of Warburg Pincus LLC investment
transaction - January 7, 2011
transaction - January 7, 2011
3
Quarterly Adjusted Earnings Analysis

4
Full Year Adjusted Earnings Analysis
5
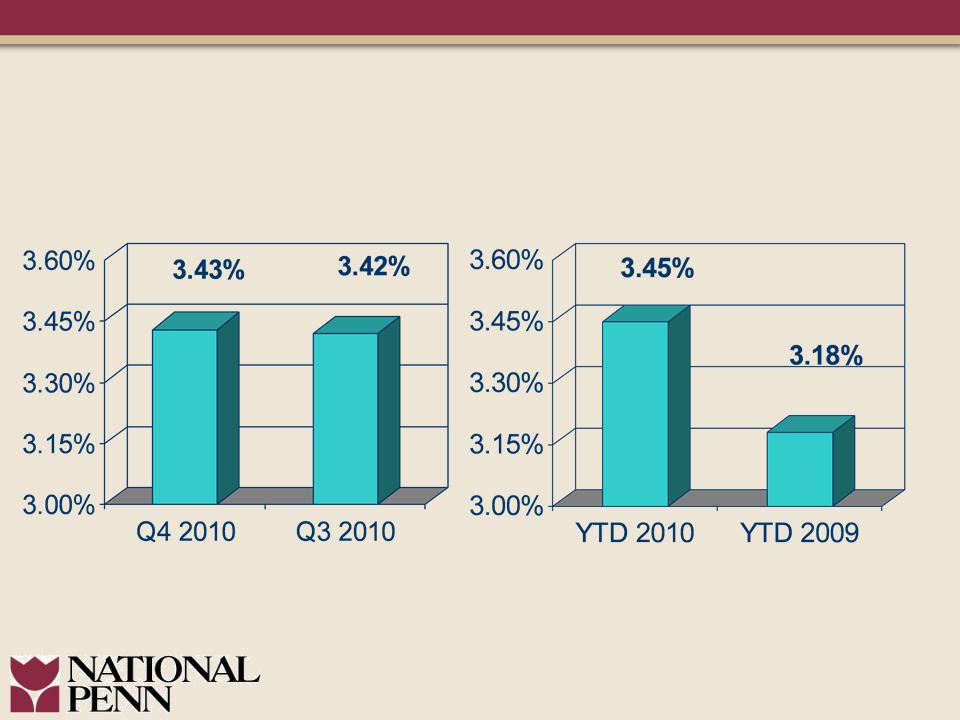
Net Interest Margin
(Taxable Equivalent)
(Taxable Equivalent)

6
Non-Interest Income

7
Non-Interest Expense
8
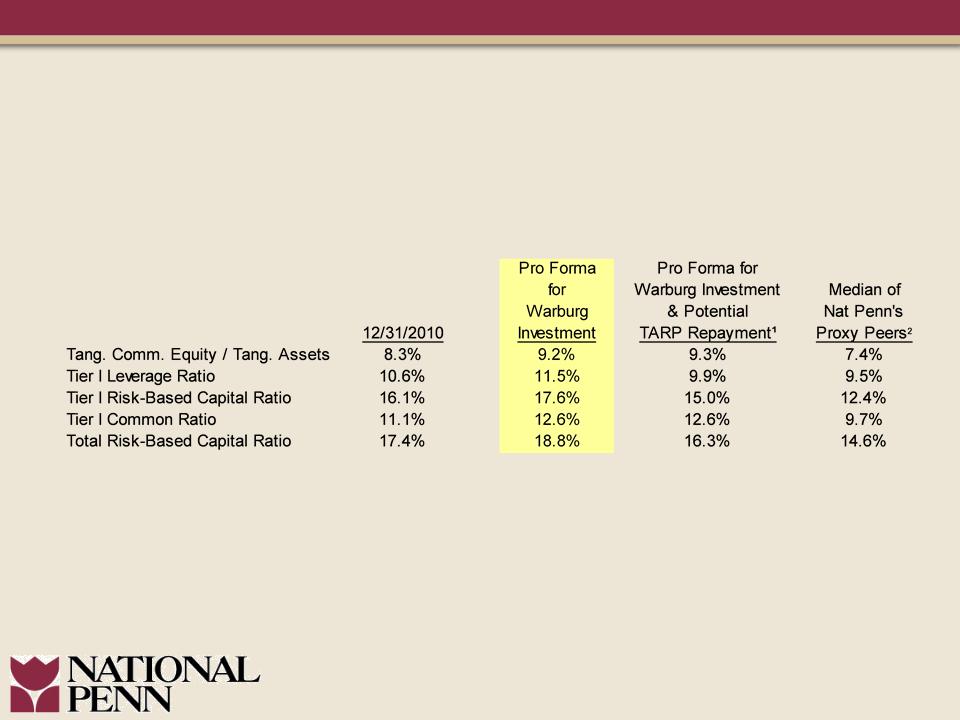
(1) Does not assume repurchase of the 735,294 outstanding warrants, valued at approximately $1.0 million based on a
binomial valuation
binomial valuation
(2) Peer data as of 9/30/2010
Pro Forma Capital Ratios

9
Asset Quality Statistics
10
Note: Classified loans consist of loans risk rated substandard, doubtful, or loss. As such
classified loans include non-performing loans.
classified loans include non-performing loans.
Classified Loans
($000s)
($000s)

11
Non-Performing Loans and Charge-offs
($000s)
($000s)
12
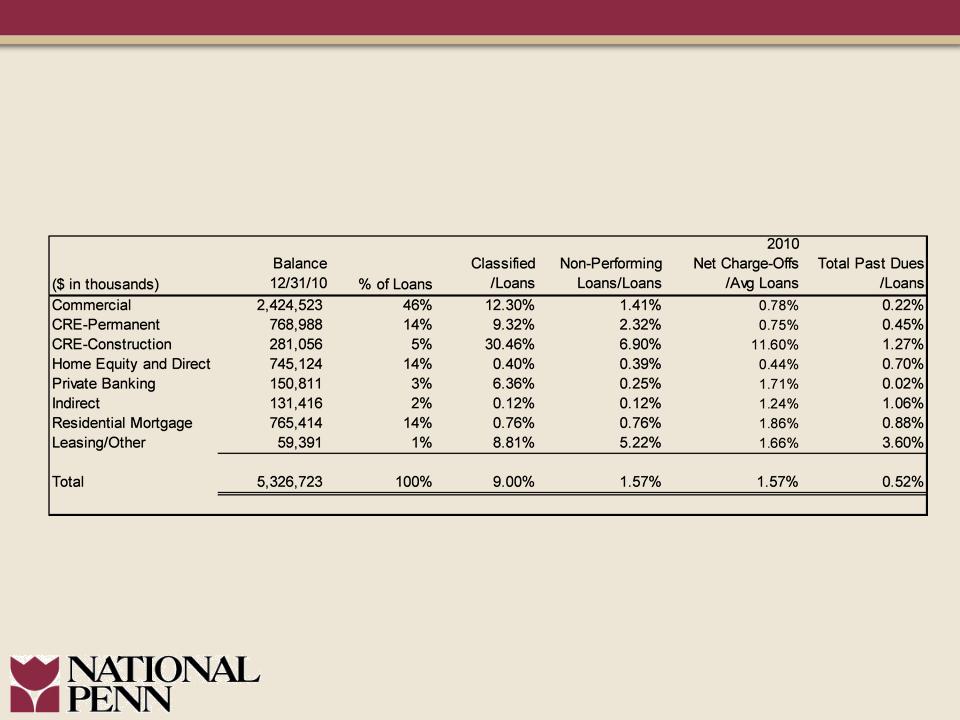
Loan Risk Profile
December 31, 2010
December 31, 2010

13
Non-Performing Assets
Gross Charge Offs
Non-Performing Assets and
Gross Charge-offs by Geographic Region
December 31, 2010
Gross Charge-offs by Geographic Region
December 31, 2010

14
Strategic Focuses
l Continued profitability improvement
l Maintaining solid fundamental performance
l Further improving asset quality
l Accelerating TARP repayment
l Strong balance sheet from which to grow