Attached files
| file | filename |
|---|---|
| 8-K - FORM 8-K - FRANKLIN RESOURCES INC | d8k.htm |
| EX-99.1 - PRESS RELEASE - FRANKLIN RESOURCES INC | dex991.htm |
 FRANKLIN RESOURCES, INC.
Franklin Resources, Inc.
Preliminary First Quarter Results –
January 27, 2011
Exhibit 99.2 |
| 2
FRANKLIN RESOURCES, INC.
Forward-Looking Statements
The financial results in this presentation are preliminary. Statements in this presentation regarding
Franklin Resources, Inc. (“Franklin”) and its subsidiaries, which are not historical
facts, are "forward-looking statements" within the meaning of the U.S. Private Securities Litigation Reform Act of 1995. When used in this presentation, words or
phrases generally written in the future tense and/or preceded by words such as “will”,
“may”, “could”, “expect”, “believe”, “anticipate”, “intend”, “plan”, “seek”, “estimate” or
other similar words are forward-looking statements. Forward-looking statements involve a
number of known and unknown risks, uncertainties and other important factors, some of which are
listed below, that could cause actual results and outcomes to differ materially from any future results or outcomes expressed or implied by such forward-
looking statements. Forward-looking statements are based on our current expectations
and assumptions regarding our business, the economy and other future conditions. Because
forward-looking statements relate to the future, they are subject to inherent uncertainties, risks and changes in circumstances that are difficult to
predict. We caution you therefore against relying on any of these forward-looking statements. They
are neither statements of historical fact nor guarantees or assurances of future
performance. These and other risks, uncertainties and other important factors are described in more detail in
Franklin’s recent filings with the U.S. Securities and Exchange Commission, including,
without limitation, in Risk Factors and Management’s Discussion and Analysis of Financial Condition and Results of Operations in Franklin’s Annual Report on
Form 10-K for the fiscal year ended September 30, 2010: (1) volatility and disruption of the
capital and credit markets, and adverse changes in the global economy, may significantly affect
our results of operations and may put pressure on our financial results; (2) the amount and mix of our assets under management are subject to
significant fluctuations; (3) we are subject to extensive and complex, overlapping and frequently
changing rules, regulations and legal interpretations; (4) regulatory and legislative actions
and reforms have made the regulatory environment in which we operate more costly and future actions and reforms could adversely impact our assets
under management, increase costs and negatively impact our profitability and future financial results;
(5) changes in tax laws or exposure to additional income tax liabilities could have a material
impact on our financial condition, results of operations and liquidity; (6) any significant limitation or failure of our software applications, technology or
other systems that are critical to our operations could constrain our operations; (7) our investment
management business operations are complex and a failure to properly perform operational tasks
or the misrepresentation of our products and services could have an adverse effect on our revenues and income; (8) we face risks, and
corresponding potential costs and expenses, associated with conducting operations and growing our
business in numerous countries; (9) we depend on key personnel and our financial performance
could be negatively affected by the loss of their services; (10) strong competition from numerous and sometimes larger companies with
competing offerings and products could limit or reduce sales of our products, potentially resulting in
a decline in our market share, revenues and net income; (11) changes in the third-party
distribution and sales channels on which we depend could reduce our revenues and hinder our growth; (12) our increasing focus on international markets
as a source of investments and sales of investment products subjects us to increased exchange rate and
other risks in connection with earnings and income generated overseas; (13) poor investment
performance of our products could affect our sales or reduce the level of assets under management, potentially negatively impacting our
revenues and income; (14) we could suffer losses in earnings or revenue if our reputation is harmed;
(15) our future results are dependent upon maintaining an appropriate level of expenses, which
is subject to fluctuation; (16) our ability to successfully integrate widely varied business lines can be impeded by systems and other technological
limitations; (17) our inability to successfully recover should we experience a disaster or other
business continuity problem could cause material financial loss, loss of human capital,
regulatory actions, reputational harm or legal liability; (18) certain of the portfolios we manage, including our emerging market portfolios, are vulnerable to significant
market-specific political, economic or other risks, any of which may negatively impact our
revenues and income; (19) our revenues, earnings and income could be adversely affected if the
terms of our management agreements are significantly altered or these agreements are terminated by the funds and other sponsored investment
products we advise; (20) regulatory and governmental examinations and/or investigations, civil
litigation relating to previously-settled regulatory and governmental investigations, and
the legal risks associated with our business, could adversely impact our assets under management, increase costs and negatively impact our
profitability and/or our future financial results; (21) our ability to meet cash needs depends upon
certain factors, including the market value of our assets, operating cash flows and our
perceived creditworthiness; (22) diverse and strong competition limits the interest rates that we can charge on consumer loans; (23) our business could be
negatively affected if we or our banking subsidiaries fail to remain well capitalized, and liquidity
needs could affect our banking business; and (24) we are dependent on the earnings of our
subsidiaries. Any forward-looking statement made by us in this presentation speaks only as of the date on which
it is made. Factors or events that could cause our actual results to differ may emerge
from time to time, and it is not possible for us to predict all of them. We undertake no obligation to publicly update any forward-looking statement,
whether as a result of new information, future developments or otherwise, except as may be required by
law. The information in this presentation is provided solely in connection with this presentation, and is not
directed toward existing or potential investment advisory clients or fund shareholders. |
| 3
FRANKLIN RESOURCES, INC.
Audio Commentary and Conference Call Details
Pre-recorded
audio
commentary
on
the
results
from
Franklin
Resources,
Inc.’s
President
and
Chief
Executive
Officer
Greg
Johnson
and
Executive
Vice
President
and
Chief
Financial
Officer
Ken
Lewis
will
be
available
today
at
approximately
8:30
a.m.
Eastern
Time.
They
will
also
lead
a
live
teleconference
today
at
4:30
p.m.
Eastern
Time
to
answer
questions.
Analysts
and
investors
are
encouraged
to
contact
Investor
Relations
for
any
clarifications
or
questions
on
the
contents
of
the
earnings
release
or
this
presentation.
Access
to
the
pre-recorded
audio
commentary
and
accompanying
slides
are
available
at
franklinresources.com.
The
pre-
recorded
audio
commentary
can
also
be
accessed
by
dialing
(888)
843-7419
in
the
U.S.
and
Canada
or
(630)
652-3042
internationally
using
access
code
28808142,
any
time
through
11:59
p.m.
Eastern
Time
on
February
10,
2011.
Access
to
the
live
teleconference
will
be
available
at
franklinresources.com
or
by
dialing
(800)
446-2782
in
the
U.S.
and
Canada
or
(847)
413-3235
internationally.
A
replay
of
the
call
can
also
be
accessed
by
calling
(888)
843-7419
in
the
U.S.
and
Canada
or
(630)
652-3042
internationally
using
access
code
28808145,
any
time
through
11:59
p.m.
Eastern
Time
on
February
10,
2011.
Questions
regarding
the
pre-recorded
audio
commentary
or
live
teleconference
should
be
directed
to
Franklin
Resources,
Inc.,
Investor
Relations
at
(650)
312-4091
or
Corporate
Communications
at
(650)
312-2245. |
| 4
FRANKLIN RESOURCES, INC.
Highlights of the Quarter
•
Record assets under management of $670.7 billion and long-term sales of $54.9
billion •
Long-term net new flows of $3.4 billion, net of the previously announced
advisory account redemption of $12.0 billion
•
Tax-free fixed-income funds experienced net outflows of $2.0 billion, but
almost half of that was exchanged into other Franklin Templeton funds
•
Announced a new strategic relationship with Pelagos Capital Management and the
acquisition of Rensburg Fund Management, a U.K. equity manager
|
 FRANKLIN RESOURCES, INC.
Assets Under Management and Flows |
 6
FRANKLIN RESOURCES, INC.
Assets Under Management
$655.6
$604.7
$534.9
$561.2
$583.1
31-Dec-09
31-Mar-10
30-Jun-10
30-Sep-10
31-Dec-10
(in billions, for the three months ended)
End of Period
Simple Monthly Average
$670.7
$570.5
$586.8
$553.5
$644.9
31-Dec-09
31-Mar-10
30-Jun-10
30-Sep-10
31-Dec-10 |
   7
FRANKLIN RESOURCES, INC.
Asia-Pacific²
11%
Canada
5%
United States
69%
Europe¹
15%
Assets Under Management
By Investment Objective
By Sales Region
(chart is as of December 31, 2010)
(chart is as of December 31, 2010)
Hybrid
16%
Equity
44%
Cash
Management
1%
Fixed-
Income
39%
(in billions)
31-Dec-10
30-Sep-10
% Change
Equity
296.1
$
273.7
$
8%
Hybrid
106.1
110.8
(4%)
Fixed-Income
262.0
253.8
3%
Cash Management
6.5
6.6
(2%)
Total
670.7
$
644.9
$
4%
1
Europe sales region includes Middle East and Africa. ² Asia-Pacific sales region includes Latin America and Australia.
(in billions)
31-Dec-10
30-Sep-10
% Change
United States
461.4
$
451.7
$
2%
Europe
1
102.0
92.2
11%
Asia-Pacific
2
73.7
68.4
8%
Canada
33.6
32.6
3%
Total
670.7
$
644.9
$
4% |
   8
FRANKLIN RESOURCES, INC.
Market Appreciation and Flows Summary
Appreciation (Depreciation) and Other
Long-Term Flows¹
$54.9
($52.8)
$51.0
$46.4
$42.2
$48.9
($33.6)
($29.3)
($31.7)
($28.2)
(40.8)
$3.4
$15.4
$17.8
$19.1
$15.1
$18.2
31-Dec-09
31-Mar-10
30-Jun-10
30-Sep-10
31-Dec-10
(in billions, for the three months ended)
1
Long-term net new flows are defined as long-term sales less long-term
redemptions plus long-term net exchanges. The quarter ended December 31, 2010 includes pro forma long-term redemptions in white and net new flows in
orange, adjusted for the $12 billion advisory account redemption.
$24.1
$55.7
$16.6
$16.5
($34.5)
31-Dec-09
31-Mar-10
30-Jun-10
30-Sep-10
31-Dec-10
Long-term sales
42.2
$
46.4
$
51.0
$
48.9
$
54.9
$
Long-term redemptions
(28.2)
(29.3)
(33.6)
(31.7)
(52.8)
Net cash management
0.3
0.3
1.4
2.2
1.1
Total net new flows
14.3
$
17.4
$
18.8
$
19.4
$
3.2
$
Long-Term Net New Flows
Long-Term Sales
Long-Term Redemptions
Pro Forma Long-Term Net New Flows |
 9
FRANKLIN RESOURCES, INC.
United States and International Flows
United States¹
International
$27.0
($31.7)
$25.0
$24.4
$23.8
$23.1
($18.3)
($16.1)
($16.3)
($15.1)
(19.7)
31-Dec-09
31-Mar-10
30-Jun-10
30-Sep-10
31-Dec-10
$27.9
($21.1)
$25.8
$18.4
$22.0
$26.0
($13.1)
($15.4)
($13.2)
($15.3)
31-Dec-09
31-Mar-10
30-Jun-10
30-Sep-10
31-Dec-10
(in billions, for the three months ended)
Long-Term Sales
Long-Term Redemptions
Long-Term Sales
Long-Term Redemptions
1 The quarter ended December 31, 2010 includes pro forma long-term redemptions in white, adjusted
for the $12 billion advisory account redemption. |
    10
FRANKLIN RESOURCES, INC.
Net New Flows by Investment Objective
(in billions, for the three months ended)
31-Dec-10
30-Sep-10
Dec-10 vs.
Sep-10
31-Dec-09
Dec-10 vs.
Dec-09
Equity sales
19.9
$
19.6
$
2%
13.6
$
46%
Equity redemptions
(18.4)
(14.7)
25%
(15.7)
17%
Equity net exchanges
0.6
(0.4)
NM
(0.1)
NM
Equity Net New Flows
2.1
4.5
(53%)
(2.2)
NM
Hybrid sales
5.1
4.0
28%
4.4
16%
Hybrid redemptions
(15.8)
(3.4)
365%
(2.7)
485%
Hybrid net exchanges
0.3
(0.1)
NM
-
NM
Hybrid Net New Flows
(10.4)
0.5
NM
1.7
NM
Fixed-income sales
29.9
25.3
18%
24.2
24%
Fixed-income redemptions
(18.6)
(13.6)
37%
(9.8)
90%
Fixed-income net exchanges
0.4
2.4
(83%)
1.2
(67%)
Fixed-Income Net New Flows
11.7
14.1
(17%)
15.6
(25%)
Cash Management Net New Flows
(0.2)
0.3
NM
(0.8)
(75%)
Total Net New Flows
3.2
$
19.4
$
(84%)
14.3
$
(78%)
NM = not meaningful |
 FRANKLIN RESOURCES, INC.
Investment Performance |
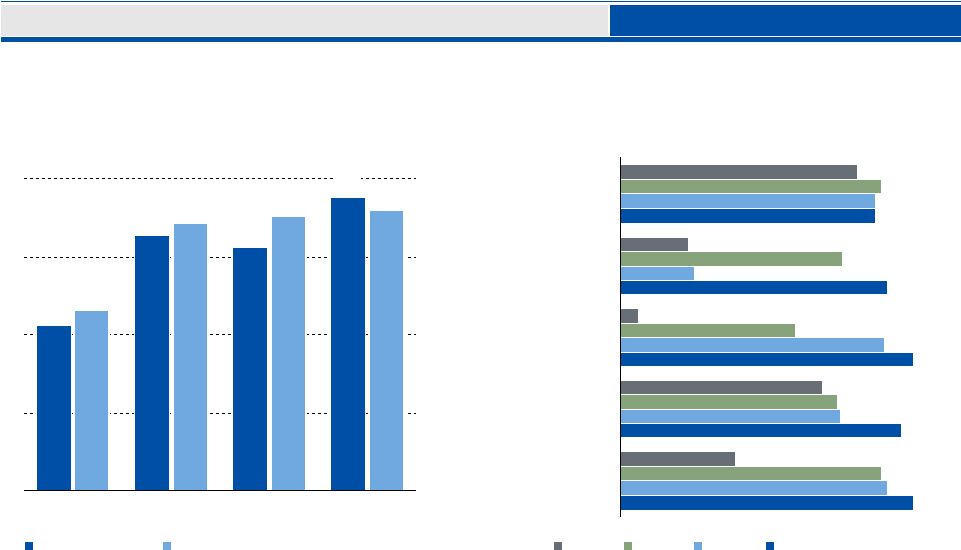 12
FRANKLIN RESOURCES, INC.
Franklin Templeton
Investment
Performance
–
Lipper
Rankings
of
U.S.-Registered
Long-Term
Mutual
Funds¹
89%
76%
60%
74%
89%
91%
87%
91%
100%
96%
100%
39%
6%
23%
81%
69%
25%
75%
87%
90%
Franklin
Equity
Taxable
Fixed
Income
Mutual
Series
Equity
Templeton
Equity
Tax-Free
Fixed
Income
58%
86%
88%
90%
94%
53%
82%
78%
1-Year
3-Year
5-Year
10-Year
Dec. 31, 2010
Sep. 30, 2010
Percentage of Assets in the Top Two Quartiles
By Category as of December 31, 2010
10-Year
5-Year
3-Year
1-Year
1 Lipper rankings for Franklin Templeton U.S.-registered long-term mutual funds are based on
Class A shares. Franklin Templeton funds are compared against a universe of all share classes. Performance
rankings for other share classes may differ. Lipper calculates averages by taking all the funds
and share classes in a peer group and averaging their total returns for the periods indicated. Lipper tracks 147
peer groups of U.S. retail mutual funds, and the groups vary in size from 7 to 1,107 funds.
Lipper total return calculations include reinvested dividends and capital gains, but do not include sales charges of
expense subsidization by the manager. Results may have been different if these or other factors
had been considered. Performance quoted above represents past performance, which cannot predict or
guarantee future results. |
 FRANKLIN RESOURCES, INC.
Operating Results |
 14
FRANKLIN RESOURCES, INC.
Quarterly Financial Highlights
(in millions, except per share data, for the three months ended)
Unaudited
Operating and Net Income¹
Diluted Earnings Per Share²
$659
$501
$509
$467
$461
$522
$356
$373
$357
$360
31-Dec-09
31-Mar-10
30-Jun-10
30-Sep-10
31-Dec-10
$2.23
$1.58
$1.55
$1.54
$1.65
31-Dec-09
31-Mar-10
30-Jun-10
30-Sep-10
31-Dec-10
Operating Income
Net Income¹
1 Net Income attributable to Franklin Resources, Inc. 2 The computation of earnings per share
pursuant to the two-class method excludes from net income attributable to Franklin Resources, Inc. the earnings
allocated to participating securities, which consist of nonvested stock and stock unit awards that
contain nonforfeitable rights to dividends or dividend equivalents. Earnings allocated to participating securities
were $2.1 million, $1.4 million, $2.0 million, $2.0 million and $3.3 million for the three months ended
December 31, 2010, September 30, 2010, June 30, 2010, March 31, 2010 and December 31, 2009. |
   15
FRANKLIN RESOURCES, INC.
Operating Revenues
Unaudited
31-Dec-10
30-Sep-10
Dec-10 vs.
Sep-10
30-Jun-10
31-Mar-10
31-Dec-09
Dec-10 vs.
Dec-09
Investment management fees
1,040.9
$
919.4
$
13%
915.9
$
836.1
$
806.7
$
29%
Sales and distribution fees
577.8
529.5
9%
529.3
496.8
488.1
18%
Shareholder servicing fees
72.1
70.0
3%
73.0
71.4
69.5
4%
Other, net
9.5
9.5
0%
15.9
8.8
13.1
(27%)
Total Operating Revenues
1,700.3
$
1,528.4
$
11%
1,534.1
$
1,413.1
$
1,377.4
$
23%
(in millions, for the three months ended)
Summary of Changes to Operating Revenue Presentation
•
Underwriting and distribution fees have been renamed Sales and distribution
fees Items of Note in the Current Quarter
•
Investment
management
fees
included
$10.8
million
of
performance
fees
and
carried
interest |
   16
FRANKLIN RESOURCES, INC.
Operating Expenses
Unaudited
(in millions, for the three months ended)
31-Dec-10
30-Sep-10
Dec-10 vs.
Sep-10
30-Jun-10
31-Mar-10
31-Dec-09
Dec-10 vs.
Dec-09
Sales, distribution and marketing
647.1
$
599.0
$
8%
590.9
$
557.4
$
535.6
$
21%
Compensation and benefits
292.4
275.3
6%
280.3
271.1
254.3
15%
Information systems and technology
40.4
47.6
(15%)
40.1
39.8
38.0
6%
Occupancy
30.9
33.7
(8%)
35.9
29.8
30.6
1%
General, administrative and other
30.3
63.8
(53%)
65.3
53.9
51.9
(42%)
Total Operating Expenses
1,041.1
$
1,019.4
$
2%
1,012.5
$
952.0
$
910.4
$
14%
Summary of Changes to Operating Expense Presentation
•
Amortization of deferred sales commissions, previously presented
as a separate line, and certain distribution-related expenses,
previously included in Advertising and promotion expenses, have been combined with
Underwriting and distribution expense in a new line named Sales,
distribution and marketing •
Occupancy expense, previously combined with Information systems and technology, is
now a separate line •
The Advertising and promotion expenses not reclassified to Sales, distribution and
marketing are now included with Other expenses in a new line named General,
administrative and other Items of Note in the Current Quarter
•
Operating expenses included $6.3 million related to performance fees and carried
interest earned this quarter and were net of $28 million
from
insurance
and
other
recoveries
of
losses and expenses
incurred
in
prior
years |
 17
FRANKLIN RESOURCES, INC.
Operating Results
Unaudited
(in millions, for the three months ended)
Summary of Changes to Noncontrolling Interests Presentation
•
Net income (loss) attributable to noncontrolling interests is now presented
separately for Nonredeemable and Redeemable noncontrolling
interests
to
provide
consistency
between
the
Statement
of
income
and
the
changes
in
Stockholders’
equity
New Accounting Guidance
•
On October 1, 2010, the Company adopted new FASB guidance related to the
consolidation of Variable Interest Entities that resulted in the
consolidation of automobile loan securitization trusts and collateralized loan obligations that were not previously
consolidated
31-Dec-10
30-Sep-10
Dec-10 vs.
Sep-10
30-Jun-10
31-Mar-10
31-Dec-09
Dec-10 vs.
Dec-09
Operating Income
659.2
$
509.0
$
30%
521.6
$
461.1
$
467.0
$
41%
Consolidated sponsored investment products
gains (losses), net
(0.7)
2.4
NM
(14.7)
5.6
15.1
NM
Investment and other income (losses), net
47.0
50.9
(8%)
(7.3)
42.5
33.0
42%
Interest expense
(7.9)
(9.9)
(20%)
(4.8)
(0.9)
(0.8)
888%
Other income (expenses), net
38.4
43.4
(12%)
(26.8)
47.2
47.3
(19%)
Income Before Taxes
697.6
552.4
26%
494.8
508.3
514.3
36%
Taxes on income
207.5
176.5
18%
135.1
149.9
156.8
32%
Net Income
490.1
375.9
30%
359.7
358.4
357.5
37%
Less:
Net
income
(loss)
attributable
to:
(11.9)
0.1
NM
0.2
0.2
0.2
NM
Redeemable
noncontrolling
interests
0.8
2.9
(72%)
(1.0)
1.5
1.7
(53%)
Net Income Attributable to Franklin
Resources, Inc.
501.2
$
372.9
$
34%
360.5
$
356.7
$
355.6
$
41%
Nonredeemable
noncontrolling
interests |
 18
FRANKLIN RESOURCES, INC.
Earnings Per Share
Unaudited
(in millions, except per share data, for the three months ended)
31-Dec-10
30-Sep-10
Dec-10 vs.
Sep-10
30-Jun-10
31-Mar-10
31-Dec-09
Dec-10 vs.
Dec-09
Net income attributable to Franklin
Resources, Inc.
501.2
$
372.9
$
34%
360.5
$
356.7
$
355.6
$
41%
Less: Allocation of earnings to participating
nonvested stock and stock unit awards
2.1
1.4
50%
2.0
2.0
3.3
(36%)
Net Income Available to Common
Stockholders
499.1
$
371.5
$
34%
358.5
$
354.7
$
352.3
$
42%
Average shares outstanding (in thousands)
Basic
223,169
223,864
0%
225,626
227,046
227,892
(2%)
Diluted
224,253
224,958
0%
226,806
228,300
229,251
(2%)
Earnings Per Share
Basic
2.24
$
1.66
$
35%
1.59
$
1.56
$
1.55
$
45%
Diluted
2.23
$
1.65
$
35%
1.58
$
1.55
$
1.54
$
45% |
 19
FRANKLIN RESOURCES, INC.
$5.4
$5.7
$6.6
$6.8
$8.0
$0.8
$0.3
$0.1
$1.0
$2.2
31-Dec-09
31-Mar-10
30-Jun-10
30-Sep-10
31-Dec-10
1.1
1.2
31-Dec-09
31-Mar-10
30-Jun-10
30-Sep-10
31-Dec-10
Cash and Cash Equivalents and Investments
Operating Margin and Capital Management
(in millions, except as noted, as of and for the period ended)
Quarterly Operating Margin
Quarterly Stock Repurchase Activity
38.8%
33.3%
33.9%
32.6%
34.0%
31-Dec-09
31-Mar-10
30-Jun-10
30-Sep-10
31-Dec-10
Cash and Cash Equivalents and Investments vs. Debt
Trailing Twelve Months Payout Ratio
(in billions)
13%
45%
41%
46%
47%
44%
57%
61%
64%
78%
61%
105%
108%
123%
107%
31-Dec-09
31-Mar-10
30-Jun-10
30-Sep-10
31-Dec-10
1.6
1.1
2.1
1.7
1.7
228.2
227.4
225.4
224.0
223.3
31-Dec-09
31-Mar-10
30-Jun-10
30-Sep-10
31-Dec-10
Unaudited
1
Dividend payout is calculated as dividend amount declared divided by net income
attributable to Franklin Resources, Inc. ²Repurchase payout is calculated as stock repurchase amount divided by net income attributable to Franklin
Resources, Inc.
Shares Repurchased
Shares Outstanding
Dividend Payout¹
Repurchase Payout²
Consolidated Variable Interest Entities
Debt |