Attached files
| file | filename |
|---|---|
| 8-K - COVER SHEET - 4TH QTR 2010 EARNING SLIDES - FIRST MERCHANTS CORP | f8kearningsslides01272011.htm |

1
First Merchants Corporation
4th Quarter 2010
Earnings Call
January 27, 2011
4th Quarter 2010
Earnings Call
January 27, 2011

2
Michael C. Rechin
President
and Chief Executive Officer

3
Forward-Looking Statement
The Corporation may make forward-looking statements about its
relative business outlook. These forward-looking statements and all
other statements made during this meeting that do not concern
historical facts are subject to risks and uncertainties that may
materially affect actual results.
Specific forward-looking statements include, but are not limited to,
any indications regarding the financial services industry, the economy
and future growth of the balance sheet or income statement.
Please refer to our press releases, Form 10-Qs and 10-Ks concerning
factors that could cause actual results to differ materially from any
forward-looking statements.

4
4th Quarter 2010 Highlights
§ Fourth quarter earnings of $2.6M, or $.10 per
common share
common share
§ Year-to-date earnings of $11.7M, or $.48 per
common share
common share
§ Sequential improvement in loan quality continues
§ Loan loss reserve ample for projected future losses
at 2.90% of total loans
at 2.90% of total loans
§ Core business profitability solidifying

5
Mark K. Hardwick
Executive Vice President
and Chief Financial Officer

6
2008 2009 2010
1. Investments $ 482 $ 563 $827
2. Loans 3,722 3,278 2,857
3. Allowance (50) (92) (83)
4. CD&I & Goodwill 166 159 154
5. BOLI 93 95 97
6. Other 371 478 318
7. Total Assets $4,784 $4,481 $4,170
($ in Millions)
TOTAL ASSETS

7
Loan Composition (as of 12/31/10)
YTD Yield = 5.66%
Total = $2.9B
LOAN AND CREDIT DETAIL

8
INVESTMENT PORTFOLIO
(as of 12/31/10)
(as of 12/31/10)
§ $827 Million Balance
§ Average duration of 4.7 years
§ Tax equivalent yield of 4.15%
§ No private label MBS exposure
§ Trust Preferred Pools with book balance of
$5.8 million and a market value of $200K
$5.8 million and a market value of $200K
§ Net unrealized gain of the entire portfolio
totals $1.6 million
totals $1.6 million

9
2008 2009 2010
1. Customer Non-Maturity
Deposits $1,858 $2,042 $2,127
2. Customer Time Deposits 1,384 1,220 996
3. Brokered Deposits 477 275 146
4. Borrowings 507 339 277
5. Other Liabilities 51 30 28
6. Hybrid Capital 111 111 142
7. Preferred Stock (CPP) - 112 68
8. Common Equity 396 352 386
9. Total Liabilities and Capital $4,784 $4,481 $4,170
($ in Millions)
TOTAL LIABILITIES AND CAPITAL

10
YTD Cost = 1.42%
43%
23%
20%
10%
Total = $3.3B

11
2008 2009 2010
1. Total Risk-Based
Capital Ratio 10.24% 13.04% 15.72%
2. Tier 1 Risk-Based
Capital Ratio 7.71% 10.32% 12.80%
3. Leverage Ratio 8.16% 8.20% 9.49%
4. TCE/TCA 5.01% 4.54% 5.84%
CAPITAL RATIOS

12
3,463
4,245
3,862
3.87%
3.84%
3.74%
― Net Interest Margin
NET INTEREST MARGIN

13
2008 2009 2010
1. Service Charges on Deposit
Accounts $13.0 $15.1 $13.3
2. Trust Fees 8.0 7.4 7.7
3. Insurance Commission Income 5.8 6.4 6.2
4. Cash Surrender Value of Life Ins (0.3) 1.6 2.1
5. Gains on Sales Mortgage Loans 2.5 6.8 6.8
6. Securities Gains/Losses (2.1) 4.4 1.9
7. Other 9.5 9.5 10.5
8. Total $36.4 $51.2 $48.5
9. Adjusted Non-Interest Income1 $38.5 $46.5 $46.6
1Adjusted for Bond Gains & Losses and one-time mortgage sale
($ in Millions)
NON-INTEREST INCOME

14
NON-INTEREST EXPENSE
2008 2009 2010
1. Salary & Benefits $63.0 $76.3 $73.3
2. Premises & Equipment 14.4 17.9 17.2
3. Core Deposit Intangible 3.2 5.1 4.7
4. Professional Services 1.7 1.3 1.4
5. OREO/Credit-Related Expense 3.7 12.9 14.6
6. FDIC Expense 1.7 10.4 8.1
7. FHLB Prepayment Penalties - 1.9 -
8. Outside Data Processing 4.1 6.2 5.1
9. Marketing 2.3 2.1 2.0
10. Other 14.7 17.5 15.9
11. Total $108.8 $151.6 $142.3
12. Adjusted Non-Interest Expense1 $106.0 $134.7 $127.7
1Adjusted for the FDIC Special Assessment, FHLB Prepayment Penalties & OREO Expense & Credit
Related Professional Services
Related Professional Services
($ in Millions)

15
2008 2009 2010
1. Net Interest Income-FTE $133.1 $159.1 $149.4
2. Non Interest Income1 38.5 46.5 46.6
3. Non Interest Expense2 (106.0) (134.7) (127.7)
4. Pre-Tax Pre-Provision Earnings $ 65.6 $ 70.9 $68.3
5. Provision (28.2) (122.2) (46.5)
6. Adjustments (5.0) (12.1) (12.7)
7. Taxes - FTE (11.8) 22.7 (2.9)
8. Gain on Exchange of Preferred
Stock for Trust Preferred Debt - - 10.1
9. CPP Dividend - (5.0) (4.6)
10. Net Income Avail. for Common
Stockholders $20.6 ($45.7) $11.7
11. EPS $1.14 ($2.17) $0.48
1Adjusted for Bond Gains & Losses and one-time mortgage sale
2Adjusted for the FDIC Special Assessment, FHLB Prepayment Penalties & OREO
Expense & Credit-Related Professional Services
($ in Millions except in per share data)
EARNINGS

16
John J. Martin
Senior Vice President
and Chief Credit Officer

17
4th Quarter Highlights
PORTFOLIO OVERVIEW
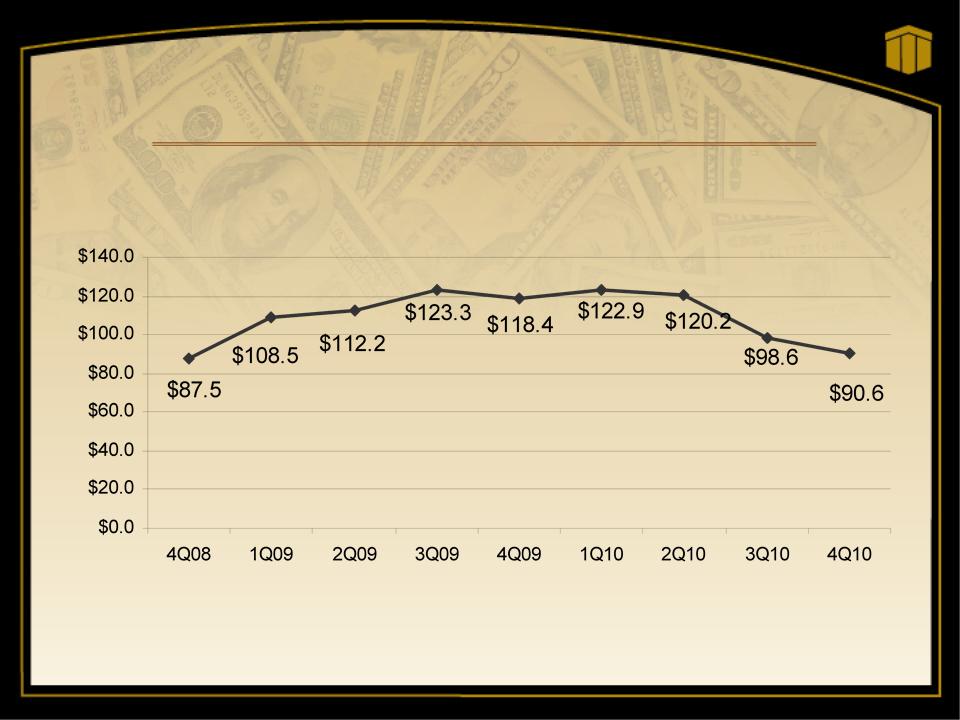
• Non-accrual loans declined 8% from $98.6 at 09/30/10 to $90.6 million at
12/31/10.
12/31/10.
• Allowance for Loan and Lease Losses is 2.90% of total loans at 12/31/10
and up from 2.86% at 09/30/10. Allowance coverage to Non-Accrual Loans
increased to 92%.
and up from 2.86% at 09/30/10. Allowance coverage to Non-Accrual Loans
increased to 92%.
• 30-89 day delinquent loans is up to $30 million at 12/31/10 from $23.8
million at 9/30/10.
million at 9/30/10.
• 90+ day delinquent loans decreased to $1.3 million from $5.3 million.
• Restructured loans increased from $5.3 million to $7.1 million.
• Total non-performing assets plus 90+ day delinquent loans decreased to
$120.0 million from $130.8 million at 09/30/10, continuing the decline from
peak of $156.1 million at 9/30/09.
$120.0 million from $130.8 million at 09/30/10, continuing the decline from
peak of $156.1 million at 9/30/09.
18
($ in millions)
NON-ACCRUAL LOANS

19
NON-ACCRUAL TREND

20
($ in millions)
Industry:
§ Single Family Housing Construction
§ Residential Land Development/Home Construction
§ Retail Center
§ Retail Center and Apartment Building
§ CRE Investments
§ Personal Residence
Total New Non-Accrual Greater than $500,000
$4.195
3.648
2.911
2.313
2.037
1.092
$14.527
LARGEST NEW NON-ACCRUAL LOANS

21
($ in millions)
OTHER REAL ESTATE OWNED

22
90+ Day Delinquency
30+ Day Delinquency
(as a % of period end total loans)
(as a % of period end total loans)
LOAN DELINQUENCY TRENDS

23
($ in millions)
Q2 Q3 Q4
Beginning Period 3/31/2010 6/30/2010 9/30/2010
Beginning Period 3/31/2010 6/30/2010 9/30/2010
Beginning Balance NPAs & 90+ Days Past due $144.6 $146.5 $130.8
Non-Accrual
Add: New NPLs $ 27.3 $ 15.5 $ 27.4
Less: To Accrual/Payoff/Restructured ( 8.3) ( 18.6) ( 14.5)
Less: To OREO ( 4.0) ( 6.7) ( 7.0)
Less: Charge-offs (includes write-downs for
transfer to OREO) (17.7) (11.8) (13.9)
Δ Non-Accrual Loans ($ 2.7) ($ 21.6) ($ 8.0)
Other Real Estate Owned (OREO)
Add: New OREO Properties $ 4.0 $ 6.6 $ 7.2
Less; OREO Sold ( 0.2) ( 3.8) ( 1.1)
Less: OREO Losses (write-downs) (1.9) ( 1.4) (6.7)
Δ OREO $1.9 $ 1.4 ($ .60)
Δ 90 Days Past Due $ 1.9 $ 0.8 ($ 4.0)
ΔRestructured/Renegotiated Loans $ 0.8 $ 3.7 $ 1.8
Total NPA Change $ 1.9 ($15.7) ($ 10.8)
Ending Balance NPAs & 90+ Days Past Due $146.5 $130.8 $120.0
Ending Period 6/30/2010 9/30/2010 12/31/2010
NON-PERFORMING ASSET RECONCILIATION

24
CHARGE-OFF TREND

25
CREDIT COSTS OVER TIME

26
ALLOWANCE COVERAGE TO NON-ACCRUAL LOANS

27
Michael C. Rechin
President
and Chief Executive Officer

28
Overview of Operating Strategy
and Tactics
“Strengthen and Grow”
and Tactics
“Strengthen and Grow”
§ Capitalize on our newly formed Retail Line of Business
Structure to streamline and solidify our brand position as a
community bank competing primarily in consumer, small
business, and middle market
Structure to streamline and solidify our brand position as a
community bank competing primarily in consumer, small
business, and middle market
§ Continue to improve asset quality, reduce credit costs, and
maximize resolutions
maximize resolutions
§ Preserve margin while intensifying revenue activity using
market coverage tactics
market coverage tactics
§ Implement systems to standardize and accelerate small
business opportunities
business opportunities

29
Contact Information
First Merchants Corporation common stock is
traded on the NASDAQ Global Select Market
under the symbol FRME.
traded on the NASDAQ Global Select Market
under the symbol FRME.
Additional information can be found at
www.firstmerchants.com
Investor inquiries:
David L. Ortega
Investor Relations
Telephone: 765.378.8937
dortega@firstmerchants.com