Attached files
| file | filename |
|---|---|
| 8-K - FORM 8-K - CASCADE FINANCIAL CORP | c8k-012511.htm |
 |
|
|
Investor Contacts:
|
|
|
Carol K. Nelson, CEO
Debra L. Johnson, CFO
Cascade Bank
425.339.5500
www.cascadebank.com
|
NEWS RELEASE
|
Cascade Financial Announces Fourth Quarter Results; Credit Quality Metrics Strengthen,
Net Interest Margin Improves
Everett, WA – January 25, 2011 – Cascade Financial Corporation (NASDAQ: CASB), the parent company of Cascade Bank, today reported financial results for the fourth quarter ended December 31, 2010, which included improvements in overall credit quality metrics and an increase in net interest margin.
“Improving asset quality remains a top priority for Cascade and we made steady progress on this goal in 2010. Nonperforming assets peaked in the third quarter of 2009 and have declined in every quarter since that time including a 20.2% quarterly reduction in the fourth quarter of 2010,” stated Carol K. Nelson, President and CEO. “We’ve also committed significant efforts to improve our funding mix, which included the restructuring transactions announced in October. This, along with efforts to reduce our cost of deposits, resulted in a net interest margin of 2.52% for the fourth quarter, an improvement of 26 basis points on a sequential quarter basis.”
Cascade’s net operating loss totaled $8.0 million for the fourth quarter ended December 31, 2010, compared to a net operating loss of $6.0 million in the preceding quarter. The provision for loan losses for the quarter was $5.5 million, a 31.3% decrease on a sequential quarter basis. Nearly offsetting the $2.5 million reduction in the provision for the fourth quarter was an increase in REO expenses, writedowns and losses of $2.3 million. In addition, a fair value gain of $1.8 million was recorded and there was $1.0 million in increased gains on sale of securities as compared to the third quarter. These increases were more than offset by the $4.8 million prepayment penalty related to the balance sheet restructuring transactions previously announced. Including accruals for preferred stock dividends and accretion of issuance discount on preferred stock issued to the U.S. Treasury, Cascade reported a fourth quarter net loss attributable to common stockholders of $8.6 million, or $0.70 per diluted common share, compared to a net loss of $6.6 million, or $0.54 per diluted common share, in the preceding quarter and net income of $521,000, or $0.04 per diluted common share, for the fourth quarter a year ago. Dividend accruals on preferred stock issued to the U.S. Treasury under the Capital Purchase Program for the fourth quarter of 2010 totaled $515,000, and the accretion of the issuance discount on preferred stock for the quarter was $114,000.
On October 21st, Cascade announced that it had successfully completed a series of balance sheet restructuring transactions which improved Cascade’s financial position. The transactions included the restructuring of Cascade’s securities portfolio, prepayment and/or modification of Cascade’s Federal Home Loan Bank (FHLB) advances, and the purchase of interest rate caps designed to protect both the net interest margin and stockholders’ equity from potential future rising interest rates.
Significant items for the fourth quarter of 2010 include:
|
·
|
Provision for loan losses was $5.5 million; a 31.3% decrease on a sequential quarter basis;
|
|
·
|
Net charge-offs were $5.9 million; a 22.9% decrease on a sequential quarter basis;
|
|
·
|
Nonperforming assets to total assets declined to 5.51% from 6.36% on a sequential quarter basis;
|
|
·
|
Total allowance for loan losses increased to 2.62% of total loans, up from 2.51% three months earlier and 2.16% a year ago;
|
|
·
|
As part of the balance sheet restructuring, $4.0 million in gains on sale of securities partially offset FHLB prepayment penalty expense of $4.8 million;
|
|
·
|
Loan portfolio mix improved with a 37.3% reduction in real estate construction loans compared to three months earlier, and a 68.2% reduction from a year ago. Land acquisition and development/land loans are a component of this portfolio and are down 21.0% from three months earlier, and down 63.0% from one year ago;
|
|
·
|
A reduction in average interest rates paid on interest checking and CDs combined to reduce the cost of deposits by 6 basis points compared to the preceding quarter;
|
|
·
|
Net interest margin was 2.52%, a 26 basis point improvement on a sequential quarter basis;
|
(more)
Cascade Financial – 4Q10 Results
January 25, 2011
Page 2
|
·
|
Total risk-based capital ratio was 10.3%.
|
For the year, net losses were $70.3 million and losses attributable to common stockholders were $72.8 million. Losses per diluted common share were $5.95, compared to a loss of $25.8 million, or $2.13 per diluted common share in 2009. The loan loss provision for all of 2010 was $56.5 million versus $44.2 million in 2009.
Asset Quality
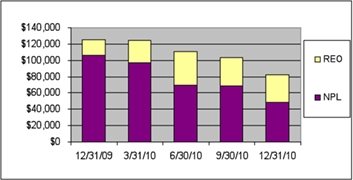
“Asset quality metrics improved as a result of lower levels of nonperforming loans, liquidation of real estate owned (REO) and loan charge-offs” said Rob Disotell, EVP and Chief Credit Officer. Nonperforming loans declined during the quarter to $48.1 million, or 4.82% of total loans at December 31, 2010, compared to $68.4 million or 6.47% of total loans three months earlier. REO decreased to $34.4 million at December 31, 2010, compared to $35.0 million three months earlier. Nonperforming assets were $82.5 million or 5.51% of total assets at December 31, 2010, compared to $103.3 million or 6.36% at the end of the preceding quarter, and $124.9 million or 7.33% a year ago.
The following chart shows declining levels of nonperforming assets for each of the quarters from December 31, 2009 through December 31, 2010 ($ in 000’s):
The fourth quarter provision for loan losses was $5.5 million, with net charge-offs of $5.9 million. The provision for loan losses was $8.0 million for both the preceding quarter and the fourth quarter a year ago. The total allowance for loan losses now stands at $26.2 million, or 2.62% of total loans at quarter end, compared to $26.5 million, or 2.51% of total loans at September 30, 2010, and $26.0 million, or 2.16% of total loans a year ago.
The following table shows nonperforming loans versus total loans in each category:
|
Balance at
|
Nonperforming
|
NPL as a %
|
||||||||||
|
LOAN PORTFOLIO ($ in 000's)
|
12/31/2010
|
Loans (NPL)
|
of Loans
|
|||||||||
|
Business
|
$ | 400,047 | $ | 4,347 | 1.1 | % | ||||||
|
R/E construction
|
||||||||||||
|
Spec construction
|
25,303 | 9,705 | 38.4 | % | ||||||||
|
Land acquisition and development/land
|
54,142 | 2,848 | 5.3 | % | ||||||||
|
Commercial R/E construction
|
2,333 | - | 0.0 | % | ||||||||
|
Total R/E construction
|
81,778 | 12,553 | 15.4 | % | ||||||||
|
Commercial R/E
|
201,885 | 28,352 | 14.0 | % | ||||||||
|
Multifamily
|
89,350 | - | 0.0 | % | ||||||||
|
Home equity/consumer
|
29,964 | 1,048 | 3.5 | % | ||||||||
|
Residential
|
194,677 | 1,798 | 0.9 | % | ||||||||
|
Total loans
|
$ | 997,701 | $ | 48,098 | 4.8 | % | ||||||
Nonperforming loans totaled $48.1 million at December 31, 2010 and continued to be centered in real estate construction, which were $12.6 million and commercial real estate, which were $28.4 million. The nonperforming real estate construction category is comprised of 7 borrower relationships, the two largest of which totaled $8.3 million and $3.3 million. The larger relationship is comprised of a loan for 70
(more)
Cascade Financial – 4Q10 Results
January 25, 2011
Page 3
completed condominiums in Tacoma, Washington, and the $3.3 million relationship includes loans for 19 finished lots and 6 completed spec homes in Lynnwood, Washington. Three borrower relationships/loans comprise the nonperforming commercial real estate loans, which include one office building and one retail center in Lacey, Washington, and one office building in Ballard, Washington. The office building in Lacey, Washington was transferred to REO after year-end.
“During the fourth quarter of 2010, a total of $7.4 million in loans were placed on nonaccrual status, $9.5 million were converted to REO status, $12.2 million were paid off and $5.9 million were charged-off in connection with updated real estate appraisals or evaluations during the period,” said Disotell. “The pace of loans moving to nonaccrual status has slowed steadily over the past three quarters.”
The following table reflects loans placed on nonaccrual status for each of the quarters in 2010:
|
NONPERFORMING LOANS ($ in 000's)
|
4Q 2010 | 3Q 2010 | 2Q 2010 | 1Q 2010 | ||||||||||||
|
Additions
|
$ | 7,379 | $ | 16,676 | $ | 24,727 | $ | 39,301 |
Additions of $7.4 million to nonperforming loans in the fourth quarter were centered in:
|
·
|
$4.2 million in business loans;
|
|
·
|
$1.2 million in land acquisition and development/land loans;
|
|
·
|
$687,000 in home equity/consumer loans;
|
|
·
|
$877,000 in residential loans.
|
There were $12.2 million in paydowns on nonaccruing loans during the quarter. These loans were centered in:
|
·
|
$3.6 million in business loans;
|
|
·
|
$3.9 million in spec construction loans;
|
|
·
|
$2.4 million in land acquisition & development/land;
|
|
·
|
$2.0 million in commercial R/E loans.
|
The following table shows the migration of nonperforming loans through the portfolio in each category (12/31/10 compared to 9/30/10):
|
Additions
|
Paydowns
|
Charge-offs
|
||||||||||||||||||||||
|
Balance at
|
during
|
during
|
during
|
Transfers
|
Balance at
|
|||||||||||||||||||
|
NONPERFORMING LOANS ($ in 000's)
|
12/31/10
|
quarter
|
quarter
|
quarter (1)
|
to REO
|
9/30/10
|
||||||||||||||||||
|
Business
|
$ | 4,347 | $ | 4,229 | $ | (3,591 | ) | $ | (1,398 | ) | $ | (1,494 | ) | $ | 6,601 | |||||||||
|
R/E construction
|
||||||||||||||||||||||||
|
Spec construction
|
9,705 | 383 | (3,948 | ) | (553 | ) | (2,292 | ) | 16,115 | |||||||||||||||
|
Land acquisition and development/land
|
2,848 | 1,159 | (2,402 | ) | (3,523 | ) | (5,709 | ) | 13,323 | |||||||||||||||
|
Total R/E construction
|
12,553 | 1,542 | (6,350 | ) | (4,076 | ) | (8,001 | ) | 29,438 | |||||||||||||||
|
Commercial R/E
|
28,352 | 71 | (1,962 | ) | (33 | ) | - | 30,276 | ||||||||||||||||
|
Home equity/consumer
|
1,048 | 687 | (1 | ) | (87 | ) | - | 449 | ||||||||||||||||
|
Residential
|
1,798 | 877 | (341 | ) | (328 | ) | - | 1,590 | ||||||||||||||||
|
Total
|
$ | 48,098 | $ | 7,406 | $ | (12,245 | ) | $ | (5,922 | ) | $ | (9,495 | ) | $ | 68,354 | |||||||||
|
(1) Excludes $61 related to overdrawn checking accounts and recoveries of $124.
|
||||||||||||||||||||||||
(more)
Cascade Financial – 4Q10 Results
January 25, 2011
Page 4
The following table shows the change in REO during the quarter:
|
Additions
|
||||||||||||||||||||||||
|
Balance at
|
during
|
Capitalized
|
Paydowns/
|
Writedowns/
|
Balance at
|
|||||||||||||||||||
|
REO ($ in 000's)
|
12/31/10
|
quarter (1)
|
Costs
|
Sales
|
Loss/Gain
|
9/30/10
|
||||||||||||||||||
|
R/E construction
|
||||||||||||||||||||||||
|
Residential construction
|
$ | 239 | $ | 291 | $ | 157 | $ | (377 | ) | $ | (47 | ) | $ | 215 | ||||||||||
|
Land acquisition & development/land
|
23,706 | 5,623 | 262 | (4,681 | ) | (4,481 | ) | 26,983 | ||||||||||||||||
|
Condominium construction
|
- | (2,027 | ) | 31 | - | - | 1,996 | |||||||||||||||||
|
Total R/E construction
|
23,945 | 3,887 | 450 | (5,058 | ) | (4,528 | ) | 29,194 | ||||||||||||||||
|
Commercial R/E
|
4,974 | 255 | 14 | (573 | ) | 13 | 5,265 | |||||||||||||||||
|
Multifamily
|
1,718 | 2,027 | - | (218 | ) | (91 | ) | - | ||||||||||||||||
|
Residential
|
3,775 | 3,613 | 23 | (260 | ) | (131 | ) | 530 | ||||||||||||||||
|
Total
|
$ | 34,412 | $ | 9,782 | $ | 487 | $ | (6,109 | ) | $ | (4,737 | ) | $ | 34,989 | ||||||||||
|
(1) Includes a $287 addition to REO related to the payoff of a first lien, and $2.0 million transferred from a completed condominium construction project to multifamily.
|
||||||||||||||||||||||||
“We continue to convert nonperforming loans to REO as quickly as possible,” said Disotell. “By taking control of the projects through the foreclosure process, we gain the ability to control the property so we can quickly liquidate these assets.” Net writedowns and losses of $4.7 million for REO were largely attributable to land acquisition and development/land, and resulted primarily from updated evaluations and appraisals of existing REO properties and secondarily to additional losses recorded upon sale of properties.
Loans delinquent 31-89 days and still accruing totaled $2.9 million, or 0.29% of total loans at December 31, 2010, compared to $2.4 million, or 0.22% of total loans at September 30, 2010, and $2.6 million, or 0.22% of total loans at December 31, 2009. Cascade had no loans that were 90 days or more past due and still accruing interest at December 31, 2010.
The following chart shows provision for loan loss expense and net charge-offs on a quarter by quarter basis for 2010 ($ in 000’s):

Loan Portfolio
Total loans decreased from a year ago as Cascade continues to aggressively reduce its real estate construction loan exposure. At December 31, 2010, real estate construction loans were 8.2% of total loans, compared to 21.4% at December 31, 2009. Total loans decreased 17.0%, or $205.0 million, on a year-over-year basis to $997.7 million at December 31, 2010.
(more)
Cascade Financial – 4Q10 Results
January 25, 2011
Page 5
The following table shows the changes in the loan portfolio in each category (12/31/10 compared to 9/30/10 and 12/31/09):
|
LOAN PORTFOLIO ($ in 000's)
|
December 31, 2010
|
September 30, 2010
|
December 31, 2009
|
One Year
Change |
||||||||||||
|
Business
|
$ | 400,047 | $ | 417,273 | $ | 469,196 | -14.7 | % | ||||||||
|
R/E construction
|
||||||||||||||||
|
Spec construction
|
25,303 | 38,020 | 59,360 | -57.4 | % | |||||||||||
|
Land acquisition and development/land
|
54,142 | 68,498 | 146,164 | -63.0 | % | |||||||||||
|
Multifamily/custom construction
|
- | 4,500 | 18,923 | -100.0 | % | |||||||||||
|
Commercial R/E construction
|
2,333 | 19,509 | 32,470 | -92.8 | % | |||||||||||
|
Total R/E construction
|
81,778 | 130,527 | 256,917 | -68.2 | % | |||||||||||
|
Commercial R/E
|
201,885 | 187,564 | 183,286 | 10.1 | % | |||||||||||
|
Multifamily
|
89,350 | 93,246 | 82,418 | 8.4 | % | |||||||||||
|
Home equity/consumer
|
29,964 | 30,329 | 31,738 | -5.6 | % | |||||||||||
|
Residential
|
194,677 | 197,400 | 179,133 | 8.7 | % | |||||||||||
|
Total loans
|
$ | 997,701 | $ | 1,056,339 | $ | 1,202,688 | -17.0 | % | ||||||||
Business loans decreased 14.7% from the prior year to $400.0 million. Total real estate construction loans outstanding decreased 68.2% to $81.8 million at December 31, 2010, compared to $256.9 million a year ago. Within this category, spec construction declined 57.4% to $25.3 million and land acquisition & development/land decreased 63.0% to $54.1 million at December 31, 2010 compared to one year ago. Commercial real estate loans increased 10.1% from the prior year to $201.9 million. Multifamily loans increased 8.4% from the prior year to $89.4 million. Home equity and consumer loans decreased 5.6% to $30.0 million, while residential loans grew 8.7% to $194.7 million, compared to a year ago.
Further details on changes during the fourth quarter are as follows:
|
Balance at
|
Additions/
|
Payments/
|
Reclassifi-
|
Transfers
|
Balance at
|
|||||||||||||||||||||||
|
LOANS ($ in 000's)
|
12/31/2010
|
Advances
|
Payoffs
|
cations (1)
|
Charge-offs (2)
|
to REO
|
09/30/2010
|
|||||||||||||||||||||
|
Business
|
$ | 400,047 | $ | 47,733 | $ | (62,067 | ) | $ | - | $ | (1,398 | ) | $ | (1,494 | ) | $ | 417,273 | |||||||||||
|
R/E construction
|
||||||||||||||||||||||||||||
|
Spec construction
|
25,303 | 2,601 | (5,614 | ) | (6,859 | ) | (553 | ) | (2,292 | ) | 38,020 | |||||||||||||||||
|
Land acquisition and development/land
|
54,142 | 2,292 | (7,416 | ) | - | (3,523 | ) | (5,709 | ) | 68,498 | ||||||||||||||||||
|
Multifamily/custom construction
|
- | - | - | (4,500 | ) | - | - | 4,500 | ||||||||||||||||||||
|
Commercial R/E construction
|
2,333 | - | - | (17,176 | ) | - | - | 19,509 | ||||||||||||||||||||
|
Total R/E construction
|
81,778 | 4,893 | (13,030 | ) | (28,535 | ) | (4,076 | ) | (8,001 | ) | 130,527 | |||||||||||||||||
|
Commercial R/E
|
201,885 | 72 | (2,894 | ) | 17,176 | (33 | ) | - | 187,564 | |||||||||||||||||||
|
Multifamily
|
89,350 | 64 | (14,578 | ) | 10,618 | - | - | 93,246 | ||||||||||||||||||||
|
Home equity/consumer
|
29,964 | 1,160 | (1,438 | ) | - | (87 | ) | - | 30,329 | |||||||||||||||||||
|
Residential
|
194,677 | 2,279 | (5,415 | ) | 741 | (328 | ) | - | 197,400 | |||||||||||||||||||
|
Total loans
|
997,701 | 56,201 | (99,422 | ) | - | (5,922 | ) | (9,495 | ) | 1,056,339 | ||||||||||||||||||
|
Deferred loan fees
|
(3,934 | ) | 196 | - | - | - | - | (4,130 | ) | |||||||||||||||||||
|
Allowance for loan losses
|
(26,106 | ) | (5,500 | ) | - | (9 | ) | 5,859 | - | (26,456 | ) | |||||||||||||||||
|
Loans, net
|
$ | 967,661 | $ | 50,897 | $ | (99,422 | ) | $ | (9 | ) | $ | (63 | ) | $ | (9,495 | ) | $ | 1,025,753 | ||||||||||
|
(1) Includes $9 related to the change in off-balance sheet allowance for loan losses.
|
||||||||||||||||||||||||||||
|
(2) Excludes $61 related to overdrawn checking accounts and recoveries of $124.
|
||||||||||||||||||||||||||||
Investment Portfolio and Liquidity
The investment portfolio increased $24.5 million year-over-year, and increased $18.5 million from the preceding quarter, to $300.4 million. Most of the quarterly increase was due to the increase in securities held-to-maturity. Interest-earning deposits, including deposits at the Federal Reserve Bank, were $127.5 million at December 31, 2010, down considerably from $219.3 million the preceding quarter and $141.6 million a year earlier as Cascade reduced its excess liquidity.
(more)
Cascade Financial – 4Q10 Results
January 25, 2011
Page 6
“During the fourth quarter we successfully concluded a series of balance sheet restructuring transactions which we started in the third quarter, as part of our overall business plan to strengthen our financial condition going forward,” said Debra L. Johnson, Chief Financial Officer. “In early October, we used low-yielding interest-earning deposits at the Federal Reserve Bank to prepay $80.0 million in FHLB advances, which carried a cost of 3.75%. In addition, we restructured $159.0 million of long-maturity FHLB “option” advances, callable quarterly as rates rise, into floating rate, option free borrowings, reducing the current average rate on the advances by 1.38%. Along with the restructured advances, we purchased interest rate caps totaling $159.0 million in notional amount which are designed to protect both net interest income and stockholders’ equity from potential future rising interest rates. As part of this strategy, we sold available-for-sale securities totaling $248.6 million for a gain of $5.1 million which offset the prepayment penalties of $4.8 million from the FHLB advances. We recorded approximately $1.1 million of the securities gains during the third quarter of 2010 and approximately $4.0 million of the securities gains during the fourth quarter of 2010. We reinvested substantially all of the proceeds from the securities sale into new securities with an average yield of 2.4%. These transactions helped us to improve our net interest margin and capital position.”
Retail Deposit Growth
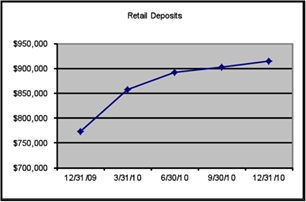
“We have repositioned our deposit portfolio and our deposit strategy is focused on the growth of retail deposits while reducing reliance on brokered and other non-core deposits,” said Nelson. “Retail deposits grew $12.0 million for the quarter and $140.9 million for the year, offset by planned runoff in public, brokered and other non-core deposits. Retail deposits totaled $914.5 million at December 31, 2010 compared to $902.5 million at September 30, 2010 and $773.6 million at December 31, 2009. ”
The following chart shows the growth trend in retail deposits for each of the quarters from December 31, 2009 through December 31, 2010 ($ in 000’s).
Total Deposits
Total deposits were $1.11 billion at December 31, 2010 compared to $1.14 billion a year ago. Included in total deposits at year-end were $914.5 million in retail deposits, $35.5 million in public deposits, $105.4 million in brokered deposits and $52.2 million in other non-core deposits. Personal checking balances were down $20.7 million for the quarter and $57.0 million for the year. The decline was due to successful cross sell efforts, by moving Main Street checking balances into lower interest rate savings and MMDA accounts. Business checking balances were down $50.4 million on a year-over-year basis due to a planned reduction in public funds checking accounts that require 100% collateralization. Savings and money market balances increased $43.8 million, or 32.9% on a year-over-year basis and CDs increased $31.3 million, or 5.6% on a year-over-year basis.
(more)
Cascade Financial – 4Q10 Results
January 25, 2011
Page 7
The following table shows deposits in each category (12/31/10 compared to 9/30/10 and 12/31/09):
|
DEPOSITS ($ in 000's)
|
December 31, 2010
|
September 30, 2010
|
December 31, 2009
|
One Year
Change |
||||||||||||
|
Personal checking accounts
|
$ | 237,263 | $ | 257,928 | $ | 294,238 | -19.4 | % | ||||||||
|
Business checking accounts
|
100,303 | 109,198 | 150,684 | -33.4 | % | |||||||||||
|
Total checking accounts
|
337,566 | 367,126 | 444,922 | -24.1 | % | |||||||||||
|
Savings and MMDA
|
176,945 | 144,298 | 133,130 | 32.9 | % | |||||||||||
|
CDs
|
593,043 | 623,843 | 561,722 | 5.6 | % | |||||||||||
|
Total deposits
|
$ | 1,107,554 | $ | 1,135,267 | $ | 1,139,774 | -2.8 | % | ||||||||
Capital
Total stockholders’ equity was $58.5 million as of December 31, 2010, compared to $75.8 million at September 30, 2010. Accumulated other comprehensive loss was $5.1 million at December 31, 2010, compared to accumulated other comprehensive income of $3.8 million at September 30, 2010. Accumulated other comprehensive gain at September 30, 2010 related to the unrealized gain on available-for-sale securities, which were sold and replaced in the fourth quarter of 2010 as part of the balance sheet restructure transactions. At December 31, 2010, accumulated other comprehensive loss of $5.1 million was related to an unrealized loss on available-for-sale securities that was partially offset by an unrealized gain on interest rate caps, due to the increase in interest rates in the fourth quarter.
Book value was $1.71 per common share at year-end, and tangible book value was $1.69 per common share. Cascade had a total risk-based capital ratio of 10.26% and a Tier 1 capital ratio of 5.54% as of December 31, 2010.
Operating Results
Net interest income for the fourth quarter was down 16.0% to $8.8 million compared to $10.4 million for the fourth quarter of 2009, due primarily to a decline in the loan portfolio and increased on-balance sheet liquidity.
Total other income was $7.8 million for the quarter, compared to $7.6 million for the fourth quarter a year ago. The gain on the sale of securities was $4.0 million during the fourth quarter, compared to $649,000 in the fourth quarter a year ago. Fair value gains for the quarter were $1.8 million compared to $5.0 million for the fourth quarter a year ago.
Total other expenses were $18.4 million in the fourth quarter of 2010, compared to $8.6 million in the fourth quarter of 2009. The increase was primarily due to $4.8 million in FHLB prepayment penalties associated with the balance sheet restructuring transactions, a $3.8 million increase in REO expenses, write-downs and losses, as well as a $539,000 increase in FDIC insurance premiums and a $323,000 increase in business insurance compared to the fourth quarter a year ago. Compensation expense decreased slightly during the fourth quarter compared to the fourth quarter a year ago.
For the year, net interest income was $36.4 million, compared to $43.3 million in 2009. Other income was $18.7 million for the year compared to $16.6 million in 2009. For the year, total other expenses (excluding the second quarter 2010 goodwill impairment charge) increased to $52.2 million compared to $35.1 million (excluding the second quarter 2009 goodwill impairment charge) in 2009. The increase was largely due to a $9.2 million increase in REO expenses, write-downs and losses, $4.8 million in FHLB prepayment penalties associated with the balance sheet restructuring transactions, a $1.4 million increase in FDIC insurance premiums, a $1.3 million increase in business insurance premiums, and a $630,000 increase in legal expenses. For the year, total compensation and employee benefits were up $359,000, or 2.6%. Within this category, employee salary expense was down $340,000, or 2.8%, and director’s compensation expense was down $77,000, or 15.1%. The reduction in employee salary expense was related to an 8.9% reduction in the number of total employees during the year. These reductions were more than offset by a decline in deferred compensation costs, which reduces total compensation expense, due to lower loan originations in 2010 as compared to 2009. The second quarter 2010 and 2009 goodwill impairment charges were $12.9 million and $11.7 million, respectively.
Net Interest Margin
Cascade’s net interest margin was 2.52% for the fourth quarter of 2010, compared to 2.26% in the immediate prior quarter and 2.79% for the fourth quarter a year ago. The yield on earning assets increased by 5 basis points compared to the preceding quarter, while the cost of interest-bearing liabilities declined by 21 basis points. The increase in the yield on earning assets compared to the prior quarter was due to lower cash balances.
“The balance sheet restructuring described above has already had a positive impact on our net interest margin by utilizing low-yielding cash balances at the Federal Reserve Bank to prepay higher cost FHLB advances and restructuring the remaining advances to further reduce funding costs,” said Johnson.
(more)
Cascade Financial – 4Q10 Results
January 25, 2011
Page 8
The following table depicts Cascade’s yield on earning assets, its cost of funds on paying liabilities and the resulting spread and margin:
|
4Q10
|
3Q10
|
2Q10
|
1Q10
|
4Q09
|
3Q09
|
2Q09
|
1Q09
|
4Q08
|
|
|
Asset yield
|
4.67%
|
4.62%
|
4.89%
|
5.13%
|
5.35%
|
5.60%
|
5.63%
|
5.83%
|
6.07%
|
|
Liability cost
|
2.23%
|
2.44%
|
2.46%
|
2.60%
|
2.65%
|
2.63%
|
2.74%
|
3.02%
|
3.33%
|
|
Spread
|
2.44%
|
2.18%
|
2.43%
|
2.53%
|
2.70%
|
2.97%
|
2.89%
|
2.81%
|
2.74%
|
|
Margin
|
2.52%
|
2.26%
|
2.49%
|
2.60%
|
2.79%
|
3.03%
|
3.01%
|
3.03%
|
3.01%
|
Regulatory Matters
Cascade is working diligently to comply with all regulatory orders, has engaged investment banking advisors and is actively exploring a variety of means to raise additional capital and improve its financial position. Cascade’s ability to raise additional capital will depend on conditions in the capital markets, which are outside its control, and on Cascade’s financial performance.
Conference Call
Cascade’s management team will host an analyst call on Wednesday, January 26, 2011, at 11:00 a.m. PST (2:00 p.m. EST) to discuss fourth quarter results. Interested investors may listen to the call live or via replay at www.cascadebank.com under shareholder information. Investment professionals are invited to dial (480) 629-9722 to participate in the live call. A replay will be available for one week at (303) 590-3030, using access code 4395593.
About Cascade Financial
Established in 1916, Cascade Bank, the only operating subsidiary of Cascade Financial Corporation, is a state chartered commercial bank headquartered in Everett, Washington. Cascade Bank maintains an “Outstanding” CRA rating and has proudly served the Puget Sound region for over 90 years. Cascade Bank operates 22 full service branches in Everett, Lynnwood, Marysville, Mukilteo, Shoreline, Smokey Point, Issaquah, Clearview, Woodinville, Lake Stevens, Bellevue, Snohomish, North Bend, Burlington and Edmonds.
In November 2010, Cascade Bank was named Favorite Snohomish County Company (with fewer than 250 employees) in NW.Jobs.com’s People’s Picks campaign for the second year in a row. In April 2010, Cascade was ranked #8 on the Puget Sound Business Journal’s list of largest bank companies headquartered in the Puget Sound area.
Non-GAAP Financial Measures
This news release contains certain non-GAAP financial measures in addition to results presented in accordance with Generally Accepted Accounting Principles (GAAP). These measures include tangible book value per share, efficiency ratio and tangible capital/assets ratio. These measures should not be construed as a substitute for GAAP measures; they should be read and used in conjunction with Cascade’s GAAP financial information. A reconciliation of the included non-GAAP financial measures to GAAP measures is included elsewhere in this release.
Forward-Looking Statements
This press release contains certain “forward-looking statements” within the meaning of the Private Securities Litigation Reform Act of 1995 (“PSLRA”). This statement is included for the express purpose of availing Cascade of the protections of the safe harbor provisions of the PSLRA. Readers should not place undue reliance on forward-looking statements, which reflect management’s views only as of the date hereof. The words “should,” “anticipate,” “expect,” “will,” “believe,” and words of similar meaning are intended, in part, to help identify forward-looking statements. Additional forward-looking statements include statements about the benefits of the balance sheet restructurings to improve Cascade’s financial condition, reduce its risk profile and improve its shareholder value proposition, as well as statements about the prepayment and restructure of the FHLB advances anticipated to have a positive impact on Cascade’s net interest margin. Future events are difficult to predict, and the expectations described above are subject to risks and uncertainties that may cause actual results to differ materially. Should one or more of these risks or uncertainties materialize, or should underlying assumptions prove incorrect, actual results may vary materially from those anticipated, estimated or expected. In addition to discussions about risks and uncertainties set forth from time to time in Cascade’s filings with the Securities and Exchange Commission, factors that may cause actual results to differ materially from those contemplated in these forward-looking statements include, among others: (1) Cascade’s ability to raise additional capital to satisfy the consent order on acceptable terms, if at all;(2) the effect of the consent order on Cascade’s operations and potential future supervisory action against Cascade; (3) failure to maintain adequate levels of capital and liquidity to support Cascade’s operations; (4) the extent and duration of continued
(more)
Cascade Financial – 4Q10 Results
January 25, 2011
Page 9
economic and market disruptions and governmental actions to address these disruptions; (5) the risk of new and changing legislation, regulation and/or regulatory actions; (6) local and national general and economic conditions; (7) changes in interest rates; (8) reductions in loan demand or deposit levels or failure to attract loans and deposits; (9) changes in loan collectability, defaults and charge-off rates; and (10) adequacy of Cascade’s allowance for loan losses, credit quality and the effect of credit quality on its provision for credit losses and allowance for loan losses.
Cascade undertakes no obligation to publicly revise or update these forward-looking statements to reflect events or circumstances that arise after the date of this release. Readers should carefully review the risk factors described in this and other documents Cascade files from time to time with the Securities and Exchange Commission, including Cascade’s 2009 Form 10-K and Cascade’s Form 10-Q for the quarter ending September 30, 2010.
Cascade Financial – 4Q10 Results
January 25, 2011
Page 10
|
BALANCE SHEET
|
Quarter
|
Year
|
||||||||||||||||||
|
(Dollars in thousands except per share amounts)
|
Dec. 31, 2010
|
Sept. 30, 2010
|
Change
|
Dec. 31, 2009
|
Change
|
|||||||||||||||
|
(Unaudited)
|
||||||||||||||||||||
|
Assets
|
||||||||||||||||||||
|
Cash on hand and in banks
|
$ | 3,871 | $ | 4,310 | -10.2 | % | $ | 4,008 | -3.4 | % | ||||||||||
|
Interest-earning deposits
|
127,464 | 219,291 | -41.9 | % | 141,587 | -10.0 | % | |||||||||||||
|
Securities available-for-sale, fair value
|
234,606 | 249,383 | -5.9 | % | 227,805 | 3.0 | % | |||||||||||||
|
Securities held-to-maturity, amortized cost
|
53,912 | 20,681 | 160.7 | % | 36,177 | 49.0 | % | |||||||||||||
|
Federal Home Loan Bank (FHLB) stock
|
11,920 | 11,920 | 0.0 | % | 11,920 | 0.0 | % | |||||||||||||
|
Total securities
|
300,438 | 281,984 | 6.5 | % | 275,902 | 8.9 | % | |||||||||||||
|
Loans
|
||||||||||||||||||||
|
Business
|
400,047 | 417,273 | -4.1 | % | 469,196 | -14.7 | % | |||||||||||||
|
R/E construction
|
81,778 | 130,527 | -37.3 | % | 256,917 | -68.2 | % | |||||||||||||
|
Commercial R/E
|
201,885 | 187,564 | 7.6 | % | 183,286 | 10.1 | % | |||||||||||||
|
Multifamily
|
89,350 | 93,246 | -4.2 | % | 82,418 | 8.4 | % | |||||||||||||
|
Home equity/consumer
|
29,964 | 30,329 | -1.2 | % | 31,738 | -5.6 | % | |||||||||||||
|
Residential
|
194,677 | 197,400 | -1.4 | % | 179,133 | 8.7 | % | |||||||||||||
|
Total loans
|
997,701 | 1,056,339 | -5.6 | % | 1,202,688 | -17.0 | % | |||||||||||||
|
Deferred loan fees
|
(3,934 | ) | (4,130 | ) | 4.7 | % | (3,575 | ) | -10.0 | % | ||||||||||
|
Allowance for loan losses
|
(26,106 | ) | (26,456 | ) | 1.3 | % | (25,900 | ) | -0.8 | % | ||||||||||
|
Loans, net
|
967,661 | 1,025,753 | -5.7 | % | 1,173,213 | -17.5 | % | |||||||||||||
|
Real estate owned (REO)
|
34,412 | 34,989 | -1.6 | % | 18,842 | 82.6 | % | |||||||||||||
|
Premises and equipment, net
|
13,325 | 13,575 | -1.8 | % | 14,526 | -8.3 | % | |||||||||||||
|
Bank owned life insurance
|
25,489 | 25,264 | 0.9 | % | 24,522 | 3.9 | % | |||||||||||||
|
Goodwill
|
- | - | N/A | 12,885 | -100.0 | % | ||||||||||||||
|
Prepaid FDIC insurance premiums
|
2,968 | 3,975 | -25.3 | % | 6,859 | -56.7 | % | |||||||||||||
|
Federal income tax receivable
|
- | - | N/A | 12,979 | -100.0 | % | ||||||||||||||
|
Deferred tax asset
|
- | - | N/A | 4,991 | -100.0 | % | ||||||||||||||
|
Other assets
|
22,706 | 15,394 | 47.5 | % | 14,314 | 58.6 | % | |||||||||||||
|
Total assets
|
$ | 1,498,334 | $ | 1,624,535 | -7.8 | % | $ | 1,704,628 | -12.1 | % | ||||||||||
|
Liabilities
|
||||||||||||||||||||
|
Deposits
|
||||||||||||||||||||
|
Personal checking accounts
|
$ | 237,263 | $ | 257,928 | -8.0 | % | $ | 294,238 | -19.4 | % | ||||||||||
|
Business checking accounts
|
100,303 | 109,198 | -8.1 | % | 150,684 | -33.4 | % | |||||||||||||
|
Total checking accounts
|
337,566 | 367,126 | -8.1 | % | 444,922 | -24.1 | % | |||||||||||||
|
Savings and money market accounts
|
176,945 | 144,298 | 22.6 | % | 133,130 | 32.9 | % | |||||||||||||
|
Certificates of deposit
|
593,043 | 623,843 | -4.9 | % | 561,722 | 5.6 | % | |||||||||||||
|
Total deposits
|
1,107,554 | 1,135,267 | -2.4 | % | 1,139,774 | -2.8 | % | |||||||||||||
|
FHLB advances
|
159,000 | 239,000 | -33.5 | % | 239,000 | -33.5 | % | |||||||||||||
|
Securities sold under agreement to repurchase
|
145,000 | 145,000 | 0.0 | % | 145,410 | -0.3 | % | |||||||||||||
|
Federal Reserve borrowings
|
- | - | N/A | 20,000 | -100.0 | % | ||||||||||||||
|
Junior subordinated debentures
|
15,465 | 15,465 | 0.0 | % | 15,465 | 0.0 | % | |||||||||||||
|
Junior subordinated debentures, fair value
|
1,500 | 3,341 | -55.1 | % | 3,341 | -55.1 | % | |||||||||||||
|
Other liabilities
|
11,363 | 10,623 | 7.0 | % | 7,188 | 58.1 | % | |||||||||||||
|
Total liabilities
|
1,439,882 | 1,548,696 | -7.0 | % | 1,570,178 | -8.3 | % | |||||||||||||
|
Stockholders' equity
|
||||||||||||||||||||
|
Preferred stock
|
37,488 | 37,374 | 0.3 | % | 37,038 | 1.2 | % | |||||||||||||
|
Common stock and paid in capital
|
44,055 | 44,041 | 0.0 | % | 43,770 | 0.7 | % | |||||||||||||
|
(Accumulated deficit) retained earnings
|
(17,965 | ) | (9,332 | ) | -92.5 | % | 54,797 | -132.8 | % | |||||||||||
|
Accumulated other comprehensive (loss) gain
|
(5,126 | ) | 3,756 | -236.5 | % | (1,155 | ) | -343.8 | % | |||||||||||
|
Total stockholders' equity
|
58,452 | 75,839 | -22.9 | % | 134,450 | -56.5 | % | |||||||||||||
|
Total liabilities and stockholders' equity
|
$ | 1,498,334 | $ | 1,624,535 | -7.8 | % | $ | 1,704,628 | -12.1 | % | ||||||||||
(more)
Cascade Financial – 4Q10 Results
January 25, 2011
Page 11
|
STATEMENT OF OPERATIONS
|
Quarter Ended
|
Quarter Ended
|
Quarter
|
Quarter Ended
|
Year
|
||||||||||||||||
|
(Dollars in thousands except per share amounts)
|
Dec. 31, 2010
|
Sept. 30, 2010
|
Change
|
Dec. 31, 2009
|
Change
|
||||||||||||||||
|
(Unaudited)
|
|||||||||||||||||||||
|
Interest income
|
$ | 16,242 | $ | 17,394 | -6.6 | % | $ | 20,014 | -18.8 | % | |||||||||||
|
Interest expense
|
7,482 | 8,867 | -15.6 | % | 9,586 | -21.9 | % | ||||||||||||||
|
Net interest income
|
8,760 | 8,527 | 2.7 | % | 10,428 | -16.0 | % | ||||||||||||||
|
Provision for loan losses
|
5,500 | 8,000 | -31.3 | % | 8,000 | -31.3 | % | ||||||||||||||
|
Net interest income after provision for loan losses
|
3,260 | 527 | N/A | 2,428 | 34.3 | % | |||||||||||||||
|
Other income
|
|||||||||||||||||||||
|
Checking fees
|
1,309 | 1,416 | -7.6 | % | 1,323 | -1.1 | % | ||||||||||||||
|
Service fees
|
241 | 244 | -1.2 | % | 261 | -7.7 | % | ||||||||||||||
|
Bank owned life insurance, net
|
225 | 252 | -10.7 | % | 248 | -9.3 | % | ||||||||||||||
|
Gain on sales/calls of securities
|
3,998 | 3,000 | 33.3 | % | 649 | N/A | |||||||||||||||
|
Gain on sale of loans
|
19 | 167 | -88.6 | % | 15 | 26.7 | % | ||||||||||||||
|
Fair value gains
|
1,841 | - | N/A | 5,017 | -63.3 | % | |||||||||||||||
|
Other
|
162 | 120 | 35.0 | % | 115 | 40.9 | % | ||||||||||||||
|
Total other income
|
7,795 | 5,199 | 49.9 | % | 7,628 | 2.2 | % | ||||||||||||||
|
Total income
|
11,055 | 5,726 | 93.1 | % | 10,056 | 9.9 | % | ||||||||||||||
|
Other expenses
|
|||||||||||||||||||||
|
Compensation & employee benefits
|
3,389 | 3,884 | -12.7 | % | 3,419 | -0.9 | % | ||||||||||||||
|
Occupancy & equipment
|
929 | 970 | -4.2 | % | 1,068 | -13.0 | % | ||||||||||||||
|
FDIC insurance
|
1,051 | 1,080 | -2.7 | % | 512 | 105.3 | % | ||||||||||||||
|
Business insurance
|
386 | 376 | 2.7 | % | 63 | N/A | |||||||||||||||
|
Legal
|
384 | 320 | 20.0 | % | 403 | -4.7 | % | ||||||||||||||
|
B&O taxes
|
351 | 357 | -1.7 | % | 288 | 21.9 | % | ||||||||||||||
|
REO expenses, writedowns & losses
|
4,956 | 2,666 | 85.9 | % | 1,142 | 334.0 | % | ||||||||||||||
|
FHLB prepayment penalty
|
4,808 | - | N/A | - | N/A | ||||||||||||||||
|
Other operating expenses
|
1,978 | 2,045 | -3.3 | % | 1,708 | 15.8 | % | ||||||||||||||
|
OTTI charge
|
172 | - | N/A | - | N/A | ||||||||||||||||
|
Goodwill impairment
|
- | - | N/A | - | N/A | ||||||||||||||||
|
Total other expenses
|
18,404 | 11,698 | 57.3 | % | 8,603 | 113.9 | % | ||||||||||||||
|
Net (loss) income before provision for federal income tax
|
(7,349 | ) | (5,972 | ) | -23.1 | % | 1,453 | N/A | |||||||||||||
|
Provision for federal income tax
|
654 | - | N/A | 338 | 93.5 | % | |||||||||||||||
|
Net (loss) income
|
(8,003 | ) | (5,972 | ) | -34.0 | % | 1,115 | N/A | |||||||||||||
|
Dividends on preferred stock
|
515 | 508 | 1.4 | % | 487 | 5.7 | % | ||||||||||||||
|
Accretion of issuance discount on preferred stock
|
114 | 112 | 1.8 | % | 107 | 6.5 | % | ||||||||||||||
|
(Loss) income attributable to common stockholders
|
$ | (8,632 | ) | $ | (6,592 | ) | -30.9 | % | $ | 521 | N/A | ||||||||||
|
NET (LOSS) INCOME PER COMMON SHARE INFORMATION
|
|||||||||||||||||||||
|
Net (loss) income per common share, basic
|
$ | (0.70 | ) | $ | (0.54 | ) | -29.6 | % | $ | 0.04 | N/A | ||||||||||
|
Net (loss) income per common share, diluted
|
$ | (0.70 | ) | $ | (0.54 | ) | -29.6 | % | $ | 0.04 | N/A | ||||||||||
|
Weighted average number of common shares outstanding
|
|||||||||||||||||||||
|
Basic
|
12,271,529 | 12,271,529 | 12,146,080 | ||||||||||||||||||
|
Diluted
|
12,271,529 | 12,271,529 | 12,146,080 | ||||||||||||||||||
(more)
Cascade Financial – 4Q10 Results
January 25, 2011
Page 12
|
STATEMENT OF OPERATIONS
|
Year Ended
|
Year
|
||||||||||
|
(Dollars in thousands except per share amounts)
|
Dec. 31, 2010
|
Dec. 31, 2009
|
Change
|
|||||||||
|
(Unaudited)
|
||||||||||||
|
Interest income
|
$ | 71,395 | $ | 81,828 | -12.7 | % | ||||||
|
Interest expense
|
34,956 | 38,540 | -9.3 | % | ||||||||
|
Net interest income
|
36,439 | 43,288 | -15.8 | % | ||||||||
|
Provision for loan losses
|
56,515 | 44,175 | 27.9 | % | ||||||||
|
Net interest loss after provision for loan losses
|
(20,076 | ) | (887 | ) | N/A | |||||||
|
Other income
|
||||||||||||
|
Checking fees
|
5,402 | 5,047 | 7.0 | % | ||||||||
|
Service fees
|
965 | 1,033 | -6.6 | % | ||||||||
|
Bank owned life insurance, net
|
967 | 885 | 9.3 | % | ||||||||
|
Gain on sales/calls of securities
|
8,790 | 1,845 | 376.4 | % | ||||||||
|
Gain on sale of loans
|
224 | 176 | 27.3 | % | ||||||||
|
Fair value gains
|
1,841 | 7,169 | -74.3 | % | ||||||||
|
Other
|
555 | 474 | 17.1 | % | ||||||||
|
Total other income
|
18,744 | 16,629 | 12.7 | % | ||||||||
|
Total (loss) income
|
(1,332 | ) | 15,742 | -108.5 | % | |||||||
|
Other expenses
|
||||||||||||
|
Compensation & employee benefits
|
14,341 | 13,981 | 2.6 | % | ||||||||
|
Occupancy & equipment
|
3,930 | 4,229 | -7.1 | % | ||||||||
|
FDIC insurance
|
4,091 | 2,649 | 54.4 | % | ||||||||
|
Business insurance
|
1,514 | 253 | 498.4 | % | ||||||||
|
Legal
|
1,451 | 821 | 76.7 | % | ||||||||
|
B&O taxes
|
1,237 | 1,162 | 6.5 | % | ||||||||
|
REO expenses, writedowns & losses
|
12,544 | 3,318 | 278.1 | % | ||||||||
|
FHLB prepayment penalty
|
4,808 | - | N/A | |||||||||
|
Other operating expenses
|
8,116 | 7,849 | 3.4 | % | ||||||||
|
OTTI charge
|
172 | 858 | -80.0 | % | ||||||||
|
Goodwill impairment
|
12,885 | 11,700 | 10.1 | % | ||||||||
|
Total other expenses
|
65,089 | 46,820 | 39.0 | % | ||||||||
|
Net loss before provision (benefit) for income tax
|
(66,421 | ) | (31,078 | ) | -113.7 | % | ||||||
|
Provision (benefit) for income tax
|
3,865 | (7,610 | ) | -150.8 | % | |||||||
|
Net loss
|
(70,286 | ) | (23,468 | ) | -199.5 | % | ||||||
|
Dividends on preferred stock
|
2,026 | 1,943 | 4.3 | % | ||||||||
|
Accretion of issuance discount on preferred stock
|
450 | 422 | 6.6 | % | ||||||||
|
Loss attributable to common stockholders
|
$ | (72,762 | ) | $ | (25,833 | ) | -181.7 | % | ||||
|
NET LOSS PER COMMON SHARE INFORMATION
|
||||||||||||
|
Net loss per common share, basic
|
$ | (5.95 | ) | $ | (2.13 | ) | -179.0 | % | ||||
|
Net loss per common share, diluted
|
$ | (5.95 | ) | $ | (2.13 | ) | -179.0 | % | ||||
|
Weighted average number of common shares outstanding
|
||||||||||||
|
Basic
|
12,238,802 | 12,121,113 | ||||||||||
|
Diluted
|
12,238,802 | 12,121,113 | ||||||||||
(more)
Cascade Financial – 4Q10 Results
January 25, 2011
Page 13
|
(Dollars in thousands except per share amounts)
|
||||||||||||||||||||
|
(Unaudited)
|
||||||||||||||||||||
|
Quarter Ended
|
Year Ended
|
|||||||||||||||||||
|
PERFORMANCE MEASURES AND RATIOS
|
Dec. 31, 2010
|
Sept. 30, 2010
|
Dec. 31, 2009
|
Dec. 31, 2010
|
Dec. 31, 2009
|
|||||||||||||||
|
Return on average common stockholders' equity
|
-110.26 | % | -55.12 | % | 2.07 | % | -127.98 | % | -24.21 | % | ||||||||||
|
Return on average tangible common stockholders' equity*
|
-111.07 | % | -55.43 | % | 2.38 | % | -112.13 | % | -15.61 | % | ||||||||||
|
Return on average assets
|
-2.25 | % | -1.59 | % | 0.12 | % | -4.42 | % | -1.57 | % | ||||||||||
|
Efficiency ratio
|
111.17 | % | 85.23 | % | 47.65 | % | 117.95 | % | 78.14 | % | ||||||||||
|
Efficiency ratio (excluding goodwill impairment and OTTI)*
|
110.13 | % | 85.23 | % | 47.65 | % | 94.29 | % | 57.18 | % | ||||||||||
|
Net interest margin
|
2.52 | % | 2.26 | % | 2.79 | % | 2.47 | % | 2.96 | % | ||||||||||
|
*Non-GAAP measurement
|
||||||||||||||||||||
|
Quarter Ended
|
Year Ended
|
|||||||||||||||||||
|
AVERAGE BALANCES
|
Dec. 31, 2010
|
Sept. 30, 2010
|
Dec. 31, 2009
|
Dec. 31, 2010
|
Dec. 31, 2009
|
|||||||||||||||
|
Average assets
|
$ | 1,524,157 | $ | 1,647,081 | $ | 1,679,477 | $ | 1,645,980 | $ | 1,640,201 | ||||||||||
|
Average earning assets
|
1,380,489 | 1,494,329 | 1,483,361 | 1,478,085 | 1,461,198 | |||||||||||||||
|
Average total loans
|
1,036,558 | 1,090,449 | 1,232,078 | 1,113,891 | 1,242,588 | |||||||||||||||
|
Average deposits
|
1,116,588 | 1,150,803 | 1,083,453 | 1,158,437 | 1,017,348 | |||||||||||||||
|
Average stockholders' equity (including preferred stock)
|
68,477 | 84,748 | 137,024 | 94,099 | 143,534 | |||||||||||||||
|
Average common stockholders' equity (excluding preferred stock)
|
31,060 | 47,447 | 100,056 | 56,852 | 106,716 | |||||||||||||||
|
Average tangible common stockholders' equity (excluding
|
30,834 | 47,184 | 86,803 | 53,399 | 90,523 | |||||||||||||||
|
preferred stock and goodwill and intangibles)
|
||||||||||||||||||||
|
STOCKHOLDERS' EQUITY ANALYSIS
|
Dec. 31, 2010
|
Sept. 30, 2010
|
Dec. 31, 2009
|
|||||||||||||||||
|
Total stockholders' equity
|
$ | 58,452 | $ | 75,839 | $ | 134,450 | ||||||||||||||
|
Less: preferred stock
|
37,488 | 37,374 | 37,038 | |||||||||||||||||
|
Total common stockholders' equity
|
20,964 | 38,465 | 97,412 | |||||||||||||||||
|
Less: goodwill and intangibles
|
211 | 247 | 13,237 | |||||||||||||||||
|
Tangible common stockholders' equity
|
$ | 20,753 | $ | 38,218 | $ | 84,175 | ||||||||||||||
|
Common stock outstanding
|
12,271,529 | 12,271,529 | 12,146,080 | |||||||||||||||||
|
Book value per common share
|
$ | 1.71 | $ | 3.13 | $ | 8.02 | ||||||||||||||
|
Tangible book value per common share
|
$ | 1.69 | $ | 3.11 | $ | 6.93 | ||||||||||||||
(more)
Cascade Financial – 4Q10 Results
January 25, 2011
Page 14
|
(Dollars in thousands except per share amounts)
|
||||||||||||
|
(Unaudited)
|
||||||||||||
|
ASSET QUALITY
|
Dec. 31, 2010
|
Sept. 30, 2010
|
Dec. 31, 2009
|
|||||||||
|
Nonperforming loans (NPLs)
|
$ | 48,098 | $ | 68,354 | $ | 106,096 | ||||||
|
Nonperforming loans/total loans
|
4.82 | % | 6.47 | % | 8.82 | % | ||||||
|
REO
|
$ | 34,412 | $ | 34,989 | $ | 18,842 | ||||||
|
Nonperforming assets
|
$ | 82,510 | $ | 103,343 | $ | 124,938 | ||||||
|
Nonperforming assets/total assets
|
5.51 | % | 6.36 | % | 7.33 | % | ||||||
|
Net loan charge-offs in the quarter
|
$ | 5,859 | $ | 7,603 | $ | 6,855 | ||||||
|
Net charge-offs in the quarter/total loans
|
0.59 | % | 0.72 | % | 0.57 | % | ||||||
|
Allowance for loan losses
|
$ | 26,106 | $ | 26,456 | $ | 25,900 | ||||||
|
Plus: Allowance for off-balance sheet commitments
|
50 | 59 | 69 | |||||||||
|
Total allowance for loan losses
|
$ | 26,156 | $ | 26,515 | $ | 25,969 | ||||||
|
Total allowance for loan losses/total loans
|
2.62 | % | 2.51 | % | 2.16 | % | ||||||
|
Total allowance for loan losses/nonperforming loans
|
54.38 | % | 38.79 | % | 24.48 | % | ||||||
|
Capital/asset ratio (including junior subordinated debentures)
|
5.32 | % | 6.15 | % | 9.35 | % | ||||||
|
Capital/asset ratio (Tier 1, including junior subordinated debentures)
|
5.54 | % | 5.82 | % | 8.84 | % | ||||||
|
Tangible cap/asset ratio (excluding preferred stock and goodwill & intangibles)
|
1.39 | % | 2.35 | % | 4.98 | % | ||||||
|
Total risk-based capital/risk-weighted asset ratio
|
10.26 | % | 10.67 | % | 13.15 | % | ||||||
|
Quarter Ended
|
||||||||||||
|
INTEREST SPREAD ANALYSIS (AVERAGE YIELDS)
|
Dec. 31, 2010
|
Sept. 30, 2010
|
Dec. 31, 2009
|
|||||||||
|
Yield on interest-earning deposits
|
0.29 | % | 0.23 | % | 0.20 | % | ||||||
|
Yield on total loans
|
5.58 | % | 5.67 | % | 5.54 | % | ||||||
|
Yield on investments
|
2.20 | % | 2.28 | % | 4.11 | % | ||||||
|
Yield on earning assets
|
4.67 | % | 4.62 | % | 5.35 | % | ||||||
|
Cost of deposits
|
1.17 | % | 1.23 | % | 1.55 | % | ||||||
|
Cost of FHLB advances
|
3.57 | % | 4.35 | % | 4.35 | % | ||||||
|
Cost of Federal Reserve borrowings
|
0.00 | % | 0.00 | % | 0.25 | % | ||||||
|
Cost of securities sold under agreement to repurchase
|
5.95 | % | 5.94 | % | 5.88 | % | ||||||
|
Cost of junior subordinated debentures
|
11.16 | % | 10.91 | % | 8.76 | % | ||||||
|
Cost of interest-bearing liabilities
|
2.23 | % | 2.44 | % | 2.65 | % | ||||||
|
Net interest spread
|
2.44 | % | 2.18 | % | 2.70 | % | ||||||
|
Net interest margin
|
2.52 | % | 2.26 | % | 2.79 | % | ||||||
(more)
Cascade Financial – 4Q10 Results
January 25, 2011
Page 15
|
RECONCILIATION TO NON-GAAP FINANCIAL MEASURES*
|
||||||||||||||||||||
|
(Dollars in thousands)
|
||||||||||||||||||||
|
(Unaudited)
|
||||||||||||||||||||
|
Quarter Ended
|
Year Ended
|
|||||||||||||||||||
|
AVERAGE TANGIBLE COMMON STOCKHOLDERS' EQUITY
|
Dec. 31, 2010
|
Sept. 30, 2010
|
Dec. 31, 2009
|
Dec. 31, 2010
|
Dec. 31, 2009
|
|||||||||||||||
|
Loss attributable to common stockholders
|
$ | (8,632 | ) | $ | (6,592 | ) | $ | 521 | $ | (72,762 | ) | $ | (25,833 | ) | ||||||
|
Goodwill impairment
|
- | - | - | 12,885 | 11,700 | |||||||||||||||
|
(Loss) income attributable for common stockholders (excluding
|
$ | (8,632 | ) | $ | (6,592 | ) | $ | 521 | $ | (59,877 | ) | $ | (14,133 | ) | ||||||
|
goodwill impairment)
|
||||||||||||||||||||
|
Average stockholders' equity
|
$ | 68,477 | $ | 84,748 | $ | 137,024 | $ | 94,099 | $ | 143,534 | ||||||||||
|
Less: average preferred stock
|
37,417 | 37,189 | 36,968 | 37,247 | 36,818 | |||||||||||||||
|
Average common stockholders' equity
|
31,060 | 47,559 | 100,056 | 56,852 | 106,716 | |||||||||||||||
|
Less: average goodwill and intangibles
|
226 | 282 | 13,253 | 3,453 | 16,193 | |||||||||||||||
|
Average tangible common stockholders' equity (excluding preferred stock
|
$ | 30,834 | $ | 47,277 | $ | 86,803 | $ | 53,399 | $ | 90,523 | ||||||||||
|
and goodwill and intangibles)
|
||||||||||||||||||||
|
Return on average tangible common stockholders' equity (annualized)
|
-111.07 | % | -55.93 | % | 2.38 | % | -112.13 | % | -15.61 | % | ||||||||||
|
Quarter Ended
|
Year Ended
|
|||||||||||||||||||
|
EFFICIENCY RATIO
|
Dec. 31, 2010
|
Sept. 30, 2010
|
Dec. 31, 2009
|
Dec. 31, 2010
|
Dec. 31, 2009
|
|||||||||||||||
|
Total other expenses
|
$ | 18,404 | $ | 11,698 | $ | 8,603 | $ | 65,089 | $ | 46,820 | ||||||||||
|
Less: goodwill impairment
|
- | - | - | 12,885 | 11,700 | |||||||||||||||
|
Less: OTTI
|
172 | - | - | 172 | 858 | |||||||||||||||
|
Total other expenses (excluding goodwill impairment and OTTI)
|
$ | 18,232 | $ | 11,698 | $ | 8,603 | $ | 52,032 | $ | 34,262 | ||||||||||
|
Net interest income
|
$ | 8,760 | $ | 8,527 | $ | 10,428 | $ | 36,439 | $ | 43,288 | ||||||||||
|
Other income
|
7,795 | 5,199 | 7,628 | 18,744 | 16,629 | |||||||||||||||
|
Total income
|
$ | 16,555 | $ | 13,726 | $ | 18,056 | $ | 55,183 | $ | 59,917 | ||||||||||
|
Efficiency ratio (excluding goodwill impairment and OTTI)
|
110.13 | % | 85.23 | % | 47.65 | % | 94.29 | % | 57.18 | % | ||||||||||
|
TANGIBLE COMMON STOCKHOLDERS' EQUITY
|
Dec. 31, 2010
|
Sept. 30, 2010
|
Dec. 31, 2009
|
|||||||||||||||||
|
Total assets
|
$ | 1,498,334 | $ | 1,624,535 | $ | 1,704,628 | ||||||||||||||
|
Less: goodwill and intangibles
|
211 | 247 | 13,237 | |||||||||||||||||
|
Total tangible assets
|
$ | 1,498,123 | $ | 1,624,288 | $ | 1,691,391 | ||||||||||||||
|
Total stockholders' equity
|
$ | 58,452 | $ | 75,839 | $ | 134,450 | ||||||||||||||
|
Less: preferred stock
|
37,488 | 37,374 | 37,038 | |||||||||||||||||
|
Total common stockholders' equity
|
20,964 | 38,465 | 97,412 | |||||||||||||||||
|
Less: goodwill and intangibles
|
211 | 247 | 13,237 | |||||||||||||||||
|
Tangible common stockholders' equity
|
$ | 20,753 | $ | 38,218 | $ | 84,175 | ||||||||||||||
|
Tangible cap/asset ratio (excluding preferred stock
|
||||||||||||||||||||
|
and goodwill and intangibles)
|
1.39 | % | 2.35 | % | 4.98 | % | ||||||||||||||
|
*Management believes that the presentation of non-GAAP results provides useful information to investors regarding the effects on the Company's
|
||||||||||||||||||||
|
reported results of operations.
|
||||||||||||||||||||
Note: Transmitted on GlobeNewswire on January 25, 2011 at 1:00 p.m. PST.