Attached files
| file | filename |
|---|---|
| 8-K - TAIWAN FUND INC | v208319_8k.htm |
|
THE TAIWAN FUND, INC. (THE
'FUND')
|
|||||||
|
The
Martin Currie
|
IN
BRIEF
|
||||||
|
US$ return
|
|||||||
|
Net
asset value per share
|
US$20.84
|
At December 31,
2010
|
Fund*
|
TAIEX Index†
|
|||
|
Market
price
|
US$19.24
|
%
|
%
|
||||
|
Premium/(discount)
|
(7.68%)
|
One
month
|
10.7
|
12.0
|
|||
|
Fund
size
|
US$387.1m
|
Three
months
|
15.4
|
16.7
|
|||
|
One
year
|
27.0
|
20.2
|
|||||
|
Source:
State Street Bank and Trust Company.
|
Three
years % pa
|
4.0
|
5.5
|
||||
|
Shanghai
team
|
|
||||||
|
Past
performance is not a guide to future returns. Returns are annualized,
except for periods of less than one year.
|
|||||||
|
*Source:
State Street Bank and Trust Company. NAV performance.
|
|||||||
|
†Source
for index data: TWSE.
|
|||||||
|
MANAGER’S
COMMENTARY
|
|||||||
|
It is Year 100 – in Taiwan, at
least. Expect more celebrations on 10 October, which marks the centenary
of the mutiny which led to the fall of the Qing dynasty and the founding
of the Republic of China. The fireworks display on the 101 Building,
watched by well-wrapped crowds (the temperature fell to a chilly 10
degrees) also marked another milestone: the taking effect of the
cross-strait free-trade agreement signed last June. It was only fitting,
therefore, that the Taiwanese stockmarket should stage a warming and
celebratory 12% rally in December. Despite the best efforts of the central
bank, the NT dollar broke above the NT$30 mark against the US dollar,
reaching its highest level since October
1997.
|
|||||||
|
December brought confirmation that
the daily ceiling for Chinese tourists to visit Taiwan would increase from
3,000 to 4,000. This followed the sixth ‘Chiang–Chen’ meeting, in which
Taiwanese and Chinese representatives meet to negotiate further free-trade
agreements across the straits. Taiwan aims to accept individual tourists
by June 2011. The Chinese authorities gave Five Taiwanese banks approval
to open branches in China on 17 December. Our investment China Life
Insurance (2823 TT) announced that it would acquire a 19.9% stake in
Pacific ING Life Insurance in China for Rmb379 million, to follow China
Construction Bank’s acquisition of a 50% stake. China Development
Financial Holding has asked the Taiwanese authorities to approve its
private-equity fund to invest Rmb6 billion in China. These recent
developments illustrate the theme of growing cross-strait cooperation in
the financial sectors, which will benefit our substantial holding in
finance companies. The financial index rallied by 18.5% in December.
|
|||||||
|
We had personal experience of the
pick-up in Taiwanese consumption, as the manager was one of 30,000 people
visiting the Leofoo Village theme park in central Taiwan on the holiday
weekend (never again!). The Chinese New Year’s Eve dinner at the
Shangri-la Hotel has been fully reserved, with deposits paid two months
ago. And it is difficult to get a seat to fly to Taiwan from Shanghai
after 20 January – two weeks ahead of Chinese New Year (the number of
direct flights will increase from 370 to 500 in the first half of 2011).
The central bank raised the interest rate by 12.5 basis points to 1.625%
and introduced selective credit controls to restrain property speculation.
To deter naughty foreign currency speculators, the reserve-requirement
ratio on deposits made by foreigners was raised from 9.775% to 90% (yes,
really). In November, the unemployment rate fell to 4.7% (from a peak of
6.1% in August 2009). But there is one thing which the Taiwanese are
clearly not doing: the government announced a NT$38 billion package to
encourage Taiwan’s citizens to have more
children.
|
|||||||
|
INVESTMENT
STRATEGY
|
|||||||
|
The Fund is 98.5% invested with
holdings in 58 companies. Our exposure to the financial sector is 16.0%,
while we have just 29.5% in the electronic sector. There are some
interesting developments in the technology sector, notably smart phones,
LED lighting, and iPads, but these changes can be at the expense of
existing operations, as shown by our recent visit to Ju Teng, which makes
casings for the languishing notebook PC sector. Currency appreciation and
rising mainland labor costs also act as a drag on sentiment towards the
sector.
During December we were a small
net buyer. We bought into inverter-maker Powercom, ahead of strong 2011 demand from
the solar-power industry, Wistron
NeWeb, which started
making Lenovo’s smartphones in the fourth quarter, and the neglected
Taiwan High
Speed Rail. We took
profits on Jih Sun
Financial Holding,
whose banking division will lack growth in 2011 now that the write-back of
provisions is completed, and reduced the holding in Taiwan Glass
Industrial.
|
|||||||
|
Chris
Ruffle, Martin Currie Inc*
|
|||||||
|
*Martin Currie Ltd and Heartland
Capital Management Ltd (HCML) have established MC China Ltd (MCCL), as a
joint venture company, to provide investment management or investment
advisory services to the range of China investment products managed by
Martin Currie.
MCCL has appointed Martin Currie
Investment Management Ltd (MCIM), or its affiliates, as investment manager
of Martin Currie’s China investment products. HCML has seconded both Chris
Ruffle and Shifeng Ke to MCIM, or its affiliates, on a full time basis
with the same roles and responsibilities as if they were full time
employees.
Martin Currie Inc took over
management of the Fund on May 8, 2010.
|
|||||||
|
DECEMBER 31, 2010
|
||||||||
|
FUND DETAILS
|
PERFORMANCE
|
(US$ RETURNS)
|
||||||
|
Market
cap
|
US$357.4m
|
NAV
|
Market
price
|
|||||
|
Shares
outstanding
|
18,575,112
|
%
|
%
|
|||||
|
Exchange
listed
|
NYSE
|
One
month
|
10.7
|
14.4
|
||||
|
Listing
date
|
1986
|
Three
months
|
15.4
|
15.5
|
||||
|
Listed
and direct investment manager
|
Martin
Currie Inc
|
Three
years % pa
|
4.0
|
3.8
|
||||
|
Source:
State Street Bank and Trust Company.
|
Past
performance is not a guide to future returns. Returns are annualized,
except for periods of less than one year.
|
|||||||
|
Source:
State Street Bank and Trust
Company.
|
||||||||
|
SECTOR
ALLOCATION
|
||
|
Fund*
|
Benchmark†
|
|
|
Electronics
|
29.5%
|
51.8%
|
|
Finance
|
16.0%
|
13.4%
|
|
Wholesale and
retail
|
13.8%
|
5.6%
|
|
Construction
|
6.3%
|
2.0%
|
|
Plastics
|
5.1%
|
8.3%
|
|
Foods
|
4.1%
|
1.5%
|
|
Textiles
|
3.9%
|
2.1%
|
|
Electric and
machinery
|
3.1%
|
1.0%
|
|
Steel and
iron
|
3.0%
|
2.7%
|
|
Chemicals
|
2.9%
|
1.9%
|
|
Others
|
2.9%
|
1.8%
|
|
Healthcare
|
2.5%
|
—
|
|
Rubber
|
1.8%
|
1.2%
|
|
Transportation
|
1.4%
|
2.8%
|
|
Glass and
ceramics
|
1.4%
|
0.4%
|
|
Cement
|
0.8%
|
1.1%
|
|
Automobile
|
—
|
1.0%
|
|
Electrical appliance &
cable
|
—
|
0.6%
|
|
Tourism
|
—
|
0.4%
|
|
Paper and
pulp
|
—
|
0.4%
|
|
Other assets and
liabilities
|
1.5%
|
—
|
*Source: State Street Bank and Trust
Company.
†Source for TAIEX index data:
TWSE.
|
15
LARGEST HOLDINGS (44.6%)
|
||
|
%
of net assets
|
||
|
Far Eastern Department
Stores
|
Wholesale and
retail
|
3.8% |
|
Taiwan Semiconductor
Manufacturing
|
Electronics
|
3.8% |
|
Wah Lee
Industrial
|
Electronics
|
3.4% |
|
President Chain
Store
|
Wholesale and
retail
|
3.4% |
|
SinoPac Financial
Holdings
|
Finance
|
3.2% |
|
KGI
Securities
|
Finance
|
3.1% |
|
Chinatrust Financial
Holding
|
Finance
|
3.0% |
|
China Petrochemical
Development
|
Plastics
|
3.0% |
|
Tung Ho Steel
Enterprise
|
Steel and
iron
|
3.0% |
|
Synnex Technology
International
|
Electronics
|
3.0% |
|
Fubon Financial
Holding
|
Finance
|
2.6% |
|
Uni-President
Enterprises
|
Foods
|
2.5% |
|
Yuanta Financial
Holding
|
Finance
|
2.5% |
|
Test-Rite
International
|
Wholesale and
retail
|
2.2% |
|
Prince Housing &
Development
|
Construction
|
2.1% |
Source: State Street Bank and Trust
Company.
|
PERFORMANCE
|
(US$ RETURNS)
|
|||||||
|
One
|
Three
|
Calendar year
|
One
|
Three
|
Five
|
Ten
|
Since
|
|
|
month
|
months
|
to date
|
year
|
years
|
years
|
years
|
launch
|
|
|
%
|
%
|
%
|
%
|
% pa
|
% pa
|
% pa
|
% pa
|
|
|
The Taiwan Fund,
Inc.
|
10.7
|
15.4
|
27.0
|
27.0
|
4.0
|
8.4
|
7.4
|
10.0
|
|
TAIEX Index
|
12.0
|
16.7
|
20.2
|
20.2
|
5.5
|
9.1
|
8.0
|
9.9
|
|
TAIEX Total Return
Index
|
12.0
|
16.7
|
24.6
|
24.6
|
9.7
|
13.3
|
na
|
na
|
|
MSCI Taiwan
Index
|
12.5
|
17.4
|
22.7
|
22.7
|
6.2
|
9.6
|
8.3
|
na
|
|
Past performance is not a guide to
future returns. Source: State Street Bank and Trust Company. Launch date
December 23, 1986. Returns for the Fund presented above are
historical total returns that reflect changes in net asset value per share
during each period and assume that dividends and capital gains, if any, were
reinvested. Actual returns to a Fund Shareholder will be based on market
price and reflect transaction costs and expenses. Returns are annualized, except for
periods of less than one year.
|
|
Source for index data: MSCI for
the MSCI Taiwan Index and TWSE for the TAIEX Total Return Index and the
TAIEX Index. For a full description of each index please see the index
descriptions section.
|
|
Returns for the TAIEX Index are
not total returns and reflect only changes in the share price but do not
assume that cash dividends, if any, were reinvested, and thus are not
strictly comparable to the Fund
returns.
|
|
The TAIEX Total Return Index
commenced January 1, 2003.
|
|
THE
PORTFOLIO — IN FULL
|
DECEMBER 31, 2010
|
||||
|
Sector
|
Company
|
Price
|
Holding
|
Value US$
|
% of net assets
|
|
(BGB ticker)
|
|||||
|
Electronics
|
29.5
|
|||||
|
Taiwan Semiconductor
Manufacturing
|
2330
|
TT
|
NT$71.0
|
5,994,426
|
$14,597,234
|
3.8
|
|
Wah Lee
Industrial
|
3010
|
TT
|
NT$58.3
|
6,644,000
|
$13,285,037
|
3.4
|
|
Synnex Technology
International
|
2347
|
TT
|
NT$78.7
|
4,238,544
|
$11,440,791
|
3.0
|
|
WT
Microelectronics
|
3036
|
TT
|
NT$46.9
|
5,056,000
|
$8,132,883
|
2.1
|
|
WPG
Holdings
|
3702
|
TT
|
NT$56.3
|
4,129,725
|
$7,974,329
|
2.1
|
|
Far EasTone
Telecommunications
|
4904
|
TT
|
NT$42.3
|
4,924,000
|
$7,143,697
|
1.8
|
|
Tatung
|
2371
|
TT
|
NT$7.9
|
26,073,000
|
$7,046,636
|
1.8
|
|
Longwell
|
6290
|
TT
|
NT$47.0
|
3,614,000
|
$5,825,734
|
1.5
|
|
Wistron
NeWeb
|
6285
|
TT
|
NT$69.9
|
2,269,000
|
$5,439,717
|
1.4
|
|
Powercom
|
3043
|
TT
|
NT$57.7
|
2,384,000
|
$4,717,878
|
1.2
|
|
Syncmold
Enterprise
|
1582
|
TT
|
NT$49.2
|
2,678,000
|
$4,514,386
|
1.2
|
|
Aurora
|
2373
|
TT
|
NT$55.0
|
2,196,000
|
$4,142,472
|
1.1
|
|
MPI
|
6223
|
TT
|
NT$107.0
|
1,098,000
|
$4,029,496
|
1.0
|
|
Clevo
|
2362
|
TT
|
NT$67.5
|
1,650,000
|
$3,819,903
|
1.0
|
|
Chunghwa
Telecom
|
2412
|
TT
|
NT$74.1
|
1,488,000
|
$3,781,688
|
1.0
|
|
Avermedia
Technologies
|
2417
|
TT
|
NT$40.3
|
2,690,000
|
$3,718,107
|
1.0
|
|
Taiwan Surface Mounting
Technology
|
6278
|
TT
|
NT$68.0
|
1,554,000
|
$3,624,303
|
0.9
|
|
Soft-World
International
|
5478
|
TT
|
NT$139.5
|
154,770
|
$740,501
|
0.2
|
|
Finance
|
16.0
|
|||||
|
SinoPac Financial
Holdings
|
2890
|
TT
|
NT$13.5
|
26,935,000
|
$12,425,214
|
3.2
|
|
KGI
Securities
|
6008
|
TT
|
NT$16.7
|
20,740,000
|
$11,843,706
|
3.1
|
|
Chinatrust Financial
Holdings
|
2891
|
TT
|
NT$21.4
|
16,067,000
|
$11,792,698
|
3.0
|
|
Fubon Financial
Holding
|
2881
|
TT
|
NT$40.0
|
7,349,624
|
$10,082,999
|
2.6
|
|
Yuanta Financial
Holding
|
2885
|
TT
|
NT$21.8
|
13,013,000
|
$9,729,679
|
2.5
|
|
China Life
Insurance
|
2823
|
TT
|
NT$31.1
|
4,191,254
|
$4,463,445
|
1.2
|
|
Union Bank of Taiwan
|
2838
|
TT
|
NT$11.4
|
4,408,000
|
$1,715,940
|
0.4
|
|
Wholesale and
retail
|
13.8
|
|||||
|
Far Eastern Department
Stores
|
2903
|
TT
|
NT$48.8
|
8,794,500
|
$14,704,504
|
3.8
|
|
President Chain
Store
|
2912
|
TT
|
NT$134.5
|
2,840,000
|
$13,101,024
|
3.4
|
|
Test-Rite
International
|
2908
|
TT
|
NT$23.0
|
10,622,000
|
$8,379,126
|
2.2
|
|
Taiwan Tea
|
2913
|
TT
|
NT$21.3
|
8,231,000
|
$6,013,078
|
1.5
|
|
Mercuries &
Associates
|
2905
|
TT
|
NT$24.6
|
6,680,100
|
$5,636,152
|
1.5
|
|
PC Home
Online
|
8044
|
TT
|
NT$177.0
|
922,125
|
$5,597,933
|
1.4
|
|
Construction
|
6.3
|
|||||
|
Prince Housing &
Development
|
2511
|
TT
|
NT$24.5
|
9,899,760
|
$8,318,698
|
2.1
|
|
Taiwan Land
Development
|
2841
|
TT
|
NT$16.0
|
14,586,183
|
$7,979,340
|
2.1
|
|
Hung Poo Real Estate
Development
|
2536
|
TT
|
NT$43.5
|
3,061,000
|
$4,566,855
|
1.2
|
|
Continental
Holdings
|
3703
|
TT
|
NT$13.8
|
7,468,000
|
$3,521,856
|
0.9
|
|
Plastics
|
5.1
|
|||||
|
China Petrochemical
Development
|
1314
|
TT
|
NT$28.9
|
11,711,000
|
$11,607,974
|
3.0
|
|
Nan Ya
Plastics
|
1303
|
TT
|
NT$72.7
|
3,217,000
|
$8,021,398
|
2.1
|
|
Foods
|
4.1
|
|||||
|
Uni-President
Enterprises
|
1216
|
TT
|
NT$43.3
|
6,600,000
|
$9,790,270
|
2.5
|
|
Lien Hwa
Industrial
|
1229
|
TT
|
NT$23.5
|
4,815,000
|
$3,872,610
|
1.0
|
|
Gourmet
Master
|
2723
|
TT
|
NT$293.0
|
204,000
|
$2,050,040
|
0.6
|
|
Textiles
|
3.9
|
|||||
|
Li Peng Enterprise
|
1447
|
TT
|
NT$16.2
|
9,847,000
|
$5,454,326
|
1.4
|
|
Far Eastern New
Century
|
1402
|
TT
|
NT$49.4
|
3,121,200
|
$5,288,264
|
1.4
|
|
Makalot
Industrial
|
1477
|
TT
|
NT$68.5
|
1,828,000
|
$4,294,686
|
1.1
|
|
Electric and
machinery
|
3.1
|
|||||
|
Yungtay
Engineering
|
1507
|
TT
|
NT$43.8
|
3,274,000
|
$4,918,327
|
1.3
|
|
Depo Auto Parts
Industrial
|
6605
|
TT
|
NT$77.4
|
1,674,000
|
$4,443,867
|
1.1
|
|
Awea
Mechantronic
|
1530
|
TT
|
NT$35.0
|
2,264,000
|
$2,717,747
|
0.7
|
|
Steel and
iron
|
3.0
|
|||||
|
Tung Ho Steel Enterprise
|
2006
|
TT
|
NT$33.1
|
10,099,000
|
$11,447,600
|
3.0
|
|
THE PORTFOLIO — IN FULL (CONTINUED)
|
DECEMBER 31, 2010
|
||||
|
Sector
|
Company
|
Price
|
Holding
|
Value US$
|
% of net assets
|
|
(BGB ticker)
|
|||||
|
Chemicals
|
2.9
|
|||||
|
China Steel
Chemical
|
1723
|
TT
|
NT$120.0
|
1,600,000
|
$6,585,153
|
1.7
|
|
Excelsior
Medical
|
4104
|
TT
|
NT$92.5
|
1,507,729
|
$4,783,322
|
1.2
|
|
Others
|
2.9
|
|||||
|
Yem Chio
|
4306
|
TT
|
NT$29.2
|
5,701,316
|
$5,700,045
|
1.5
|
|
Globe Union
Industrial
|
9934
|
TT
|
NT$31.4
|
5,128,000
|
$5,522,583
|
1.4
|
|
Healthcare
|
2.5
|
|||||
|
ST Shine
Optical
|
1565
|
TT
|
NT$388.0
|
392,000
|
$5,216,538
|
1.3
|
|
Pacific Hospital Supply
|
4126
|
TT
|
NT$122.5
|
1,099,948
|
$4,621,393
|
1.2
|
|
Rubber
|
1.8
|
|||||
|
TSRC
|
2103
|
TT
|
NT$67.5
|
3,057,000
|
$7,077,238
|
1.8
|
|
Transportation
|
1.4
|
|||||
|
Farglory F T Z
Investment
|
5607
|
TT
|
NT$33.9
|
3,809,000
|
$4,422,158
|
1.2
|
|
Taiwan High Speed
Rail
|
2633
|
TT
|
NT$5.0
|
5,037,000
|
$868,969
|
0.2
|
|
Glass and
ceramics
|
1.4
|
|||||
|
Taiwan Glass
Industrial
|
1802
|
TT
|
NT$36.4
|
4,481,320
|
$5,586,953
|
1.4
|
|
Cement
|
0.8
|
|||||
|
Wei Mon
Industry
|
8925
|
TT
|
NT$21.6
|
4,204,296
|
$3,114,667
|
0.8
|
|
Other assets and
liabilities
|
$5,837,998
|
1.5
|
|
THE
TAIWAN FUND, INC.
PREMIUM/DISCOUNT
|
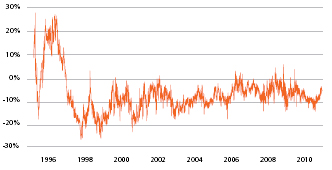
Source:
State Street Bank and Trust Company as of November 30, 2010.
|
INDEX
DESCRIPTIONS
|
MSCI Taiwan Index
The MSCI Total Return Taiwan Index is a
free-float adjusted market capitalization index. The index represents Taiwanese
companies that are available to investors worldwide. The index has a base date
of December 31, 1987. As of June 24, 2010 it contained 117
constituents.
TAIEX Index
The TWSE, or TAIEX, Index is a
capitalization-weighted index of all listed common shares traded on the Taiwan
Stock Exchange. The index was based in 1966.
TAIEX Total Return
Index
The TAIEX Total Return Index is a
capitalization-weighted index of all listed common shares traded on the Taiwan
Stock Exchange, based in 1966, which includes re-invested
dividends.
|
OBJECTIVE
|
The Fund was launched on December 23,
1986 to allow US and other investors to access and participate in the growth of
the economy and the stock market in Taiwan, the Republic of China. The Fund’s
investment objective is to seek long-term capital appreciation primarily through
investments in equity securities listed in Taiwan. The Fund is a diversified,
closed-end management investment company listed on the New York Stock Exchange
(NYSE) under the symbol 'TWN'.
Taiwan, with its global market
leadership in high technology goods and its significant investments throughout
mainland China and Southeast Asian economies, is now an integral economic player
in the Asia Pacific Region as well as around the world. Investing in Taiwan not
only allows investors to capitalize on Taiwan’s dynamic economy, but also allows
investors to reap the growth and investment potential of the mainland China and
other emerging economies of the region.
|
CONTACTS
|
The
Taiwan Fund, Inc.
c/o State
Street Bank and Trust Company
2 Avenue
de Lafayette
PO Box
5049
Boston,
MA 02111
Tel: (1)
877-864-5056
www.thetaiwanfund.com
Important
information: This document
is issued and approved by Martin Currie Inc (MC Inc), as investment adviser of
The Taiwan Fund, Inc. (the 'Fund'). MC Inc is authorised and regulated by the
Financial Services Authority (FSA) and incorporated under limited liability in
New York, USA. Registered in Scotland (No BR2575), registered address Saltire
Court, 20 Castle Terrace, Edinburgh, EH1 2ES. Information herein is believed to
be reliable but has not been verified by MC Inc. MC Inc makes no representation
or warranty and does not accept any responsibility in relation to such
information or for opinion or conclusion which the reader may draw from this
newsletter.
The Fund is classified as a diversified
investment company under the US Investment Company Act of 1940 as amended. It
meets the criteria of a closed ended US mutual fund and its shares are listed on
the New York Stock Exchange. MC Inc has been appointed investment adviser to the
Fund.
Investors are advised that they will not
generally benefit from the rules and regulations of the United Kingdom Financial
Services and Markets Act 2000 and the FSA for the protection of investors, nor
benefit from the United Kingdom Financial Services Compensation Scheme, nor have
access to the Financial Services Ombudsman in the event of a dispute. Investors
will also have no rights of cancellation under the FSA's Conduct of Business
Sourcebook of the United Kingdom.
This newsletter does not constitute an
offer of shares. MC Inc, its ultimate and intermediate holding companies,
subsidiaries, affiliates, clients, directors or staff may, at any time, have a
position in the market referred to herein, and may buy or sell securities,
currencies, or any other financial instruments in such markets. The information
or opinion expressed in this newsletter should not be construed to be a
recommendation to buy or sell the securities, commodities, currencies or
financial instruments referred to herein.
The information provided in this report
should not be considered a recommendation to purchase or sell any particular
security. There is no assurance that any securities discussed herein will remain
in an account's portfolio at the time you receive this report or that securities
sold have not been repurchased.
It should not be assumed that any of the
securities transactions or holdings discussed here were or will prove to be
profitable, or that the investment recommendations or decisions we make in the
future will be profitable or will equal the investment performance of the
securities discussed herein.
Investing in the Fund involves certain
considerations in addition to the risks normally associated with making
investments in securities. The value of the shares issued by the Fund, and the
income from them, may go down as well as up and there can be no assurance that
upon sale, or otherwise, investors will receive back the amount originally
invested. There can be no assurance that you will receive comparable performance
returns, or that investments will reflect the performance of the stock examples
contained in this document. Movements in foreign exchange rates may have a
separate effect, unfavorable as well as favorable, on the gain or loss otherwise
experienced on an investment. Past performance is not a guide to future returns.
Accordingly, the Fund is only suitable for investment by investors who are able
and willing to withstand the total loss of their investment. In particular,
prospective investors should consider the following
risks:
|
-›
|
it should be noted that investment in the Fund is only suitable for sophisticated investors who are aware of the risk of investing in Taiwan and should be regarded as long term. Funds which invest in one country carry a higher degree of risk than those with portfolios diversified across a number of markets. |
|
-›
|
investment in the securities of smaller and unquoted companies can involve greater risk than is customarily associated with investment in larger, more established, companies. In particular, smaller companies often have limited product lines, markets or financial resources and their management may be dependent on a smaller number of key individuals. In addition, the market for stock in smaller companies is often less liquid than that for stock in larger companies, bringing with it potential difficulties in acquiring, valuing and disposing of such stock. Proper information for determining their value, or the risks to which they are exposed, may not be available. |
|
-›
|
investments within emerging markets such as Taiwan can be of higher risk. Many emerging markets, and the companies quoted on their stock exchanges, are exposed to the risks of political, social and religious instability, expropriation of assets or nationalization, rapid rates of inflation, high interest rates, currency depreciation and fluctuations and changes in taxation which may affect the Fund's income and the value of its investments. |
|
-›
|
the marketability of quoted shares may be limited due to foreign investment restrictions, wide dealing spreads, exchange controls, foreign ownership restrictions, the restricted opening of stock exchanges and a narrow range of investors. Trading volume may be lower than on more developed stockmarkets, and equities are less liquid. Volatility of prices can also be greater than in more developed stockmarkets. The infrastructure for clearing, settlement and registration on the primary and secondary markets may be undeveloped. Under certain circumstances, there may be delays in settling transactions in some of the markets. |
Martin
Currie Inc, registered in Scotland (no BR2575)
Registered
office: Saltire Court, 20 Castle Terrace, Edinburgh EH1 2ES Tel: 44
(0) 131 229 5252 Fax: 44 (0) 131 228
5959 www.martincurrie.com North American office: 1350 Avenue of the
Americas, Suite 3010, New York, NY 10019, USA Tel: (1) 212 258
1900 Fax: (1) 212 258 1919
Authorised
and registered by the Financial Services Authority and incorporated with limited
liability in New York, USA.
Please
note: calls to the above numbers may be recorded.