Attached files
| file | filename |
|---|---|
| 8-K - 8-K - AMPAL-AMERICAN ISRAEL CORP | zk1109334.htm |
Exhibit 99.1

January 2011
COMPANY
PRESENTATION
PRESENTATION

2
About Ampal:
Ampal-American Israel Corporation (“Ampal” or the “Company”) and its subsidiaries acquire interests primarily in businesses
located in the State of Israel or that are Israel-related. Ampal is seeking opportunistic situations in a variety of industries, with a
focus on energy, chemicals, communication and related sectors. Ampal’s goal is to develop or acquire majority interests in
businesses that are profitable and generate significant free cash flow that Ampal can control. For more information about Ampal
please visit our web site at www.ampal.com.
Safe Harbor Statement on Forward-Looking Statements
Certain information in this presentation includes forward-looking statements (within the meaning of Section 27A of the Securities
Act of 1933 and Section 21E of the Securities Exchange Act of 1934) and information relating to Ampal that are based on the beliefs
of management of Ampal as well as assumptions made by and information currently available to the management of Ampal. When
used in this presentation, the words "anticipate," "believe," "estimate," "expect," "intend," "plan," and similar expressions as they
relate to Ampal or Ampal's management, identify forward-looking statements. Such statements reflect the current views of Ampal
with respect to future events or future financial performance of Ampal, the outcome of which is subject to certain risks and other
factors which could cause actual results to differ materially from those anticipated by the forward-looking statements, including
among others, the economic and political conditions in Israel, the Middle East, including the situation in Iraq, and the global
business and economic conditions in the different sectors and markets where Ampal's portfolio companies operate. Should any of
these risks or uncertainties materialize, or should underlying assumptions prove incorrect, actual results or outcome may vary from
those described herein as anticipated, believed, estimated, expected, intended or planned. Subsequent written and oral forward-
looking statements attributable to Ampal or persons acting on its behalf are expressly qualified in their entirety by the cautionary
statements in this paragraph. Please refer to the Ampal's annual, quarterly and periodic reports on file with the SEC for a more
detailed discussion of these and other risks that could cause results to differ materially. Ampal assumes no obligation to update or
revise any forward-looking statements.
Use of Non-GAAP Financial Measures
Ampal uses certain non-GAAP financial measures in this presentation. Ampal uses non-GAAP financial measures as supplemental
measures of performance and believes these measures provide useful information to investors in evaluating our operations, period
over period. However, non-GAAP financial measures have limitations as analytical tools, and should not be considered in isolation
or as a substitute for Ampal’s financial results prepared in accordance with GAAP. In addition, investors should note that any non-
GAAP financial measures Ampal uses may not be the same non-GAAP financial measures, and may not be calculated in the same
manner, as that of other companies. Reconciliations of our non-GAAP financial measures are included in this presentation.

3
Company Profile| AMPAL
General Data
§ Incorporated in New York
§ Invests in companies with a stable cash flow
§ Market Value (Million US$) 135
§ Equity 30.09.2010 (Million US$) (not including the estimated Gross Profit in the
amount of US$ 58 million from the 012 transaction): 187.4
amount of US$ 58 million from the 012 transaction): 187.4
* The Company Financial Statements are prepared in accordance with US GAAP (and not IFRS).
see implication in slide 38-39.
Holding Structure
Proportion of Investments
(Holdings Book Value*)

4
Diversification of Segments | AMPAL
Chemicals
Energy
EMG
12.5%
(2006)
012 Smile
100%
(2010)
Gadot
Chemical
Tankers
Chemical
Tankers
100%
(2007)
Areas of
activities:
activities:
GWE
50%
(2008)
Ethanol project in
Colombia
Colombia
(Loan convertible to
25%)
25%)
(2009)
Communications
* Percentage indicates Ampal’s ownership interest in the applicable company
Holdings*:
(Year Ampal made
investment)
investment)

5
Major Milestones| AMPAL
1400
1200
1000
800
800
600
400
200
0
2001 2002 2003 2004 2005 2006 2007 2008 2009 Q3 2010
Total Assets (Million US$)
EMG
Purchase
012 Smile
Purchase
Gadot
Purchase
Registration
For trading on
TASE

Energy

7
EMG | East Mediterranean Gas
§ EMG was established and registered in Egypt in
2000 and has constructed an off-shore gas
pipeline from El-Arish (Egypt) to Ashkelon (Israel)
as well as on shore facilities.
2000 and has constructed an off-shore gas
pipeline from El-Arish (Egypt) to Ashkelon (Israel)
as well as on shore facilities.
§ The gas flow to Israel began in June 2008.
§ In 2010 EMG provided 2.5 BCM annually to Israel
Electric Corporation and Mashav.
Electric Corporation and Mashav.
§ In 2011 EMG is expected to provide
approximately 3.0 BCM to its customers
approximately 3.0 BCM to its customers
§ Egypt has undertaken to export up to 7 BCM of
natural gas annually for 20 years renewable to
Israel through EMG.
natural gas annually for 20 years renewable to
Israel through EMG.
§ EMG’s contracts with Israeli customers for
Egyptian natural gas may have terms of up to 20
years, with a total of 140 BCM.
Egyptian natural gas may have terms of up to 20
years, with a total of 140 BCM.
§ EMG Shareholders are:
• EGPC/ EGAS (10%)
• PTT (25%)
• Merhav-Ampal Group (including institutional
Investors (25%)
Investors (25%)
• MGPC Ltd. (28%)
• EGI Egypt (12%)
EMG Profile

8
EMG | East Mediterranean Gas
§ Demand for natural gas in
Israel continues to
increase both for
electricity generation and
industrial conversions.
Israel continues to
increase both for
electricity generation and
industrial conversions.
§ EMG is one of only two
gas suppliers in Israel.
gas suppliers in Israel.
§ Presently EMG supplies
more than half of the
natural gas consumed by
the Israeli market
more than half of the
natural gas consumed by
the Israeli market
§ EMG is currently the only
company that can provide
additional quantities of
gas to Israel in the years
2011-2013
company that can provide
additional quantities of
gas to Israel in the years
2011-2013
Natural Gas in Israel
§ EMG has access to Egyptian gas reserves
totaling in excess of 2,500 BCM from proven
diverse sources
totaling in excess of 2,500 BCM from proven
diverse sources
§ EMG has skilled and professional
management with decades of experience in
Egypt and its gas industry
management with decades of experience in
Egypt and its gas industry
§ EMG has already concluded several long term
contracts for the sale of over 90 BCM valued
at over 15 Billion US$
contracts for the sale of over 90 BCM valued
at over 15 Billion US$
§ EMG's estimated revenues (assuming
delivery of 7 BCM annually) - over US$ 1.0
billion
delivery of 7 BCM annually) - over US$ 1.0
billion
§ Estimated EBITDA (with provision of 7 BCM
annually) - over US$ 350 million
annually) - over US$ 350 million
§ Pipeline construction cost - approximately
US$ 460 million
US$ 460 million
§ Debt Balance - US$ 203 million
§ First Dividend is expected in 2011 (according
to a declared policy).
to a declared policy).
EMG
9
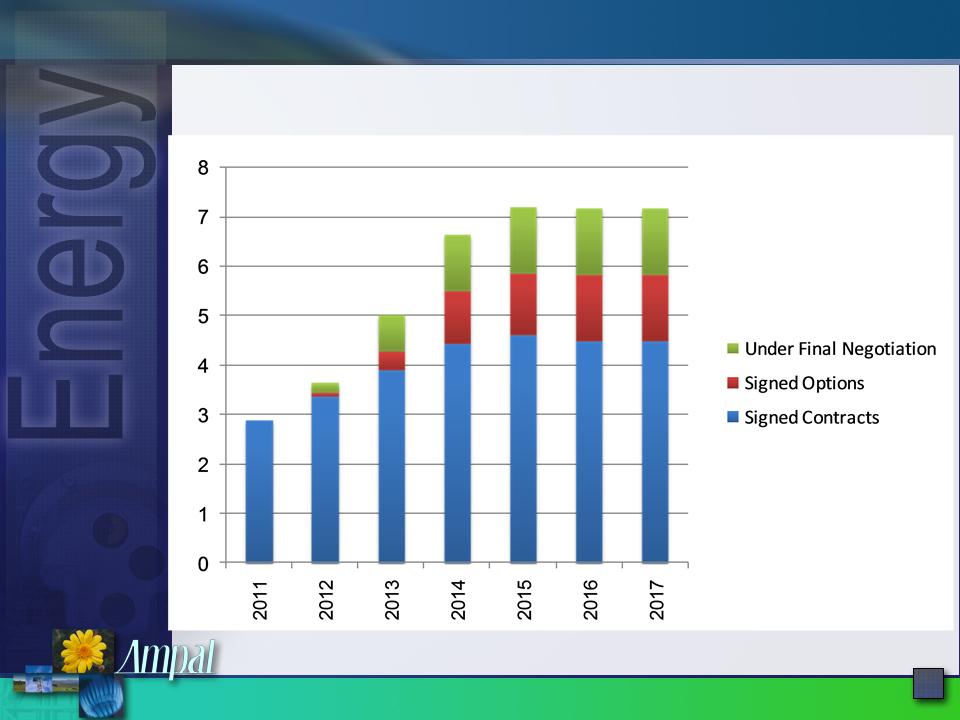
EMG | Signed & Potential Contracts
BCM
*Options may or may not be exercised on March 31st, 2011

10
Israel's Natural Gas Demand Forecast 2011-2025 *
* Source: Natural Gas Authority - Israel
.
EMG Signed Contracts & Options & Contracts Under Negotiation
EMG Signed Contracts & Options
EMG Signed Contracts

11
EMG | EMG Signed Contracts in Israel
|
|
BCM (annually)
|
Term
|
|
IEC
|
2.1
|
15 years (+5 years)
|
|
Israel Corp.
|
1.4
|
20 years
|
|
Dorad Energy
|
0.75
|
17 years (+5 years)
|
|
Other Contracts
|
0.55
|
|
|
Total
|
4.8
|
|
|
Signed Option
|
1.5
|
|
|
Total including Option
|
6.3
|
|

12
Renewable Energy
§ GWE is owned equally by Clal and Ampal (50%/50%)
§ GWE focuses on the new development and acquisition of controlling interests in renewable
energy, including wind energy projects outside of Israel
energy, including wind energy projects outside of Israel
§ GWE seeks to either develop or acquire wind energy opportunities with a goal of
establishing at least 150 MW of installed capacity by the middle of 2011
establishing at least 150 MW of installed capacity by the middle of 2011
§ The company currently has projects in Greece and Poland, which are in varying
developmental stages, with a total capacity of over 250 MW
developmental stages, with a total capacity of over 250 MW
• A project of 42 MW in Greece, was granted a production license in February 2010
• A project of 16 MW in Greece, was granted a production license in December 2010
§ GWE also has 20 MW photovoltaic projects under development in Greece.
Global Wind Energy

13
Renewable Energy
§ Production of Bio-Ethanol fuel from sugarcane
§ The Project includes the development of a 11,000 hectare sugar cane plantation
(Agricultural Project) and the design, construction and operation of an ethanol
production plant (Industrial Project). 10,000 hectares are already available for the
Project, including purchased and leased land.
(Agricultural Project) and the design, construction and operation of an ethanol
production plant (Industrial Project). 10,000 hectares are already available for the
Project, including purchased and leased land.
§ The Colombian government supports the development of the ethanol industry and,
since 2000, has adopted a series of measures to encourage the supply and demand for
ethanol and to create a regulatory framework to set prices, including the adoption of a
series of laws, decrees and resolutions to stimulate carburant alcohol production, sale
and consumption, and including the Colombian Law that stipulates mandatory E10
blending for gasoline use in urban areas.
§ Ampal holds a loan of approximately US$22 million convertible to 25% of the Project, to
be converted upon the first withdrawal from the financing bank.
be converted upon the first withdrawal from the financing bank.
§ Financing of the project - SBCE - US$ 255 million
Ethanol Project in Colombia

14
Renewable Energy
§ Operating & Financial Parameters:
• Agricultural Productivity - (Ton / Ha year): approximately 140;
• Production (Industrial): approximately 112 million Lt/ year;
• The Industrial Project will operate in a duty-free zone with a reduced income tax rate
of 15%
of 15%
• Ethanol - for sale to the local market
• Revenues - 92% of the revenues will come from the sale of ethanol and 8% from the
sale of power
sale of power
• Full Production Capacity - Year 2014
• Estimated Revenues in 2014 - approximately US$ 90 million
• Estimated EBIDTA during 2014-2020 - approximately US$ 70 million annually
(average).
(average).
Ethanol Project in Colombia (cont.)

Chemicals

Delivering Excellence Along the Value Chain
Gadot Group of companies

17
Gadot Chemicals Tankers & Terminals | Gadot
§ Gadot was established by the Johananoff family more than 50 years ago, and
in 2007 was acquired by Ampal.
in 2007 was acquired by Ampal.
§ Gadot completed its transition into a private company and was delisted from
trade in 2008.
trade in 2008.
§ In late 2008, a strategic plan for a globalized transformation process and for
growth through acquisitions and new business development was adopted.
growth through acquisitions and new business development was adopted.
§ Gadot Group is engaged within the chemical value chain supplying bulk
commodity chemicals and other raw materials and leading in the areas of
procurement and storage, transport and delivery of bulk chemicals, oils and
other raw materials.
commodity chemicals and other raw materials and leading in the areas of
procurement and storage, transport and delivery of bulk chemicals, oils and
other raw materials.
§ Gadot is the largest company in its field.
Gadot Group

18
Gadot Chemicals Tankers & Terminals | Gadot
§ Re-branding and a strong environmental oriented approach.
§ Organizational restructure, including five business divisions.
§ Reducing human resources - enabling the company to increase its profits,
despite a decline of about 40% of revenues during the crisis of 2009.
despite a decline of about 40% of revenues during the crisis of 2009.
§ Strengthening the management team, and the middle management layer
§ Internal merger divestment and termination of unprofitable activities or
companies, internal synergies etc.
companies, internal synergies etc.
§ Expanding global operations through internal and external growth in each of
the group activities.
the group activities.
Strategic change process

Chemical Value Chain
Petrochemicals
Complex
Complex
Manufacturing
Coal
Natural Gas
Oil
Oil Products
Chemicals
Feedstock
Feedstock
Base Chemicals
Specialty
Chemicals
Chemicals
• Pharmaceutical
• Agriculture
• Compounding
• Electronics
• Food
• Coatings, Inks,
Adhesive
Adhesive
• Automotive
Chemicals
Distributions
Distributions
Raw Materials
Building
Blocks
End Users
Derivatives
Waste
Management
Management
Oil, Gas and Coal Logistics
Chemicals Logistics
Logistic services
Chemicals Distribution
19
Gadot Chemicals Tankers & Terminals | Gadot

Chemicals Logistics
Gadot within the Value Chain
• Pharmaceutical
• Agriculture
• Compounding
• Electronics
• Food
• Coatings, Inks, Adhesive
• Automotive
Chemicals Distributions
Petrochemicals
Complex
Complex
Manufacturing
End Users
Waste
Management
Gadot Chemical
Logistics
Logistics
Marine
VLS GROUP
Gadot Sales &
Distribution
Distribution
Gadot BAX
Gadot Shelach
20
Gadot Chemicals Tankers & Terminals | Gadot

Sales & Distribution
Division
Division
Chemical Logistics
Division
Division
Marine Division
Solar Solutions
Division
Division
Agro Division
Healthcare &
Molecular Biology
Products
Molecular Biology
Products
Commodities
Caustic
Soda &
Inorganic
Chemicals
Soda &
Inorganic
Chemicals
Specialties
Deep Sea
Terminals
Terminals
Tank
Storage
Farm
Storage
Farm
Value-added
Services
Trucking
Fleet
Fleet
3rd party
Logistics
Hazardous
Materials
Warehouse
Commercial
Shipping
Container
Fleet
ISO Tank
Fleet
Chemical
Tankers
Design,
Development
& Project
Management
Development
& Project
Management
Procurement
& Distribution
& Distribution
of Solar
Components
21

22
Gadot Chemicals Tankers & Terminals | Gadot
Gadot Global Presence

23
Gadot Chemicals Tankers & Terminals | Gadot
§ Gadot sells and distributes most types of chemicals in Israel and in Europe
and serves all major Israeli companies, such as: ICL, Teva, Makhteshim,
Palsan, and others.
and serves all major Israeli companies, such as: ICL, Teva, Makhteshim,
Palsan, and others.
§ Gadot represents a large number of chemical giants such as DuPont, BASF,
Bayer, DOW, SASOL, CELANESE and others.
Bayer, DOW, SASOL, CELANESE and others.
§ Storage and transport infrastructure allows Gadot to lead a significant
competitive advantage compared to other companies in the sector.
competitive advantage compared to other companies in the sector.
§ The quality system and the unique management standards, including the
compliance with stringent quality standards, places Gadot as a leading
company in its sector.
compliance with stringent quality standards, places Gadot as a leading
company in its sector.
§ Gadot serves companies in the field of chemistry, pharmaceuticals, food,
electronics and others.
electronics and others.
Sales & Distribution Division

24
Gadot Chemicals Tankers & Terminals | Gadot
§ Gadot owns the only two deep sea chemical terminals in Israel.
§ Recently Gadot acquired a large terminal in Belgium to serve the major large
companies in Europe and Israeli companies that operate in Europe.
companies in Europe and Israeli companies that operate in Europe.
§ Gadot has two chemical transport companies - Shelach and Chemichlor.
§ Gadot complies with all of the strict terms of its Environment business
license.
license.
Storage and Transport Division

25
Gadot Chemicals Tankers & Terminals | Gadot
Storage and Transport Division
26
Gadot Chemicals Tankers & Terminals | Gadot
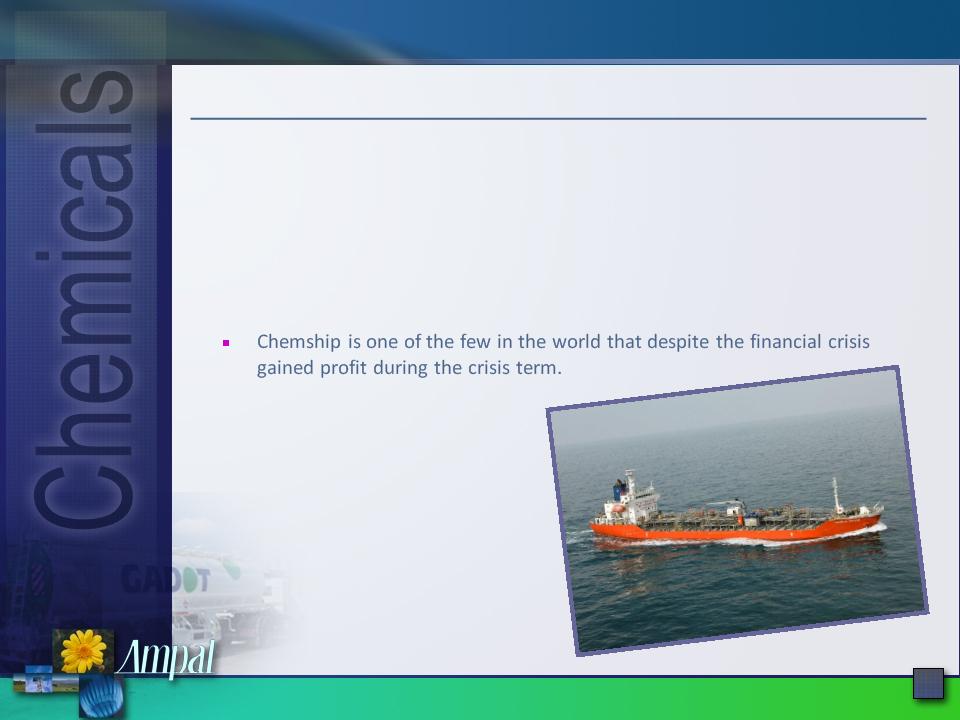
§ The Marine division coordinates the group's marine operations.
§ Chemship currently operates 10 tankers for chemicals transportation
and is building another 4 new ships in China that will expand the
Group's services in this field.
and is building another 4 new ships in China that will expand the
Group's services in this field.
§ Most of the Gadot-Yam-Chemship activities are based on long-term
agreements with the Group customers.
agreements with the Group customers.
Marine Division

27
Gadot Chemicals Tankers & Terminals | Gadot
§ Gadot owns:
• Two shipping agents: Yang Ming Marine Transportation (Taiwan)
and Hanjin Shipping (Korea).
and Hanjin Shipping (Korea).
• A company that operates hundreds of ISO-Tanks worldwide in
cooperation with HOYER.
cooperation with HOYER.
• Representatives of several international companies for ISO-Tanks
Marine Division (2)
Gadot Chemicals Tankers & Terminals | Gadot
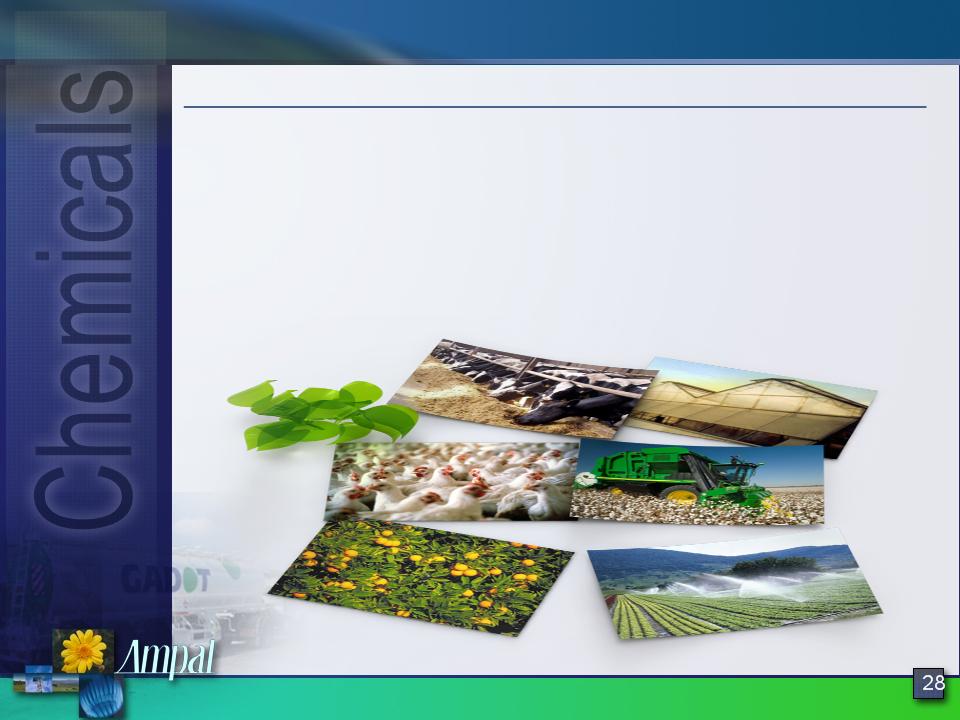
§ Gadot Agro aquired Milchan Borthers/ Merhav Agro company to lead a
process of expansion in this field.
process of expansion in this field.
§ The company represents most of the major players in this world: DuPont,
Bayer, Syngenta, KAKEN, Bayer, and others.
Bayer, Syngenta, KAKEN, Bayer, and others.
§ The company operates in the crop protection and seeds sectors.
Agro - Chemical Division

29
Gadot Chemicals Tankers & Terminals | Gadot
2010 Financial Highlights*
|
000$
|
Q1
|
Q2
|
Q3
|
Q4 E
|
2010 E
|
|
Revenues
|
116,442
|
115,289
|
123,752
|
134,745
|
490,228
|
|
Adjusted
EBITDA |
4,465
|
6,962
|
6,798
|
9,428
|
27,653
|
* In accordance with IFRS

30
Gadot Chemicals Tankers & Terminals | Gadot
§ Gadot Agro (Milchan Borthers) - Agro - Chemical
§ A chemical storage terminal in Ghent, Belgium
§ FCC - HANJIN agency in Israel
§ ICX - SASOL agency in Israel
§ Gadot Solar Solutions
§ Packer - ISO-TANK agency of Interbulk.
2010 Acquisitions

31
Gadot Chemicals Tankers & Terminals | Gadot
2010 Acquisitions - the terminal in Ghent

Gadot Chemicals Tankers & Terminals | Gadot
§ Expanding the products portfolio, customers, new segments along the value
chain of the chemical field
chain of the chemical field
§ Development of the activities of distribution in North America.
Development Directions

Financials

34
Condensed Solo* (unconsolidated) Balance Sheet (Pro-Forma) - September 30, 2010
* Including Gadot, 012 Smile, Merhav Ampal Energy Holdings, LP and Country Club Kfar Saba on equity basis and not
consolidated.
consolidated.
** Including a convertible loan of approximately US$22M to the project in Colombia.
|
Assets
|
|
Liabilities and
Shareholders’
Equity
|
||||
|
|
|
US$
(in Millions)
|
|
|
|
US$
(in Millions)
|
|
Cash, deposits and other
financial items**
|
|
98.4
|
|
Banks and Debentures
|
|
439.8
|
|
Investments
|
|
505.7
|
|
Accounts Payable
|
|
12.6
|
|
Fixed Assets
|
|
2.7
|
|
Noncontrolling interest
|
|
0.2
|
|
Other
|
|
33.2
|
|
Equity
|
|
187.4
|
|
|
|
|
|
|
|
|
|
Total
|
|
640.0
|
|
Total
|
|
640.0
|

35
Main Holdings - September 30, 2010
* Ampal’s Financial Statements reflect a 16.8% interest in the shares of EMG (approximately US$366M), which includes
the 8.6% interest in EMG held by Ampal’s joint venture with certain Israeli institutional investors, of which a 4.3%
interest in EMG (approximately US$100.0 M) is attributable to the institutional investors.
the 8.6% interest in EMG held by Ampal’s joint venture with certain Israeli institutional investors, of which a 4.3%
interest in EMG (approximately US$100.0 M) is attributable to the institutional investors.
** On October 13, 2010, the Company’s wholly owned subsidiary agreed to sell all of the issued and outstanding share
capital of 012 Smile. Estimated profit is approximately US$ 58 million.
capital of 012 Smile. Estimated profit is approximately US$ 58 million.
Method of Book Value
Cost
Consolidated
Consolidated
Ampal’s
ownership %
ownership %
12.5%
100%
100%
EMG*
Gadot
012 Smile**
Other
Total
Book Value (US$
in Millions)
in Millions)
266.3
117.8
112.2
9.4
505.7

36
Results of Operations in Consolidated Companies*
* The investments in 012 Smile and Gadot by Ampal account for 45% of Ampal’s total holdings (according to their book
value)
value)
** See EBITDA break-down on Appendix A
*** All data on 012 Smile.Communications Ltd. prior to the acquisition of its business by 012 Smile is based on publicly
available information of B Communications Ltd. (f/k/a 012 Smile.Communications Ltd.) on the Tel Aviv Stock Exchange
and NASDAQ.
available information of B Communications Ltd. (f/k/a 012 Smile.Communications Ltd.) on the Tel Aviv Stock Exchange
and NASDAQ.
EBITDA **(US$ in Millions)
Gadot
012 Smile***
Q3 2009
6
18
24
2009
25
74
99
Q3 2010
6
18
24
Revenue (US$ in Millions)
Gadot
012 Smile***
Q3 2009
105
77
182
2009
415
311
726
Q3 2010
121
81
202

37
Condensed Consolidated Balance Sheet - September 30, 2010
Current Assets (excluding cash, deposits and
other financial items)
other financial items)
Cash, deposits and other financial items*
Fixed Assets
Investments:
EMG (Institutional Investors)
Other Investments
Other Non-Current Assets
257.9
111.6
1,378.8
248.3
266.3
100.0
5.1
54.3
US$ (in
Millions)
Millions)
EMG (Ampal)
Current Liabilities (excluding banks and
debentures)
debentures)
Gadot - Construction of Vessels
Capital Note - Institutional Investors in EMG
Other Liabilities (including Minority rights)
152.3
1,378.8
213.8
48.9
100.0
19.0
US$ (in
Millions)
Millions)
Banks - Gadot
Banks - Ampal
Banks - 012 Smile
269.9
172.1
215.4
Debentures
Loans:
Equity
187.4
*Including a convertible loan of approximately US$22M to the project in Colombia
Goodwill and Intangible Assets
335.3

38
US GAAP Implication (million)
|
|
|
Nine Months
Ended September 30, (Unaudited) |
Twelve Months
Ended December 31, (Audited) |
|
|
|
|
|
|
|
|
2010
|
2009
|
|
|
|
|
|
|
Net Loss
|
|
($36)
|
($21)
|
|
|
|
|
|
|
Translation loss resulting from the
depreciation of the U.S. Dollar against the New Israeli Shekel and linkage to the Israeli Consumer Price Index * |
|
$9
|
$6
|
|
|
|
|
|
|
Price Purchase Allocation and
intangible asset amortizations expense ** |
|
$30
|
$7
|
|
|
|
|
|
|
Net profit (loss) excluding
Translation and interest expenses |
|
$3
|
($8)
|

39
US GAAP Implication (million) (cont.)
|
|
Nine Months
Ended September 30, (Unaudited) |
Twelve Months
Ended December 31, (Audited) |
|
|
2010
|
2009
|
|
|
|
|
|
Translation and interest expenses
|
$51
|
$27
|
|
|
|
|
|
Gain (loss) from SWAP agreements
|
($1)
|
$6
|
|
|
|
|
|
Interest expense
|
($41)
|
($27)
|
|
|
|
|
|
Translation loss resulting from the
depreciation of the U.S. Dollar against the New Israeli Shekel and linkage to the Israeli Consumer Price Index |
9$
|
6$
|
|
|
Nine Months
Ended September 30, (Unaudited) |
Twelve Months
Ended December 31, (Audited) |
|
|
|
|
|
|
2010
|
2009
|
|
|
|
|
|
Depreciation and amortization expense
|
$48
|
$15
|
|
|
|
|
|
Depreciation expense
|
($18)
|
($8)
|
|
|
|
|
|
Price Purchase Allocation and intangible
asset amortizations expense |
$30
|
$7
|
*
**
Thank you!

41
Appendix A - EBITDA Break-Down for 012 Smile
* Less than 1.
(1) All data on 012 Smile.Communications Ltd. prior to the acquisition of its business by 012 Smile is based on publicly available
information of B Communications Ltd. (f/k/a 012 Smile.Communications Ltd.) on the Tel Aviv Stock Exchange and NASDAQ.
information of B Communications Ltd. (f/k/a 012 Smile.Communications Ltd.) on the Tel Aviv Stock Exchange and NASDAQ.
Revenues
Expenses
Profit
Marketing, sales, General,
administrative and other expenses
administrative and other expenses
Depreciation and amortization
EBITDA
Non-recurring and stock
compensation expenses
compensation expenses
Adjusted EBITDA
81
77
311
(59)
(54)
(212)
22
23
99
(18)
(13)
(52)
14
8
26
18
18
73
*
*
1
18
18
74
Three Months
Ended
September 30,
2010
(Unaudited)
Ended
September 30,
2010
(Unaudited)
Three Months
Ended
September 30,
2009
(Unaudited) (1)
Ended
September 30,
2009
(Unaudited) (1)
26
(19)
7
(5)
4
6
*
6
January
2010
2010
February 1 to
September 30,
2010
(Unaudited)
September 30,
2010
(Unaudited)
211
(151)
60
(46)
34
48
*
48
237
(170)
67
(51)
38
54
*
54
231
(160)
71
(39)
23
55
*
55
Twelve Months
Ended
December 31,
2009 (1)
Ended
December 31,
2009 (1)

6
1
5
6
*
6
42
Appendix A - EBITDA Break-Down for Gadot
* Less than 1.
Revenues
Expenses
Profit
Marketing, sales, General,
administrative and other expenses
administrative and other expenses
Depreciation and amortization
EBITDA
Non-recurring and stock
compensation expenses
compensation expenses
Adjusted EBITDA
415
(375)
40
(33)
18
25
*
25
Twelve Months Ended
December 31, 2009
December 31, 2009
358
299
121
105
(327)
(272)
(111)
(96)
31
27
10
9
(29)
(23)
(9)
(7)
12
12
4
4
14
16
2
*
16
16
Nine Months
Ended
September 30,
2010
(Unaudited)
Ended
September 30,
2010
(Unaudited)
Nine Months
Ended
September 30,
2009
(Unaudited)
Ended
September 30,
2009
(Unaudited)
Three Months
Ended
September 30,
2010
(Unaudited)
Ended
September 30,
2010
(Unaudited)
Three Months
Ended
September 30,
2009
(Unaudited)
Ended
September 30,
2009
(Unaudited)