Attached files
| file | filename |
|---|---|
| 8-K - FORM 8-K - Sunstone Hotel Investors, Inc. | d8k.htm |
 Company Presentation
January 2011
Exhibit 99.1 |
 1
Forward-Looking Statements
This presentation contains forward-looking statements that have been made
pursuant to the provisions of the Private Securities Litigation Reform Act
of 1995. These statements relate to future events or our future financial
performance. In some cases, you can identify forward-looking statements by
terminology
such
as
“anticipate,”
“believe,”
“continue,”
“could,”
“estimate,”
“expect,”
“intend,”
“may,”
“plan,”
“predict,”
“project,”
“should,”
“will”
or the negative of such terms and other comparable
terminology. These statements are only predictions. Actual events or results may
differ materially from those expressed or implied by these
forward-looking statements. In evaluating these statements, you
should
specifically
consider
the
risks
outlined
in
detail
under
the
heading
“Risk
Factors”
in
our
Annual
Report on Form 10-K, filed with the Securities and Exchange Commission
(“SEC”) on February 23, 2010, as revised by the filing of our
Current Report on Form 8-K on January 14, 2011, and under the heading
“Risk Factors” on page 2 of our Registration Statement on Form
S-3, filed with the SEC on January
14,
2011,
including,
but
not
limited
to,
the
following
factors:
general
economic
and
business
conditions affecting the lodging and travel industry, both nationally and locally,
including a prolonged U.S. recession; the need to operate as a REIT and
comply with other applicable laws and regulations; rising operating
expenses; relationships with and requirements of franchisors and hotel brands;
relationships with and the performance of the managers of our hotels; the ground or
air leases for 7 of the 32 hotels; our ability to complete acquisitions and
dispositions; and competition for the acquisition of hotels.
These factors may cause our actual events to differ materially from the
expectations expressed or implied by any forward-looking statement. We
do not undertake to update any forward-looking statement.
This presentation includes non-GAAP financial information that the issuer
considers useful to investors as a key measure of operating
performance. A reconciliation to U.S. GAAP can be found on the
issuer's website at www.sunstonehotels.com. |
 2
Sunstone’s Mission and Vision
Mission
Sunstone
is
a
hotel
investment
company
focused
on
maximizing
shareholder
value
through a comprehensive, cycle-appropriate approach to portfolio management.
Sunstone’s strategy is predicated on:
Acquiring
upper-upscale
hotels
with
nationally
recognized
brands
in
markets
with
high
barriers
to
entry
Enhancing
the
value
of
our
hotels
through
major
capital
projects
and
repositioning
Optimizing
the
performance
of
our
portfolio
through
aggressive
asset
management
Recycling
capital
through
opportunistic
disposition
of
non-core
assets
Maximizing
financial
flexibility
and
minimizing
cost
of
capital
through
disciplined
balance
sheet
management
Near-term Objectives
Improve
profitability
of
existing
hotels
through
a
focused
asset
management
and
capital
expenditure program
Enhance
corporate
credit
statistics
through
a
measured
and
deliberate
approach
to
balance
sheet management
Increase
portfolio
size
and
quality
through
disciplined
acquisitions
Improve
communications
and
accessibility
to
investors
through
frequent
conference
calls
and
investor meetings
Build
a
top-quality
“talent-based”
organization
by
selectively
adding
industry
professionals
who
will complement the proven strengths of the existing team
|
 3
•
Chairman since October 26, 2004; Co-Chairman since March 19, 2007
•
Chairman of Wolff Urban Management, Inc. since 1980 and also CEO. Wolff Urban
Management, Inc. is a real estate acquisition, investment, development and
management firm. •
Co-founder of Maritz, Wolff & Co., a privately-held hotel investment
group that owns top-tier luxury hotels
•
Chairman
and
CEO
of
Wolff
Urban
Development,
LLC,
a
private
real
estate
and
select
business
investment
opportunity
organization
that
invests
in
and
develops
commercial
urban
real
estate,
professional
sports
activities,
luxury
hotel
and
resort
properties,
hotel
management
companies
and
hospitality related assets
•
Former Director of Maguire Properties, Inc.
•
Former Co-Chairman of Fairmont Hotels & Resorts
•
Co-owner of the Oakland Athletics (MLB) and the San Jose Earthquakes
(MLS) •
Holds a B.A. in Business Administration from the University of Wisconsin, Madison
and an M.B.A. from Washington University in St. Louis, Missouri
Board of Directors
Lewis N. Wolff
Co-Chairman |
 4
•
Founded predecessor companies in 1988 and served as CEO through October 2007
•
Acquired 122 hotels with over 20,000 rooms and disposed of 79 hotels during the
22-year period while CEO
•
Built 7 ground-up hotels including the JW Marriott Cherry Creek
•
Oversaw approximately $500 million of renovations and brand conversions
•
Grew Sunstone from 10 to 59 hotels in 2004
•
Acquired
four
major
portfolios
from
1997
–
2005:
23
hotels
for
$335
million
in
1997,
10
hotels
for
$135
million in 2000, 14 hotels for $400 million in 2002, and 6 hotels for over $600
million in 2005 •
Owner of hotels since 1976
•
Former president of the Holiday Inn Franchise Association
•
Former member of the Marriott Franchise Board
•
Former Chairman of the Governmental Affairs Committee of the American Hotel &
Lodging Association •
Holds a B.S. in Hotel Administration from the Cornell School of Hotel
Administration Board of Directors
Robert A. Alter
Founder and Executive Chairman |
 5
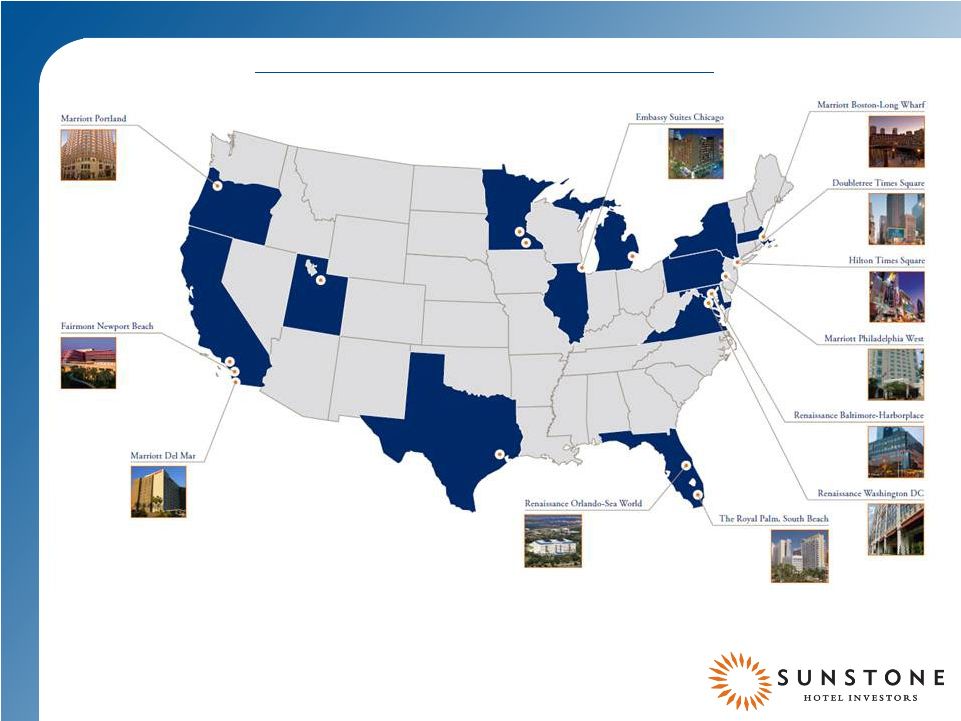
Sunstone Portfolio
West Coast Revenue: 25%
NY/Bos/Phil Revenue: 30%
Baltimore/DC Revenue: 18%
Chicago/Rochester Revenue: 9%
Other Revenue: 18%
82% of 2010 Revenue from Primary Coastal Markets |
 6
Sunstone Portfolio
Hilton Times Square
Marriott Boston Long Wharf
Renaissance Washington D.C.
Fairmont Newport Beach
Royal Palm South Beach
Doubletree Guest Suites Times Square |
 7
Sunstone Portfolio
Brand Concentration
(by 2010 total revenue)
Independent |
 8
Proven Approach To Portfolio Management
Hotel acquired September 2005 for $293 million ($404k per key)
Developed comprehensive business plan that included:
$38 million renovation
All rooms
Addition of X-Bar lounge
Addition of Equinox health club
Repositioned the hotel to maximize its appeal to both group and business travelers
in light of re-emergence of Century City as the premier entertainment
business district Rebranded to Hyatt
Received $27 million of yield support from Hyatt
Tripled annual EBITDA during ownership period
Sold
May
2008
for
$366.5
million
($504k
per
key)
18.6x
trailing
EBITDA
(1)
The combination of a well planned renovation, creative asset management and
meaningful yield support from Hyatt enabled Sunstone to realize total internal
rate of return of approximately 19%
(1)
(1) As reported in press release dated June 2, 2008. See reconciliation to net income
in press release dated June 2, 2008.
Hyatt Regency Century Plaza Case Study
Significant
stockholder
value
created
through
Sunstone’s
execution
of
a
proven
Renovate,
Reposition,
Rebrand
investment
strategy. |
 9
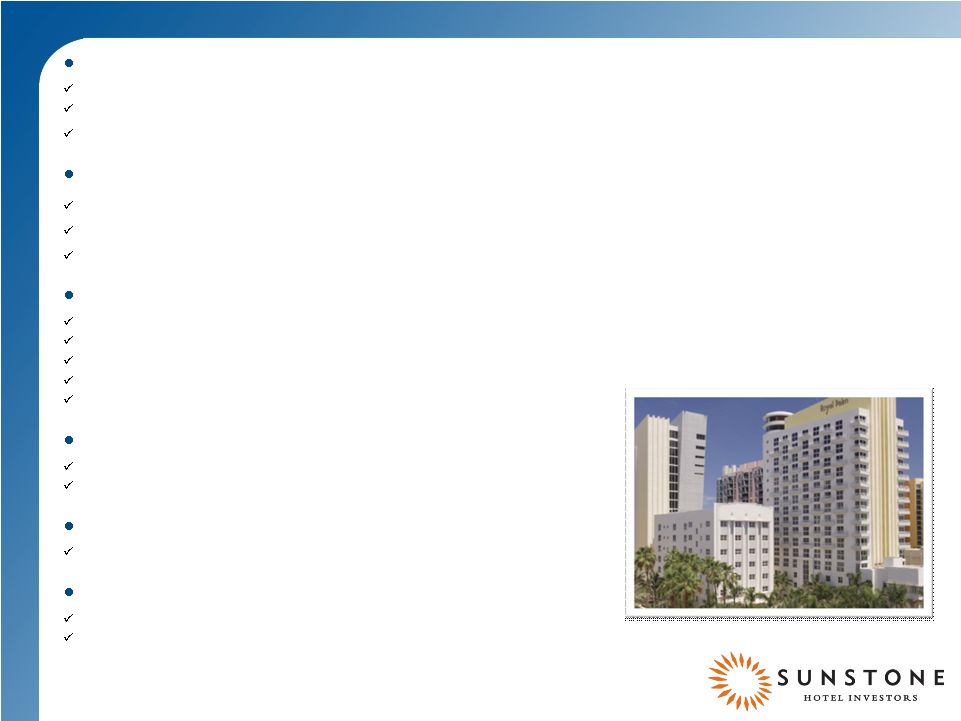
The Royal Palm
World-class asset in prime location
1.9-acres of beachfront real estate in the heart of South Beach
409 guest rooms: two-thirds have ocean views, one-third are
suites Proximity to dining, shopping, entertainment, and the Miami Beach
convention center Attractive market fundamentals
As of June 2010, Miami has recorded the fourth strongest RevPAR
of the top 25 US markets according to STR
Also as of August 2010, Miami has recorded 10.4% RevPAR
growth according to STR
New supply is limited
Value-add opportunity
Rebranding opportunity –
few institutional assets of this scale / quality
Comprehensive renovation and repositioning program
Renovation would improve guestrooms, F&B spaces, and exterior and public
spaces 10,000
sq
ft.
prime
Collins
Avenue
frontage
-
currently
vacant
3 towers allow for staging of renovation
Discount to replacement cost
$286,000 per key acquisition cost for prime South Beach address
Recent comps $650,000 -
$700,000 per room
Long-term benefits to portfolio and credit profile
Grows Sunstone’s asset base without increasing indebtedness
Consistent with our core strengths
Sunstone’s
Renovate,
Reposition,
Rebrand
strategy
is
proven
Hyatt Century Plaza success |
 10
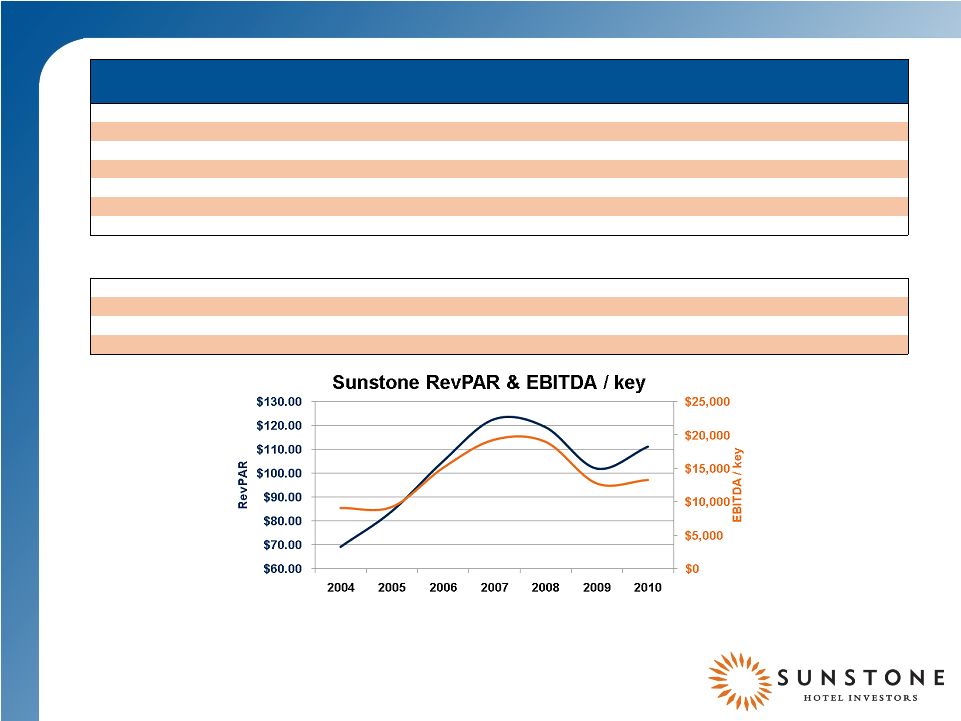
Current Portfolio & Financial Information
SHO Historical Stats / Performance
2004
(1)
2005
(1)
2006
(1)
2007
(1)
2008
(1)
2009
(1)
2010
(2)
Number of Hotels
54
62
51
46
44
38
32
Number of Rooms
13,183
18,069
16,717
16,085
15,029
13,199
12,182
Rooms/Hotel
244
291
328
350
342
347
381
Comparable RevPAR
$69.38
$84.22
$105.11
$120.15
$119.18
$102.09
$111.27
Total Revenue
(in millions)
$489.6
$651.1
$903.1
$1,056.7
$969.2
$717.8
$707.4
Adjusted EBITDA
(in millions)
$120.3
$167.4
$252.1
$310.1
$285.1
$168.6
$161.9
Adjusted EBITDA per key
$9,125
$9,269
$15,080
$19,279
$18,970
$12,774
$13,287
Valuation
Market Value of Equity
$717,297
$1,386,706
$1,551,947
$1,085,218
$300,171
$872,059
$1,215,009
Debt
$712,461
$1,181,178
$1,499,828
$1,722,151
$1,712,765
$1,145,139
$1,415,600
Total Enterprise Value
$1,394,858
$2,717,333
$3,298,996
$3,016,207
$2,113,086
$1,934,848
$2,651,859
Debt to TEV
51%
43%
45%
57%
81%
59%
53%
(1) As reported on earnings releases dated 2/22/05, 2/15/06, 2/7/07, 2/21/08, 2/12/09,
and 2/23/10, respectively. (2) Reflects year-to-date adjusted EBITDA as of
09/30/10 plus the midpoint of fourth quarter guidance as reported on earnings release dated 1/13/11 and
Doubletree Guest Suites Times Square 2010 prior ownership data.
|
 11
Current Portfolio & Financial Information
Average weighted debt maturity: 6.0 years
Average weighted interest rate: 4.72%
Assumed
debt
associated
with
Doubletree
Guest
Suites
Times
Square
of
approximately
$270.0
million
to
be
refinanced
during
2011. |
 12
Near Term Objectives: Enhance Corporate Credit Statistics
Improving credit story
Focus is on measured improvement of credit statistics through portfolio growth
Minimal dilution
Structure transactions with higher equity weighting
Long-term
focus
-
build
strength,
flexibility,
and
positioning
over
the
next
few
years
Position
Sunstone
to
capitalize
on
opportunities
during
the
next
cyclical
trough
Credit targets
18-month:
1.65x
Fixed
Charge
Coverage,
6.0x
Debt
to
EBITDA
As reported in Compliance Certificates to Revolving Credit Agreement s dated 3/18/08, 2/20/09,
11/13/09, and 1/10/11, respectively. |
 13
Primary focus is toward driving rate
Weekly revenue management reviews with all operators
Benchmark hotels using a sophisticated business intelligence system
Roll out beverage cost reduction program throughout portfolio
Average of 300 basis point reduction in beverage cost
Continue menu-maximization effort
Combination of restaurants and bars to Gastro-Bar concept
Continue investing in energy management systems
Energy investments between 2008-2010 of $4 million with 35% IRR
Retro-commissioning/full plant replacements
Continue enhancing charge for parking technology
Parking margin has improved from 55% to 75% with new technology and
elimination of vendors
Optimize laundry efficiency
Recently outsourced laundry operations have eliminated the need for over
$2 million in capital investments and reduced operating expenses
by $500k
Near Term Objectives: Improve Profitability of Existing Hotels
|
 14
Near Term Objectives: Improve Profitability of Existing Hotels
Hotel
Budget
Timing
Scope of Work
Guestrooms
Guest
Bathrooms
Lobby
Meeting
Spaces
Exterior
Royal Palm Miami
Beach
$43.1 million
Q4 2010 –
2013
Embassy Suites
Chicago
$12.3 million
Q3 2010 –
Q1 2011
Marriott Boston
Long Wharf
$18.9 million
Q4 2010 –
2011
Marriott Houston
$10.2 million
Q3 2010 –
2011
Renaissance
Washington DC
$30.4 million
Q4 2010 –
2012
Marriott Quincy
$6.7 million
Q4 2010 –
2011
Renaissance
Orlando
$9.8 million
Q3 2010 –
2011
*
**
Kahler
Grand
Rochester
$8.9 million
Q4 2010 –
2011
***
Hilton Houston
$7.2 million
Q3 2010 –
2011
Marriott Tysons
Corner
$6.6 million
Q4 2010 –
2011
Marriott Rochester
$5.7 million
Q4 2010 –
2011
*64 Executive King Suites
** Creation of a half-acre aquatic playground and a separate 10,000 sq. ft.
function lawn *** 55 Deluxe Rooms
Focused renovation program
Re-evaluated
all
2011
–
2013
projects
by
their
short-
and
long-term
potential
to
generate
incremental EBITDA
Executing on revised 2011 CapEx
plan with focus on minimizing displacement |
 15
Near Term Objectives: Improve Profitability of Existing Hotels
Marriott Boston Long Wharf
Lobby Rendering |
 16
Marriott Tysons Corner
Guestroom Rendering
Near Term Objectives: Improve Profitability of Existing Hotels
|
 17
Renaissance Long Beach
Lobby Renovation
Near Term Objectives: Improve Profitability of Existing Hotels
|
 18
Near Term Objectives: Improve Profitability of Existing Hotels
Renaissance Washington DC
Before Lobby Renovation |
 19
Near Term Objectives: Improve Profitability of Existing Hotels
Renaissance Washington DC
After Lobby Renovation |
 20
Near Term Objectives: Improve Profitability of Existing Hotels
Renaissance Washington DC
After Lobby Renovation |
 21
Near-term Objectives: Increase Portfolio Size and Quality
Early phase of potentially
prolonged cyclical recovery
Objective is to meaningfully
increase the size and quality of
Sunstone’s portfolio over the
next several years
Better visibility
Improved access to capital
Enhanced total returns
Focused on disciplined
acquisitions of institutional
quality hotels
$100+ RevPAR
350+ keys
Top-25 US gateway markets
Upper-upscale in quality
Discount to replacement cost |
 22
Near-term Objectives: Increase Portfolio Size and Quality
2010 Pro-Forma
Sunstone 31-Hotel
Portfolio (1) (2)
Doubletree Guest
Suites Times
Square (3)
Pro-Forma 32-
Hotel Portfolio
No. Keys
11,722
460
12,182
No. Hotels
31
1
32
Avg. Rooms per Hotel
378
460
381
Occupancy
69.6%
93.5%
70.5%
ADR
$149.11
$323.17
$157.83
RevPAR
$103.78
$302.25
$111.27
Adjusted EBITDA (in millions)
$142.4
$19.5
$161.9
Adjusted EBITDA per key
$12,148
$42,391
$13,290
(1) Room statistics reflect current estimate.
(2) Adjusted EBITDA reflects year-to-date as of September 30, 2010 and
midpoint of guidance as provided on 11/4/10. (3) Reflects 2010
estimate. Doubletree Guest Suites Times Square Acquisition
Top quality asset
Exceptional location
Discount valuation
Meaningful potential synergies
with Hilton Times Square
22 |
 23
Communications
Maximize accessibility to senior management team
Continue inter-quarter update calls
Clearly articulate major initiatives
Continue to communicate what we have done rather than what we will do
Team
Build on Sunstone’s “Talent Based”
organization
Add one or more industry leaders into key roles
Complement skills of existing team
Enhance team cohesion and stability
Improve ability to execute on value adding transactions
More results, more fun, less drama
Near Term Objectives: Improve Communication & Enhance Team
|
 24
Sunstone Organizational Structure
Ken Cruse
President
Marc Hoffman
EVP & COO
Bob Alter
Executive Chairman
TBD
CFO
Lindsay Monge
SVP –
Treasury &
Administration
TBD
SVP –Acquisitions
Guy Lindsey
SVP –
Design &
Construction
Bryan Giglia
SVP -
Finance
Building a talent-based organization |
 25
Sunstone Valuation –
Illustrative Scenarios
Based on Company Assumptions -
Actual Results May Differ
RevPAR
111.37
$
Keys
12,182
Debt
1,415.6
Cash
(255.0)
Net Debt
1,160.6
Pref
276.3
Shares
117.6
Share Price
10.50
$
Common Equity
1,234.80
$
TEV
2,671.7
Adjusted EBITDA
161.9
Adjusted EBITDA Multiple
16.5x
TEV / Key
219,311
$
1.38
$
Implied TEV /
Key change with $1.00 increase in stock price 9,654
$
Estimated minimum
replacement cost (3)
300,000
$
Implied stock price at estimated minimum replacement
cost 18.86
$
(1)
RevPAR
reflects
the
pro
forma
comparable
31-hotel
porfolio
RevPAR,
including
prior
ownership
periods
for
the
Doubletree
Guest
Suites
Times
Square.
Adjusted EBITDA reflects year-to-date as of 9/30/10 plus the midpoint of
guidance provided on 11/14/10 and the full-year 2010 EBITDA for the
Doubletree Guest Suites Times Square, including prior ownership.
(2) Represents current renovation budget and implied Adjusted EBITDA calculated
using a 14.0x multiple and total investment of $124.4M. (3) Based on
internal estimates and may not reflect actual replacement cost. Base
(1)
Implied stock price change with 1.0x increase in Adjusted EBITDA
Multiple |
 26
Investment Thesis
Attractively valued compared to peers
Currently trading at approximately $219k / key ($9.7k / key = approx.
$1.00 per share)
Strong liquidity and access to inexpensive capital
Substantial unrestricted cash balance, undrawn revolver
Levered to the recovery
Primarily fixed-rated debt with well-staggered maturities
Clear objectives, simple strategy:
Improve profitability of existing hotels
through a focused asset
management and capital expenditure program
Enhance corporate credit statistics
through a measured and deliberate
approach to balance sheet management
Increase
portfolio
size
and
quality
through
disciplined
acquisitions
Improve communications
and accessibility to investors through frequent
conference calls and investor meetings
Build
a
top-quality
“talent
based”
organization
by
selectively
adding
industry professionals to complement the strengths of the existing team
|
 |
 28
Sunstone 32-Hotel Portfolio
Hotel
City
State
Chain
Scale
Segment
(1)
Service
Category
Rooms
Manager
Marriott
Boston
Massachusetts
Upper Upscale
Full Service
412
Marriott
Marriott
Del Mar
California
Upper
Upscale
Full
Service
284
Marriott
Marriott
Houston
Texas
Upper
Upscale
Full
Service
390
Interstate SHP
Marriott
Park City
Utah
Upper Upscale
Full Service
199
Interstate SHP
Marriott
Philadelphia
Pennsylvania
Upper Upscale
Full Service
289
Marriott
Marriott
Portland
Oregon
Upper Upscale
Full Service
249
Interstate SHP
Marriott
Quincy
Massachusetts
Upper Upscale
Full Service
464
Marriott
Marriott
Rochester
Minnesota
Upper Upscale
Full Service
203
Interstate SHP
Marriott
Troy
Michigan
Upper Upscale
Full Service
350
Marriott
Marriott
Tysons Corner
Virginia
Upper Upscale
Full Service
396
Marriott
Courtyard by Marriott
Los Angeles
California
Upscale
Select Service
179
Interstate SHP
Renaissance Harborplace
Baltimore
Maryland
Upper Upscale
Full Service
622
Marriott
Renaissance Los Angeles Airport
Los Angeles
California
Upper Upscale
Full Service
499
Marriott
Renaissance Long Beach
Long Beach
California
Upper Upscale
Full Service
374
Marriott
Renaissance Orlando at SeaWorld®
Orlando
Florida
Upper Upscale
Full Service
781
Marriott
Renaissance Washington D.C.
Washington, D.C.
District of Columbia
Upper Upscale
Full Service
807
Marriott
Renaissance Westchester
White Plains
New York
Upper Upscale
Full Service
347
Marriott
Residence Inn by Marriott
Rochester
Minnesota
Upscale
Extended Stay
89
Interstate SHP
Fairmont
Newport Beach
California
Luxury
Full Service
444
Fairmont
Hilton
Del Mar
California
Upper Upscale
Full Service
257
Sage
Hilton
Houston
Texas
Upper Upscale
Full Service
480
Interstate SHP
Hilton
Times Square
New York
Upper Upscale
Full Service
460
Interstate SHP
Doubletree
Minneapolis
Minnesota
Upscale
Full Service
229
Interstate SHP
Doubletree
Times Square
New York
Upscale
Full Service
460
Highgate
Embassy Suites
Chicago
Illinois
Upper Upscale
Extended Stay
367
Davidson
Embassy Suites
La Jolla
California
Upper Upscale
Extended Stay
340
Hilton
Hyatt Regency
Newport
Beach
California
Upper Upscale
Full Service
403
Hyatt
Sheraton
Cerritos
California
Upper Upscale
Full Service
203
Interstate SHP
Independent—Valley
River Inn
Eugene
Oregon
Upscale
Full Service
257
Interstate SHP
Independent—Kahler Inn & Suites
Rochester
Minnesota
Midscale
with
F/B
Extended Stay
271
Interstate SHP
Independent—The Kahler Grand
Rochester
Minnesota
Upscale
Full Service
668
Interstate SHP
Independent—Royal Palm
Miami Beach
Florida
Upscale
Full Service
409
Denihan
Total number of rooms
12,182 |