Attached files
| file | filename |
|---|---|
| 8-K - FORM 8-K - Jazz Pharmaceuticals plc | d8k.htm |
EXHIBIT 99.1
Relevant portion of the slides presented by Jazz Pharmaceuticals, Inc. at the J.P. Morgan Healthcare Conference in San Francisco, California on January 12, 2011:
 1
Forward-Looking Statements
This presentation contains forward-looking statements, including, but not limited
to, statements related to Jazz Pharmaceuticals' financial performance and growth
potential, including expectations with respect to 2010 financial results, sales
and earnings growth, and marketing activities, statements related to Jazz
Pharmaceuticals' product candidates, including statements related to continued
development and future regulatory matters, statements related to intellectual
property and patent position, and statements related to new product
opportunities. These forward-looking statements are based on the company's current expectations and
inherently involve significant risks and uncertainties. Jazz Pharmaceuticals' actual
results and the timing of events could differ materially from those anticipated
in such forward-looking statements as a result of these risks and
uncertainties, which include, without limitation, risks related to: Jazz Pharmaceuticals' ability to maintain or
increase
sales
of
its
Xyrem
®
and
Luvox
CR
®
products;
Jazz
Pharmaceuticals'
dependence
on
single
source
suppliers and manufacturers; the uncertain and time-consuming clinical and
regulatory approval process for the company’s
product
candidates,
Jazz
Pharmaceuticals'
cash
flow
estimates;
the
difficulty
and
uncertainties
related
to the protection of intellectual property and defense of patents, including in ANDA
litigation; competition, including generic competition; Jazz Pharmaceuticals'
ability to successfully acquire, in-license or develop additional products
or product candidates to grow its business; and those risks detailed from time-to-time under
the caption "Risk Factors" and elsewhere in Jazz Pharmaceuticals' Securities
and Exchange Commission filings and reports, including in its Quarterly Report
on Form 10-Q for the quarter ended September 30, 2010 filed by Jazz
Pharmaceuticals with the Securities and Exchange Commission. Jazz Pharmaceuticals undertakes no duty
or
obligation
to
update
any
forward-looking
statements
contained
in
this
presentation
as
a
result
of
new
information, future events or changes in its expectations.
"Safe Harbor" Statement under the Private Securities Litigation Reform Act of
1995 |
 2
Jazz Pharmaceuticals Today
•
Growing, profitable pharmaceutical company with high operating leverage
–
Two
products
with
sales
of
$164M
-$168M
in
2010
and
gross
margin
>
90%
1,2
–
$56M
-
$58M
in
2010
adjusted
net
income;
$27M
-
$29M
in
2010
GAAP
net
income
1,2
•
Highly leverageable
commercial organization
–
Specialty
sales
force
targeting
sleep
specialists,
neurologists,
psychiatrists
and
pulmonologists
•
Developing promising new product candidates
•
Strong balance sheet with significant NOLs
•
Committed to sustained growth in sales and earnings
1.
Based on guidance provided on November 4, 2010. Jazz Pharmaceuticals is not updating
the amounts in that prior guidance; however, Jazz Pharmaceuticals currently expects that, for the year ended December 31,
2010, total product sales, GAAP net income and adjusted net income will meet or exceed
the top end of the guidance ranges provided on November 4, 2010. Jazz Pharmaceuticals has not finalized its financial results
for the quarter and year ended December 31, 2010 and its actual results may therefore
differ from its current expectations. 2.
Adjusted net income is a non-GAAP financial measure that excludes
from GAAP net income revenue related to upfront and milestone payments, and certain expenses comprised of loss on extinguishment of debt,
amortization of intangible assets, non-cash interest expense, and stock-based
compensation. A reconciliation of adjusted net income to GAAP net income is in a table included with this presentation. |
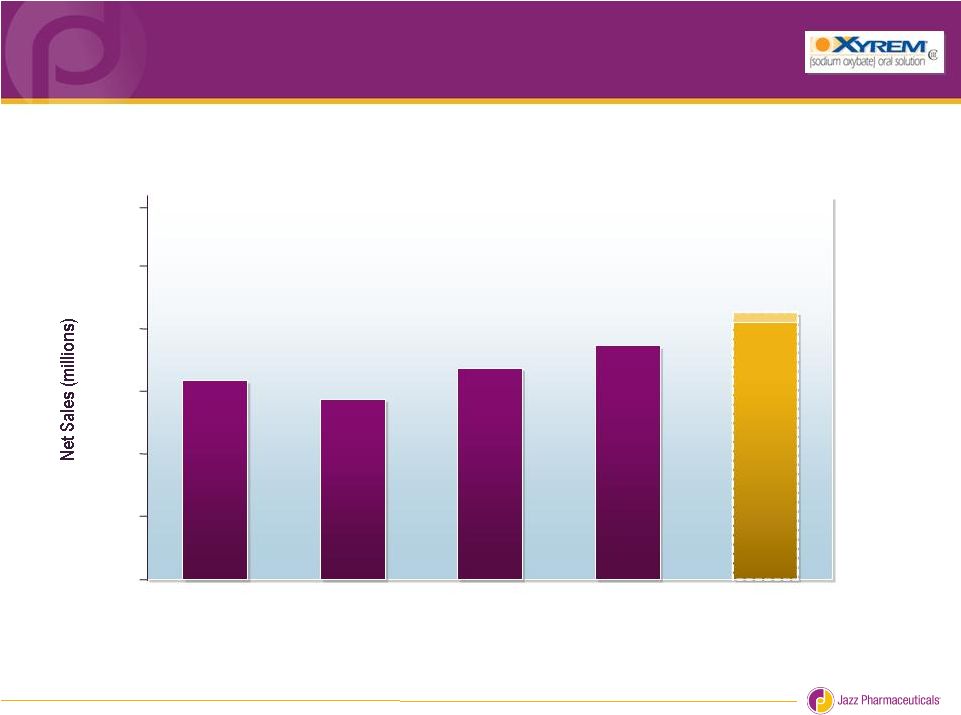 Xyrem
-
Strong Sales Growth
4Q10G
3Q10
2Q10
1Q10
4Q09
Total 2010 Xyrem
Sales $140M -
$142M
1
YOY Sales Growth 45% -
47%
1
$0
$10
$20
$30
$40
$50
$60
$32
$29
$34
$37
$40 -
$42
1
3
1. Based on guidance for 2010 provided on November 4, 2010.
Jazz Pharmaceuticals is not updating the amounts in that prior guidance; however, Jazz Pharmaceuticals currently expects
that, for the year ended December 31, 2010, Xyrem product sales will exceed the top end
of the guidance range provided on November 4, 2010. Jazz Pharmaceuticals has not finalized its
financial results for the quarter and year ended December 31, 2010 and its actual
results may therefore differ from its current expectations. |
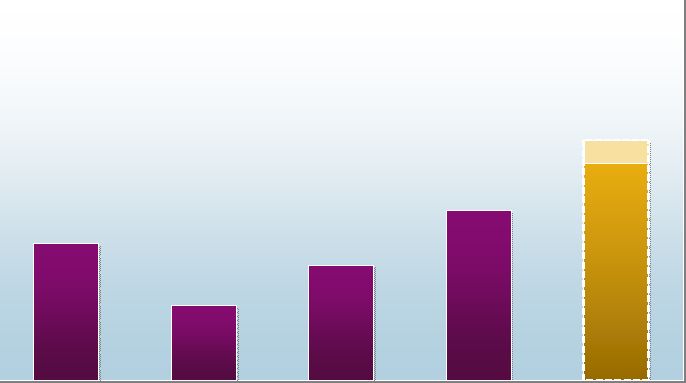
 Luvox
CR –
Continued Sales Growth
Total 2010 Luvox
CR Sales $24M -
$26M
1
YOY Sales Growth 31%-
42%
1
4Q10G
3Q10
2Q10
1Q10
4Q09
$5.7
$5.5
$5.8
$6.6
$6 -
$8
1
$0
$1
$4
$6
$7
$8
$5
$3
$2
$9
4
1. Based on guidance for 2010 provided on November 4, 2010.
Jazz Pharmaceuticals is not updating the amounts in that prior guidance; however, Jazz Pharmaceuticals currently expects that,
for the year ended December 31, 2010, Luvox CR product sales will meet or exceed the
top end of the guidance range provided on November 4, 2010. Jazz Pharmaceuticals has not
finalized its financial results for the quarter and year ended December 31, 2010 and
its actual results may therefore differ from its current expectations.
|
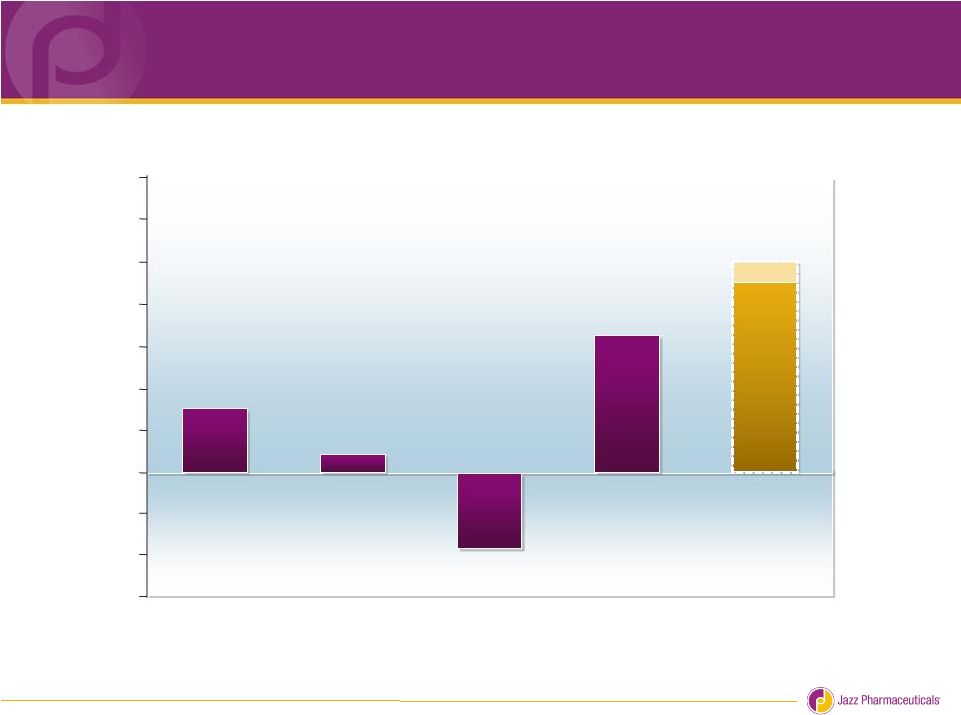 Strong Earnings Growth
2010 GAAP EPS of $0.70 -
$0.75
1
1
Based on guidance for 2010 previously provided on November 4, 2010 and estimated
shares outstanding of 42 million for 4Q10. Jazz Pharmaceuticals is not updating the amounts in that prior
guidance; however, Jazz Pharmaceuticals currently expects that, for the year ended
December 31, 2010, GAAP net income per diluted share will meet or exceed the top end of the guidance range
provided on November 4, 2010. Jazz Pharmaceuticals has not finalized its
financial results for the quarter and year ended December 31, 2010 and its actual results may therefore differ from its
current expectations.
$0.17
$0.04
($0.18)
$0.32
$0.46 -
$0.50
1
4Q10G
3Q10
2Q10
1Q10
4Q09
$0.00
$0.10
$0.20
$0.30
$0.40
$0.50
$0.60
$0.70
-$0.20
-$0.10
-$0.30
5 |
                 6
Strong Earnings Growth
2010 Adjusted EPS of $1.45 -
$1.50
1
$0.33
$0.18
$0.28
$0.41
$0.53 -
$0.58
1
4Q10G
3Q10
2Q10
1Q10
4Q09
$0.00
$0.10
$0.20
$0.30
$0.40
$0.50
$0.60
$0.70
$0.80
$0.90
1
Based on guidance for 2010 previously provided on November 4, 2010 and estimated
shares outstanding of 42 million for 4Q10. Jazz Pharmaceuticals is not updating the amounts in that prior
guidance; however, Jazz Pharmaceuticals currently expects that, for the year ended
December 31, 2010, adjusted net income per diluted share will meet or exceed the top end of the guidance range
provided on November 4, 2010. Jazz Pharmaceuticals has not finalized its
financial results for the quarter and year ended December 31, 2010 and its actual results may therefore differ from its
current expectations.
2
Adjusted net income per diluted share, or Adjusted EPS, is a non-GAAP financial
measure that excludes from GAAP net income per diluted share, or GAAP EPS, revenue related to upfront and
milestone payments, and certain expenses comprised of loss on extinguishment of
debt, amortization of intangible assets, non-cash interest expense, and stock-based compensation. A reconciliation
of Adjusted EPS to GAAP EPS is in a table included with this presentation.
|
  7
2010 Financial Guidance
1
Total Product Sales
$164 –
168M
Xyrem
$140 –
142M
Luvox
CR
$24 –
26M
Gross Margin
> 90%
SG&A
$69 –
71M
R&D
$27 –
28M
GAAP EPS
$0.70 –
0.75
Adjusted EPS
2
$1.45 –
1.50
1.
Based on guidance for 2010 provided on November 4, 2010. Jazz Pharmaceuticals is not
updating the amounts in that prior guidance; however, Jazz Pharmaceuticals currently expects that, for the year ended December
31, 2010, total product sales, Xyrem product sales, Luvox CR product sales, GAAP net
income per diluted share and adjusted net income per diluted share will meet or exceed the top end of the guidance ranges provided
on November 4, 2010. Jazz Pharmaceuticals has not finalized its financial results
for the quarter and year ended December 31, 2010 and its actual results may therefore differ from its current expectations.
2. Adjusted net income per diluted share, or Adjusted EPS, is
a non-GAAP financial measure that excludes from GAAP net income per diluted share, or GAAP EPS, revenue related to upfront and milestone payments, and
certain expenses comprised of loss on extinguishment of debt, amortization of
intangible assets, non-cash interest expense, and stock-based compensation. A reconciliation of Adjusted EPS to GAAP EPS is in a table
included with this presentation. |
   8
Reconciliation of GAAP Net Income and EPS to Adjusted
Net Income and EPS in 2010 Financial Guidance
FY 2010G
1
(In millions, except per share amounts)
GAAP net income
$27-29
Add:
Intangible asset amortization
8
Stock-based compensation expense
8
Non-cash interest expense
2
Loss on extinguishment of debt
12
Deduct:
Contract revenues
(1)
Adjusted net income
$56-58
GAAP net income per diluted share
$0.70-0.75
Adjusted net income per diluted share
$1.45-1.50
Shares used in computing GAAP and adjusted net
income per diluted share amounts
39
1.
Based on guidance for 2010 provided on November 4, 2010. Jazz Pharmaceuticals is not
updating the amounts in that prior guidance; however, Jazz Pharmaceuticals currently expects that, for the year ended
December 31, 2010, GAAP and adjusted net income and GAAP and adjusted net income per
diluted share will meet or exceed the top end of the guidance ranges provided on November 4, 2010. Jazz
Pharmaceuticals has not finalized its financial results for the quarter and year ended
December 31, 2010 and its actual results may therefore differ from its current expectations.
1 |
       9
Reconciliation of Quarterly GAAP to Adjusted Financial
Results and Guidance
In millions, except per share amounts
4Q09
1Q10
2Q10
3Q10
4Q10G
1
GAAP net income
$5.7
$1.5
$(6.4)
$13.2
$19-21
Add:
Intangible asset amortization
2.1
2.1
2.0
1.9
2
Stock-based compensation expense
2.4
1.8
2.0
2.2
2
Non-cash interest expense
1.0
1.0
0.9
0.2
0
Loss on extinguishment of debt
-
-
12.3
-
0
Deduct:
Contract revenues
(0.3)
(0.3)
(0.3)
(0.3)
0
Adjusted net income
$10.9
$6.1
$10.5
$17.2
$22-24
GAAP net income per diluted share
$0.17
$0.04
$(0.18)
$0.32
$0.46-0.50
Adjusted net income per diluted share
$0.33
$0.18
$0.28
$0.41
$0.53-0.58
Shares used in computing:
GAAP net income per diluted share
33.3
34.9
35.4
41.7
42
Adjusted net income per diluted share
33.3
34.9
38.1
41.7
42
1.
Based on guidance for 2010 provided on November 4, 2010. Jazz Pharmaceuticals is not
updating the amounts in that prior guidance; however, Jazz Pharmaceuticals currently expects that, for the year ended
December 31, 2010, GAAP and adjusted net income and GAAP and adjusted net income per
diluted share will meet or exceed the top end of the guidance ranges provided on November 4, 2010. Jazz
Pharmaceuticals has not finalized its financial results for the quarter and year ended
December 31, 2010 and its actual results may therefore differ from its current expectations. |
Relevant portion of the transcript of the oral presentation by Jazz Pharmaceuticals, Inc. at the J.P. Morgan Healthcare Conference in San Francisco, California on January 12, 2011 accompanying the above slides:
Bruce C. Cozadd – Jazz Pharmaceuticals – Chairman and Chief Executive Officer
So, thank you for you attendance, everyone. I am delighted to present an update on Jazz Pharmaceuticals this afternoon. I will be making forward-looking statements you’ll be pleased to hear. But those are, of course, subject to risk factors detailed in our SEC filings.
…
Today, the company is a growing, profitable pharmaceutical company, and I show here some of the guidance that we gave on our 3rd quarter call on November 4th. Two products with sales of $164 to $168 million, with a very healthy growth---- gross margin north of 90%, and adjusted net income of $56 to $58 million in 2010. And I’m happy to tell all of you that we will meet or exceed the top of the range for all of these numbers.
…
We have a very strong balance sheet with significant NOLs. Specifically at year end, our cash will exceed our debt, and our NOLs will exceed $300 million, and we’re very committed to sustaining our growth in both sales and earnings. So, let’s turn to our lead product Xyrem.
…
We’ve seen continued strong sales growth of Xyrem. I show here a quarterly sales, 4th quarter 2009 through 3rd quarter of last year, and then again, our implied guidance for the 4th quarter of 2010. Again, we will meet or exceed the upper end of the range in this guidance for Xyrem sales for the 4th quarter. That’ll give us growth year-over-year in excess of 47%. We’ve seen growth on the price side and growth on the volume side. You see some dip in volume 4th quarter to 1st quarter. That’s a pattern we’ve seen for the last couple of years. Notice I’m saying that to you at the beginning of the 1st quarter of this year, so, just want to prepare you that sometimes it does happen. Specifically, the volume growth we’ve seen 1st quarter ‘10 over 1st quarter ‘09 was 5%; 2nd quarter over 2nd quarter was 6%; 3rd quarter over 3rd quarter was 8.1%; and in the 4th quarter we saw 8.3% volume growth. Some of you know we took a price increase on November 1st. It’s important for us to see that that volume growth has continued very strong through the 4th quarter. And we believe there is room for more growth in use of Xyrem.
…
Let’s turn to our second product, Luvox CR.
…
Sales of Luvox CR also showed nice growth in 2010. Again, this is the quarter progression. Our 4th quarter guidance had been in the range of $6 to $8 million, and again, we will meet or exceed our guidance, which would give us a growth rate of over 40%. Unlike Xyrem, you can track weekly prescriptions of Luvox CR, and we’ve seen nice growth in weekly prescriptions over the balance of the last year.
…
So, let me conclude with a couple of final slides, starting with earnings. I show here the last 4 quarters of reported GAAP EPS along with our guidance for the 4th quarter. We generally report our results as well on an adjusted EPS basis where we back out amortization of intangibles, stock-based compensation, non-cash interest expenses, as well as non-cash revenues, to get to something that we think is a more representative and informative number. If we take those same numbers I presented on the last slide and put them in the adjusted EPS format, the trend is a little easier to understand. We do provide a reconciliation between adjusted EPS and GAAP in all of our filings and press releases and at the back of this presentation. You can see that our guidance for the 4th quarter was in the 53 to 58 cents a share range. Again, we will meet or exceed the upper end of that range when we report our results. So, we’ve come from losing money even on an adjusted EPS basis last year to EPS that will exceed $1.50 in 2010. Our priorities for 2011 shouldn’t be a surprise to anyone in the room: continue to grow and protect the Xyrem business; grow Luvox CR sales as well; make that critical determination to us of whether additional investment pursuing a fibromyalgia indication is a good thing for the company to do; advance the JZP-8 program in acute repetitive seizures; evaluate new product opportunities. The company is in stronger financial shape now. We’re generating a lot of cash. If you take that adjusted EPS number I just gave you for the 4th quarter, multiply by just over 40 million shares, you can see our cash flow generation is already north of $20 million a quarter.