Attached files
| file | filename |
|---|---|
| 8-K - FORM 8-K - Sabra Health Care REIT, Inc. | d8k.htm |
 J.P. MORGAN
HEALTHCARE CONFERENCE
January 10-13, 2011
Exhibit 99.1 |
 FORWARD LOOKING
STATEMENTS 2
Statements made in this presentation that are not historical facts are
“forward-looking” statements (as defined in the Private Securities Litigation
Reform Act of 1995) that involve risks and uncertainties and are subject to change at any
time. These forward-looking statements may include, but are not limited to,
statements containing words such as “anticipate,” “believe,” “plan,” “estimate,” “expect,” “hope,” “intend,” “should,” “may” and similar
expressions. Forward-looking statements in this presentation also include all
statements regarding expected future financial position, results of operations, cash
flows, liquidity, financing plans, business strategy, the expected amounts and timing of dividends and distributions, projected
expenses and capital expenditures, competitive position, growth opportunities, potential
acquisitions and plans and objectives of management for future operations.
Factors that could cause actual results to differ materially from those projected in the forward-looking statements include our
dependence on Sun Healthcare Group, Inc., formerly known as SHG Services, Inc.
(“Sun”), until we are able to diversify our portfolio; our ability to
build the necessary infrastructure to operate as a separate publicly traded company; our
ability to qualify as a real estate investment trust (“REIT”) and to maintain
our REIT status once we qualify; changes in general economic conditions and volatility in financial and credit markets; our ability to pursue
and complete acquisitions and the costs and management attention required to do so; the
significant amount of our indebtedness; covenants in our debt agreements that may
restrict our ability to make acquisitions, incur additional indebtedness and refinance indebtedness on favorable terms;
increases in market interest rates; the impact of healthcare reform legislation on our
business; and competitive conditions in our industry. We caution that any forward-looking statements made in this presentation are not
guarantees of future performance. The forward-looking statements are based on
information currently available. We disclaim any obligation to update any such factors or to announce publicly the results of any revisions
to any of the forward-looking statements to reflect future events or developments.
|
 NON-GAAP
FINANCIAL MEASURES 3
In this presentation, we refer to financial measures that are derived on the basis of
methodologies other than in accordance with generally accepted accounting principles
(“GAAP”). These non-GAAP financial measures are presented in this presentation on a pro forma basis and
include EBITDA, Adjusted EBITDA, FFO and Adjusted FFO. These non-GAAP financial
measures are reconciled to the corresponding pro forma GAAP financial measures in the
Appendices included at the end of this presentation. EBITDA is defined as net income before interest expense (net of interest income), income tax
expense and depreciation and amortization. Adjusted EBITDA is defined as EBITDA
adjusted to include estimated general and administrative expenses and to exclude the effect of estimated
stock-based compensation expense. FFO is calculated in accordance with The National
Association of Real Estate Investment Trusts’ (“NAREIT”) definition of
“funds from operations,” which is net income (computed in accordance with GAAP), excluding gains (or losses) from sales of
property, plus depreciation and amortization, and after adjustments for unconsolidated
partnerships and joint ventures. Adjusted FFO is FFO adjusted to include
estimated general and administrative expenses and to exclude the effect of estimated stock-based compensation expenses
and the amortization of financing fees.
This presentation includes information regarding Sun. Sun is subject to the reporting
requirements of the Securities and Exchange Commission (the “SEC”) and is
required to file with the SEC annual reports containing audited financial information and quarterly reports containing
unaudited financial information. The information related to Sun provided in this presentation
has been provided by Sun or derived from its public filings. We have not independently
verified this information. We have no reason to believe that such information is inaccurate in any
material
respect.
We
are
providing
this
data
for
informational
purposes
only.
Sun’s
filings
with
the
SEC
can
be
found
at
www.sec.gov.
|
 4
Company Overview and
Investment Highlights |
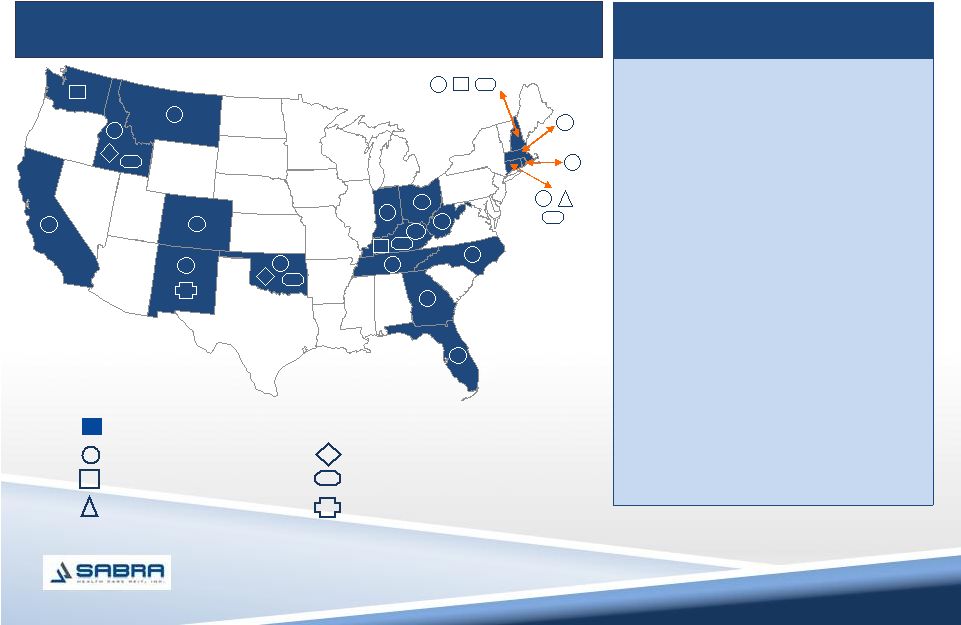 SABRA PROPERTY
PORTFOLIO 5
1
4
1
1
1
3
2
2
1
3
1
1
1
8
2
2
11
1
2
5
5
2
8
3
2
8
1
1
2
1
States with Facilities
Skilled Nursing (Total: 67)
Assisted Living (Total: 5)
Independent Living (Total: 1)
Mental Health (Total: 2)
Multi-Licensed Designation (Total: 10)
CCRC (Total: 1)
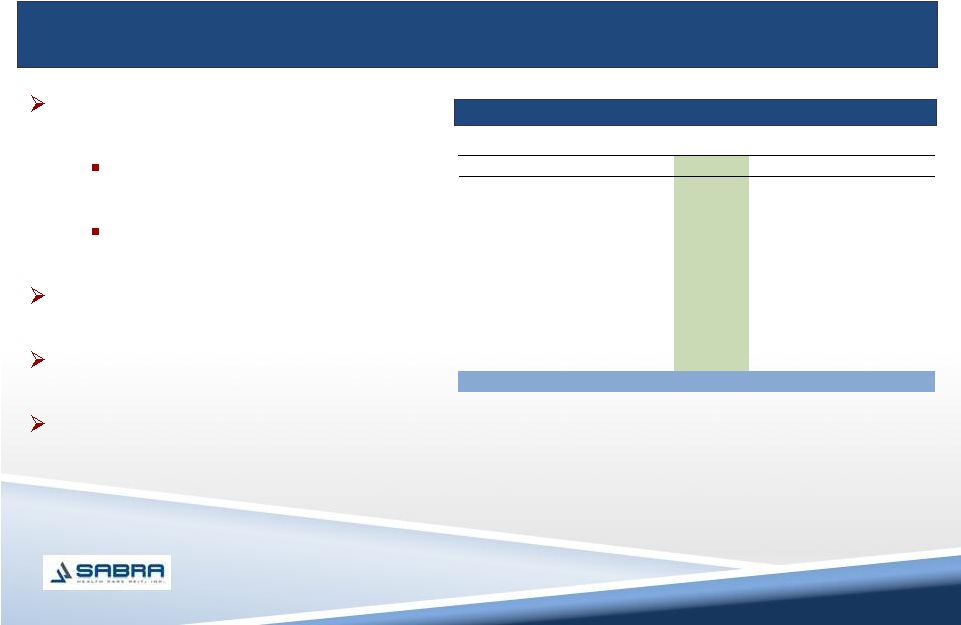
Geographically diversified portfolio of skilled nursing and senior
housing assets
Key Portfolio Metrics
Number of Facilities:
86
Property Type:
Skilled Nursing
SNF/AL/IL
AL
Mental Health
IL
CCRC
67 (78%)
10 (12%)
5 (6%)
2 (2%)
1 (1%)
1 (1%)
Beds:
Licensed
Available
9,603
9,266
States:
19
YTD 9/30/10 PF EBITDARM ($mm):
Margin (%):
$101.4M
19.0%
YTD 9/30/10 SNF Skilled Mix
(1)
:
Patient Days (%):
Revenue (%):
21.8%
39.3%
YTD 9/30/10 Occupancy (%):
88.2%
Facilities w/Specialty Units:
RRS Units
Solana Units
30
21
(1)
Skilled mix defined as Medicare and non-Medicaid managed care patient
days/revenues divided by the total patient days/revenues.
|
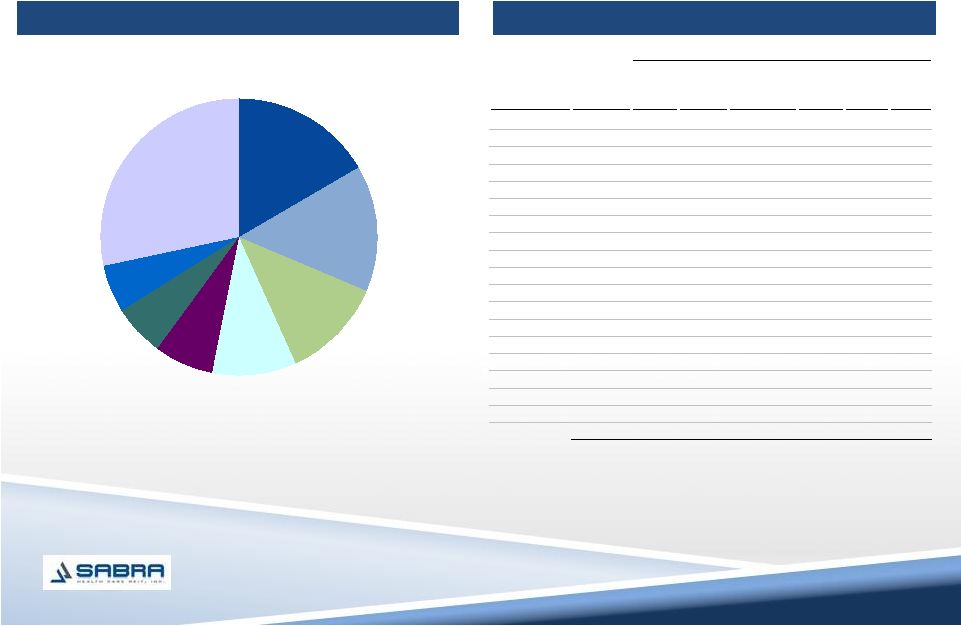 GEOGRAPHICALLY
DIVERSE PORTFOLIO 6
New
Hampshire
17%
Connecticut
15%
Kentucky
12%
Ohio
10%
Florida
7%
Oklahoma
6%
Montana
6%
Other States
27%
Beds / Units by State
86 Properties and 9,603 Beds in 19 States
(1)
“Licensed Beds”
refers to the number of beds for which a license has been issued, which may vary in some
instances from licensed beds available for use, which is used in the computation of
occupancy. Available beds for the 86 properties aggregated 9,266.
Number
of
Licensed
Beds
/
Units
(1)
State
Total
Number of
Centers
Skilled
Nursing
Assisted
Living
Independent
Living
Mental
Health
Total
% of
Total
New Hampshire
15
1,131
474
-
-
1,605
16.7%
Connecticut
10
1,327
23
49
-
1,399
14.6%
Kentucky
15
976
172
-
-
1,148
12.0%
Ohio
8
954
-
-
-
954
9.9%
Florida
5
660
-
-
-
660
6.9%
Oklahoma
5
441
71
12
60
584
6.1%
Montana
4
538
-
-
-
538
5.6%
New Mexico
3
190
120
60
-
370
3.9%
Colorado
2
362
-
-
-
362
3.8%
Georgia
2
310
-
-
-
310
3.2%
California
3
301
-
-
-
301
3.1%
Massachusetts
3
301
-
-
-
301
3.1%
Idaho
3
229
16
-
22
267
2.8%
Rhode Island
2
261
-
-
-
261
2.7%
West Virginia
2
185
-
-
-
185
1.9%
Tennessee
1
134
-
-
-
134
1.4%
North Carolina
1
100
-
-
-
100
1.0%
Indiana
1
88
-
-
-
88
0.9%
Washington
1
-
36
-
-
36
0.4%
Total
86
8,488
912
121
82
9,603
100% |
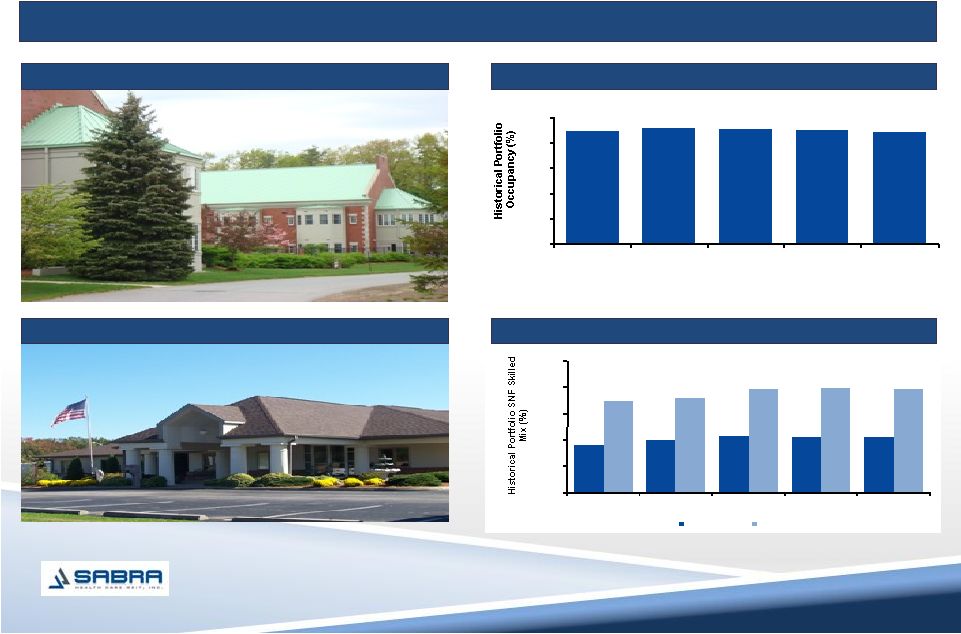 STRONG OPERATOR
PERFORMANCE 7
Strong occupancy and skilled mix trends in the underlying REIT portfolio
Bedford Hills in New Hampshire
Heartland Villa in Kentucky
Historical Portfolio Occupancy
Historical
Portfolio
SNF
Skilled
Mix
(1)
(1)
Skilled mix defined as Medicare and non-Medicaid managed care patient
days/revenues divided by the total patient days/revenues.
89.6%
91.4%
90.9%
90.0%
88.2%
0%
20%
40%
60%
80%
100%
2006
2007
2008
2009
YTD Q3 2010
18.0%
19.7%
21.5%
20.9%
20.8%
34.4%
35.9%
39.2%
39.4%
39.3%
0%
10%
20%
30%
40%
50%
2006
2007
2008
2009
YTD Q3 2010
Patient Days
Revenues |
 FAVORABLE
LONG-TERM LEASE STRUCTURE 8
Triple net master leases with staggered
maturities
10-15 year term, with 5 year renewal
options
Renewal options at time of renewal rates
Lesser of CPI or 2.5% escalators
2.1x EBITDARM lease coverage overall
and 1.6x EBITDAR lease coverage overall
and by master lease
No purchase options
Tenant responsible for insurance, taxes,
utilities, maintenance and repairs
Mandated minimum annual maintenance
and repairs expenditures
Master leases cross-defaulted
Strong structural protections to the REIT with operating flexibility to New Sun
Northrise
CCRC in New Mexico |
 9
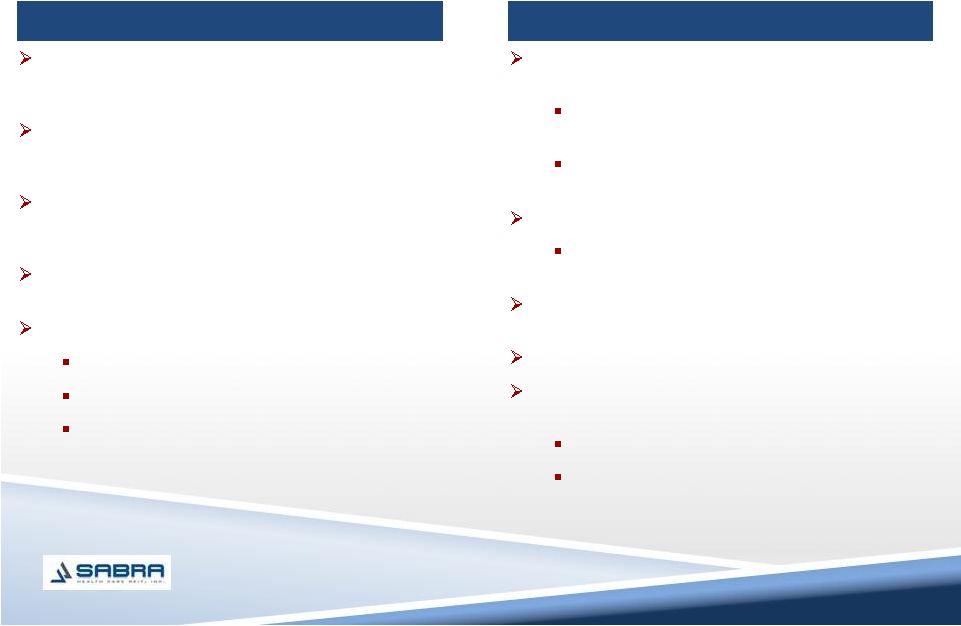
BUSINESS MODEL AND GROWTH OPPORTUNITIES
Focused on acquiring and leasing skilled nursing
and senior housing facilities to strong national,
regional, and local operators
Tenant responsible for property level expenses
such as labor, insurance, property taxes, and
capital expenditures
Tenants provide services to patients and are
reimbursed by Medicare, Medicaid and private
payors
Sabra
receives fixed rent payments from tenants,
with annual escalators of the lower of CPI or 2.5%
Flexible capital structure to support initiatives
Mix of bank, mortgage and unsecured term debt
Limited near-term maturities and amortization
Ample Liquidity
Sabra
Strategy & Business Model
Opportunistically pursue acquisitions and
diversification
Initial focus will be skilled nursing and senior
housing
Diversify by geography, asset class and tenant
within the healthcare sector
Develop new tenant relationships
Leverage management’s extensive network of
relationships
Capital source to underserved operators which
are not the focus of larger healthcare REITs
Strategic capital improvements
In the future, pursue strategic development
opportunities
Replace or renovate existing facilities
Design, develop and construct new facilities
Growth Opportunities |
 10
EXPERIENCED MANAGEMENT TEAM
Dedicated leadership team with over 60 years of relevant experience
Strong and independent Board of Directors
Board
has
significant
leadership,
financial,
industry
and
public
company
experience
Four
of
the
five
Directors
are
“independent”
as
defined
under
applicable
NASDAQ
listing standards; Two of the independent Directors are on the Sun Board
Executive
Relevant
Experience
Profile
Rick Matros
Chairman
and Chief
Executive Officer
20+
Years
Former Sun Healthcare Chairman and CEO
Executive of healthcare companies for over 20 years
Harold Andrews, Jr.
Chief Financial Officer
20+
Years
Managing
Partner of Journey Health Properties, LLC and
Journey Lane 5, LLC
Former Chief Financial Officer of CareMeridian
Former Senior
Audit
Manager
for Arthur Andersen LLP
Talya
Nevo-Hacohen
Chief Investment Officer
20+
Years
Former Managing Director with Cerberus
Real Estate Capital
Management, LLC
Former SVP –
Capital Markets and Treasurer for HCP, Inc. from
2003 –
2006
Former VP –
Goldman Sachs
& Co. |
 Industry
Overview 11 |
 12
AGING POPULATION DRIVES DEMAND
65+ and 85+ population projected to increase 36% and 14%, respectively, by 2020
Number of SNF beds has steadily declined, creating favorable supply/demand
dynamics
Limits on new nursing home construction (CON states)
Healthcare
policy
favors
SNFs
–
payors
focused
on
driving
seniors
to
skilled
nursing facilities, the lowest cost setting of care
65+ Population Growth
85+ Population Growth
40.2
54.8
63.9
72.1
77.5
81.2
46.8
13.0%
14.5%
16.3%
18.3%
19.9%
20.0%
19.8%
0.0
30.0
60.0
90.0
2010
2015
2020
2025
2030
2035
2040
0.0%
5.0%
10.0%
15.0%
20.0%
25.0%
30.0%
CAGR = 2.4%
(population in millions)
5.8
6.6
7.2
8.7
11.5
14.2
6.3
2.3%
3.5%
2.9%
2.0%
1.9%
1.9%
1.8%
0.0
3.0
6.0
9.0
12.0
15.0
2010
2015
2020
2025
2030
2035
2040
0.0%
1.0%
2.0%
3.0%
4.0%
CAGR = 3.0%
(population in millions)
65+ Population
% of Total Population
85+ Population
% of Total Population
Source: U.S. Census Bureau
Source: U.S. Census Bureau |
 13
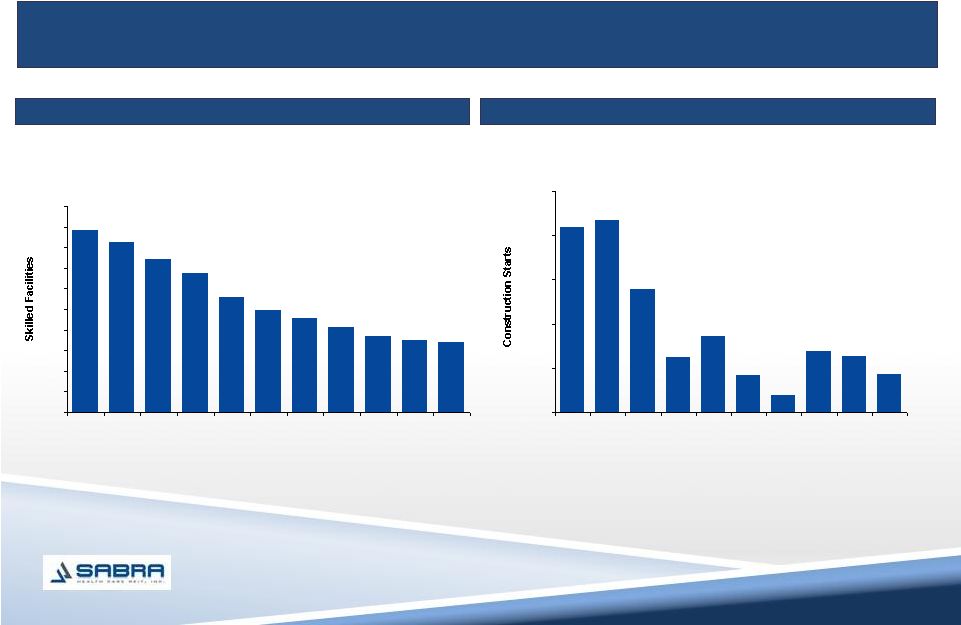
DECREASING BED SUPPLY
Sabra
will benefit from attractive supply / demand fundamentals within
the skilled nursing and senior housing sectors
Trend in Skilled Nursing Facilities
Senior Housing Construction Starts in Top 31 Metros (Units)
(figures in 000s)
Source: American Health Care Association (AHCA).
Source: Q1’10 NIC Map Data Construction Monitor for the top 31 metro
markets. 16.8
16.7
16.5
16.3
16.1
16.0
15.9
15.8
15.7
15.7
15.7
15.0
15.2
15.4
15.6
15.8
16.0
16.2
16.4
16.6
16.8
17.0
Jun-
00
Jun-
01
Jun-
02
Jun-
03
Jun-
04
Jun-
05
Jun-
06
Jun-
07
Jun-
08
Jun-
09
Jun-
10
4,184
4,335
2,773
1,245
1,716
842
374
1,385
1,257
870
0
1,000
2,000
3,000
4,000
5,000
4Q07
1Q08
2Q08
3Q08
4Q08
1Q09
2Q09
3Q09
4Q09
1Q10 |
 14
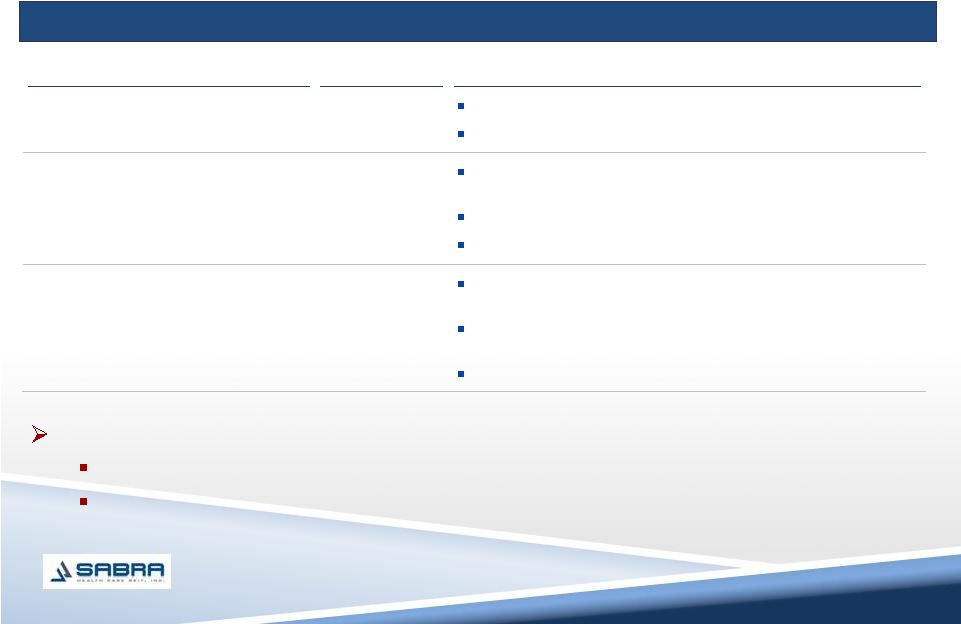
SHIFT OF PATIENT CARE TO LOWER COST ALTERNATIVES
Sabra
will benefit from the increasing shift of patients toward SNF facilities
SNFs
deliver effective clinical
outcomes at lower costs
Increased Medicare funding for
treatment of high-acuity patients
Lower staffing requirements and
associated costs
60% rule driving high-acuity patients
from inpatient rehab facilities
Short stay outlier policy shifting
patients from LTACs
to SNFs
Shorter length of stays for SNFs
Skilled nursing facilities are a lower cost setting
Comparison of Per Case Rates
SNF
IRF
LTAC
Tracheotomy with Vent
$10,051
$26,051
$115,463
Respiratory with vent
7,897
26,051
74,689
Joint Replacement
6,165
17,135
67,104
Hip Fracture
10,618
18,487
44,633
Stroke
8,905
34,196
31,496
Average
$8,727
$24,384
$66,677
Source: MedPac. |
 15
REIMBURSEMENT UPDATE
Medicare:
Implemented
new
Resource
Utilization
Group
(RUGs
IV)
system
effective
October
1,
2010
13 new RUG categories focused on medically complex
Elimination of lookback
period and change in concurrent therapy
Should provide opportunity for greater skilled mix and rate growth
|
 Sun Healthcare
Overview 16 |
 17
SUN OVERVIEW
Inpatient
SunBridge
(Skilled Nursing)
202 inpatient facilities
19,500 patients/residents
SolAmor
(Hospice)
Growing business operating in 8 states
SunDance
(Rehab)
476+ contracts / 344 non-affiliated
Contract services, rehab agency, management
services
CareerStaff
(Staffing)
Primarily hospital setting (also serve
SNFs, schools, prisons)
More than 50% of billings are for therapists (also
provide nursing / pharmacy services)
Medicaid
41%
Medicare
29%
Private pay /
other
30%
Net Revenue by Business
Net Revenue by Source
9/30/10 LTM Net Revenue = $1.9 billion
9/30/10 LTM Net Revenue = $1.9 billion
Inpatient
89%
SunDance
6%
CareerStaff
5% |
 18
INPATIENT CENTERS
Sun operates 202 inpatient centers in 25 states
Number of Facilities Per State
States with Facilities
(1)Skilled mix defined as number of Medicare and non-Medicaid managed care
patient days divided by the total number of patient days.
Key Portfolio Metrics
Number of Centers
202
Property Type:
Skilled Nursing
SNF/AL/IL
AL
Mental Health
IL
CCRC
166 (82%)
15 (7%)
10 (5%)
8 (4%)
2 (1%)
1 (1%)
Beds:
Licensed
Available
23,189
22,407
States
25
YTD 9/30/10 Adjusted EBITDAR
Margin
$177,609
12.5%
YTD
9/30/10
SNF
Skilled
Mix
%
(1)
19.2%
YTD 9/30/10 Occupancy %
87.1%
Facilities w/Specialty Units:
RRS Units
Solana Units
67
46
5
15
5
11
1
1
9
1
9
8
9
7
9
9
8
20
2
17
7
3
1
10
2
18
15 |
 19
FINANCIALLY SECURE PRIMARY TENANT
Attractive Business Profile and Premium Assets
23,189 licensed beds
87.1% occupancy; 19.2% SNF skilled mix as of Sept 30, 2010
Strong Operating Performance
$1.9 billion LTM 9/30/10 Pro Forma Revenue
$237.1 million LTM 9/30/10 Pro Forma Adjusted EBITDAR
Balance Sheet Strength
$78.4
million
in
pro
forma
net
debt
as
of
6/30/10
(1)
23% / 77% pro forma Debt-to-Equity ratio as of 6/30/10
Transparency and Visibility
Public entity
(1)
New Sun debt excludes $75 million under a new Deposit LC Facility held in a
restricted cash account to collateralize LCs. 202 inpatient facilities across 25 states; 476+
SunDance rehab contracts Sabra Management team has close
knowledge of Sun’s operations |
 20
Financial Overview |
 21
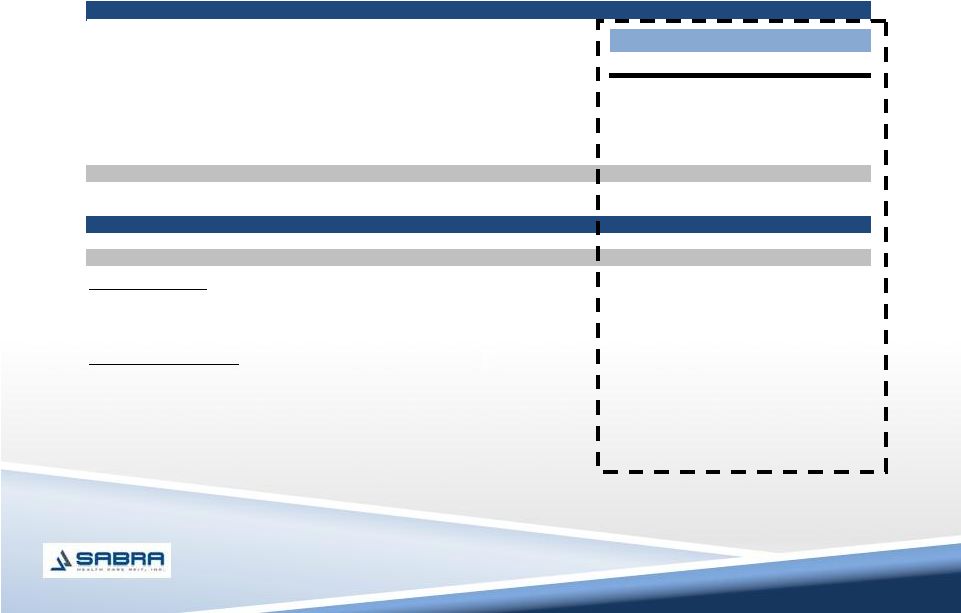
FINANCIAL SUMMARY
Sabra
Health Care REIT, Inc. –
Pro Forma
Income Statement Items
Balance Sheet Items
Annualized
9 Months
09/30/10
Revenue
$70.2
G & A
(2)
7.5
Adjusted EBITDA
(3)
65.1
FFO
(4)
40.1
AFFO
(5)
36.3
As of
09/30/10
Cash
$65.0
Real Estate, Net Book Value
486.2
Real Estate, Cap Rate
(6)
720.0
Total Debt
387.2
Liquidity
(7)
152.6
(1)
The annualized totals set forth in the table below were determined by taking the applicable
totals for the nine months ended September 30, 2010, and multiplying by one and one
third. (2)
Standalone general and administrative costs are projected to be between $6.6 million and $7.5
million in the first year after the restructuring. General and administrative costs are
not included on the pro forma income statement. (3)
Adjusted EBITDA deducts $5.1 million in estimated standalone cash G&A costs that are not
included on the pro forma income statement; excludes $2.4 million in stock-based
compensation. (4)
FFO defined as net income plus depreciation and amortization. Does not include estimated
standalone G&A costs. (5)
AFFO
adjusted
to
include
estimated
standalone
cash
G&A
costs
and
to
exclude
amortization
of
financing
fees.
(6)
Based on cap rate of 9.75% and $70.2 million annual revenue.
(7)
Liquidity includes $65.0 million in cash and $87.6 million in Revolver borrowing base
availability at close, 11/15/2010. (Dollars in millions)
(1) |
  22
PRO FORMA RECONCILIATION SECTION
Sabra
Health Care REIT, Inc. Reconciliation to
Pro Forma FFO, AFFO and Adjusted EBITDA
(Dollars in millions)
Proforma
Proforma
For the Nine
For the Nine
Months Ended
Months Annualized
September 30, 2010
September 30, 2010
Revenue
52.7
$
70.2
$
Net income
12.2
16.2
Add: D&A
17.9
23.9
FFO
30.1
$
40.1
$
Less: Estimated G&A Expenses
(5.6)
(7.5)
Add: Estimated Non-Cash Compensation
1.8
2.4
Add: Amortization of Financing
Fees 1.0
1.3
Adjusted FFO
27.3
$
36.3
$
Add: Cash Interest
21.5
28.8
Adjusted EBITDA
48.8
$
65.1
$
Note: Pro forma Net income and FFO do not
include general and administrative expenses, which are projected to be between $6.6 million
and $7.5 million. |
 23
PRO FORMA CAPITALIZATION
($ in millions)
Capitalization
As of September 30, 2010
Existing Sun
Cash and Cash Equivalents
$67.2
New Revolver ($100)
$0.0
Mortgage Notes Payable
162.2
Total Secured Debt
$162.2
New Senior Unsecured Notes
225.0
-
Total Debt
$387.2
Common Stockholders' Equity
123.7
Total Capitalization
$510.9
Other Financial Data
Adjusted EBITDA
(2)
$65.1
(3)
Net Cash Interest Expense
(4)
28.3
Summary Credit Statistics
Total Secured Debt / Adjusted EBITDA
2.49x
Total Debt / Adjusted EBITDA
5.95x
Net Debt / Adjusted EBITDA
4.92x
Adjusted EBITDA / Net Cash Interest Expense
2.30x
(1)
.
(1)
Reflects $156.7 million outstanding as of September 30, 2010 plus additional refinancings in
September – October 2010. (2)
Annualized based on EBITDA for the 9 months ended September 30, 2010.
(3)
Includes estimated cash standalone costs of $5.1 million (excludes $2.4 million of
non-cash compensation). (4)
Annualized based on pro forma debt balances. Excludes amortization of financing fees.
|
 24
RESPONSIBLE FINANCIAL POLICY
Maintain a limited secured capital structure
Maintain conservative capitalization
Maintain significant liquidity
Structure initial acquisitions with triple-net leases
Initially pay dividends of 80% of adjusted funds from operations
(AFFO)
(1)
each quarterly period
(1)
FFO adjusted to eliminate the impact of non-cash compensation and to add back
the amortization of financing fees. |
 25
INVESTMENT HIGHLIGHTS SUMMARY
Geographically
Diverse Portfolio
Attractive Industry
Fundamentals
Favorable Long-Term
Lease Structure
Strong Lease
Coverage
Strong Asset
Coverage
Financially Secure
Primary Tenant
Growth
Opportunities
Experienced
Management Team |