Attached files
| file | filename |
|---|---|
| 8-K - FORM 8-K - LABARGE INC | c62247e8vk.htm |
Exhibit 99.1

| Corporate Overview January 2011 |

| 2 This presentation contains forward-looking statements within the meaning of the Private Securities Litigation Reform Act of 1995. These statements reflect management's current expectations and involve a number of risks and uncertainties. Actual results may differ materially from such statements due to a variety of factors that could adversely affect LaBarge, Inc.'s operating results. These risks and factors are set forth in documents LaBarge, Inc. files with the Securities and Exchange Commission, specifically in the Company's most recent Annual Report on Form 10-K, and other reports it files from time to time. These forward-looking statements speak only as of the date such statements were made, or as of the date of the report or document in which they are contained, and the Company undertakes no obligation to update such information. Forward-Looking Statements This presentation is dated January 13, 2011. |

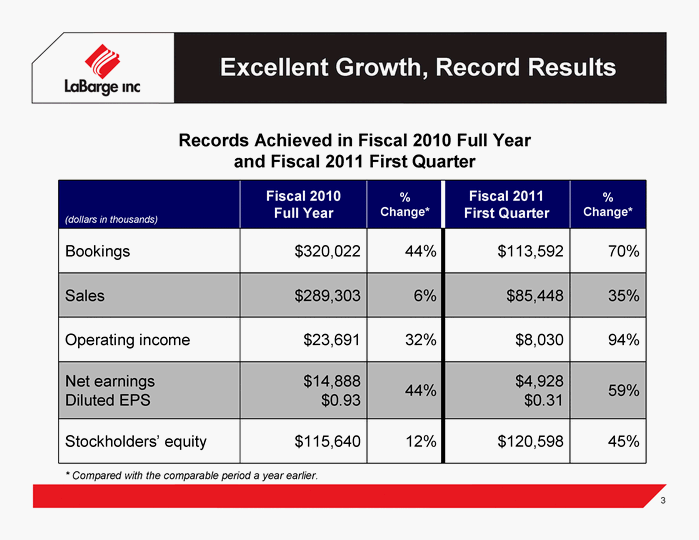
| Excellent Growth, Record Results (dollars in thousands) Fiscal 2010 Full Year % Change* Fiscal 2011 First Quarter % Change* Bookings $320,022 44% $113,592 70% Sales $289,303 6% $85,448 35% Operating income $23,691 32% $8,030 94% Net earnings Diluted EPS $14,888 $0.93 44% $4,928 $0.31 59% Stockholders' equity $115,640 12% $120,598 45% 3 Records Achieved in Fiscal 2010 Full Year and Fiscal 2011 First Quarter * Compared with the comparable period a year earlier. |

| Significant Achievements 10-year compound annual growth rate: Sales: 14% Earnings: 25% Outstanding operational performance Increased customer demand across all key markets Bookings of new business continuing at a strong pace Benefit of Appleton acquisition Addition of sales and earnings Gross margin improvement at the facility Expanded capabilities through increased investment in new manufacturing technologies and facility upgrades LB was able to respond quickly when economy improved Outperforming direct competition, overall EMS industry and most industrial companies 4 |

| What Sets Us Apart Our defendable niche Provides a competitive advantage Our growth prospects Continue to be excellent Our financial strength Validates LaBarge's staying power Our performance culture High-performance environment focuses on innovative problem solving 5 |

| A Return to Growth With Record Results 6 Bookings, Sales & Earnings - Last 10 Years (dollars in millions) |

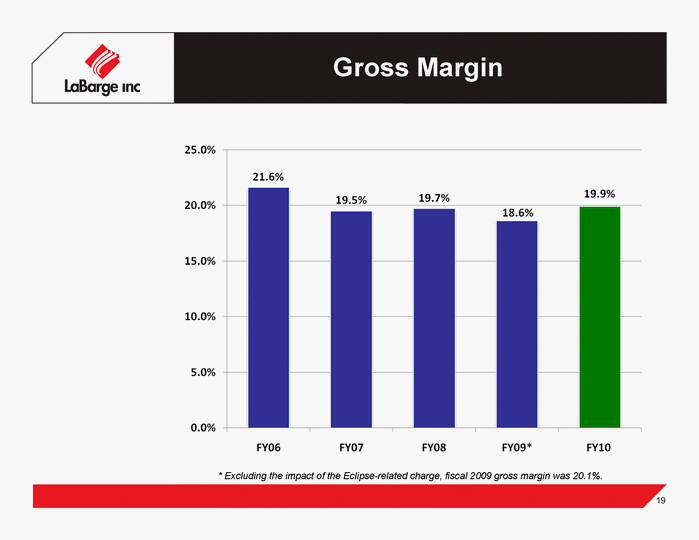
| 7 Electronics Manufacturing Services Our focused niche is a differentiator within the EMS industry Niche is defined by: High complexity High rate of change Low production volumes Trend toward outsourcing within this niche is in its early stages Our full-year gross margins have ranged between 18.6% and 21.6% in the last five years |

| Competitive Advantage - Full-Service Provider Broad-based specialized capabilities Manufacturing capabilities are backed by value-added services, including engineering and design support, prototyping, program management and testing Printed circuit card assemblies Systems integration Interconnect systems Higher-level assemblies 8 |

| High Reliability in Demanding Environments Missile systems Radar systems Aircraft applications Shipboard systems Defense Medical Surgical systems Patient monitoring and therapy devices Respiratory care devices Biodecontamination equipment Wind power generation systems Oilfield services equipment Mine automation Agricultural applications Natural Resources Glass container manufacturing systems Electronic test equipment Semiconductor capital equipment Industrial 9 |

| Diverse Market Approach Net Sales - $311.6 million (for 12 months ended October 3, 2010) 10 |

| Natural Resources Defense Defense Natural Resources Industrial Natural Resources Medical Defense Defense Defense and Aerospace 7 of top 12 customer relationships span more than 10 years Defense Defense 11 7 of top 12 customer relationships span more than 10 years Established Customer Relationships 11 |

| Solid, Secure Position in the Defense Market Sector Extensive diversification across military platforms, programs and prime contractors helps insulate LaBarge against defense cuts No material concentration in any single defense program LaBarge manufactures for approximately 70 different defense programs Across virtually all platforms: aircraft, rotorcraft, missile systems, land vehicles, navy ships, radars, etc. All prime contractors are customers Key defense programs include: Black Hawk helicopter - Standard Missile F-35 Lightning II - MESA Radar Joint Standoff Weapon (JSOW) - Patriot Missile G/ATOR - V-22 Osprey 12 |

| U.S. Manufacturing Manufacturing facilities in six states 1,600 employees Headquartered in St. Louis, Mo. 13 |

| Operational Initiatives Produce Improved Efficiencies Operational excellence Driving continuous improvement Lean manufacturing and Six Sigma Supply chain initiative Increased purchasing power Reduced costs Improved bidding performance Improved tools Production planning processes New Model Introduction processes 14 |

| Internal growth - continuously develop existing operations Maintain strong pipeline of new business opportunities Expand and develop core competencies Continuous improvement Acquisitions - identify candidates that: Are compatible with our core electronics manufacturing business Bring new or expanded customer relationships and capabilities Are accretive to our EPS Growth Strategy 15 |

| Bookings Bookings - Last Five Years (dollars in millions) Bookings - Last Five Quarters (dollars in millions) 16 FY09 includes a reduction of $39.6 million related to the Eclipse Aviation bankruptcy. |

| Backlog (dollars in millions) * Includes a reduction of $39.6 million related to the Eclipse Aviation bankruptcy. 17 |

| Net Sales 18 (dollars in millions) |

| Gross Margin * Excluding the impact of the Eclipse-related charge, fiscal 2009 gross margin was 20.1%. 19 |

| Diluted Net Earnings Per Share * Includes a one-time after-tax net charge of $0.23 per diluted share related to the Eclipse bankruptcy. 20 |

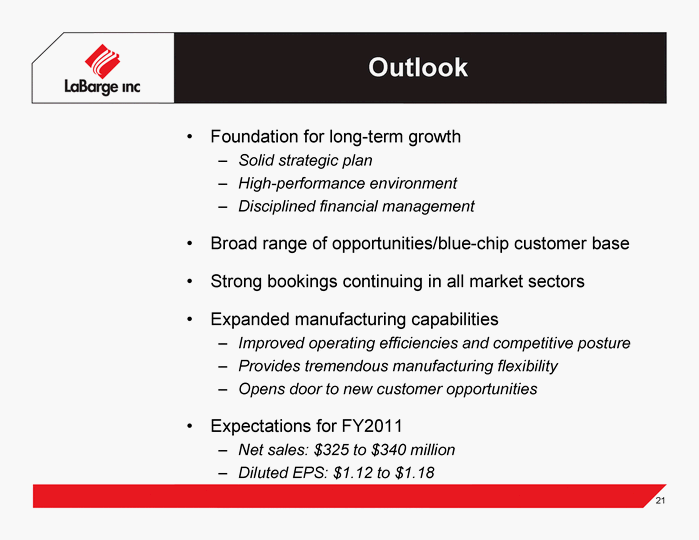
| Outlook Foundation for long-term growth Solid strategic plan High-performance environment Disciplined financial management Broad range of opportunities/blue-chip customer base Strong bookings continuing in all market sectors Expanded manufacturing capabilities Improved operating efficiencies and competitive posture Provides tremendous manufacturing flexibility Opens door to new customer opportunities Expectations for FY2011 Net sales: $325 to $340 million Diluted EPS: $1.12 to $1.18 21 |

| 22 Appendix |

| Cash Flow vs. Cap Ex 23 Net Cash Provided by Operating Activities vs. Capital Expenditures (dollars in millions) |

| Total Debt-to-Equity Ratio/ EBITDA Interest Coverage 24 EBITDA Coverage of Interest Expense Total Debt-to-Equity Ratio |

| Quarterly Performance FY10 Q1 FY10 Q2 FY10 Q3 FY10 Q4 FY11 Q1 Net sales $63,155 $69,000 $74,735 $82,413 $85,448 Gross margin 19.4% 19.9% 20.6% 19.8% 20.4% Diluted net EPS $0.19 $0.18 $0.26 $0.30 $0.31 EBITDA coverage of interest expense 12.51x 16.88x 23.17x 27.01x 25.64x Backlog $171,712 $180,528 $190,350 $198,727 $226,876 (dollars in thousands, except per-share amounts) 25 |

| Supplemental Information 26 The Company calculates Earnings before Interest, Income Taxes, Depreciation and Amortization ("EBITDA") as net earnings (loss) before interest expense, income tax expense (benefit), and depreciation and amortization expense. EBITDA is also before the cumulative effect of a change in accounting principle, if applicable. EBITDA is not a measure of financial performance under GAAP. Accordingly, it should not be considered as a substitute for net earnings (loss), operating earnings (loss), cash flow provided by operating activities, or other income or cash flow data prepared in accordance with GAAP. However, the Company's management believes that EBITDA may provide additional information with respect to the Company's performance or ability to meet its future debt service, capital expenditures and working capital requirements. Because EBITDA excludes some, but not all, items that affect net earnings and may vary among companies, the EBITDA presented by LaBarge, Inc., may not be comparable to similarly titled measures of other companies. The Company calculates Earnings before Interest, Income Taxes, Depreciation and Amortization ("EBITDA") as net earnings (loss) before interest expense, income tax expense (benefit), and depreciation and amortization expense. EBITDA is also before the cumulative effect of a change in accounting principle, if applicable. The Company calculates EBITDA coverage of interest expense as interest expense divided by EBITDA. This ratio is not a measure of financial performance under GAAP. Accordingly, it should not be considered as a substitute for net earnings (loss), operating earnings (loss), cash flow provided by operating activities, or other income or cash flow data prepared in accordance with GAAP. However, the Company's management believes that EBITDA coverage of interest expense may provide additional information with respect to the Company's performance or ability to meet its future interest rate payment requirements. Because EBITDA coverage of interest expense excludes some, but not all, items that affect net earnings and may vary among companies, the ratio presented by LaBarge, Inc., may not be comparable to similarly titled measures of other companies. Reconciliation of EBITDA to Net Earnings (dollars in thousands, except per-share amounts) FY06 FY07 FY08 FY09 FY10 FY10 Q1 FY10 Q2 FY10 Q3 FY10 Q4 FY11 Q1 Net sales $ 190,089 $ 235,203 $ 279,485 $ 273,368 $ 289,303 $ 63,115 $ 69,000 $ 74,735 $ 82,413 $ 85,448 Net earnings $ 9,708 $ 11,343 $ 14,827 $ 10,338 $ 14,888 $ 3,103 $ 2,837 $ 4,128 $ 4,820 $ 4,928 PLUS: Interest expense $ 2,083 $ 2,241 $ 1,459 $ 1,294 $ 1,711 $ 508 $ 421 $ 400 $ 382 $ 398 Income tax expense $ 6,256 $ 6,656 $ 9,011 $ 6,329 $ 7,147 $ 505 $ 1,569 $ 2,516 $ 2,557 $ 2,710 Depreciation and amortization $ 4,588 $ 5,030 $ 5,290 $ 6,930 $ 9,289 $ 2,238 $ 2,278 $ 2,223 $ 2,559 $ 2,168 EBITDA $ 22,635 $ 25,270 $ 30,587 $ 24,891 $ 33,035 $ 6,354 $ 7,105 $ 9,267 $ 10,318 $ 10,204 EBITDA $ 22,635 $ 25,270 $ 30,587 $ 24,891 $ 33,035 $ 6,354 $ 7,105 $ 9,267 $ 10,318 $ 10,204 Interest expense $ 2,083 $ 2,241 $ 1,459 $ 1,294 $ 1,711 $ 508 $ 421 $ 400 $ 382 $ 398 EBITDA Coverage of Interest Expense 10.87 11.28 20.96 19.24 19.31 12.51 16.88 23.17 27.01 25.64 (EBITDA divided by interest expense) |

| Supplemental Information 27 Recap of Total Debt to Equity Ratio (dollars in thousands) 7/2/2006 7/1/2007 6/29/2008 6/28/2009 6/27/2010 Short-term borrowings $ 19,475 $ 14,825 $ 10,500 $ - $ - Current maturities of long-term debt $ 5,791 $ 6,300 $ 4,682 $ 6,162 $ 12,069 Long-term debt $ 16,402 $ 5,131 $ 447 $ 39,326 $ 25,258 Total Debt $ 41,668 $ 26,256 $ 15,629 $ 45,488 $ 37,327 Stockholders' Equity $ 64,834 $ 76,410 $ 91,469 $ 103,151 $ 115,640 Total Debt to Equity Ratio 64% 34% 17% 44% 32% (Total debt divided by stockholders' equity) |

| Supplemental Information Unaudited Reconciliation of GAAP Results to Non-GAAP Measures Unaudited Reconciliation of GAAP Results to Non-GAAP Measures Three Months Ended December 28, 2008 (dollars in thousands, except per-share amounts) Non-GAAP Pre-Charge Operating Results Adjustments for Eclipse Charge Post-Charge GAAP Results Net sales $ 68,207 $ - $ 68,207 Costs and expenses: Cost of sales $ 53,729 $ 4,226 (1) $ 57,955 Selling and administrative expense $ 7,759 $ 1,883 (2) $ 9,642 Interest expense $ 145 $ - $ 145 Other expense, net $ 6 $ - $ 6 Earnings before income taxes $ 6,568 $ 6,109 $ 459 Income tax expense $ 2,580 $ 2,370 $ 210 Net earnings $ 3,988 $ 3,739 $ 249 Diluted net earnings per share $ 0.25 $ 0.23 $ 0.02 Write-down of Eclipse inventory Write-off of Eclipse accounts receivable ($3,676) and reduction of accrued incentive compensation ($1,739) 28 |

| Contact Information Colleen Clements Director, Corporate Communications and Investor Relations LaBarge, Inc. 314-812-9409 colleen.clements@labarge.com 29 |
