Attached files
| file | filename |
|---|---|
| EX-99.1 - TRANSCRIPT OF ALCOA INC. FOURTH QUARTER 2010 EARNINGS CALL - Howmet Aerospace Inc. | dex991.htm |
| 8-K - FORM 8-K - Howmet Aerospace Inc. | d8k.htm |
 4
th
Quarter 2010 Earnings Conference
January 10, 2011
Alcoa Logo
Exhibit 99.2 |
 Alcoa
Logo
Cautionary Statement
Forward-Looking Statements
This
presentation
contains
statements
that
relate
to
future
events
and
expectations
and
as
such
constitute
forward-looking
statements
within
the
meaning
of
the
Private
Securities
Litigation
Reform
Act
of
1995.
Forward-looking
statements
include
those
containing
such
words
as
“anticipates,”
“estimates,”
“expects,”
“forecasts,”
“intends,”
“outlook,”
“plans,”
“projects,”
“should,”
“targets,”
“will,”
or
other
words
of
similar
meaning.
All
statements
that
reflect
Alcoa’s
expectations,
assumptions,
or
projections
about
the
future
other
than
statements
of
historical
fact
are
forward-looking
statements,
including,
without
limitation,
forecasts
concerning
global
demand
for
aluminum,
aluminum
end-market
growth,
aluminum
consumption
rates,
or
other
trend
projections,
targeted
financial
results
or
operating
performance,
and
statements
about
Alcoa’s
strategies,
objectives,
goals,
targets,
outlook,
and
business
and
financial
prospects.
Forward-looking
statements
are
subject
to
a
number
of
known
and
unknown
risks,
uncertainties,
and
other
factors
and
are
not
guarantees
of
future
performance.
Actual
results,
performance,
or
outcomes
may
differ
materially
from
those
expressed
in
or
implied
by
those
forward-looking
statements.
Important
factors
that
could
cause
actual
results
to
differ
materially
from
those
in
the
forward-looking
statements
include:
(a)
material
adverse
changes
in
aluminum
industry
conditions,
including
global
supply
and
demand
conditions
and
fluctuations
in
London
Metal
Exchange-based
prices
for
primary
aluminum,
alumina,
and
other
products,
or
the
effect
of
the
move
toward
index-based
pricing
for
alumina;
(b)
unfavorable
changes
in
general
business
and
economic
conditions,
in
the
global
financial
markets,
or
in
the
markets
served
by
Alcoa,
including
automotive
and
commercial
transportation,
aerospace,
building
and
construction,
distribution,
packaging,
oil
and
gas,
defense,
and
industrial
gas
turbines;
(c)
the
impact
of
changes
in
foreign
currency
exchange
rates
on
costs
and
results,
particularly
the
Australian
dollar,
Brazilian
real,
Canadian
dollar,
and
Euro;
(d)
increases
in
energy
costs,
including
electricity,
natural
gas,
and
fuel
oil,
or
the
unavailability
or
interruption
of
energy
supplies;
(e)
increases
in
the
costs
of
other
raw
materials,
including
caustic
soda
or
carbon
products;
(f)
Alcoa’s
inability
to
achieve
the
level
of
revenue
growth,
cash
generation,
cost
savings,
improvement
in
profitability
and
margins,
fiscal
discipline,
or
strengthening
of
operations
(including
improving
the
position
of
its
bauxite,
refining
and
smelter
system
on
the
world
cost
curve),
anticipated
from
its
productivity
improvement,
cash
sustainability
and
other
initiatives;
(g)
Alcoa's
inability
to
realize
expected
benefits
from
newly
constructed,
expanded
or
acquired
facilities
or
from
international
joint
ventures
as
planned
and
by
targeted
completion
dates,
including
the
joint
venture
in
Saudi
Arabia
or
the
upstream
operations
in
Brazil;
(h)
political,
economic,
and
regulatory
risks
in
the
countries
in
which
Alcoa
operates
or
sells
products,
including
unfavorable
changes
in
laws
and
governmental
policies;
(i)
the
outcome
of
contingencies,
including
legal
proceedings,
government
investigations,
and
environmental
remediation;
(j)
the
outcome
of
negotiations
with,
and
the
business
or
financial
condition
of,
key
customers,
suppliers,
and
business
partners;
(k)
changes
in
tax
rates
or
benefits;
and
(l)
the
other
risk
factors
summarized
in
Alcoa's
Form
10-K
for
the
year
ended
December
31,
2009, Forms
10-
Q
for
the
quarters
ended
March
31,
2010,
June
30,
2010,
and
September
30,
2010,
and
other
reports
filed
with
the
Securities
and
Exchange
Commission
(SEC).
Alcoa
disclaims
any
obligation
to
update
publicly
any
forward-looking
statements,
whether
in
response
to
new
information,
future
events
or
otherwise,
except
as
required
by
applicable
law.
Non-GAAP Financial Measures
Some
of
the
information
included
in
this
presentation
is
derived
from
Alcoa’s
consolidated
financial
information
but
is
not
presented
in
Alcoa’s
financial
statements
prepared
in
accordance
with
U.S.
generally
accepted
accounting
principles
(GAAP).
Certain
of
these
data
are
considered
“non-GAAP
financial
measures”
under
SEC
rules.
These
non-GAAP
financial
measures
supplement
our
GAAP
disclosures
and
should
not
be
considered
an
alternative
to
the
GAAP
measure.
Reconciliations
to
the
most
directly
comparable
GAAP
financial
measures
and
management’s
rationale
for
the
use
of
the
non-GAAP
financial
measures
can
be
found
in
the
Appendix
to
this
presentation
and
on
our
website
at
www.alcoa.com
under
the
“Invest”
section.
Any
reference
during
the
discussion
today
to
EBITDA
means
adjusted
EBITDA,
for
which
we
have
provided
calculations
and
reconciliations
in
the
Appendix
and
on
our
website.
2 |
 Chuck McLane
Executive Vice President and Chief Financial Officer
Alcoa Logo |
 Alcoa
Logo
4
th
Quarter 2010
Financial Overview
Income
from
Continuing
Operations
of
$258
million,
or
$0.24
per
share;
Restructuring
and
other
special
items
totaled
a
favorable
$35
million,
or
$0.03
per
share
Cash from Operations of $1.4 billion; Free Cash Flow of $1.0 billion
Revenue
up
7%
sequentially,
4%
versus
4Q’09
Adjusted EBITDA of $782 million, 13.8% Margin
Debt balance reduced; cash on hand at $1.5b
Debt
to
Capital
of
34.8%,
90
basis
points
lower
sequentially
4 |
 Alcoa
Logo
Sequential Income Statement Summary
$ Millions
3Q’10
4Q’10
Change
Sales
$5,287
$5,652
$365
Cost of Goods Sold
$4,413
$4,538
$125
COGS % Sales
83.5%
80.3%
(3.2 % pts.)
Selling, General Administrative, Other
$232
$282
$50
SGA % Sales
4.4%
5.0%
0.6 % pts.
Restructuring and Other Charges
$2
($12)
($14)
Effective Tax Rate
(81.7%)
16.1%
NA
Income from Continuing Operations
$61
$258
$197
Income Per Diluted Share
$0.06
$0.24
$0.18
5 |
 Alcoa
Logo
$ Millions
After-Tax & Non-
Controlling Interests
Earnings
Per Share
Income Statement
Classification
Segment
Restructuring
$8
Restructuring
Corporate
Discrete Tax Items
$18
Taxes
Corporate
Mark-to-Market Derivatives
$9
Other Income/Expense
Corporate
Total
$35
$0.03
4
th
Quarter Restructuring and Special Items
6 |
 Alcoa
Logo
4
th
Quarter 2010 vs. 3
rd
Quarter 2010
Earnings Bridge
Income from Continuing Operations excluding Restructuring & Special Items ($ millions) 7
See appendix for reconciliation
$96
$154
$14
$12
($29)
($20)
($17)
$35
($22)
$223
3Q10
LME
Price/Mix
Volume
Raw Mat'l
Costs
Currency
Energy
Taxes
Other
4Q10 |
 Alcoa
Logo
Alumina
4
th
Quarter Highlights
1
st
Quarter Outlook
4
th
Quarter Business Conditions
8
4Q 09
3Q 10
4Q 10
Production (kmt)
3,897
4,047
4,119
3
rd
Party Shipments (kmt)
2,716
2,423
2,433
3
rd
Party Revenue ($MM)
760
717
759
ATOI ($MM)
19
70
65
Adjusted EBITDA rises by 23% over Q3
Record quarterly production
Realized third-party alumina price up 9%
Negative currency impact of $25 million primarily
driven by Australian dollar
Higher raw material costs
Negative impact from discrete Q3 tax benefit in Brazil
Sao Luis recovery costs similar to Q3
Production to remain flat
Pricing to follow two-month lag on LME
Higher maintenance costs of $15m on scheduled
outages
Sao Luis ramp-up stabilizes with no further
recovery costs
Productivity improvements to continue
4
th
Quarter Performance Bridge
$ Millions
$70
$65
$50
$1
($25)
$3
($11)
($29)
$6 |
 Alcoa
Logo
Primary Metals
4
th
Quarter Highlights
4
th
Quarter Business Conditions
1
st
Quarter Outlook
9
4Q 09
3Q 10
4Q 10
Production (kmt)
897
891
913
3
rd
Party Shipments (kmt)
878
708
743
3
rd
Party Revenue ($MM)
1,900
1,688
1,970
3
rd
Party Price ($/MT)
2,155
2,261
2,512
ATOI ($MM)
(214)
78
178
Realized pricing up 11% sequentially
Aviles returned to full production as planned
Negative currency impact in all regions
Higher energy and raw material costs
Pricing to follow 15-day lag to LME
Restart cost of $10 million for US smelters
Higher raw material costs
Production flat, and productivity improvements to
continue
4
th
Quarter Performance Bridge
$ Millions
$78
($28)
($2)
$178
$147
$5
($11)
$5
$8
($24) |
 Alcoa
Logo
10
1
st
Quarter Outlook
4
th
Quarter Business Conditions
4
th
Quarter Highlights
ATOI $ Millions
4Q 09
3Q 10
4Q 10
Flat-Rolled Products,
excl Russia, China & Other
64
61
55
Russia, China & Other
(27)
5
(2)
Total ATOI
37
66
53
Seasonal volume declines in North America and
Europe
Russia profitable for third consecutive quarter
despite lower volumes
Scrap and alloying cost pressures
Strengthened demand in most regions
Improvements in price and mix
Higher energy costs expected
Productivity improvements to continue
4
th
Quarter Performance Bridge
$ Millions
Flat-Rolled Products
$66
$8
($11)
$1
($2)
($6)
($3)
$ 53 |
 Alcoa
Logo
Engineered Products and Solutions
4
th
Quarter Business Conditions
1
st
Quarter Outlook
4
th
Quarter Highlights
11
Markets remain stable across the portfolio
Slight increase in Commercial Transportation
offset by Building and Construction seasonality
Productivity improvements to continue
$ Millions
4Q 09
3Q 10
4Q 10
3
rd
Party Revenue
1,097
1,173
1,215
ATOI
57
114
113
Adjusted EBITDA % of
Revenue
12%
18%
17%
4
th
Quarter Performance Bridge
$ Millions
$114
$4
$5
$1
($11)
$113
Adjusted EBITDA margin up 5% vs. Q4 '09
Volume improvements in Aerospace and
Commercial Transportation
Seasonal shutdowns and weather delays
impacted results |
 Alcoa
Logo
4
th
Quarter 2010 Cash Flow Overview
12
See appendix for free cash flow reconciliation
4Q’10 FCF
$1.0 billion
$1.5 billion
of cash
($ Millions)
4Q'09
3Q'10
4Q'10
Net Income
($268)
$109
$292
DD&A
369
358
371
Change in Working Capital
523
213
564
Pension Contributions
(26)
(26)
(43)
Taxes / Other Adjustments
526
(262)
186
Cash From Operations
$1,124
$392
$1,370
Dividends to Shareholders
(30)
(31)
(31)
Change in Debt
(286)
(555)
(113)
Distributions to Noncontrolling Interest
(47)
(41)
(102)
Contributions from Noncontrolling Interest
153
57
41
Other Financing Activities
0
(4)
4
Cash From Financing Activities
($210)
($574)
($201)
Capital Expenditures
(363)
(216)
(365)
Other Investing Activities
(137)
(128)
(109)
Cash From Investing Activities
($500)
($344)
($474)
Debt-to-Cap
in target
range at
34.8% |
 Alcoa
Logo
2010
Full-Year Financial Overview
13
Exceeded all Cash Sustainability targets
Income
from
Continuing
Operations
of
$262
million,
or
$0.25
per
share;
Restructuring
and
other
special
items
totaled
an
unfavorable
$297
million,
or
$0.29
per share
Cash
from
operations
of
$2.3
billion;
Free
Cash
Flow
of
$1.2
billion,
best
result
since 2003
Selling,
General
Administrative,
Other
Expenses
less
than
$1.0b,
lowest
level
since 1999
Adjusted
EBITDA
of
$2.7b,
655%
improved
from
2009
and
Adjusted
EBITDA
Margins
of
12.9%,
11.0%
points
better
than
2009
Debt
balance
reduced
by
$654m,
debt
maturity
extended
Debt
to
Capital
of
34.8%,
390
basis
points
lower
than
Q4
2009 |
 Alcoa
Logo
2010 vs. 2009 Earnings Bridge
Income
(Loss)
from
Continuing
Operations
excluding
Restructuring
&
Special
Items
($
millions)
14
See appendix for reconciliation
($685)
$1,386
$221
($170)
($333)
$371
($251)
$20
$559
YTD09
LME
Price / Mix
Energy
Currency
Productivity
LIFO
Taxes / Other
YTD10 |
 Alcoa
Logo
Exceeded All Cash Sustainability Targets
Procurement
1
Overhead
$500
Total Capex
2
$1,250
Working Capital
35
2010 Cash Sustainability Operational Targets and Actual Performance
$ Millions
$509
$1,212
34
$ Millions
$ Millions
Days Working Capital
$2,500
$2,643
2010
Actual
2010
Target
2010
Actual
2010
Target
2010
Actual
2010
Target
2010
Actual
2010
Target
1
Procurement
and
other
productivity
2
Total
Capex
includes
investments
in
Ma’aden
project
15 |
 Alcoa
Logo
Procurement and Overhead –
Sustainable Reductions
16
2009
2010
$ Millions
$2,000
$ Millions
$1,998
$1,500
2009
Target
2009
Actual
1
Procurement and other productivity
Procurement
1
2010
Original
Target
2010
Revised
Target
Overhead
$2,500
$2,643
2010
Actual
2009
2010
$ Millions
$400
$ Millions
$412
$200
2009
Target
2009
Actual
2010
Original
Target
2010
Revised
Target
$500
$509
2010
Actual |
 Alcoa
Logo
Maintaining Discipline in Capital Expenditures
17
Total Capex includes investments in Ma’aden project
2009
$ Millions
2009
Target
2009
Actual
Total Capital Expenditures
2010
$ Millions
$1,212
$1,250
2010
Target
2010
Actual
$1,622
$1,800 |
 Alcoa
Logo
43
73
83
47
37
53
75
37
34
49
65
34
GPP
GRP
EPS
Alcoa
Sustainable Reductions in Days Working Capital
18
2008
2009
2010
2008
2009
2010
2008
2009
2010
2008
2009
2010
1 day better
than 2010
target
Yearly
Improvement in
Each Group
Reduction in 13
Days Working
Capital |
 Alcoa
Logo
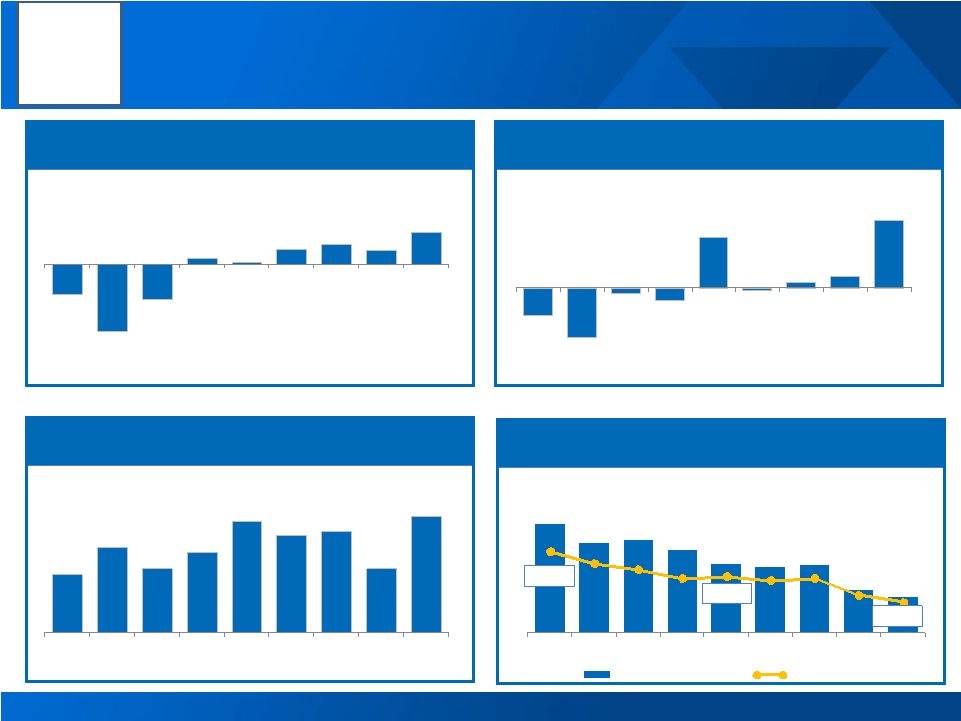
Liquidity and Financial Positions Continue to Strengthen
19
Drove Cash Sustainability savings to the
bottom line…
…efficiently managed cash flows and
capex…
…strengthened the balance sheet
Adjusted Income (Loss) ($ Millions)
Free Cash Flow ($ Millions)
Debt ($ Millions) & Debt-to-Capital %
…improved liquidity…
Cash on Hand ($ Millions)
(221)
(477)
(256)
39
9
101
139
96
223
4Q'08
1Q'09
2Q'09
3Q'09
4Q'09
1Q'10
2Q'10
3Q'10
4Q'10
(409)
(742)
(90)
(186)
761
(22)
87
176
1,005
4Q'08
1Q'09
2Q'09
3Q'09
4Q'09
1Q'10
2Q'10
3Q'10
4Q'10
762
1,131
851
1,066
1,481
1,292
1,344
843
1,543
4Q'08
1Q'09
2Q'09
3Q'09
4Q'09
1Q'10
2Q'10
3Q'10
4Q'10
10,578
10,205
10,265
10,073
9,819
9,757
9,800
9,309
9,165
42.5%
38.7%
34.8%
4Q'08
1Q'09
2Q'09
3Q'09
4Q'09
1Q'10
2Q'10
3Q'10
4Q'10
Gross Debt
Debt to Cap |
 Klaus Kleinfeld
Chairman and Chief Executive Officer
20
Alcoa Logo |
  Alcoa
Logo
Seizing Opportunity and Accelerating Value
21
2008: Extraordinary Times;
Extraordinary Measures
2009: Turning Crisis into
Opportunity
2010: Seizing Opportunity;
Accelerating Value
Strategic Growth
Estreito
Samara
Bohai
Upstream
Mid-
and Down-Stream
Seven Promises
Sao Luis and Juruti
2015 Refining Cost Curve Position
2015 Smelting Cost Curve Position |
 Alcoa
Logo
Sustainability Leadership
Best Ever Safety Performance
Alcoa Lives Its Values Every Day
22
Lost Workday Incident Rate
9
th
Consecutive Year
Safety Incident Rate History and Significant Accreditations in 2010
Ranked Third of 339 Companies
Named to World & North American Indexes
Alcoa Primary Aluminum, Can and bottle Sheet
and Kawneer
products Certified
82% of Alcoa
locations had
no LWD in 2010
Sustainable
Company of
the Year by
Exame
Magazine
0.29
0.31
0.19
0.19
0.13
0.13
0.11
0.15
0.14
0.15
0.12 |
 Alcoa
Logo
Alcoa Continues To Exceed Its Aggressive Targets
Procurement
1
Overhead
$500
Total Capex
2
$1,250
Working Capital
35
2010 Cash Sustainability Operational Targets and Actual Performance
$ Millions
$509
$1,212
34
$ Millions
$ Millions
Days Working Capital
$2,500
$2,643
2010
Actual
2010
Target
2010
Actual
2010
Target
2010
Actual
2010
Target
2010
Actual
2010
Target
1
Procurement
and
other
productivity
2
Total
Capex
includes
investments
in
Ma’aden
project
23 |
 Alcoa
Logo
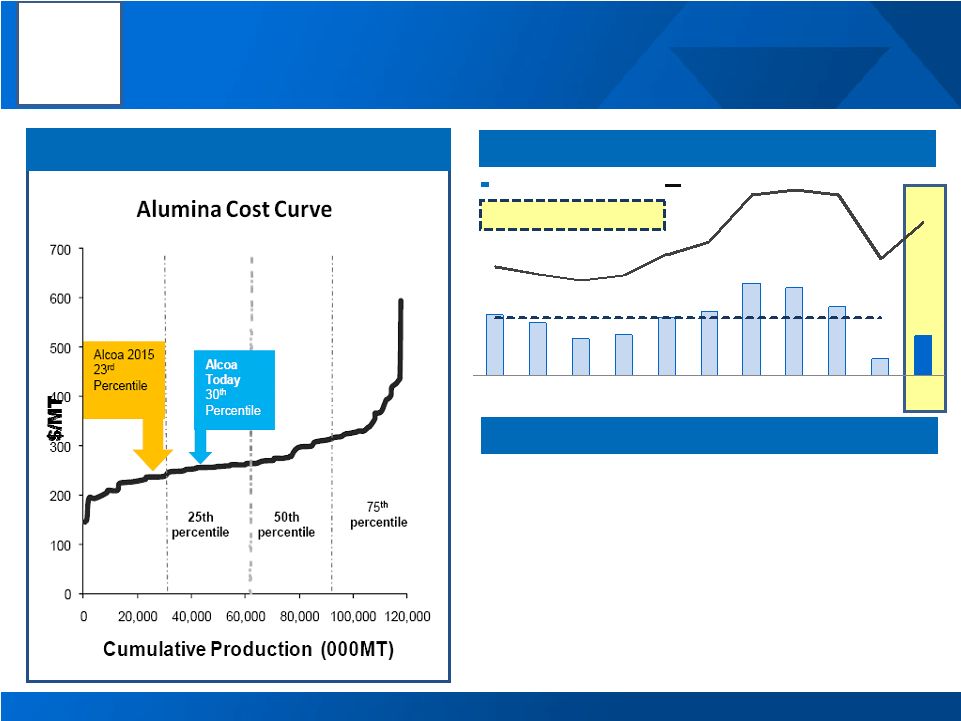
Driving Bauxite and Refining To 1
st
Quartile by 2015
24
Alumina Production Capacity: 18 mmt
Source: CRU
Adjusted EBITDA per Metric Ton
–
Sao
Luis
operating
at
full
capacity
–
Record
production
in
2010
with
unparalleled
growth
potential
–
Ma’aden,
lowest
cost
refinery
online
in
2014
–
Current
capacity
of
18
MMT
–
Move
to
index
pricing
continues
The Alumina Leader
10 Yr Average ~ $70/MT
LME
Adjusted EBITDA/MT
72
62
44
48
68
75
110
104
81
20
47
1,549
1,447
1,350
1,433
1,719
1,900
2,570
2,641
2,572
1,664
2,173
2000
2001
2002
2003
2004
2005
2006
2007
2008
2009
2010 |
 Alcoa
Logo
Aluminum Production Capacity: 4.5 mmt
Driving Smelting Business To 2
nd
Quartile by 2015
25
Source: CRU
–
Optimizing
smelter
portfolio;
reducing
costs
–
Leveraging
casthouse
system
to
capture
higher
value-added
–
Ma’aden,
lowest
cost
smelter
online
in
2013
–
Improving
cost
curve
position
–
Repowered
asset
base
–
Restart
of
200,000
tonnes
of
production
Restructuring for Profitable Growth
Adjusted EBITDA per Metric Ton
487
460
321
336
418
398
784
626
392
(159)
320
1,549
1,447
1,350
1,433
1,719
1,900
2,570
2,641
2,572
1,664
2,173
2000
2001
2002
2003
2004
2005
2006
2007
2008
2009
2010
10 YR Average ~ $410/MT |
 Alcoa
Logo
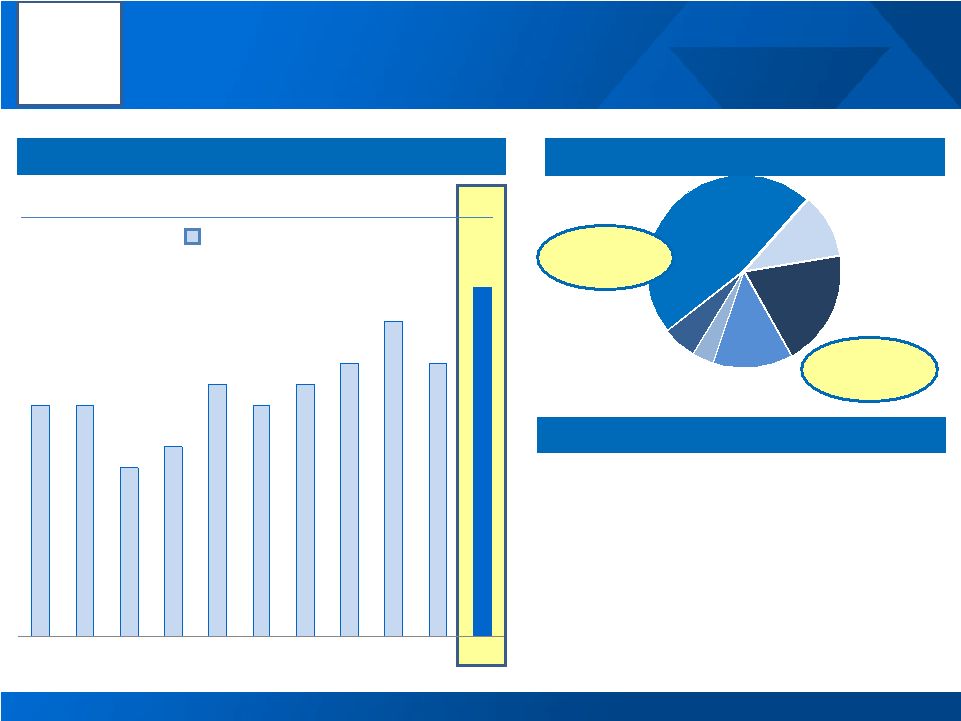
Distribution
14%
Automotive
7%
B&C
6%
Commercial
Transport
5%
Industrial
/Other
14%
Packaging
43%
Aerospace
11%
Rolled Products Positioned To Add $2.5b in Revenue by
2013
Flat Rolled Products financial and strategic overview
Adjusted EBITDA & Adjusted EBITDA % Sales
26
573
541
495
479
531
620
536
498
254
224
551
Adjusted EBITDA $Millions
Adjusted EBITDA % Sales
2010 3
rd
Party Sales by Market
80%
Utilization
–
Targeting
$2.5b
in
revenue
growth
by
2013,
growing
50%
faster
than
market
–
Aerospace
growth
from
robust
build
rates
–
Russia
and
China
to
capture
growth
in
emerging
markets
–
Innovation
in
automotive,
consumer
electronics
and
packaging
–
Ma’aden,
lowest
cost
rolling
mill
online
in
2013
Leveraging our strategic asset base
11%
11%
11%
10%
9%
9%
6%
5%
3%
4%
9%
2000
2001
2002
2003
2004
2005
2006
2007
2008
2009
2010 |
 Alcoa
Logo
Aerospace
47%
IGT
11%
B&C
19%
Commercial
Transport
13%
Automotive
4%
Other
6%
Engineered Products Targeting $1.6b in Revenue by 2013
Engineered Products & Solutions financial and strategic overview
Adjusted EBITDA & Adjusted EBITDA % Sales
27
368
436
287
356
495
536
676
783
922
630
762
Adjusted EBITDA $Millions
Adjusted EBITDA % Sales
2010 3
rd
Party Sales by Market
72%
Utilization
65%
Utilization
Strong Platform for Profitable Growth
–
Targeting
$1.6b
in
revenue
growth
by
2013
from
market
growth,
new
product
introductions,
and
share
gains
–
Selected
acquisitions
in
target
markets
–
Increased
aluminum
wheel
penetration
–
Product
innovations
accelerate
growth
11%
11%
8%
9%
12%
11%
12%
13%
15%
13%
17%
2000
2001
2002
2003
2004
2005
2006
2007
2008
2009
2010 |
 Alcoa
Logo
28
Ma’aden
and
Alcoa
Pour
Concrete
for
the
Middle
East’s
First
Integrated
Smelter
and
Rolling
Mill
First Concrete Pour and Financing Secured in Ma’aden
Poured
first
concrete
on
October
24,
2010
Successful,
heavily
over-subscribed
bank
financing
for
smelter
and
rolling
mill
announced
November
30,
2010
All
major
equipment
has
been
ordered
Smelter
and
rolling
mill
on-line
in
2013
and
bauxite
mine
and
refinery
in
2014 |
 Alcoa
Logo
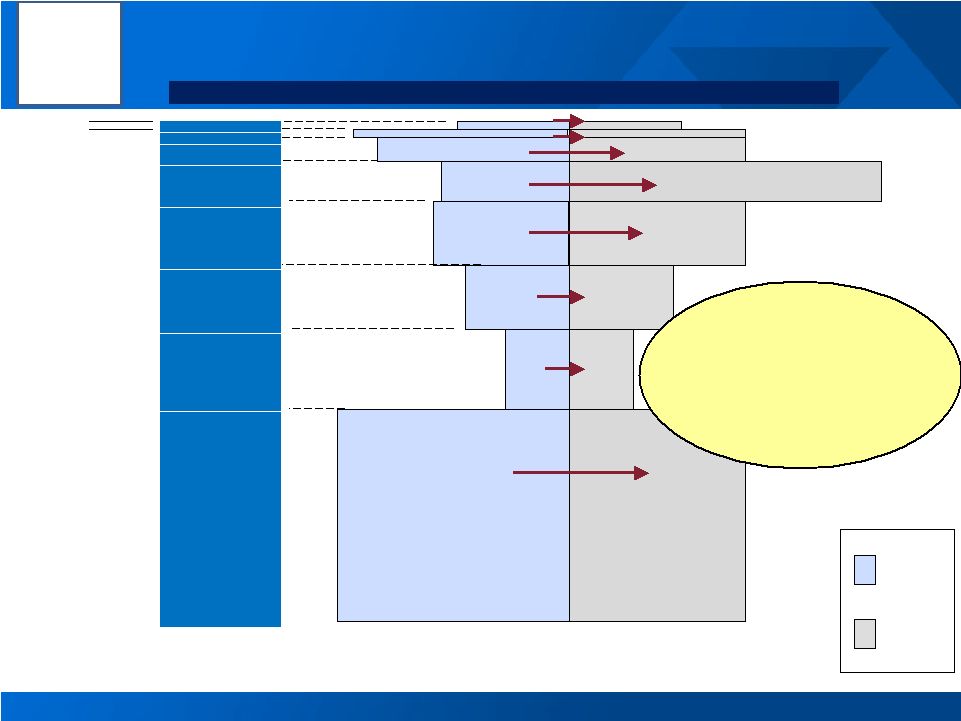
Market Conditions In 2011
Alcoa End Markets: Current Assessment of 2011 vs. 2010 Conditions
Source: Alcoa analysis
29 |
 Alcoa
Logo
4%
15%
2011 Projected Primary Aluminum Consumption by Region (in mmt)
2011 Growth Maintains 2010 Momentum With
12% Increase
Russia
Brazil
Asia w/o China
North America
Europe
China
2010 vs. 2011
2011 Estimated
Consumption
4%
6%
10%
21%
16%
15%
*Other
24%
44.5
2010
Forecast
2011
Forecast
15%
30
6%
2010 Global Demand
Growth Rate: 13%
2011 Global Demand
Growth Rate 12%
vs. 2010
(2011 ex China: 11%)
10%
India
6%
15%
7%
*Other consists of: Middle East, Latin America ex Brazil, and Rest of World
including unallocated global increase 14%
19.0
6.9
5.6
5.45
3.6
1.9
1.1
1.0 |
 Alcoa
Logo
Consumption Driving Inventory Decline and High Premiums
31
Regional Premiums Near All-Time Highs
Global Inventories Falling
$113 / MT
$205 / MT
$137 / MT
Source: Alcoa estimates, LME, SHFE, IAI, Marubeni, Platt’s Metals Week and
Metal Bulletin 0%
100%
200%
300%
400%
500%
600%
700%
800%
900%
Midwest
Japan
Europe |
 Alcoa
Logo
Western World
Annualized Production (Nov 2010)
25,225
Restarts and Expanded Capacity
1,260
Total Supply
26,485
Western World Consumption
(25,540)
(Deficit) Surplus
945
China
Annualized Production (Nov 2010)
14,575
Restarted and Expanded Capacity
3,700
Total Supply
18,275
Consumption
(18,975)
(Deficit) Surplus
(700)
2011 Primary Aluminum Balances
32
China
Western World
Production
Demand
Surplus
Source: Alcoa estimates, Brook Hunt, CRU, CNIA, IAI
Deficit
Production
Demand
2011E Aluminum Supply / Demand Balance (in kmt) |
 Alcoa
Logo
2011 Global Alumina Balances
33
Source: Alcoa estimates, Brook Hunt, CRU, CNIA, IAI
China
Western World
2011 Annualized Production
32,600
Imports from Western World
4,000
Supply
36,600
Demand
(36,600)
(Deficit) / Surplus
0
2011 Annualized Production
56,400
Exports to China
(4,000)
Supply
52,400
Demand
(52,400)
(Deficit) / Surplus
0
Production
Demand
Balanced
2011E Alumina Supply / Demand Balance (in kmt) |
 Alcoa
Logo
Copper Up
Pressure to Replace
Aluminum Wins
34
Copper Prices Moving Up
Low Voltage
Electrical
wiring & cable
Transportation
Cladding
Other
Sources: Bank of America / Merrill Lynch, International Copper Study Group and
Alcoa Analysis Potential
20% substitution
3.8
mmt
per
year
320%
19 mmt
Refined Cu
Aluminum Is The Natural Substitute
•Heat sinks for electronics, PCB’s
•Building façades
•Bussed electrical center components
•Wire harnesses
•High Voltage Cables
•Utility buss bars
•Low voltage installations in cities,
industrial or commercial buildings
•Battery cables
Aluminum
Replacement
Examples
High Voltage
$2,321
$9,740
12/31/03
12/31/10 |
 Alcoa
Logo
Aluminum’s Advantages Recognized In Consumer Electronics
35
Samsung 9 Series Notebook
(anodized / brushed cover)
Samsung 8000 Series LED TV
(coated / brushed bezel)
Advantages of Aluminum
Aluminum-Intensive Devices
CES 2011
Nokia N Series Smartphone
(color anodized case)
Panasonic Viera TV
(brushed bezel) |
 Alcoa
Logo
Accelerating Shareholder Value in 2011 and Beyond
36
Upstream
2015 Cost Curve Changes
Refining Cost Curve Position
Smelting Cost Curve Position
Midstream
2013 Revenue Targets
Downstream
2013 Revenue Targets
2011 Financial Targets
Sustaining
Capex
$1.0b
Growth
Capex
$0.5b
Debt-to-cap
Ratio
30 to 35%
Positive
Free Cash
Flow
Ma’aden
Investment
$0.4b |
 Alcoa
Logo
Continued Acceleration of Shareholder Value in 2011
Market Environment
All
global
end-
markets
showing
improvement
from
2010
Aluminum
supply
/
demand
surplus
continues
to
shrink
from
2010
Currency
and
energy
cost
headwinds
persist
Alcoa Actions
Upstream
assets
focusing
on
restructuring
and
long-term
cost
curve
improvement
and
better
prices
Midstream
continuing
with
improved
margins
and
growth
Downstream
assets
building
on
improved
margins
and
growth
Maintaining
fiscal
discipline
Leveraging
strategic
growth investments
37
Aggressive Targets |
 Alcoa
Logo
Roy Harvey
Director, Investor Relations
390 Park Avenue
New York, NY 10022-4608
Telephone: (212) 836-2674
www.alcoa.com
Additional Information
38
Alcoa
Logo |
 Alcoa
Logo |
 Alcoa
Logo
Annual Sensitivity Summary
40
Currency Annual Net Income Sensitivity
+/-
10% versus USD
Australian $
+/-
$75 million
Brazilian
$
+/-
$50 million
Euro €
+/-
$40 million
Canadian $
+/-
$35 million
+/-
$100/MT = +/-
$200
million
LME Aluminum Annual Net Income Sensitivity |
 Alcoa
Logo
Effective Tax Rate
41
Effective tax rate, excluding discrete tax items is a non-GAAP financial measure.
Management believes that the Effective tax rate, excluding discrete tax items is
meaningful to investors because it provides a view of Alcoa’s operational tax rate.
$ Millions
1Q’10
2Q’10
3Q’10
4Q’10
YTD’10
(Loss) income from continuing operations before income taxes
($88)
$228
$60
$348
$548
Provision for income taxes
$84
$57
($49)
$56
$148
Effective tax rate as reported
(95.5%)
25.0%
(81.7%)
16.1%
27.0%
Discrete tax provisions:
Medicare Part-D
$79
-
-
-
$79
Transaction-related and other items
$33
($16)
($38)
($18)
($39)
Discrete tax items attributable to Noncontrolling Interest
-
-
($30)
($2)
($32)
Subtotal -
Discrete tax (benefits) provisions
$112
($16)
($68)
($20)
$8
(Benefit) Provision for income taxes excluding discrete tax (benefits)
provisions ($28)
$73
$19
$76
$140
Effective tax rate excluding discrete tax (benefits) provisions
31.8%
32.0%
31.7%
21.8%
25.5% |
 Alcoa
Logo
Reconciliation of ATOI to Consolidated Net (Loss) Income
Attributable to Alcoa
42
(in millions)
4Q09
2009
1Q10
2Q10
3Q10
4Q10
2010
Total segment ATOI
$ (101)
$
(234)
$ 306
$ 381
$ 328
$
409
$ 1,424
Unallocated amounts (net of tax):
Impact of LIFO
87
235
(14)
(3)
(2)
3
(16)
Interest income
4
12
3
3
3
3
12
Interest expense
(79)
(306)
(77)
(77)
(91)
(76)
(321)
Noncontrolling interests
(9)
(61)
(22)
(34)
(48)
(34)
(138)
Corporate expense
(92)
(304)
(67)
(59)
(71)
(94)
(291)
Restructuring and other charges
(50)
(155)
(122)
(21)
1
8
(134)
Discontinued operations
(11)
(166)
(7)
(1)
–
–
(8)
Other
(26)
(172)
(201)
(53)
(59)
39
(274)
Consolidated net (loss) income attributable to
Alcoa
$ (277)
$ (1,151)
$ (201)
$ 136
$ 61
$ 258
$ 254
|
 Alcoa
Logo
Reconciliation of Adjusted Income
43
(in millions)
Quarter ended
Year ended
December 31,
2009
March 31,
2010
June 30,
2010
September 30,
2010
December 31,
2010
December 31,
2009
December 31,
2010
Net (loss) income
attributable to Alcoa
$ (277)
$ (201)
$ 136
$ 61
$ 258
$ (1,151)
$ 254
Loss from discontinued
operations
(11)
(7)
(1)
–
–
(166)
(8)
(Loss) income from
continuing
operations
attributable to Alcoa
(266)
(194)
137
61
258
(985)
262
Restructuring and
other charges
49
119
20
(1)
(8)
152
130
Discrete tax items*
(82)
112
(16)
(38)
(18)
(110)
40
Special items**
308
64
(2)
74
(9)
258
127
Income (loss) from
continuing
operations
attributable to Alcoa
– as adjusted
$ 9
$ 101
$ 139
$ 96
$ 223
$ (685)
$ 559
Income (loss) from continuing operations attributable to Alcoa – as adjusted is a non-GAAP
financial measure. Management believes that this measure is meaningful to investors because management reviews the
operating results of Alcoa excluding the impacts of restructuring and other charges, discrete tax
items, and special items. There can be no assurances that additional restructuring and other charges, discrete tax
items, and special items will not occur in future periods. To compensate for this limitation,
management believes that it is appropriate to consider both Income (loss) from continuing operations attributable to Alcoa
determined under GAAP as well as Income (loss) from continuing operations attributable to Alcoa –
as adjusted. * Discrete tax items include the following:
for the quarter ended December 31, 2010, a benefit for the reversal of the remaining valuation
allowance related to net operating losses of an international subsidiary ($16) (a portion was initially reversed in the quarter ended September 30,
2010) and a net benefit for other small items ($2);
for the quarter ended September 30, 2010, a benefit for the reversal of a valuation allowance related
to net operating losses of an international subsidiary that are now realizable due to a settlement with a tax authority ($41); a charge for a
tax rate change in Brazil ($11); and a benefit for the recovery of a portion of the unfavorable impact
included in the quarter ended March 31, 2010 related to unbenefitted losses in Russia, China, and Italy ($8);
for the quarter ended June 30, 2010, a benefit for a change in a Canadian provincial tax law
permitting tax returns to be filed in U.S. dollars ($24), a charge based on settlement discussions of several matters with international taxing
authorities ($18), and a benefit for the recovery of a portion of the unfavorable impact included in
the quarter ended March 31, 2010 related to unbenefitted losses in Russia, China, and Italy ($10);
for the quarter ended March 31, 2010, charges for a change in the tax treatment of federal subsidies
received related to prescription drug benefits provided under certain retiree health benefit plans ($79), unbenefitted losses in Russia,
China, and Italy ($22), interest due to the IRS related to a previously deferred gain associated with
the 2007 formation of the former soft alloy extrusions joint venture ($6), and a change in the anticipated sale structure of the Transportation
Products Europe business ($5);
for the quarter ended December 31, 2009, a benefit for the reorganization of an equity investment in
Canada ($71), a charge for the write-off of deferred tax assets related to operations in Italy ($41), a benefit for a tax rate change in Iceland
($31), and a benefit for the reversal of a valuation allowance on net operating losses in Norway
($21); and, for the year ended December 31, 2009, the previously mentioned items for the quarter ended December
31, 2009 ($82) and a benefit for a change in a Canadian national tax law permitting tax returns to be filed in U.S. dollars ($28).
** Special items include the following:
for the quarter ended December 31, 2010, unfavorable mark-to-market changes in derivative
contracts; for the quarter ended September 30, 2010, unfavorable mark-to-market changes in derivative
contracts ($29), recovery costs associated with the São Luís, Brazil facility due to a power outage and failure of a ship unloader in the first half of
2010 ($23), restart costs and lost volumes related to a June 2010 flood at the Avilés smelter in
Spain ($13), and a net charge for the early repayment of Notes set to mature in 2011 through 2013 due to the premiums paid under the tender
offers and call option (partially offset by gains from the termination of related in-the-money
interest rate swaps) ($9); for the quarter ended June 30, 2010, favorable mark-to-market changes in derivative contracts
($22), a charge for costs associated with the potential strike and successful execution of a new agreement with the USW ($13), and a charge
related to an unfavorable decision in Alcoa’s lawsuit against Luminant related to the Rockdale,
TX facility ($7); for the quarter ended March 31, 2010, charges related to unfavorable mark-to-market changes in
derivative contracts ($31), power outages at the Rockdale, TX and São Luís, Brazil facilities ($17), an additional environmental accrual for the
Grasse River remediation in Massena, NY ($11), and the write off of inventory related to the permanent
closures of certain U.S. facilities ($5); for the quarter ended December 31, 2009, charges related to a recent European Commission’s ruling
on electricity pricing for smelters in Italy ($250), a tax settlement related to an equity investment in Brazil ($24), an estimated loss on
excess power at our Intalco smelter ($19), and an environmental accrual for smelters in Italy ($15);
and, for the year ended December 31, 2009, the previously mentioned items for the quarter ended December
31, 2009 ($308), a gain on an acquisition in Suriname ($35), a gain on the Elkem/SAPA swap ($133), and a loss on the sale of Shining
Prospect ($118). |
 Alcoa
Logo
Reconciliation of Adjusted Income, con’t
44
(in millions)
Quarter ended
December 31,
2008
March 31,
2009
June 30,
2009
September 30,
2009
Net (loss) income
attributable to Alcoa
$ (1,191)
$ (497)
$ (454)
$ 77
(Loss) income from
discontinued
operations
(262)
(17)
(142)
4
(Loss) income from
continuing
operations
attributable to Alcoa
(929)
(480)
(312)
73
Restructuring and
other charges
614
46
56
1
Discrete tax items*
65
(28)
–
–
Special items**
29
(15)
–
(35)
(Loss) income from
continuing
operations
attributable to Alcoa
–
as adjusted
$ (221)
$ (477)
$ (256)
$ 39
Income (loss) from continuing operations attributable to Alcoa – as adjusted is a non-GAAP
financial measure. Management believes that this measure is meaningful to investors
because management reviews the operating results of Alcoa excluding the impacts of restructuring and
other charges, discrete tax items, and special items. There can be no assurances that
additional restructuring and other charges, discrete tax items, and special items will not occur in future periods. To compensate for this limitation, management
believes that it is appropriate to consider both Income (loss) from continuing operations attributable
to Alcoa determined under GAAP as well as Income (loss) from continuing operations attributable
to Alcoa – as adjusted. * Discrete tax items include the following:
for the quarter ended March 31, 2009, a benefit for a change in a Canadian national tax law
permitting tax returns to be filed in U.S. dollars; and, for the quarter ended December
31, 2008, a charge for non-cash tax on repatriated earnings. ** Special items include the following:
for the quarter ended September 30, 2009, a gain on an acquisition in Suriname;
for the quarter ended March 31, 2009, a gain on the Elkem/SAPA swap ($133) and a loss on the sale of
Shining Prospect ($118); and, for the quarter ended December 31, 2008, charges for
environmental reserve ($26), obsolete inventory ($16), and accounts receivable reserve ($11), and a refund of an indemnification payment ($24). |
 Alcoa
Logo
Reconciliation of Free Cash Flow
45
(in millions)
Quarter ended
Year ended
December 31,
2008
March 31,
2009
June 30,
2009
September 30,
2009
December 31,
2009
March 31,
2010
June 30,
2010
September 30,
2010
December 31,
2010
December 31,
2010
Cash
provided
from
operations
$ 608
$ (271)
$ 328
$ 184
$ 1,124
$ 199
$ 300
$ 392
$ 1,370
$ 2,261
Capital
expenditures
(1,017)
(471)
(418)
(370)
(363)
(221)
(213)
(216)
(365)
(1,015)
Free cash
flow
$ (409)
$ (742)
$ (90)
$ (186)
$ 761
$ (22)
$ 87
$ 176
$ 1,005
$ 1,246
Free Cash Flow is a non-GAAP financial measure. Management believes that this measure is
meaningful to investors because management reviews cash flows generated from operations after taking into consideration capital
expenditures due to the fact that these expenditures are considered necessary to maintain and expand
Alcoa’s asset base and are expected to generate future cash flows from operations. It is important to note that Free Cash Flow
does not represent the residual cash flow available for discretionary expenditures since other
non-discretionary expenditures, such as mandatory debt service requirements, are not deducted from the measure.
|
 Alcoa
Logo
Days Working Capital
46
Days Working Capital
($ in millions)
Working
Capital Components
Calculation
Month
ended
Quarter ended
October
31,
2010
November 30,
2010
December
31,
2010
December
31,
2010
Receivables from customers, less
allowances
$ 2,104
$ 2,111
$ 1,565
Less: Accounts
receivable
programs
1
200
226
–
Receivables from customers, less
allowances, as adjusted
$ 1,904
$ 1,885
$ 1,565
$ 1,785
Add: Inventories
2,570
2,477
2,562
2,536
Less: Accounts payable, trade
2,186
2,185
2,322
2,231
Working Capital
$ 2,288
$ 2,177
$ 1,805
$ 2,090
Sales
$ 5,652
Days Working Capital
34.0
Days Working Capital = Working Capital (average of three month end amounts) divided by (Sales/number
of days in the quarter) 1
During the fourth quarter of 2009, each of the monthly balances of Receivables from customers
reflected the sale of $250 million under the Company's accounts receivable securitization
program, which was terminated in the first quarter of 2010. In calculating the average Receivables from customers
balance for the fourth quarter of 2010, the balances for October and November were reduced on a pro
forma basis by the estimated impact of the accounts receivable programs implemented during the
fourth quarter of 2010 to ensure all three months were comparable with the fourth quarter of
2009 for purposes of this calculation.
|
 Alcoa
Logo
Reconciliation of Alcoa Adjusted EBITDA
47
($ in millions)
2000
2001
2002
2003
2004
2005
2006
2007
2008
2009
4Q10
2010
Net income (loss)
attributable to
Alcoa
$ 1,484
$ 908
$ 420
$ 938
$ 1,310
$ 1,233
$ 2,248
$ 2,564
$ (74)
$ (1,151)
$ 258
$ 254
Add:
Net income
attributable to
noncontrolling
interests
306
205
181
212
233
259
436
365
221
61
34
138
Cumulative effect
of accounting
changes
5
–
(34)
47
–
2
–
–
–
–
–
–
(Income) loss from
discontinued
operations
(73)
5
101
–
27
50
(22)
250
303
166
–
8
Provision (benefit)
for income taxes
859
524
307
367
546
464
853
1,623
342
(574)
56
148
Other (income)
expenses, net
(136)
(295)
(175)
(278)
(266)
(478)
(236)
(1,920)
(59)
(161)
(43)
5
Interest expense
427
371
350
314
271
339
384
401
407
470
118
494
Restructuring and
other charges
(1)
530
398
(28)
(29)
266
507
268
939
237
(12)
207
Provision for
depreciation,
depletion, and
amortization
1,123
1,144
1,037
1,110
1,142
1,227
1,252
1,244
1,234
1,311
371
1,450
Adjusted Earnings
before interest,
taxes,
depreciation, and
amortization
(EBITDA)
$ 3,994
$ 3,392
$ 2,585
$ 2,682
$ 3,234
$ 3,362
$ 5,422
$ 4,795
$ 3,313
$ 359
$ 782
$ 2,704
Sales
$19,947
$19,906
$17,691
$18,879
$21,370
$24,149
$28,950
$29,280
$26,901
$18,439
$ 5,652
$21,013
Adjusted EBITDA
Margin
20%
17%
15%
14%
15%
14%
19%
16%
12%
2%
14%
13%
Alcoa’s definition of Adjusted EBITDA is net margin plus an add-back for depreciation,
depletion, and amortization. Net margin is equivalent to Sales minus the following items: Cost of goods sold; Selling, general administrative, and
other expenses; Research and development expenses; and Provision for depreciation, depletion, and
amortization. Adjusted EBITDA is a non-GAAP financial measure. Management believes that this measure is meaningful to
investors because Adjusted EBITDA provides additional information with respect to Alcoa’s
operating performance and the Company’s ability to meet its financial obligations. The Adjusted EBITDA presented may not be comparable
to similarly titled measures of other companies. |
 Alcoa
Logo
Reconciliation of Alumina Adjusted EBITDA
48
($ in millions)
2000
2001
2002
2003
2004
2005
2006
2007
2008
2009
3Q10
4Q10
2010
After-tax operating
income (ATOI)
$ 585
$ 471
$ 315
$ 415
$ 632
$ 682
$ 1,050
$ 956
$ 727
$ 112
$ 70
$ 65
$ 301
Add:
Depreciation,
depletion, and
amortization
163
144
139
147
153
172
192
267
268
292
100
107
406
Equity (income) loss
(3)
(1)
(1)
–
(1)
–
2
(1)
(7)
(8)
(1)
(3)
(10)
Income taxes
279
184
130
161
240
246
428
340
277
(22)
(22)
14
60
Other
(12)
(17)
(14)
(55)
(46)
(8)
(6)
2
(26)
(92)
(1)
(3)
(5)
Adjusted Earnings
before interest,
taxes, depreciation,
and amortization
(EBITDA)
$ 1,012
$ 781
$ 569
$ 668
$ 978
$ 1,092
$ 1,666
$ 1,564
$ 1,239
$ 282
$ 146
$ 180
$ 752
Production
(thousand metric
tons) (kmt)
13,968
12,527
13,027
13,841
14,343
14,598
15,128
15,084
15,256
14,265
4,047
4,119
15,922
Adjusted
EBITDA/Production
($ per metric ton)
$ 72
$ 62
$ 44
$ 48
$ 68
$ 75
$ 110
$ 104
$ 81
$ 20
$ 36
$ 44
$ 47
Alcoa’s definition of Adjusted EBITDA is net margin plus an add-back for depreciation,
depletion, and amortization. Net margin is equivalent to Sales minus the following items: Cost of goods sold; Selling, general administrative, and other expenses;
Research and development expenses; and Provision for depreciation, depletion, and amortization.
The Other line in the table above includes gains/losses on asset sales and other nonoperating items. Adjusted EBITDA is a non-GAAP financial
measure. Management believes that this measure is meaningful to investors because Adjusted EBITDA
provides additional information with respect to Alcoa’s operating performance and the Company’s ability to meet its financial obligations.
The Adjusted EBITDA presented may not be comparable to similarly titled measures of other companies.
|
 Alcoa
Logo
Reconciliation of Primary Metals Adjusted EBITDA
49
($ in millions)
2000
2001
2002
2003
2004
2005
2006
2007
2008
2009
3Q10
4Q10
2010
After-tax operating
income (ATOI)
$ 1,000
$ 905
$ 650
$ 657
$ 808
$ 822
$ 1,760
$ 1,445
$ 931
$ (612)
$ 78
$ 178
$ 488
Add:
Depreciation,
depletion, and
amortization
311
327
300
310
326
368
395
410
503
560
142
140
571
Equity (income) loss
(50)
(52)
(44)
(55)
(58)
12
(82)
(57)
(2)
26
–
–
(1)
Income taxes
505
434
266
256
314
307
726
542
172
(365)
(3)
81
96
Other
(41)
(8)
(47)
12
20
(96)
(13)
(27)
(32)
(176)
(7)
(1)
(7)
Adjusted Earnings
before interest,
taxes, depreciation,
and amortization
(EBITDA)
$ 1,725
$ 1,606
$ 1,125
$ 1,180
$ 1,410
$ 1,413
$ 2,786
$ 2,313
$ 1,572
$ (567)
$ 210
$ 398
$ 1,147
Production
(thousand metric
tons) (kmt)
3,539
3,488
3,500
3,508
3,376
3,554
3,552
3,693
4,007
3,564
891
913
3,586
Adjusted
EBITDA/Production
($ per metric ton)
$ 487
$ 460
$ 321
$ 336
$ 418
$ 398
$ 784
$ 626
$ 392
$ (159)
$ 236
$ 436
$ 320
Alcoa’s definition of Adjusted EBITDA is net margin plus an add-back for depreciation,
depletion, and amortization. Net margin is equivalent to Sales minus the following items: Cost of goods sold; Selling, general administrative, and other
expenses; Research and development expenses; and Provision for depreciation, depletion, and
amortization. The Other line in the table above includes gains/losses on asset sales and other nonoperating items. Adjusted EBITDA is a non-GAAP
financial measure. Management believes that this measure is meaningful to investors because
Adjusted EBITDA provides additional information with respect to Alcoa’s operating performance and the Company’s ability to meet its financial
obligations. The Adjusted EBITDA presented may not be comparable to similarly titled measures of
other companies. |
 Alcoa
Logo
Reconciliation of Flat-Rolled Products Adjusted EBITDA
50
($ in millions)
2000
2001
2002
2003
2004
2005
2006
2007
2008
2009
2010
After-tax operating
income (ATOI)
$ 296
$ 253
$ 225
$ 222
$ 254
$ 278
$ 233
$ 178
$ (3)
$ (49)
$ 220
Add:
Depreciation,
depletion, and
amortization
153
167
184
190
200
220
223
227
216
227
238
Equity (income) loss
(3)
2
4
1
1
–
2
–
–
–
–
Income taxes
126
124
90
71
75
121
58
92
35
48
92
Other
1
(5)
(8)
(5)
1
1
20
1
6
(2)
1
Adjusted Earnings
before interest,
taxes, depreciation,
and amortization
(EBITDA)
$ 573
$ 541
$ 495
$ 479
$ 531
$ 620
$ 536
$ 498
$ 254
$ 224
$ 551
Total sales
$ 5,167
$ 4,868
$ 4,571
$ 4,768
$ 6,042
$ 7,081
$ 8,610
$ 9,597
$ 9,184
$ 6,182
$ 6,457
Adjusted EBITDA
Margin
11%
11%
11%
10%
9%
9%
6%
5%
3%
4%
9%
Alcoa’s definition of Adjusted EBITDA is net margin plus an add-back for depreciation,
depletion, and amortization. Net margin is equivalent to Sales minus the following items: Cost of goods sold; Selling, general
administrative, and other expenses; Research and development expenses; and Provision for depreciation,
depletion, and amortization. The Other line in the table above includes gains/losses on asset sales and other
nonoperating items. Adjusted EBITDA is a non-GAAP financial measure. Management
believes that this measure is meaningful to investors because Adjusted EBITDA provides additional information with respect to
Alcoa’s operating performance and the Company’s ability to meet its financial
obligations. The Adjusted EBITDA presented may not be comparable to similarly titled measures of other companies.
|
 Alcoa
Logo
Reconciliation of Engineered Products and Solutions
Adjusted EBITDA
51
($ in millions)
2000
2001
2002
2003
2004
2005
2006
2007
2008
2009
4Q09
3Q10
4Q10
2010
After-tax operating
income (ATOI)
$ 125
$ 189
$ 63
$ 124
$ 156
$ 271
$ 365
$ 435
$ 533
$ 315
$ 57
$ 114
$ 113
$ 415
Add:
Depreciation,
depletion, and
amortization
165
186
150
166
168
160
152
163
165
177
50
37
38
154
Equity (income)
loss
(1)
–
–
–
–
–
6
–
–
(2)
(1)
(1)
–
(2)
Income taxes
79
61
39
55
65
116
155
192
222
139
20
63
53
195
Other
–
–
35
11
106
(11)
(2)
(7)
2
1
–
1
(1)
–
Adjusted Earnings
before interest,
taxes,
depreciation, and
amortization
(EBITDA)
$ 368
$ 436
$ 287
$ 356
$ 495
$ 536
$ 676
$ 783
$ 922
$ 630
$ 126
$ 214
$ 203
$ 762
Total sales
$ 3,386
$ 4,141
$ 3,492
$ 3,905
$ 4,283
$ 4,773
$ 5,428
$ 5,834
$ 6,199
$ 4,689
$ 1,097
$ 1,173
$ 1,215
$ 4,584
Adjusted EBITDA
Margin
11%
11%
8%
9%
12%
11%
12%
13%
15%
13%
11%
18%
17%
17%
Alcoa’s definition of Adjusted EBITDA is net margin plus an add-back for depreciation,
depletion, and amortization. Net margin is equivalent to Sales minus the following items: Cost of goods sold; Selling, general administrative, and
other expenses; Research and development expenses; and Provision for depreciation, depletion, and
amortization. The Other line in the table above includes gains/losses on asset sales and other nonoperating items. Adjusted
EBITDA is a non-GAAP financial measure. Management believes that this measure is meaningful
to investors because Adjusted EBITDA provides additional information with respect to Alcoa’s operating performance and the
Company’s ability to meet its financial obligations. The Adjusted EBITDA presented may not
be comparable to similarly titled measures of other companies. |