Attached files
| file | filename |
|---|---|
| 8-K - THE PANTRY, INC. FORM 8K - PANTRY INC | form8kicr.htm |

13th Annual ICR XChange Conference
Mark R. Bierley, SVP and CFO
January 12, 2011
Mark R. Bierley, SVP and CFO
January 12, 2011

Safe Harbor Statement
Some of the statements in this presentation constitute “forward-looking
statements” within the meaning of the Private Securities Litigation Reform Act
of 1995. All statements other than those of historical facts included herein,
including those related to the company’s financial outlook, goals, business
strategy, projected plans and objectives of management for future operations
and liquidity, are forward-looking statements. These forward-looking
statements are based on the company’s plans and expectations and involve a
number of risks and uncertainties that could cause actual results to vary
materially from the results and events anticipated or implied by such forward-
looking statements. Please refer to the company’s Annual Report on Form 10-
K and its other filings with the SEC for a discussion of significant risk factors
applicable to the company. In addition, the forward-looking statements
included in this presentation are based on the company’s estimates and plans
as of the date of this presentation. While the company may elect to update
these forward-looking statements at some point in the future, it specifically
disclaims any obligation to do so.
2
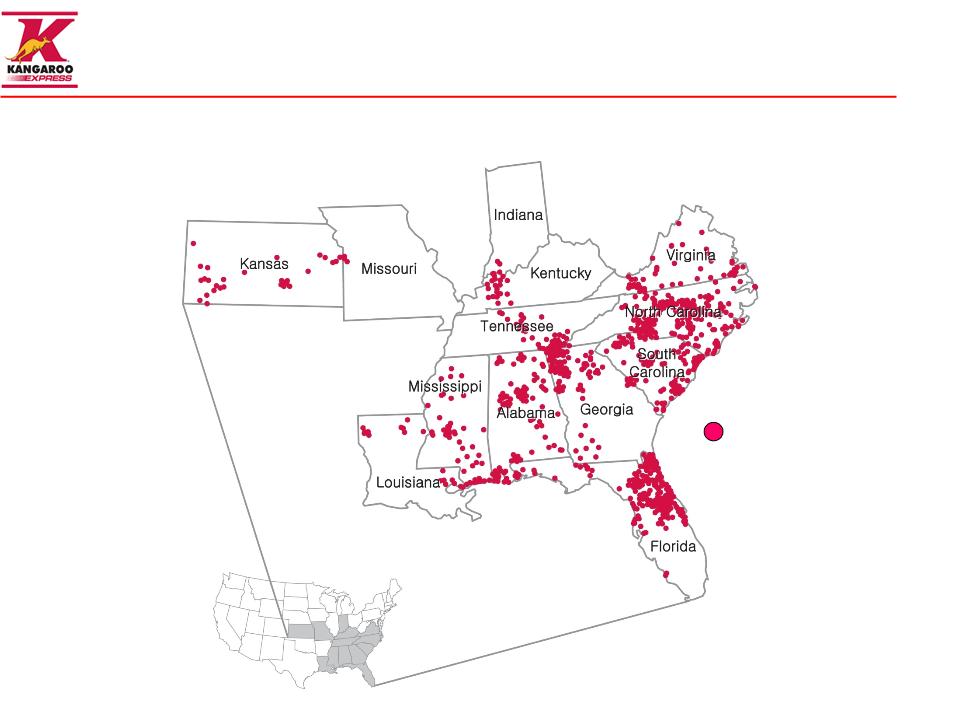
Leading convenience store retailer concentrated in the
southeastern United States
southeastern United States
3
_____________________
Note: Map is illustrative
1,667 Stores Located in Thirteen States as of January 11, 2011
Pantry Store Locations

Key Strategies
4
n Improve comp sales and merchandise gross margin with focus
on Coffee and Meals & Snacks
on Coffee and Meals & Snacks
n Invest in technology to drive effectiveness and efficiency
n 2% to 4% annual store growth target
n Accelerate EBITDA and cash flow growth

5
Why Meals & Snacks?
_____________________
(1) Represents fiscal year 2010 total merchandise gross margin for The Pantry
(2) Industry data is foodservice only for Calendar Year 2009 and Industry source is NACS SOI
1
2
Gross Margin Comparison

Focused on capturing the foodservice opportunity
6
_____________________
(1) Pantry Foodservice includes Fast Foodservice, Self-Service Fast Foods and Beverages and is for FY2010
(2) Industry Data is for Calendar Year 2009 and Industry source is NACS
Industry2
Pantry1
17%
9%
Foodservice Mix of Total Inside Sales
7
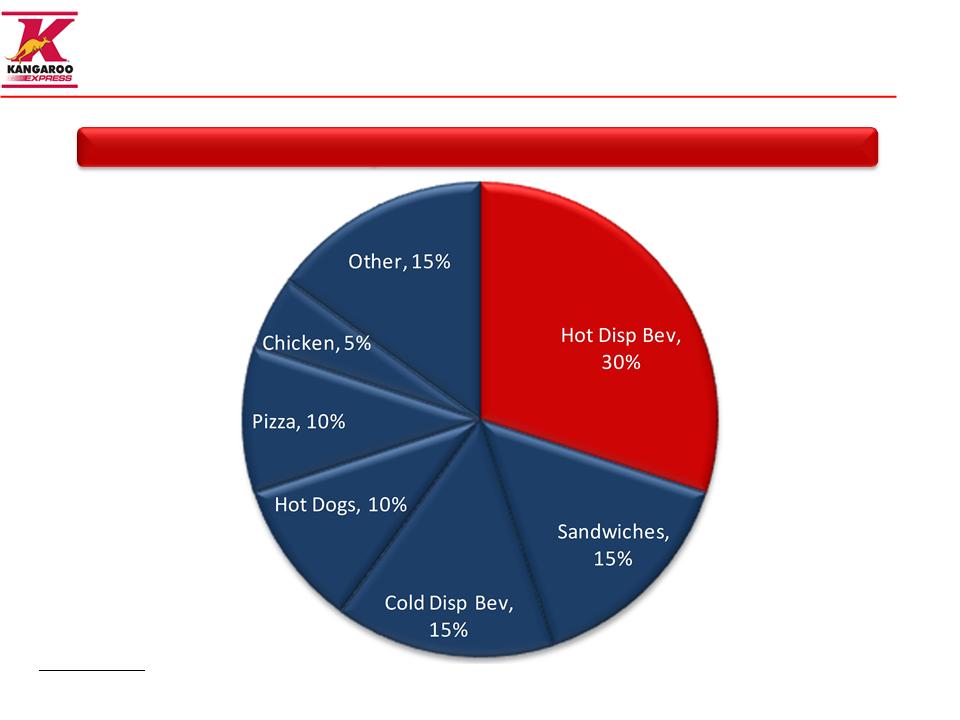
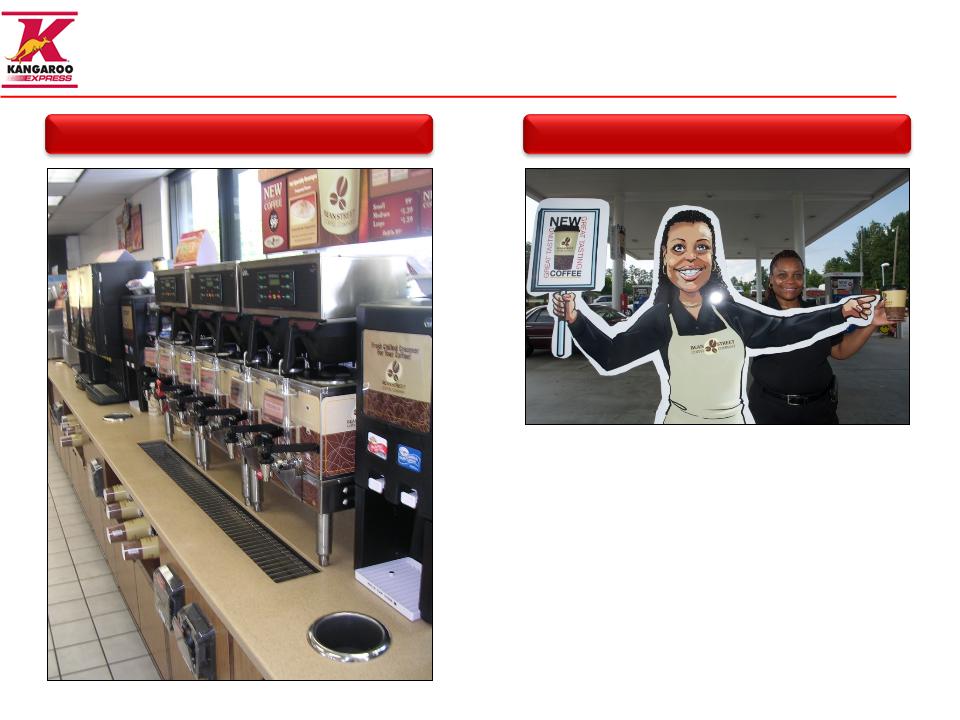
Why Coffee?
Industry Foodservice Sales Mix
Source: Convenience Store News 2009 Extended Foodservice Study. Figures based on annual 2008 average per store sales and rounded to nearest 5% interval
8
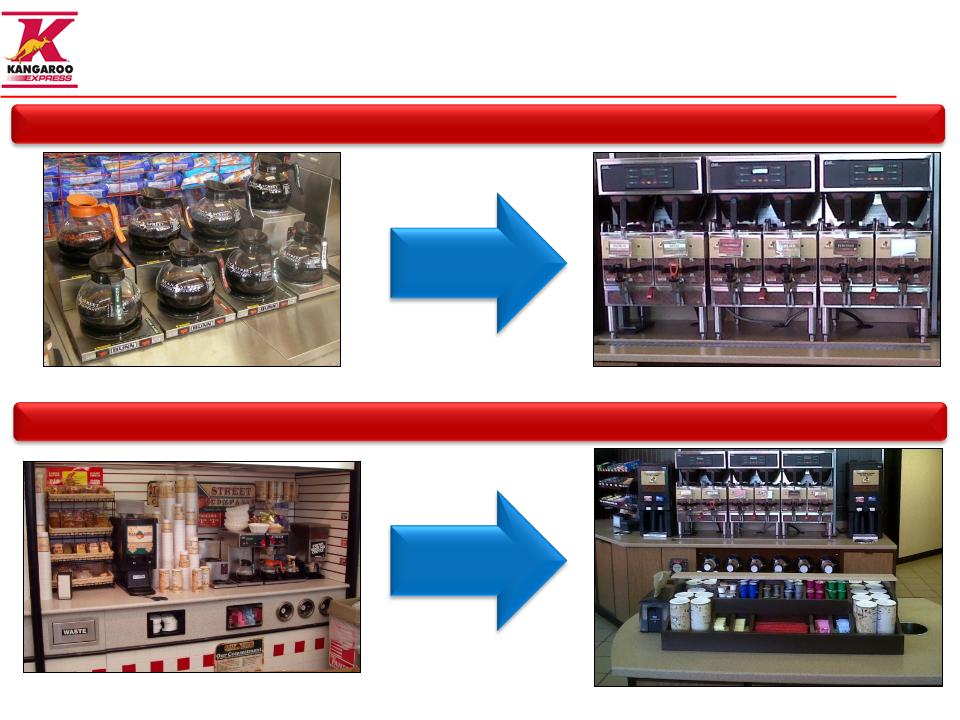
DISPENSING
PREPARATION
Bean Street Coffee Focus
9
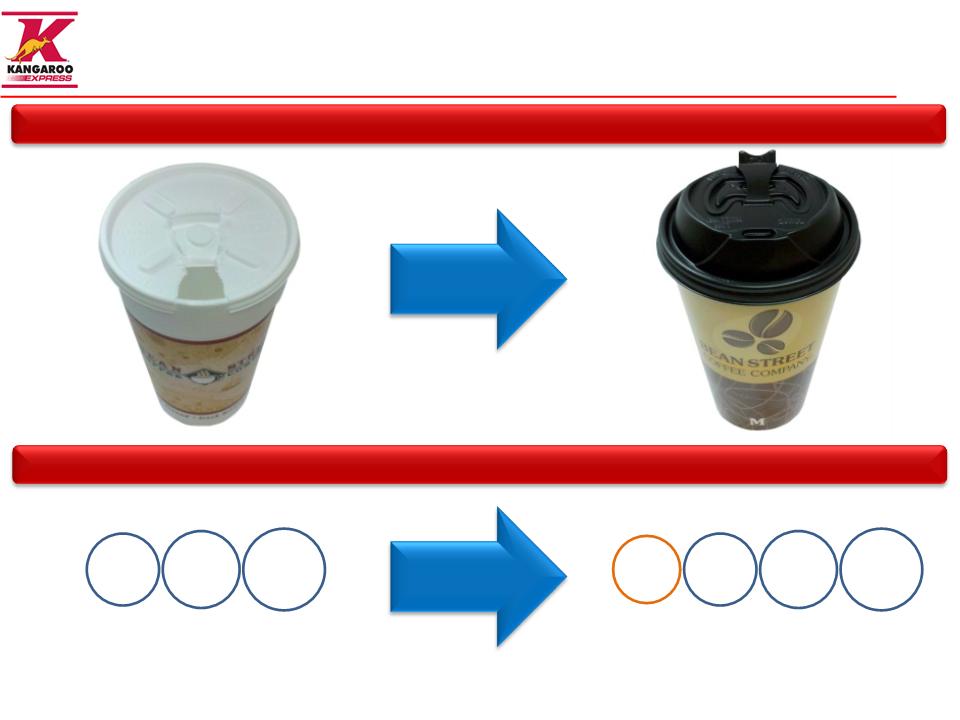
16oz
20oz
24oz
12oz
16oz
20oz
24oz
CUPS
ASSORTMENT
Bean Street Coffee Focus
10
Bean Street Coffee Focus
Coffee
Hospitality Host

11
Getting the word out
Sampling
Strategic Partnerships
Digital Relationship Marketing
“Battle for Bean Street”
Radio
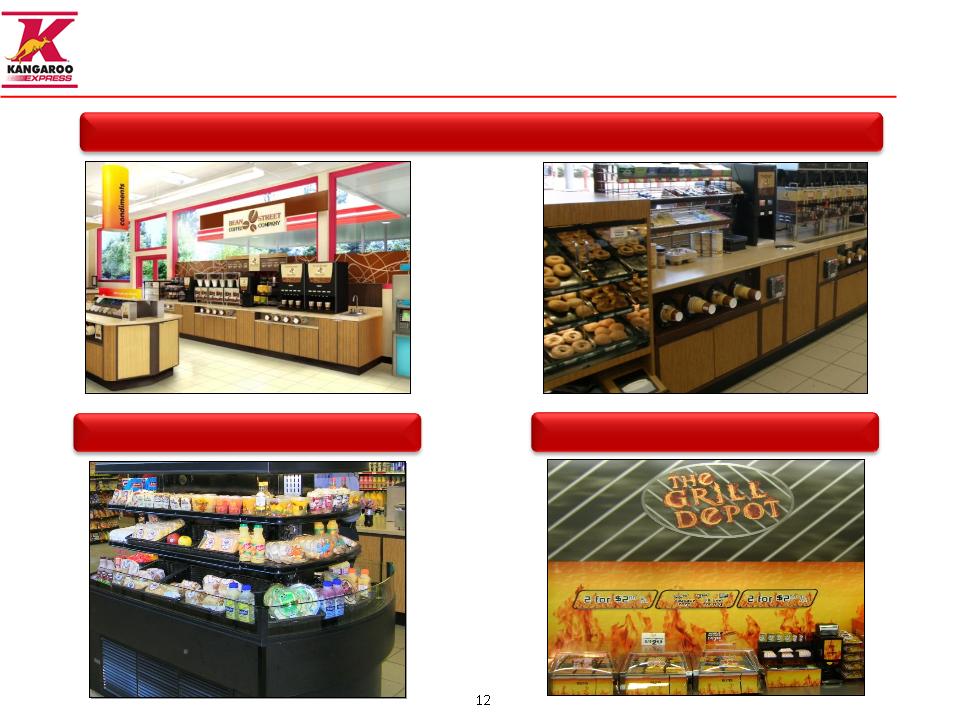
FRESH focus on breakfast, lunch, all day snacks
Lunch
Breakfast
Snacks
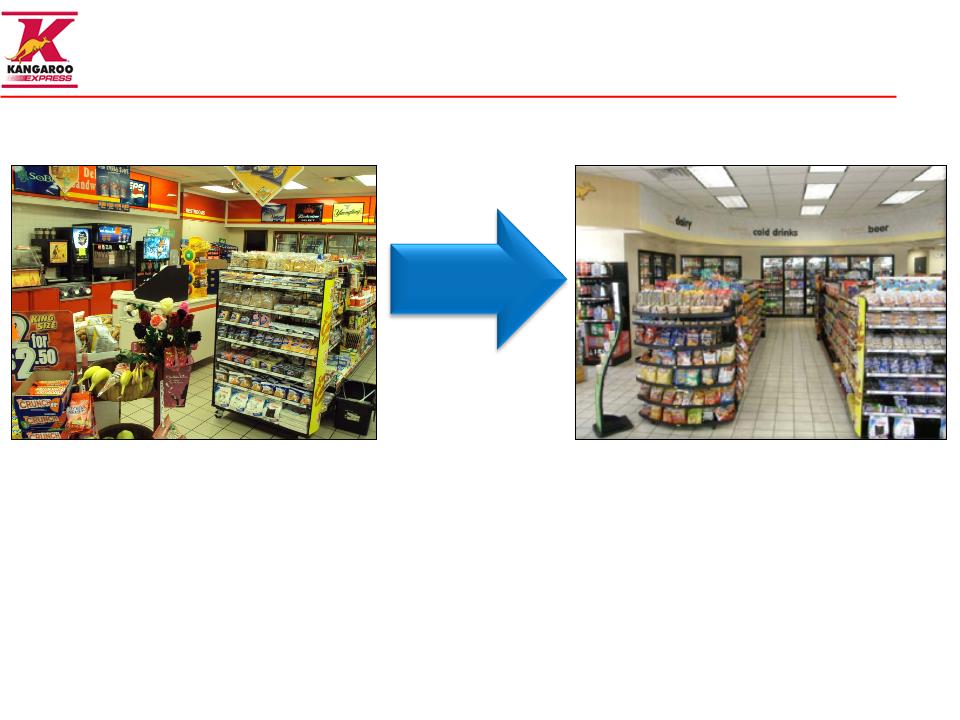
Fast, Friendly and Clean Platform
13

FRESH Program Highlights
14
n Estimated $30-45K average investment per store for Fresh elements
n Expect 20% cash on cash returns
n Coffee is King
n Breakfast, lunch and all day snack occasions
n Fast, Friendly and Clean foundation
n 130 stores completed by end of calendar 2010 (Raleigh and Charlotte)
n Expect 400 stores completed by end of calendar 2011
Financials
Focus
Roll-out

Systems investment to drive effectiveness and
efficiency
efficiency
15
n Site-level optimization
n 10 bps = $2 million
n Software fully installed across the chain as of January 11, 2011
n PCI Compliant
n Promotional flexibility
n Capturing transaction level detail
n Multi-phase initiative
- Phase 1: Task Management, launched in Q1 2011
- Phase 2: Labor Scheduling
- Phase 3: Time and Attendance
KSS Gas Pricing
Point of Sale
Workforce
Management
Management

High degree of fragmentation presents continued
consolidation opportunities
consolidation opportunities
16
79% of U.S. Convenience Stores are Single Stores or Small Chains
145,000 Total U.S. C-Stores
_____________________
Source: U.S. Convenience December 2009 Store Count (Gas and Non-Gas) from NACS/TDLinx

17
Low C-Store Channel Density1
Geographic Diversification2
= Pantry Site
= Presto Site
_____________________
(1) Stores per 10,000 residents from U.S. Census Bureau 2009 population estimates and
U.S. Convenience December 2009 Store Count (Gas and Non-Gas) from NACS/TDLinx
(2) Map is illustrative
_____________________
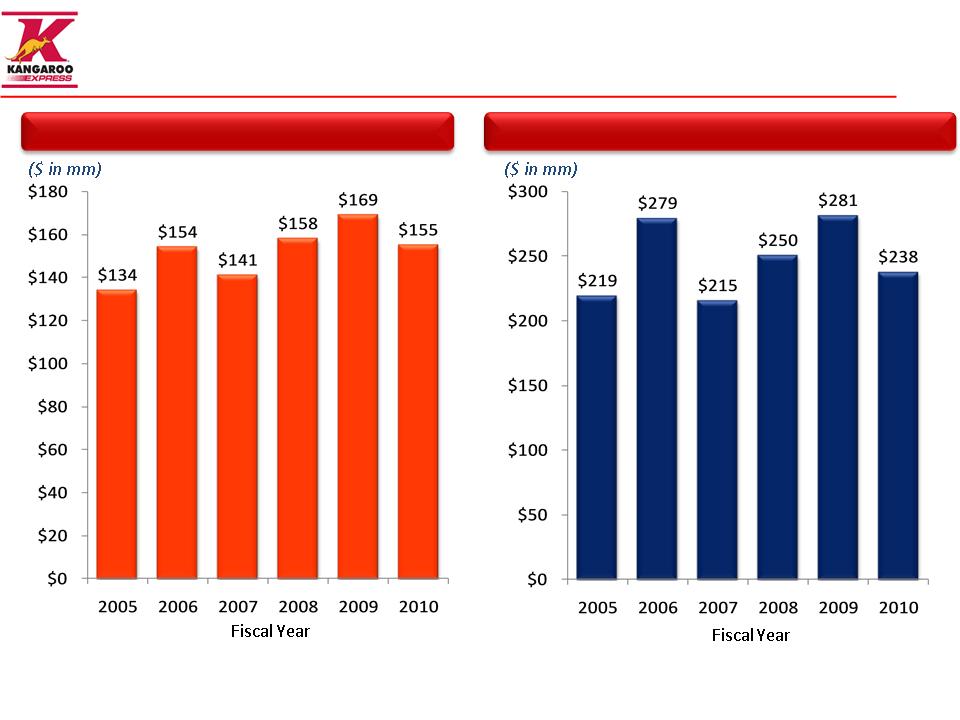
(1) Fiscal year 2010 included 53 weeks
(2) We are no longer including lease payments we make under our lease finance obligations as a reduction in our presentation of Adjusted EBITDA. See slides 27 and 28, which include a
reconciliation of Adjusted EBITDA to the most comparable U.S. GAAP financial measures.
reconciliation of Adjusted EBITDA to the most comparable U.S. GAAP financial measures.
History of consistent cash flows & Adjusted EBITDA
18
Adjusted EBITDA 2
Operating Cash Flow
1
1
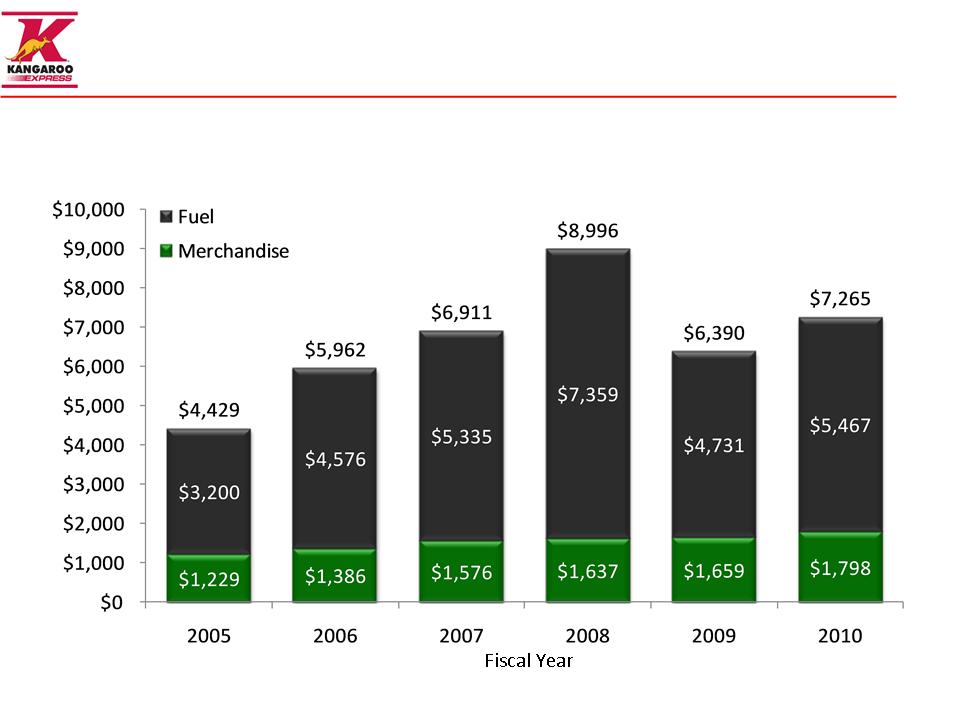
Fuel comprises the majority of revenue
19
Revenue Split: Merchandise vs. Fuel
($ in mm)
_____________________
(1) Fiscal year 2010 included 53 weeks
1
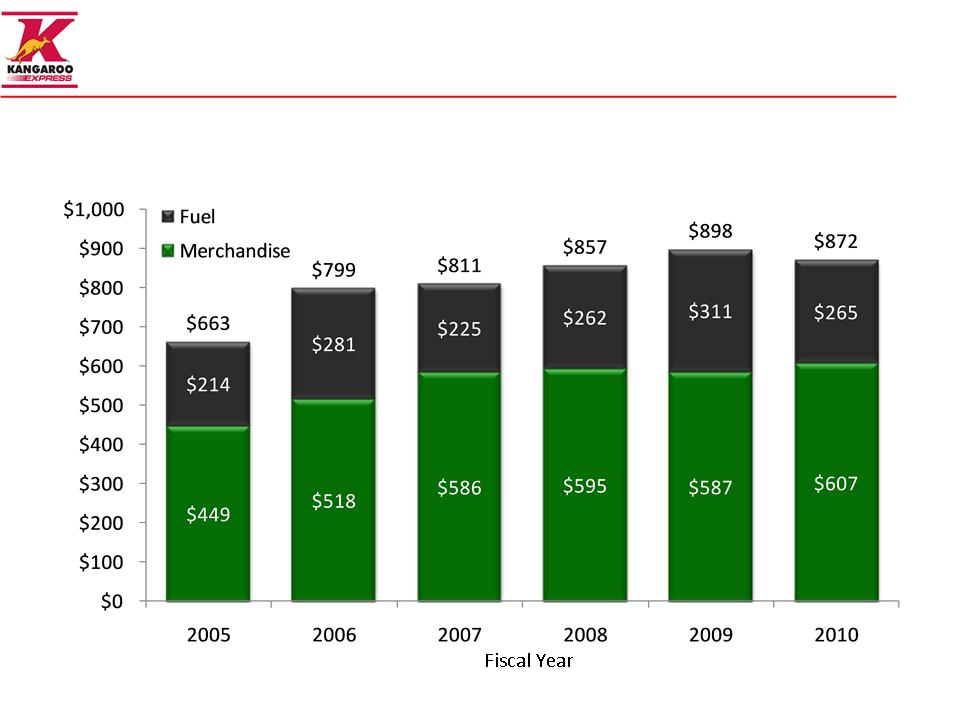
Gross profit is driven by merchandise
20
Gross Profit Split: Merchandise vs. Fuel
($ in mm)
_____________________
(1) Fiscal year 2010 is 53 weeks
1

Oil price changes drive volatility in quarterly retail
gasoline margins
gasoline margins
21
_____________________
Source: Energy Information Administration. Data represents daily average futures contract price per barrel of light sweet crude (contract 1) and CPG is net of credit card fees and repairs and
maintenance
maintenance
FY2006
FY2007
FY2008
FY2009
¢
¢
¢
¢
¢
¢
¢
FY2010
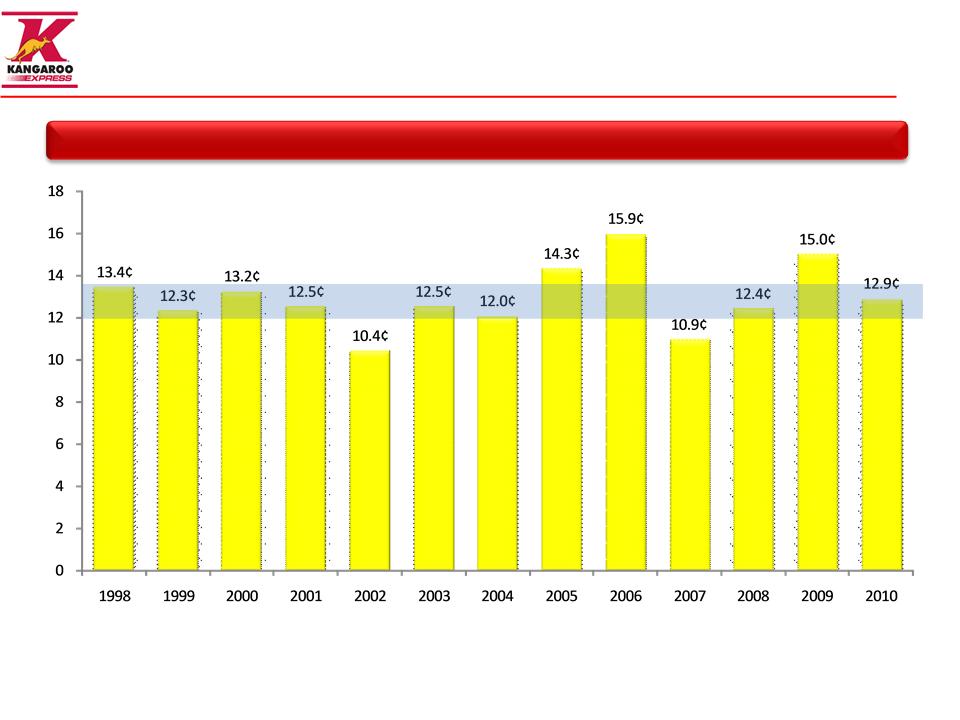
Annual CPG tends to remain relatively stable
22
Fiscal Year
_____________________
Note: Shaded area represents average historical CPG range and CPG is net of credit card fees and repairs and maintenance.
Annual Net CPG Margins Typically Range from 12.0¢ to 13.5¢
¢
¢
¢
¢
¢
¢
¢
¢
¢
¢
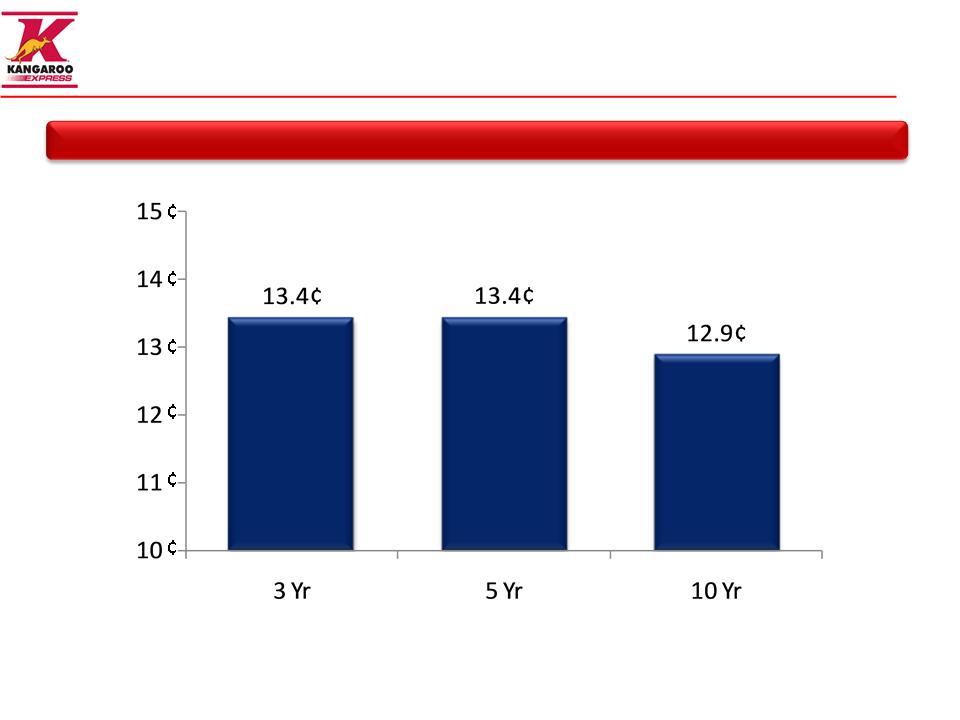
Historical averages reinforce the stability
23
Historical CPG Averages
_____________________
Note: Historical averages are non-weighted averages of each fiscal year. CPG is net of credit card fees and repairs and maintenance

Financial Flexibility
24
n Meaningful liquidity
} $201 million in cash-on-hand
} $225 million revolver - $0 drawn, approximately $106 million
available after LOCs
available after LOCs
n Long-term debt profile; earliest maturity is the convertible debt in
November 2012
November 2012
n Covenant-light bank facility
} 6.25x Adj. Net Debt / EBITDAR Leverage
} 2.25x Interest Coverage
_____________________
Note: Balance Sheet data as of September 30, 2010

Key Strategies
25
n Improve comp sales and merchandise gross margin with focus
on Coffee and Meals & Snacks
on Coffee and Meals & Snacks
n Invest in technology to drive effectiveness and efficiency
n 2% to 4% annual store growth target
n Accelerate EBITDA and cash flow growth

Appendix
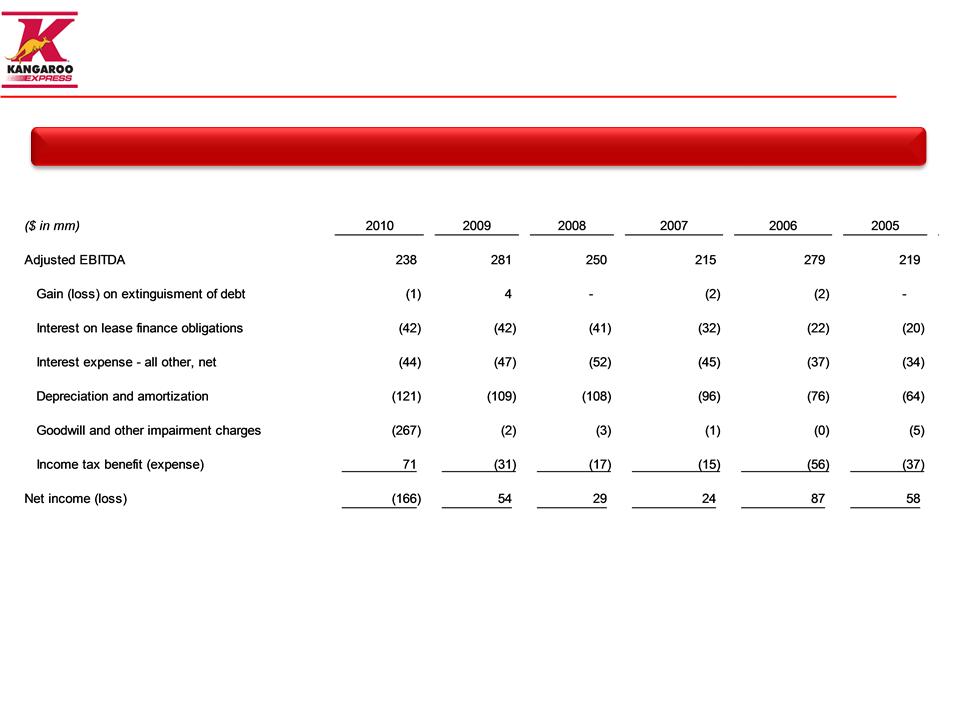
Reconciliation of Non-GAAP Measures
27
Adjusted EBITDA Reconciled to Net Income/(Loss)
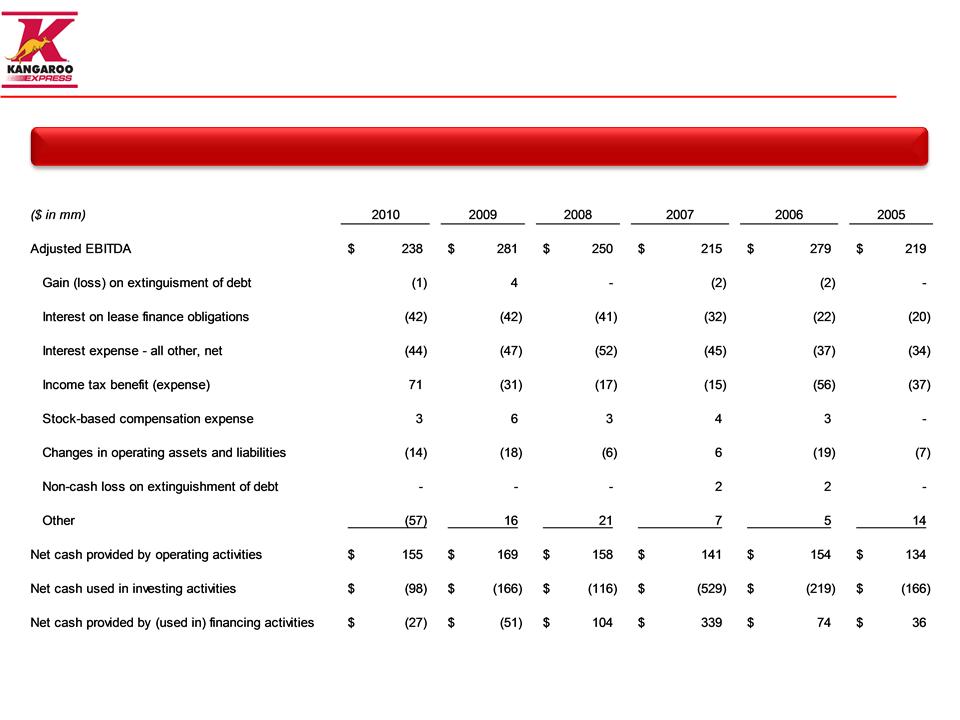
Reconciliation of Non-GAAP Measures
28
Adjusted EBITDA Reconciled to Cash Flows