Attached files
| file | filename |
|---|---|
| 8-K - FORM 8-K - CASCADE CORP | d8k.htm |
 Cascade
Corporation Leading the world in quality
attachments for industrial vehicles
Exhibit 99.1 |
 2
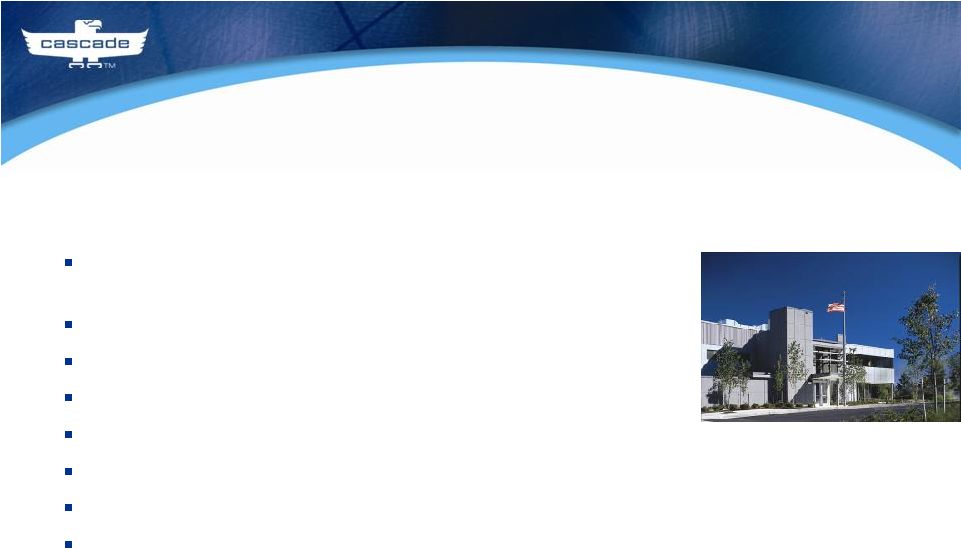
Products: Lift truck attachments for lift trucks and
construction vehicles
Headquarters: Fairview, Oregon
Employees: Approximately 1,700
Revenue (TTM): $380 million
Gross Profit (TTM): $112 million (29%)
Operating Profit (TTM): $38 million* (10%)
Net Income: $3 million*
Debt to Equity (as of 10/31/10): 0.23
Cascade Corporation (NYSE: CASC)
Headquarters in Fairview, Oregon
Note: Financial data is for trailing twelve months ended October 31,
2010. * (Excludes European restructuring costs) |
 3
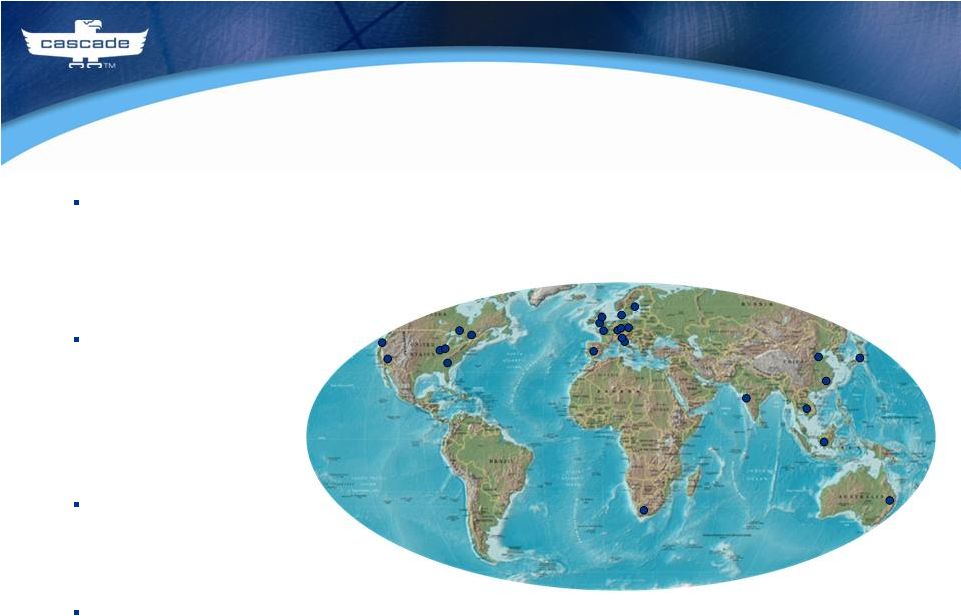
Global Locations
North America
–
Fairview, Oregon *
–
Springfield, Ohio *
–
Findlay, Ohio *
–
Warner Robins, Georgia *
–
Woodinville, Washington *
–
San Juan Capistrano, California *
–
Guelph, Canada *
–
Mississauga, Canada *
Europe
–
Ancenis, France
–
Almere, The Netherlands
–
Vaggeryd, Sweden
–
Vantaa, Finland
–
Hagen, Germany
–
Barcelona, Spain
–
Verona, Italy *
–
Brescia, Italy *
–
Manchester, England *
Asia Pacific
–
Inchon, Korea
–
Osaka, Japan
–
Brisbane, Australia *
–
Auckland, New Zealand
–
Johannesburg, South Africa
–
Mumbai, India
China
–
Hebei, China *
–
Xiamen, China *
*Manufacturing locations |
 4
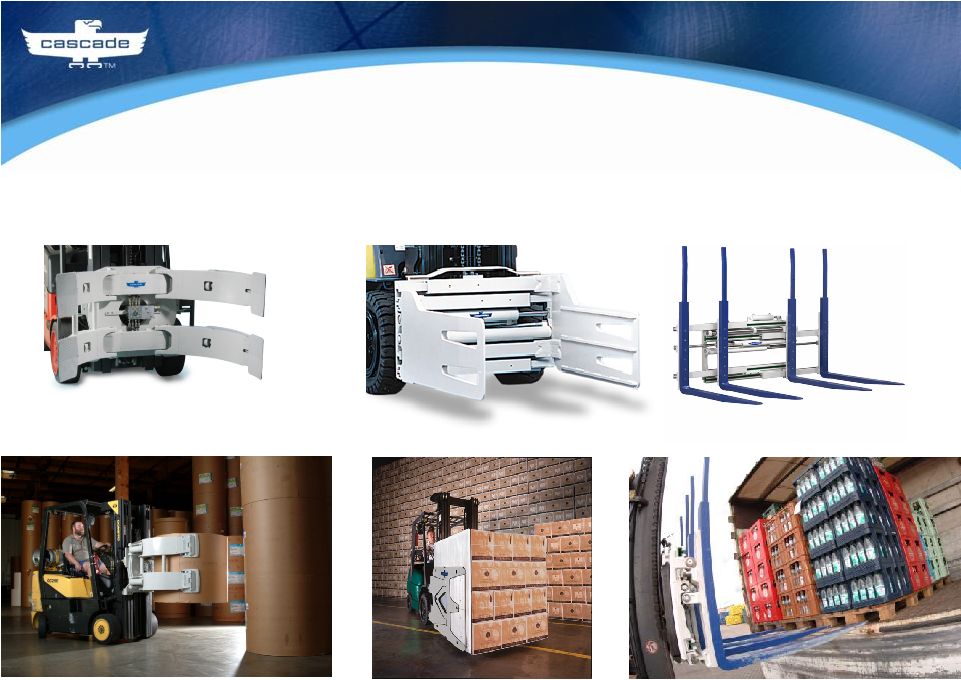
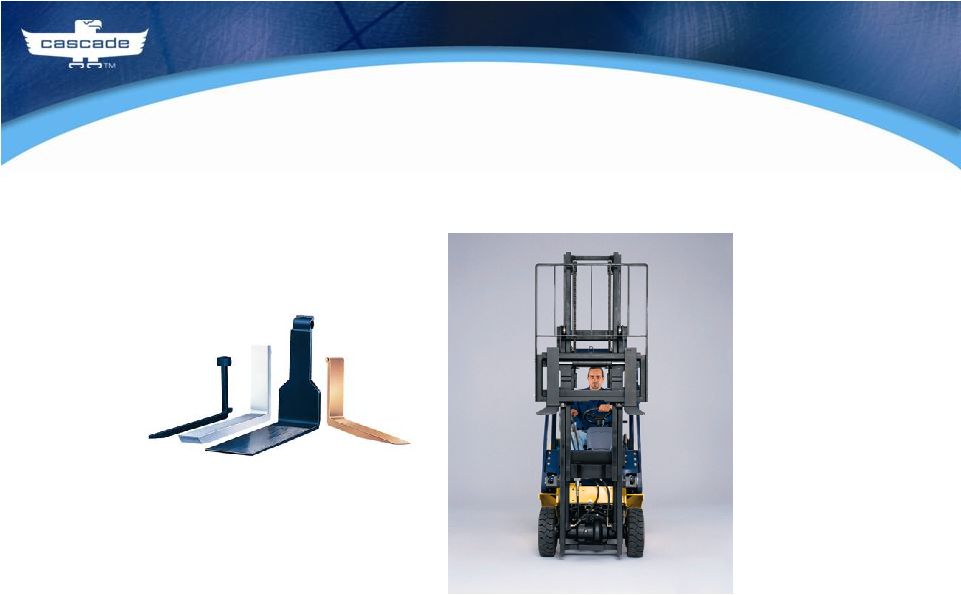
Products –
Specialized Material Handling Attachments
Paper Roll Clamps
Sliding Arm Clamps
Multiple Load Handlers |
 5
Products –
Specialized Material Handling Attachments
Primary Channel of Distribution: Original Equipment Dealers (OED) Average Price Point: $8,000 - $12,000 Customer Concentration: Low – thousands with dealers and
customers purchasing low numbers of units each End Markets: Paper, Grocery, Consumer Dry Goods, Appliances,
Consumer Electronics, General Distribution and Warehousing Degree of Customer Modification: High – Ranges from 40 to 60% General Financial Characteristics: Higher Gross Margin; Higher
SG&A to Support
|
 6
Products –
OEM (Original Equipment Manufacturer)
Forks
Sideshifters |
 7
Primary Channel of Distribution: 75% to OEM’s for “first fit”
application
and ‘after market’
sales; 25% sold through OED’s for dealer installation
Average Price Point: $200 -
$600
Customer Concentration: High –
High
percentage of sales go to a few
dozen OEM’s
End Markets: Lift truck and light duty construction vehicle manufacturers
Degree of Customer Modification: Low -
Large number of product
variations offered as standard, but low degree of specific modification
General Financial Characteristics: Lower Gross Margin. Lower SG & A
support required
Products –
Original Equipment |
 8
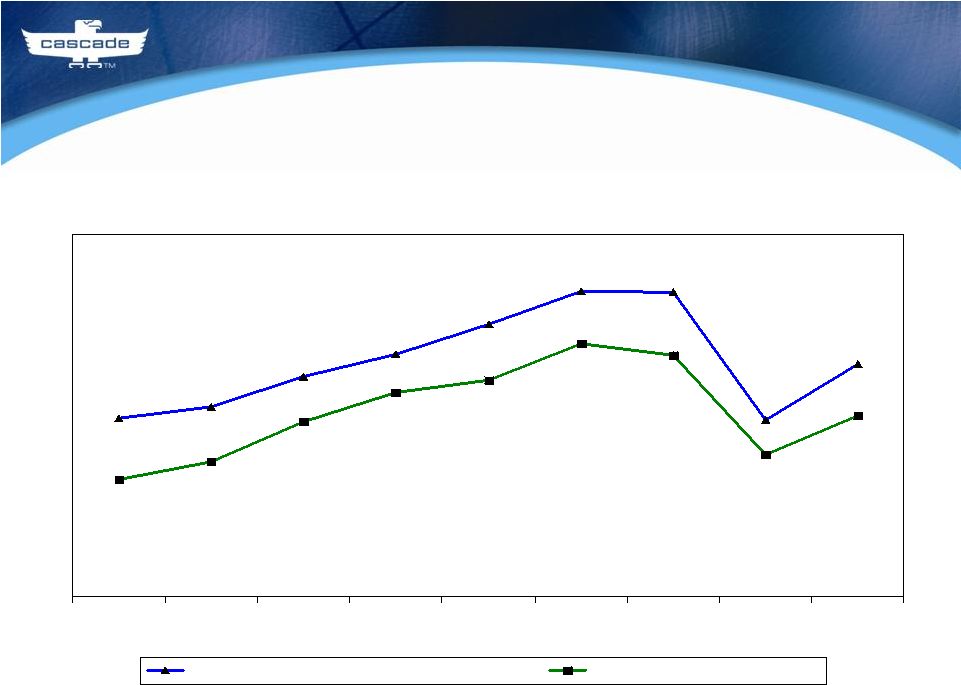
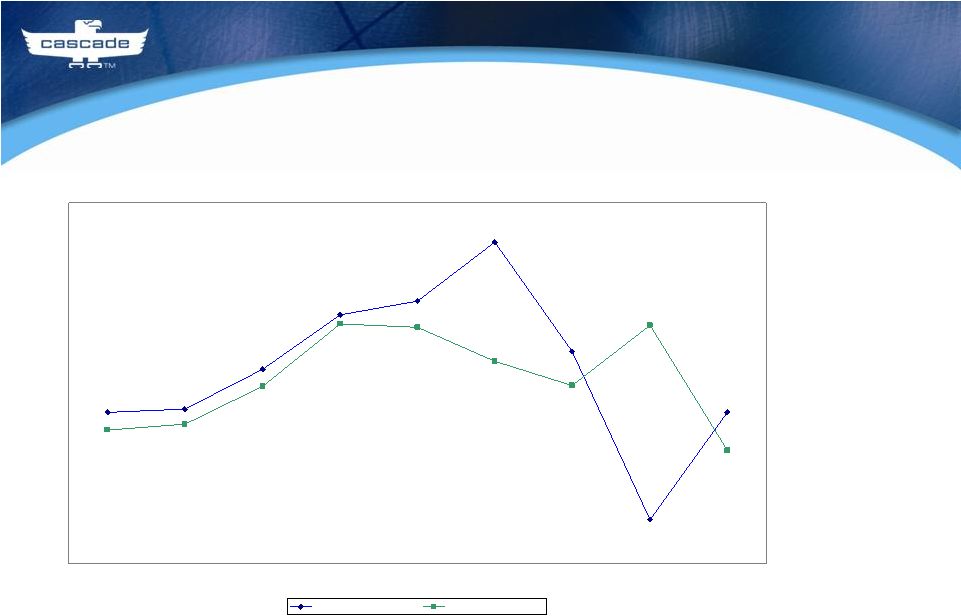
World Lift Truck Shipments & Cascade Revenue
513,000
391,000
602,000
675,000
673,000
487,000
535,000
395,000
420,000
$314,353
$400,000
$478,850
$558,073
$534,172
$385,719
$258,329
$297,756
$450,503
2003
2004
2005
2006
2007
2008
2009
2010
2011*
World Lift Truck Shipments (units)
Revenue ($thousands)
*Annualized based on nine months ended October 31, 2010.
|
 9
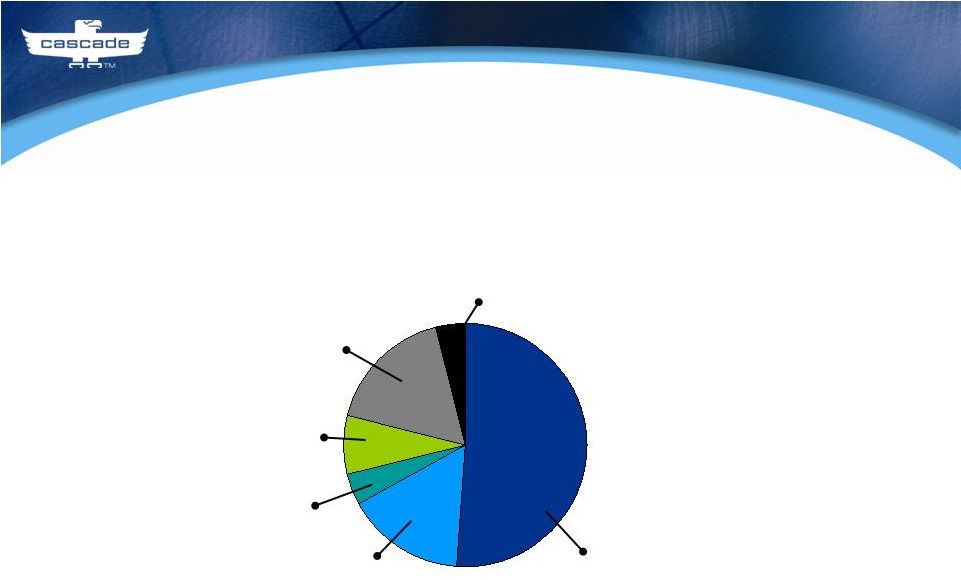
Lift Truck Products Market Share -
World
Cascade 50%
Other 18%
Vetter (Germany) 4%
MSI (UK) 4%
Bolzoni
/ Auramo
/ Meyer (Italy) 16%
Kaup
(Germany) 8% |
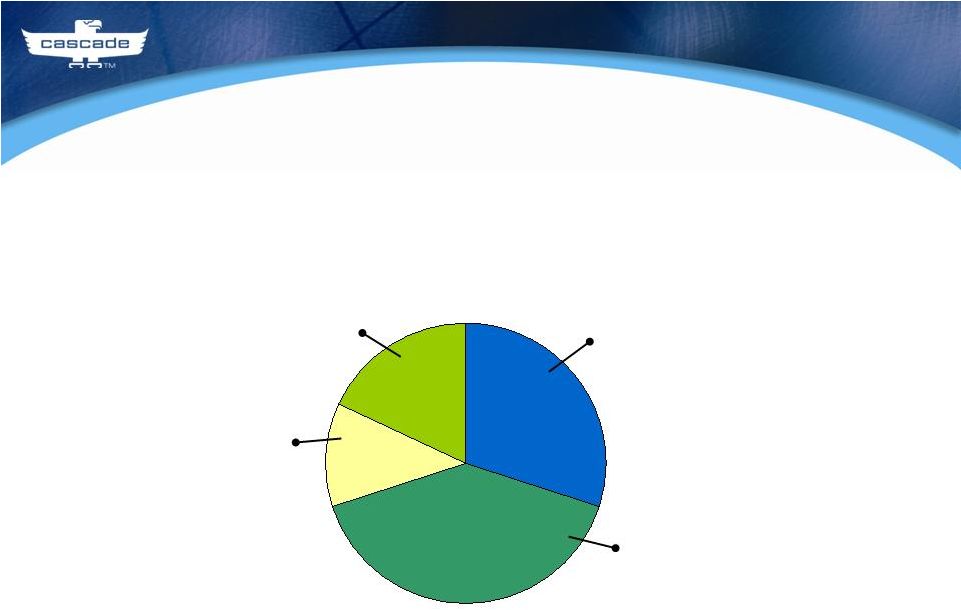
 10
Lift Truck Market
China -
25%
Asia Pacific -
36%
North America -
19%
Europe -
21% |
 11
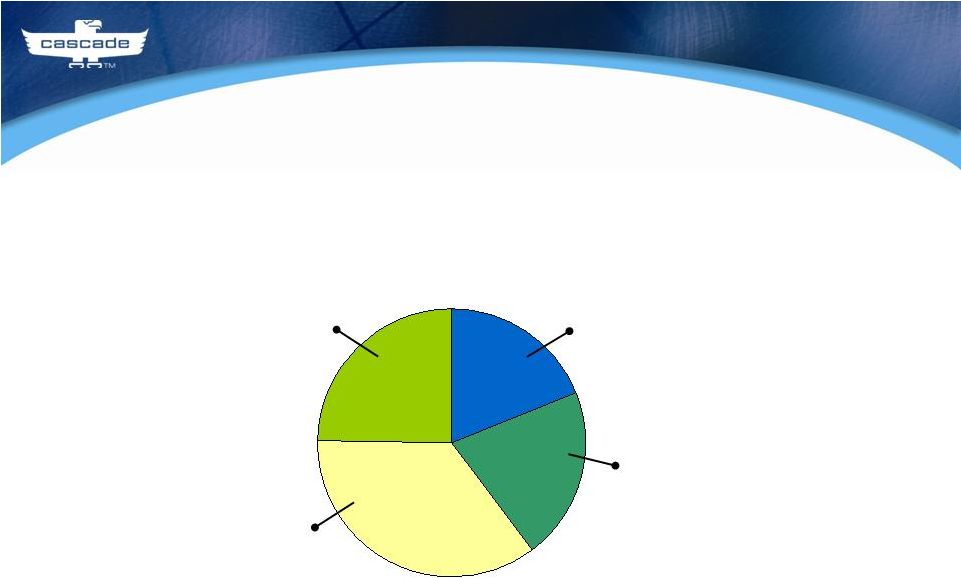
Attachment/Fork Market
China -
18%
Asia Pacific -
12%
North America -
30%
Europe -
40% |
 12
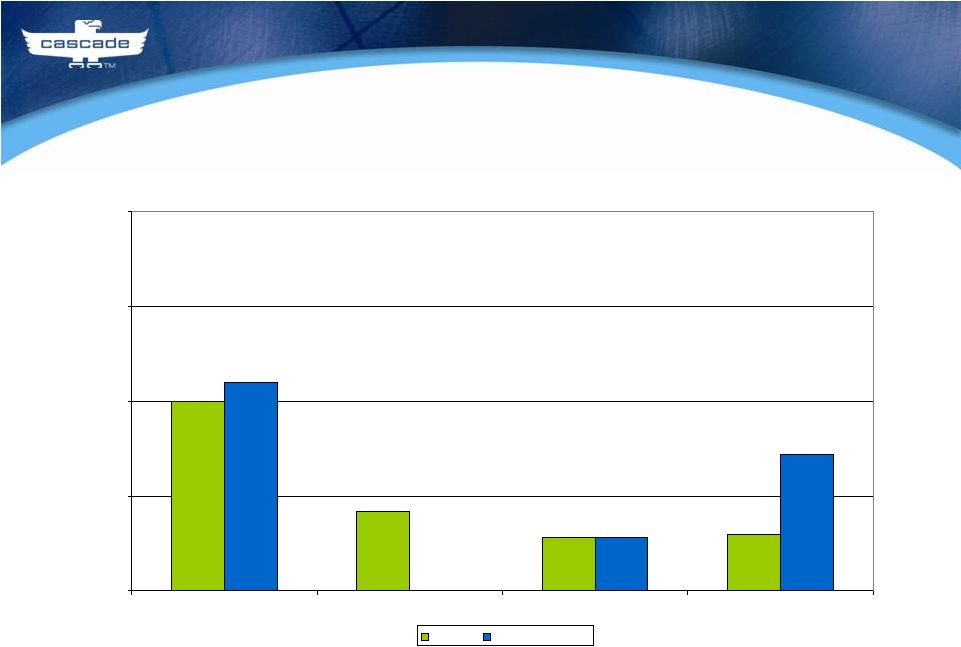
Revenue and Operating Income
50%
21%
14%
15%
55%
0%
14%
36%
0%
25%
50%
75%
100%
North America
Europe
Asia Pacific
China
Revenue
Operating Income |
 13
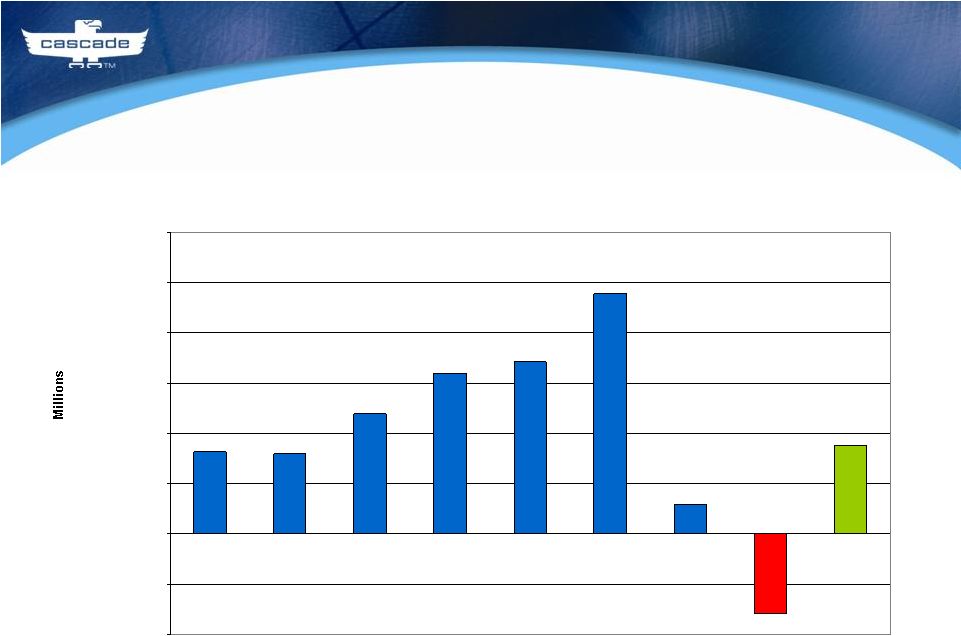
Cascade Operating Income (Loss)
2003
2004
2005
2006
2007
2008
2009
2011*
$35.3
$11.5
$95.6
$68.4
$63.9
$47.8
$32.0
$32.8
$(31.5)
$(40.0)
$(20.0)
$-
$20.0
$40.0
$60.0
$80.0
$100.0
$120.0
*Nine months ended October 31, 2010.
2010 |
 14
Quarterly Results*
Q1
Q2 Q3 Q4
Q1
Q2 Q3 Q4
Q1
Q2 Q3
2009
2010
2011
*Excluding impairment charge and restructuring costs.
$139.0
$98.0
$107.0
($4.2)
$1.0
$0.6
$0.6
$94.0
$81.0
$81.0
$77.0
$76.0
$95.0
$150.0
$150.0
$9.5
$10.4
$15.4
$6.3
$17.8
$18.5
$17.7
-$20.0
$0.0
$20.0
$40.0
$60.0
$80.0
$100.0
$120.0
$140.0
$160.0
Net sales
Operating income (loss) |
 15
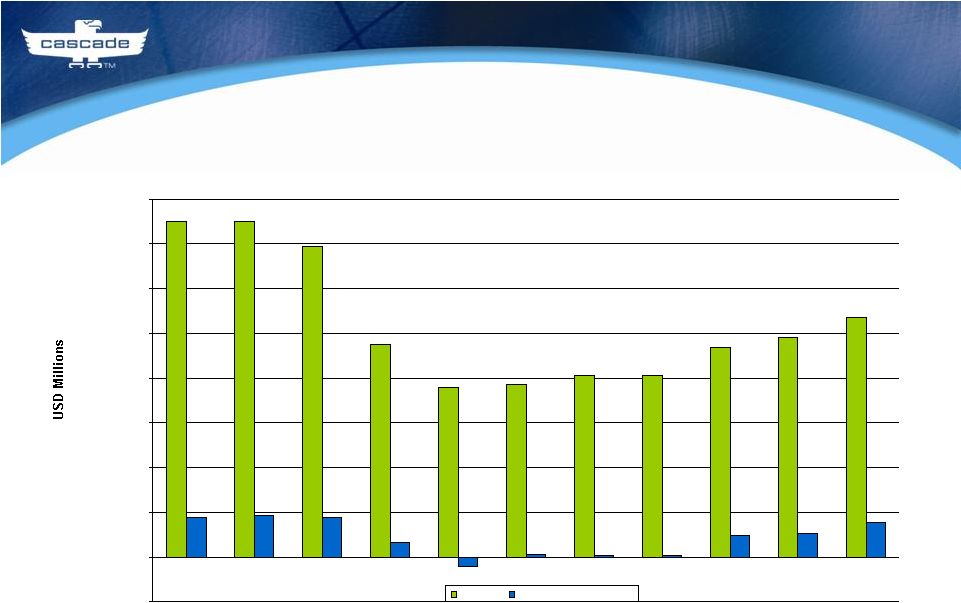
Cascade Net Income (Loss) & Free Cash Flow
(Free Cash Flow = Cash from Operations –
Maintenance CAPEX)
2009 net income excludes asset impairment charge ($31,576)
2010 net income excludes European restructuring charge ($29,519)
*2011 –
Nine months ended October 31, 2011
$32,843
$39,031
$18,506
$17,707
$28,490
$42,051
$45,481
$60,147
($9,130)
$17,682
$39,845
$14,838
$13,276
$24,227
$30,518
$24,377
$39,479
$8,280
2003
2004
2005
2006
2007
2008
2009
2010
2011*
Net Income (Loss) ($000)
Free Cash Flow ($000) |
 16
Europe Revenue and Operating Income (Loss) by Quarter*
Q1
Q2 Q3 Q4
Q1
Q2 Q3 Q4
Q1 Q2 Q3
2009
2010
2011
*Net of restructuring costs.
29,538
17,218
17,013
-5,611
-174
-2,017
-5,611
-3,051
-4,684
-4,590
-1,826
-1,015
-586
16,477
14,434
12,810
14,907
16,060
21,488
30,985
32,115
1,212
-10,000
-5,000
0
5,000
10,000
15,000
20,000
25,000
30,000
35,000
Revenue
Operating income (loss), net |
 17
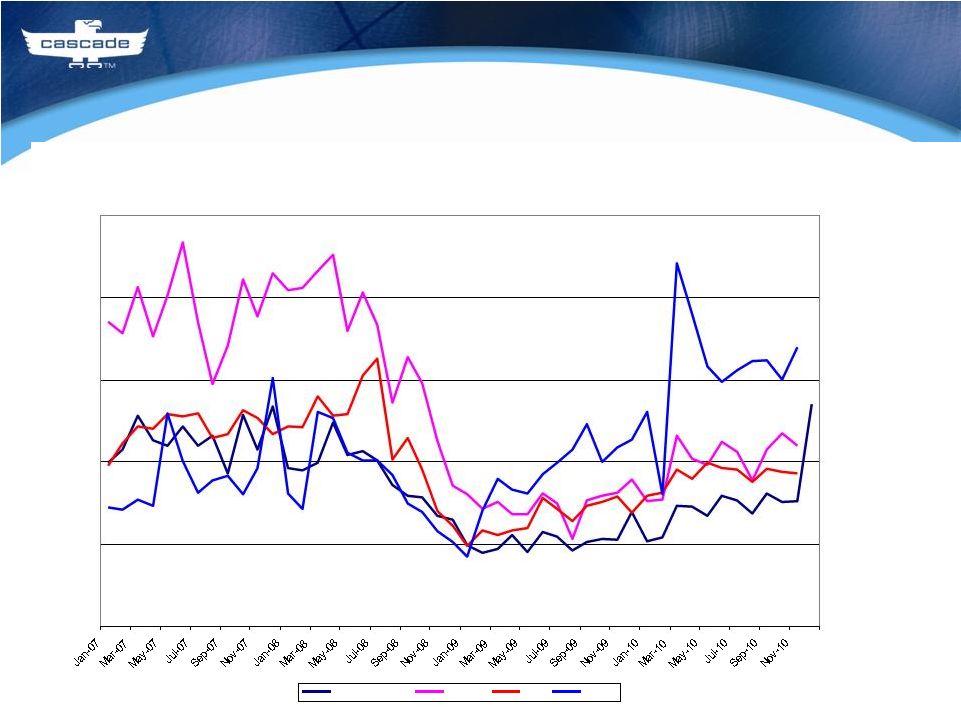
Global Lift Truck Order Trends
Data for Europe, Asia Pacific and China shown through
November 2010. Data for North America shown through December 2010.
North America
Europe
Asia
China |