Attached files
| file | filename |
|---|---|
| 8-K - EINSTEIN NOAH RESTAURANT GROUP, INC. 8-K - EINSTEIN NOAH RESTAURANT GROUP INC | a6567938.htm |
Exhibit 99.1
1 Investor Presentation January 2011
2 Welcome & Agenda Company Overview & Vision Growing Same-Store Sales Enhancing Corporate Margins Accelerating Unit Growth Financial Overview Q&A
3 Presenters Jeff O’Neill President & Chief Executive Officer Manny Hilario Chief Financial Officer
4 Safe Harbor This presentation contains certain forward-looking statements, within the meaning of Section 27A of the Securities Act of 1933, as amended, and Section 21E of the Securities Exchange Act of 1934, as amended, that are intended to be covered by the safe harbor created by such sections and other applicable laws and which reflect management's expectations regarding future events and operating performance and speak only as of the date hereof. Words such as “expect(s)”, “feel(s)”, “believe(s)”, “will”, “may”, “anticipate(s)”, “estimate(s)”, “should”, “intend(s)” and similar expressions are intended to identify forward-looking statements. Forward-looking statements involve a number of risks and uncertainties which could cause actual results to differ materially from future results expressed, projected or implied by such forward looking statements. A description of factors that could cause actual results to differ materially from those expressed in, or underlying, these forward-looking statements is detailed in the Company’s press releases and filings with the Securities and Exchange Commission, and include the following factors: shifting consumer preferences, economic conditions, cash availability, weather, and competition, among other factors; our future growth plans are subject to those same factors as well as the availability of capital, the success of our marketing efforts and the success of franchisees and licensees to build and open locations. The Company does not undertake any obligation to release publicly revisions to any “forward-looking statement,” to reflect events or circumstances after the date of this presentation, or to reflect the occurrence of unanticipated events, except as may be required under applicable securities laws. All projections are preliminary and based on estimates and assumptions about circumstances and events that have not yet taken place and are inherently uncertain and therefore are subject to change, as results may vary. Statements related to 2010 unit development are estimates only and are subject to change based on actual results. Statements regarding new store sales, capital investment and cash on cash return are averages and actuals may vary based on geographic location, labor, construction costs, including landlord contribution, distribution considerations, rent, among other factors. System-wide sales include sales from company-owned, franchised and licensed stores. This presentation includes certain non-GAAP financial measures. Reconciliations of such non-GAAP financial measures are included at the end of the presentation.

5 Jeff O’Neill Chief Executive Officer
6 Our Vision Drive revenue growth through leadership in fresh baked healthy innovation and accelerated franchise growth delivering consistent reliable growth in earnings. Leaders in fresh baked goodness Asset light franchise first model Disciplined operations effectiveness
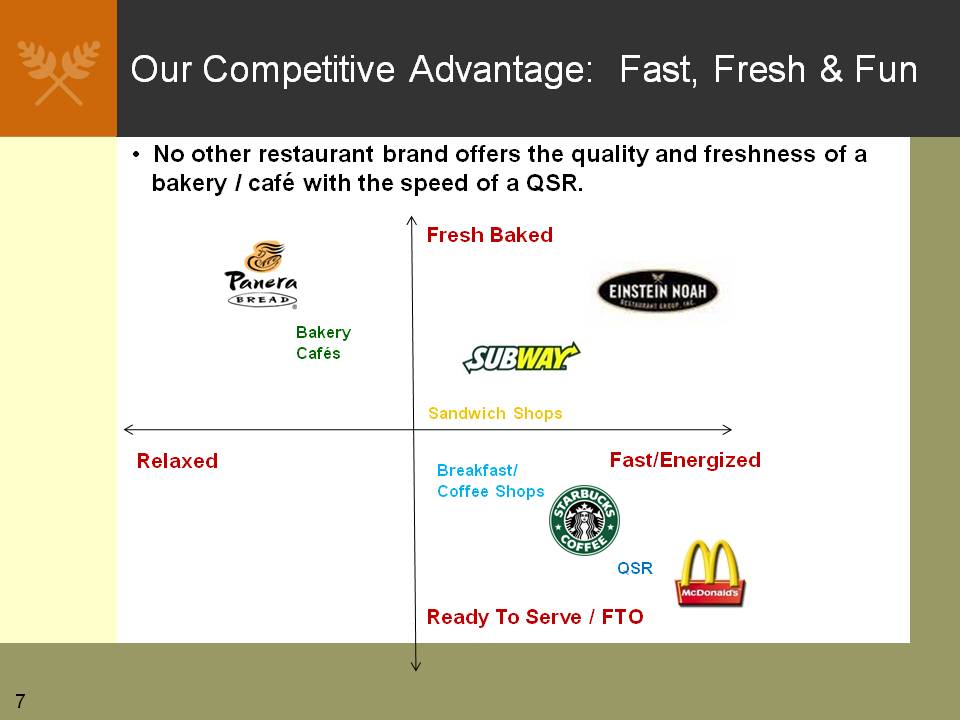
7 Our Competitive Advantage: Fast, Fresh & Fun No other restaurant brand offers the quality and freshness of a bakery / café with the speed of a QSR. Bakery Cafés Sandwich Shops Fresh Baked QSR Fast/Energized Relaxed Ready To Serve / FTO Breakfast/ Coffee Shops
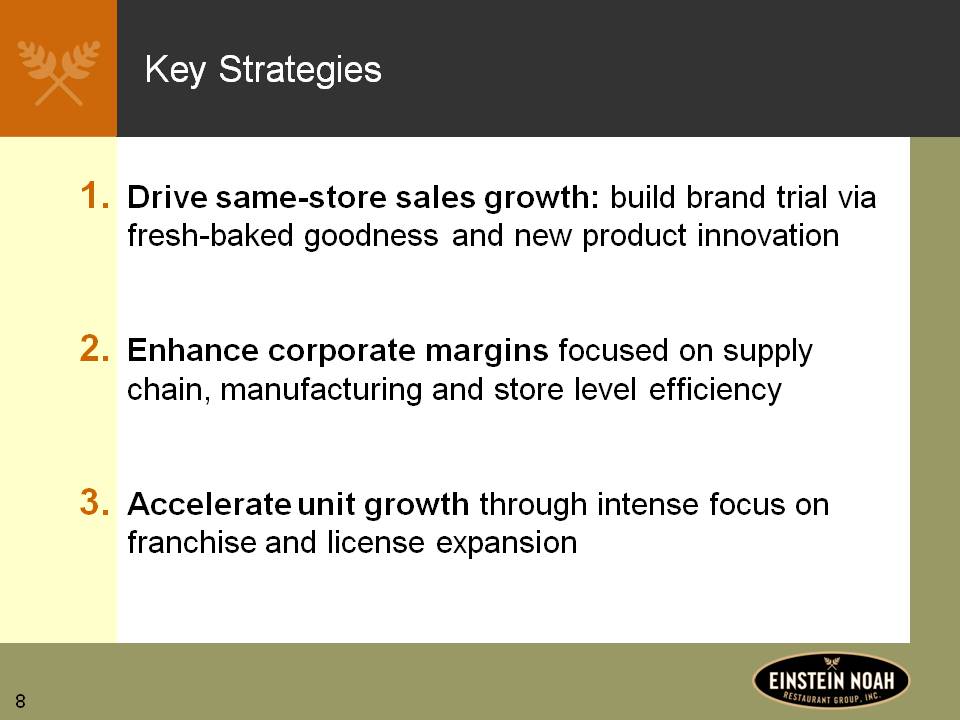
8 Key Strategies Drive same-store sales growth: build brand trial via fresh-baked goodness and new product innovation Enhance corporate margins focused on supply chain, manufacturing and store level efficiency Accelerate unit growth through intense focus on franchise and license expansion
9 Same Store Sales Growth
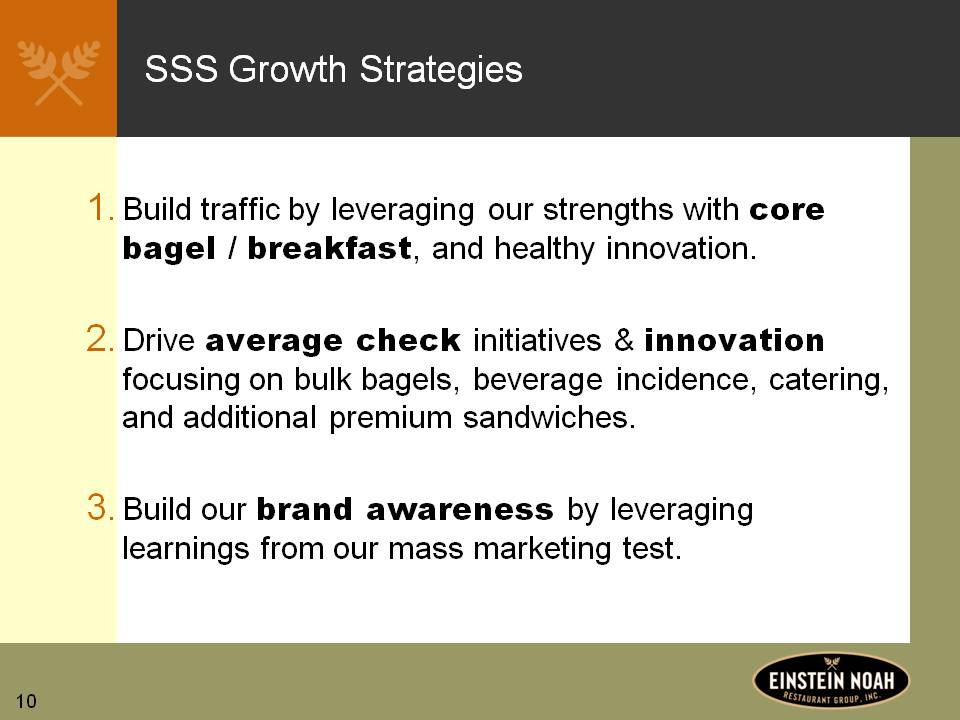
10 SSS Growth Strategies Build traffic by leveraging our strengths with core bagel / breakfast, and healthy innovation. Drive average check initiatives & innovation focusing on bulk bagels, beverage incidence, catering, and additional premium sandwiches. Build our brand awareness by leveraging learnings from our mass marketing test.
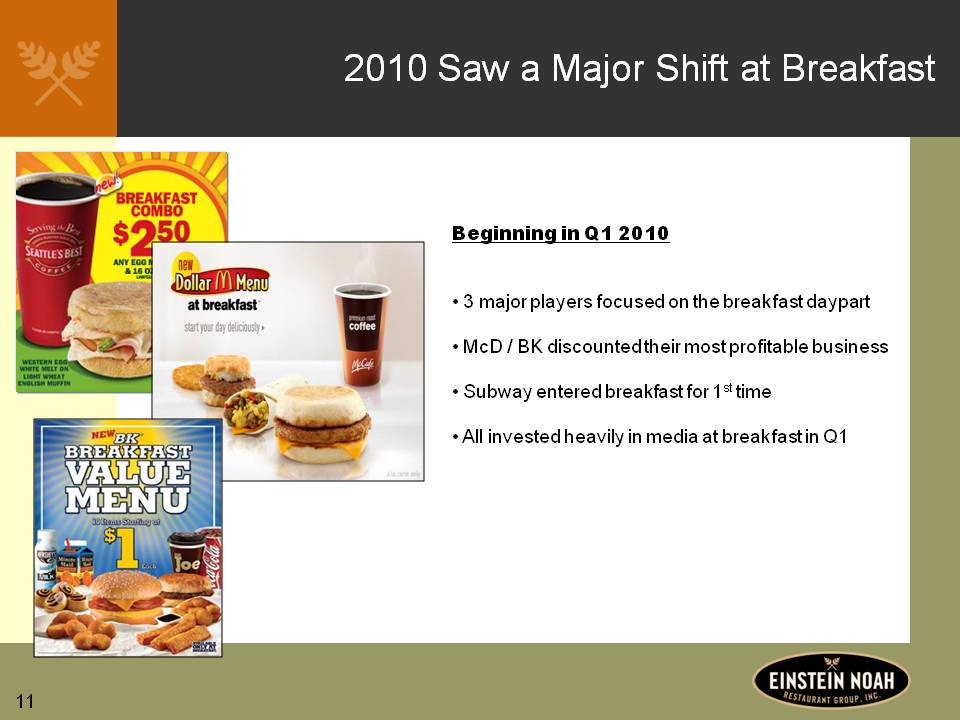
11 2010 Saw a Major Shift at Breakfast Beginning in Q1 2010 3 major players focused on the breakfast day part McD / BK discounted their most profitable business Subway entered breakfast for 1st time All invested heavily in media at breakfast in Q1
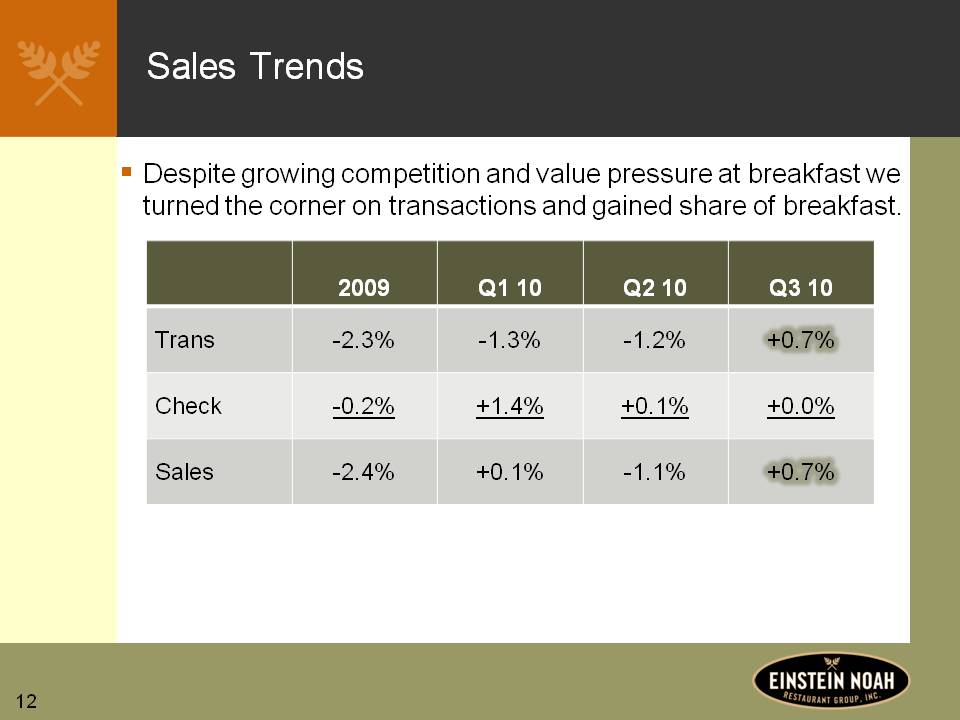
12 Sales Trends Despite growing competition and value pressure at breakfast we turned the corner on transactions and gained share of breakfast. Trans Check Sales 2009 Q1 10 Q2 10 Q3 10 -2.3% -1.3% -1.2% +0.7% -0.2% +1.4% +0.1% +0.0% -2.4% +0.1% -1.1% +0.7%
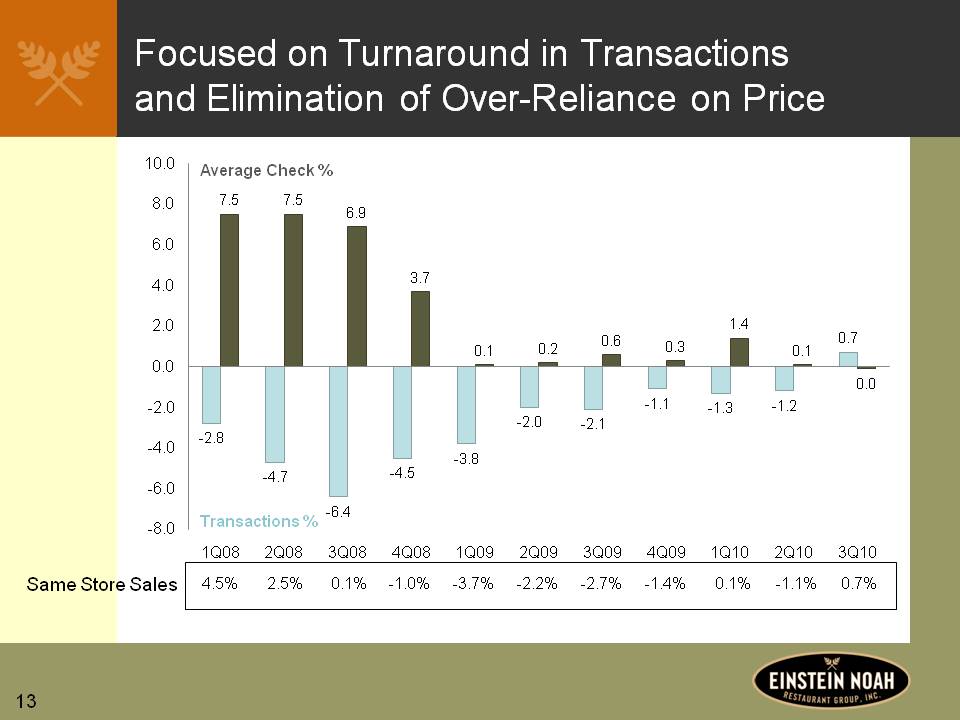
13 Focused on Turnaround in Transactions and Elimination of Over-Reliance on Price Average Check % Transactions % Same Store Sales 4.5% 2.5% 0.1% -1.0% -3.7% -2.2% -2.7% -1.4% 0.1% -1.1% 0.7% 1Q08 2Q08 3Q08 4Q08 1Q09 2Q09 3Q09 4Q09 1Q10 2Q10 3Q10 -2.8 7.5 -4.7 7.5 -6.4 6.9 -4.5 3.7 -3.8 0.1 -2.0 0.2 -2.1 0.6 -1.1 0.3 -1.3 1.4 -1.2 0.1 0.7 0.0
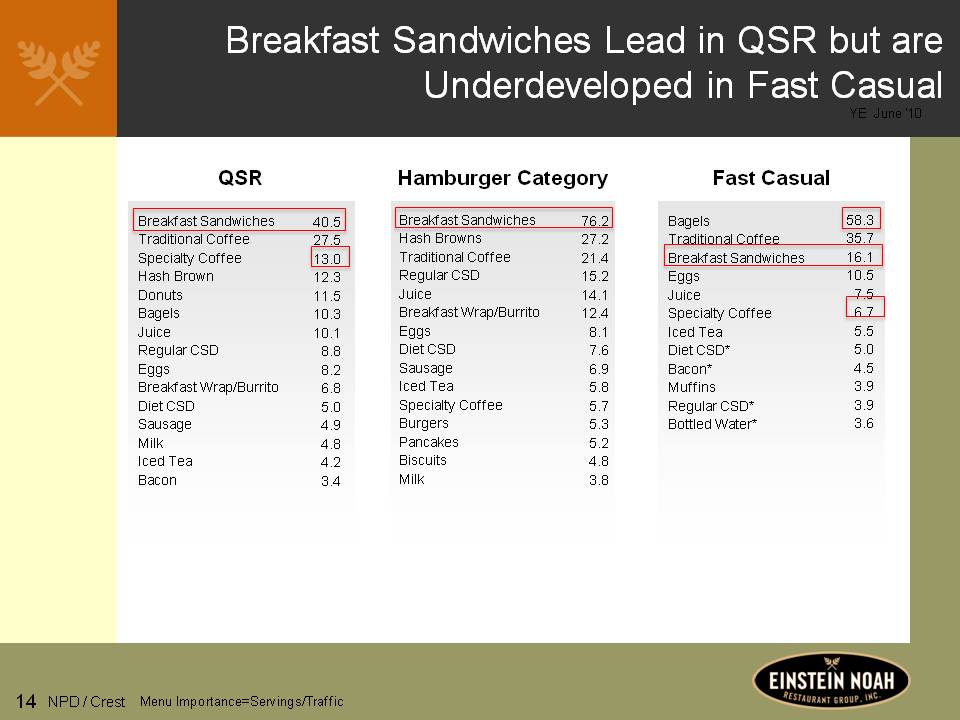
14 Breakfast Sandwiches Lead in QSR but are Underdeveloped in Fast Casual YE June ‘10 QSR Hamburger Category Fast Casual NPD / Crest Menu Importance=Servings/Traffic Breakfast Sandwiches 40.5 Traditional Coffee 27.5 Specialty Coffee 13.0 Hash Brown 12.3 Donuts 11.5 Bagels 10.3 Juice 10.1 Regular CSD 8.8 Eggs 8.2 Breakfast Wrap/Burrito 6.8 Diet CSD 5.0 Sausage 4.9 Milk 4.8 Iced Tea 4.2 Bacon 3.4 Breakfast Sandwiches 76.2 Hash Browns 27.2 Traditional Coffee 21.4 Regular CSD 15.2 Juice 14.1 Breakfast Wrap/Burrito 12.4 Eggs 8.1 Diet CSD 7.6 Sausage 6.9 Iced Tea 5.8 Specialty Coffee 5.7 Burgers 5.3 Pancakes 5.2 Biscuits 4.8 Milk 3.8 Bagels 58.3 Traditional Coffee 35.7 Breakfast Sandwiches 16.1 Eggs 10.5 Juice 7.5 Specialty Coffee 6.7 Iced Tea 5.5 Diet CSD* 5.0 Bacon* 4.5 Muffins 3.9 Regular CSD* 3.9 Bottled Water* 3.6
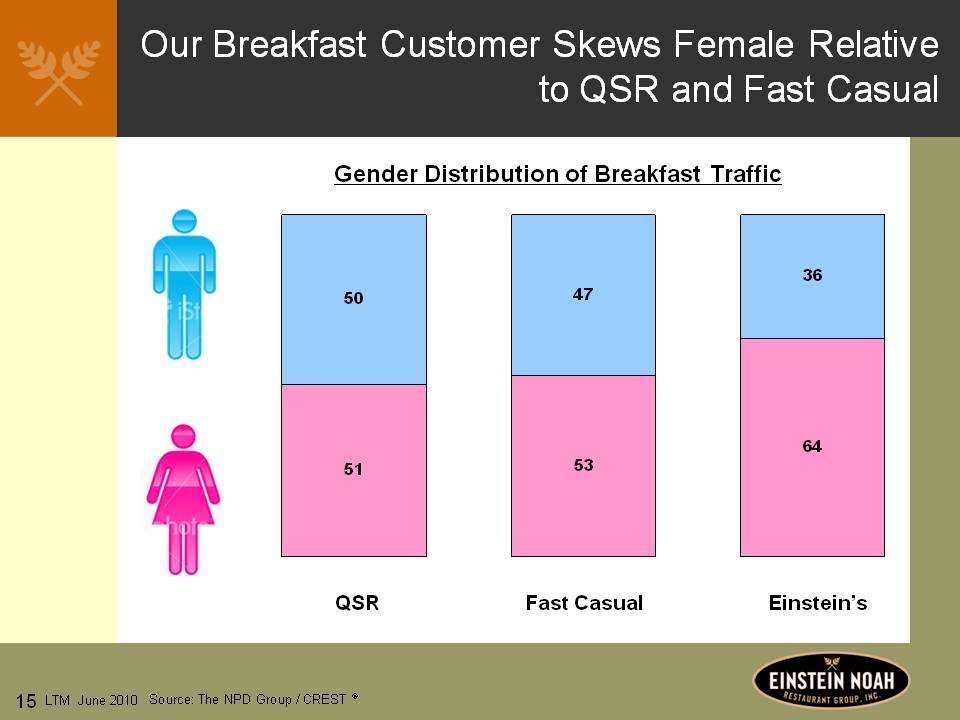
15 Our Breakfast Customer Skews Female Relative to QSR and Fast Casual Gender Distribution of Breakfast Traffic QSR 50 51 Fast Casual 47 53 Einstein’s 36 64 LTM June 2010 Source: The NPD Group / CREST
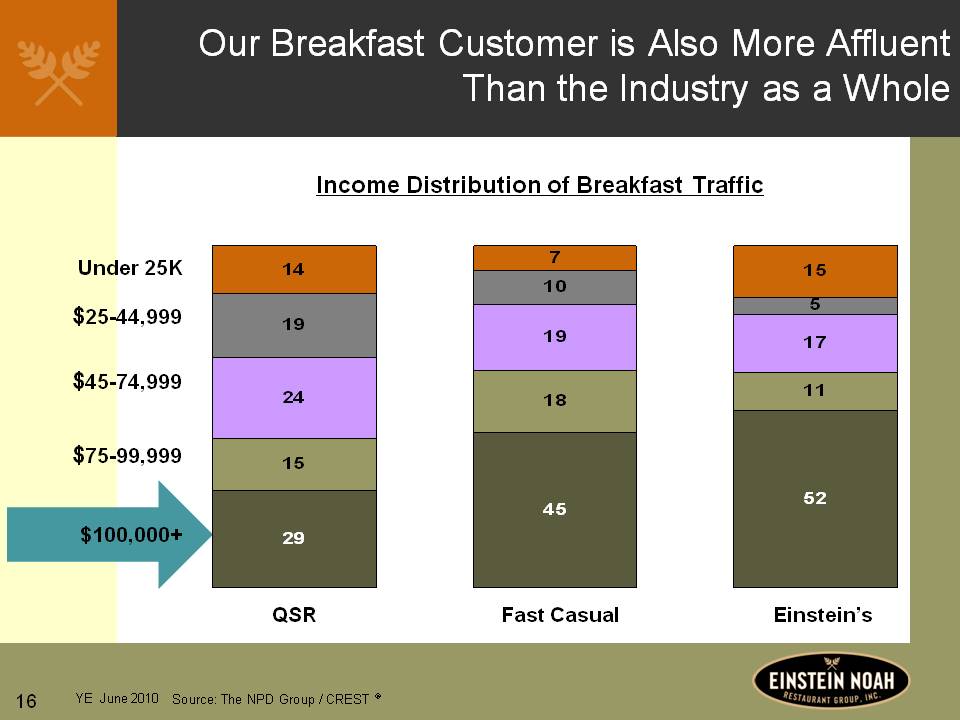
16 Our Breakfast Customer is Also More Affluent Than the Industry as a Whole Income Distribution of Breakfast Traffic Under 25K $25-44,999 $45-74,999 $75-99,999 $100,000+ QSR 14 19 24 15 29 Fast Casual 7 10 19 18 45 Einstein’s 15 5 17 11 52 YE June 2010 Source: The NPD Group / CREST
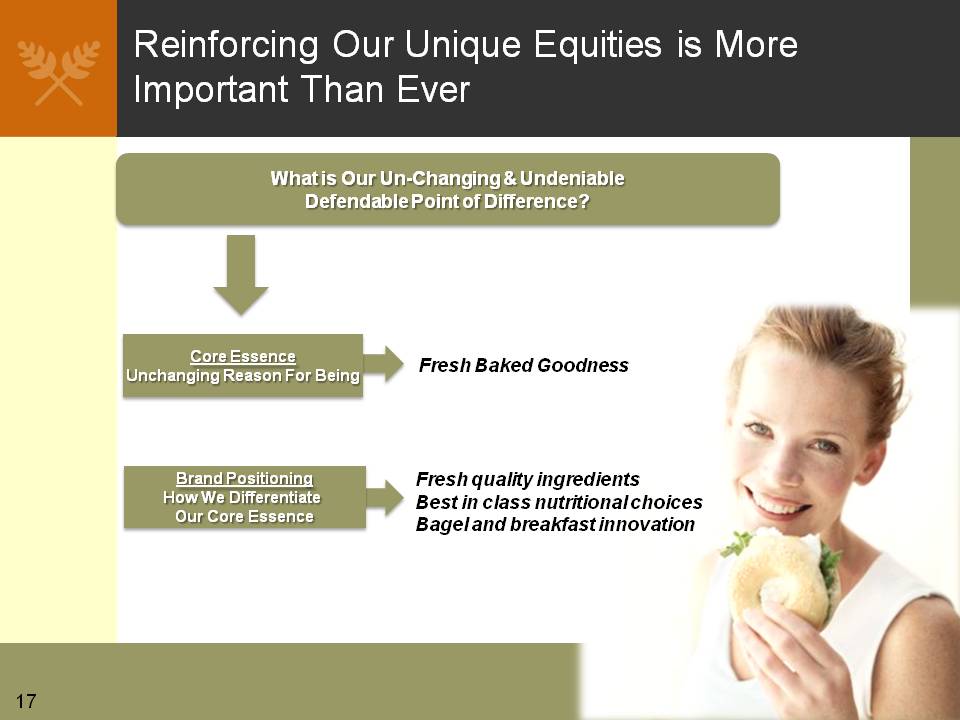
17 Reinforcing Our Unique Equities is More Important Than Ever What is Our Un-Changing & Undeniable Defendable Point of Difference? Core Essence Unchanging Reason For Being Fresh Baked Goodness Brand Positioning How We Differentiate Our Core Essence Fresh quality ingredients Best in class nutritional choices Bagel and breakfast innovation
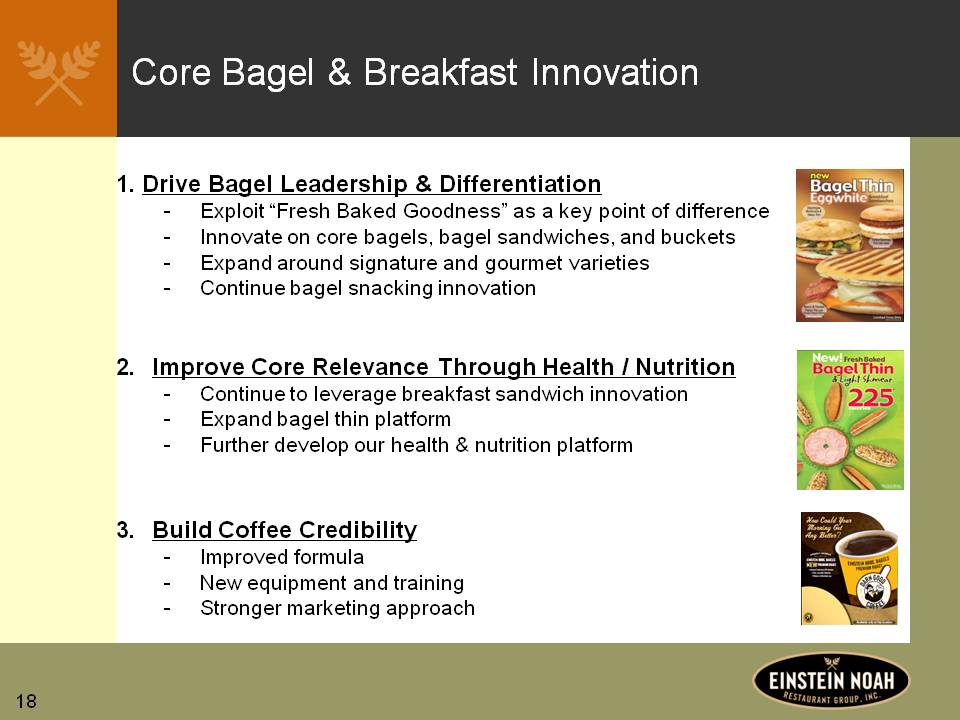
18 Core Bagel & Breakfast Innovation 1. Drive Bagel Leadership & Differentiation Exploit “Fresh Baked Goodness” as a key point of difference Innovate on core bagels, bagel sandwiches, and buckets Expand around signature and gourmet varieties Continue bagel snacking innovation 2. Improve Core Relevance Through Health / Nutrition Continue to leverage breakfast sandwich innovation Expand bagel thin platform Further develop our health & nutrition platform 3. Build Coffee Credibility Improved formula New equipment and training Stronger marketing approach
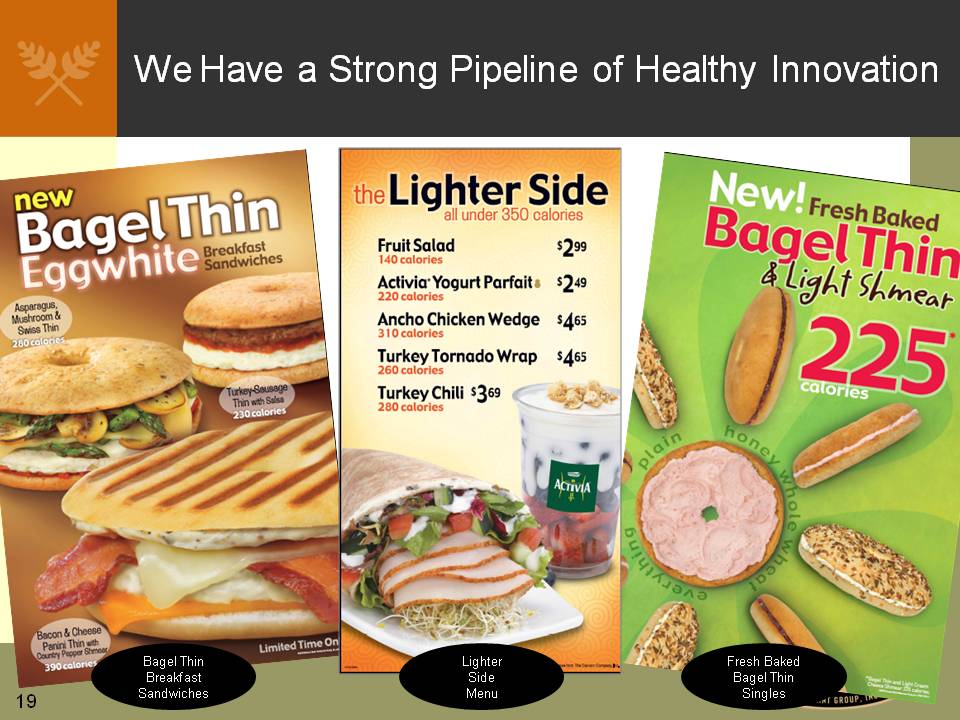
19 We Have a Strong Pipeline of Healthy Innovation Bagel Thin Breakfast Sandwiches Lighter Side Menu Fresh Baked Bagel Thin Singles
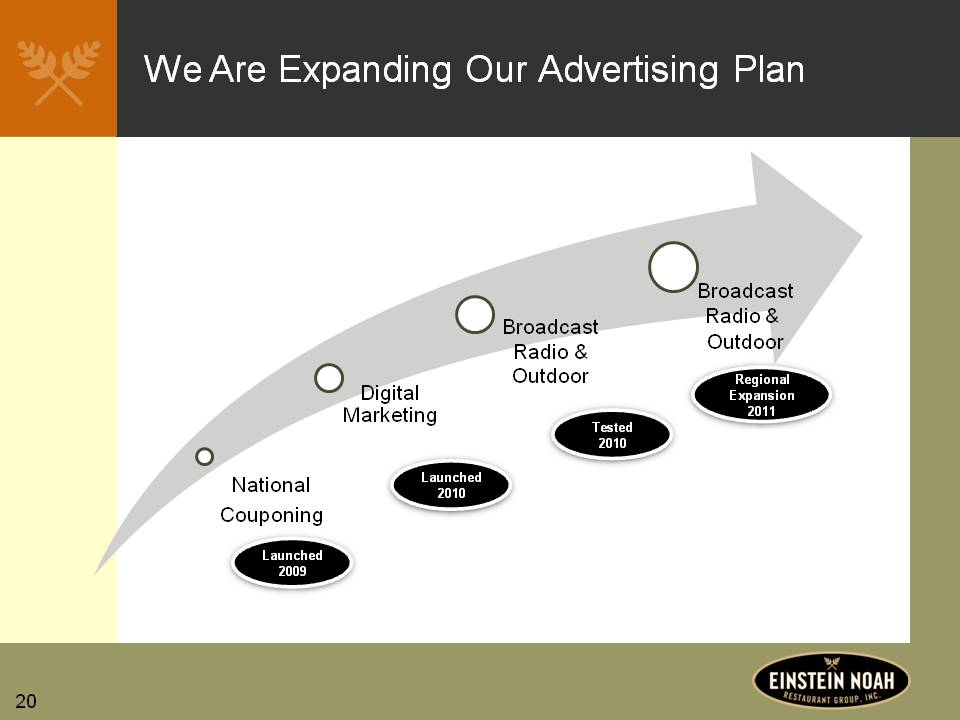
20 We Are Expanding Our Advertising Plan Launched 2009 Tested 2010 Launched 2010 Regional Expansion 2011 Broadcast Radio & Outdoor Broadcast Radio & Outdoor Digital Marketing National Couponing
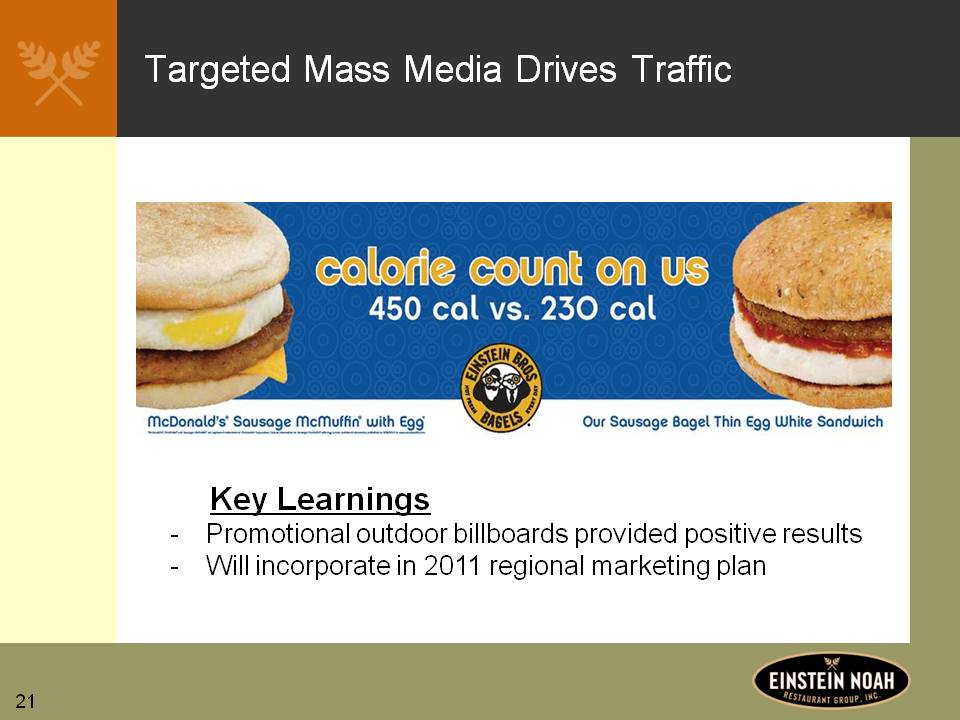
21 Targeted Mass Media Drives Traffic Key Learnings Promotional outdoor billboards provided positive results Will incorporate in 2011 regional marketing plan
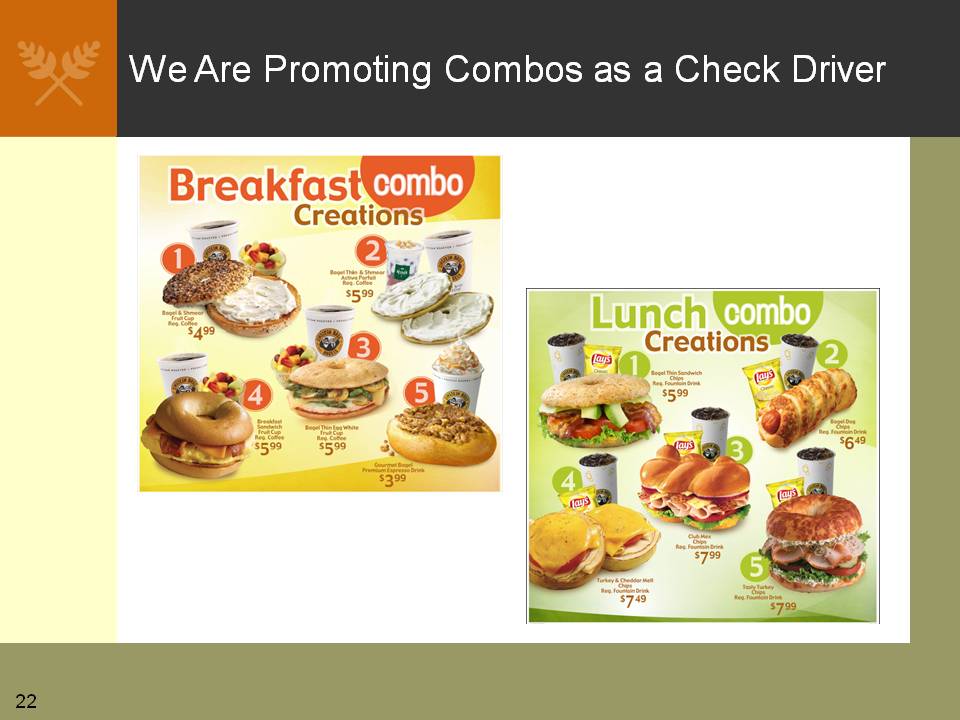
22 We Are Promoting Combos as a Check Driver
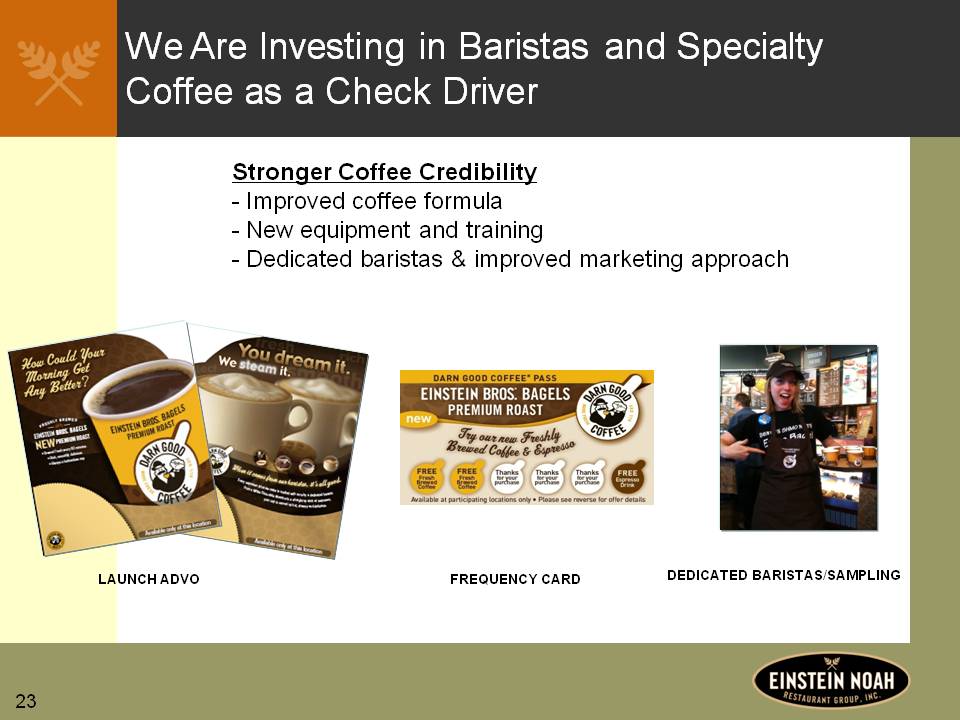
23 We Are Investing in Baristas and Specialty Coffee as a Check Driver Stronger Coffee Credibility Improved coffee formula New equipment and training Dedicated baristas & improved marketing approach LAUNCH ADVO FREQUENCY CARD DEDICATED BARISTAS/SAMPLING
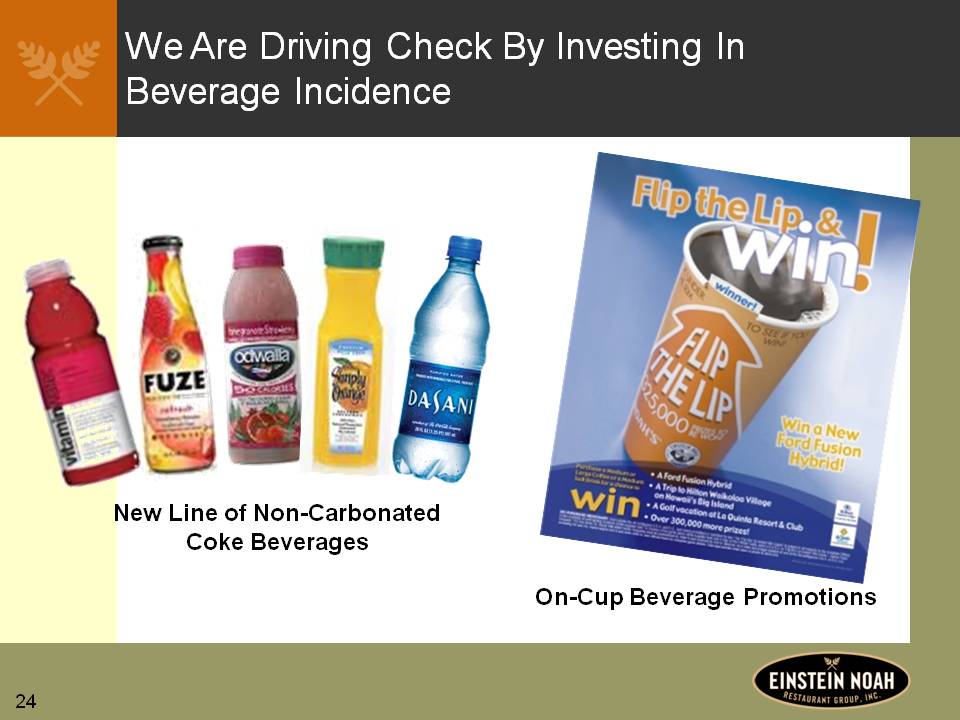
24 We Are Driving Check By Investing In Beverage Incidence New Line of Non-Carbonated Coke Beverages On-Cup Beverage Promotions

25 We Are Driving Check With Additional Snack Items In-Store Displays For Impulse Purchase Flavor Pipeline Ready for Expansion
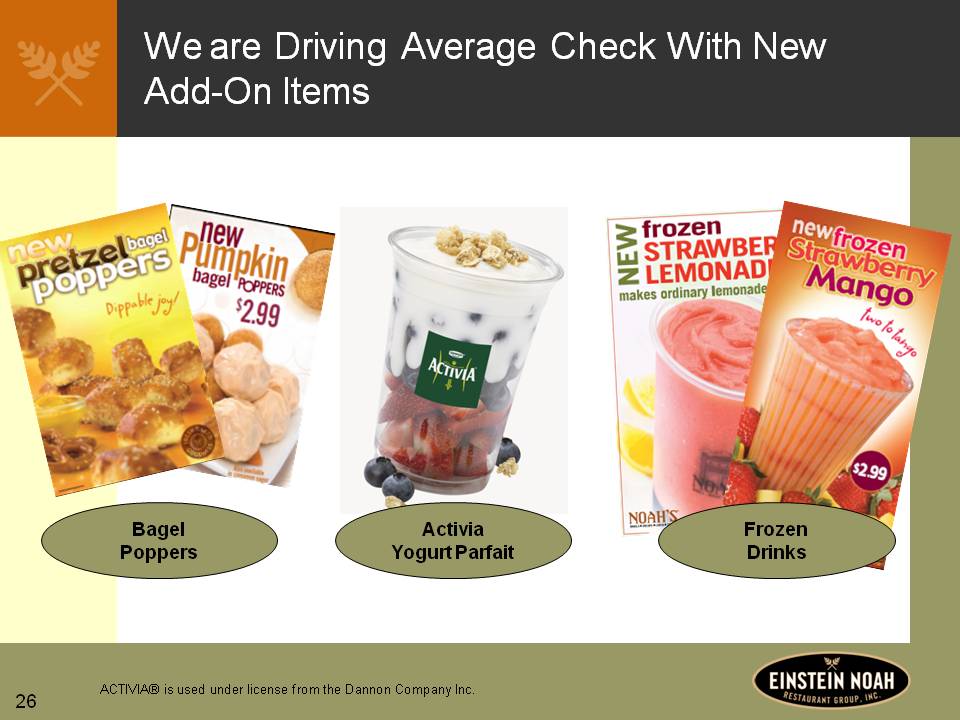
26 We are Driving Average Check With New Add-On Items Bagel Poppers ActiviaYogurt Parfait Frozen Drinks ACTIVIA is used under license from the Dannon Company Inc.
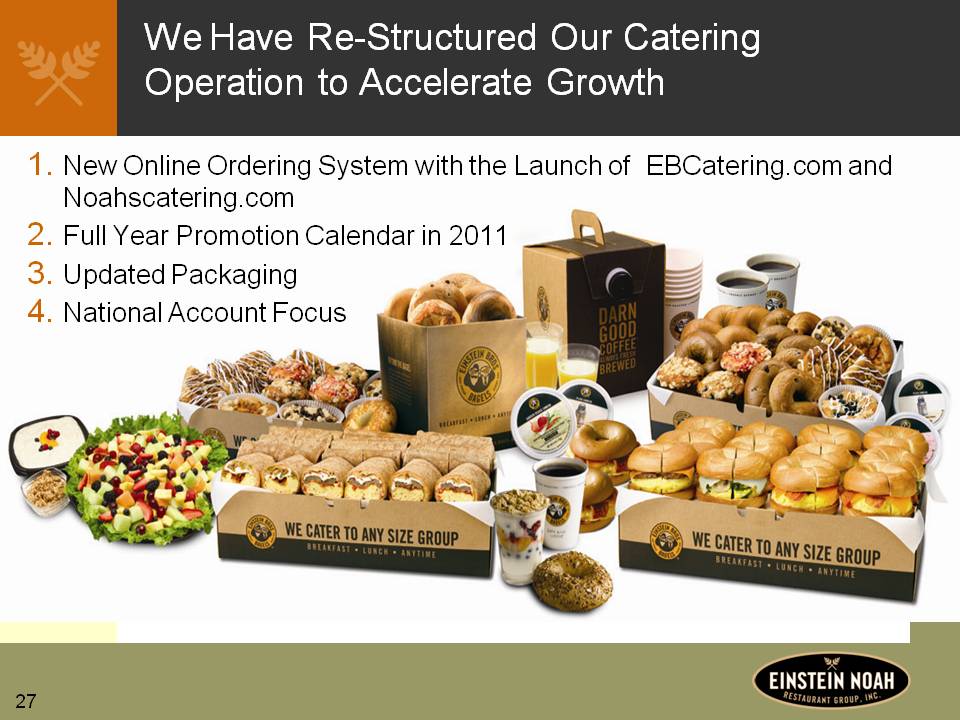
27 We Have Re-Structured Our Catering Operation to Accelerate Growth 1. New Online Ordering System with the Launch of EBCatering.com and Noahscatering.com 2. Full Year Promotion Calendar in 2011 3. Updated Packaging 4. National Account Focus
28 Enhancing Corporate Margins in 2010
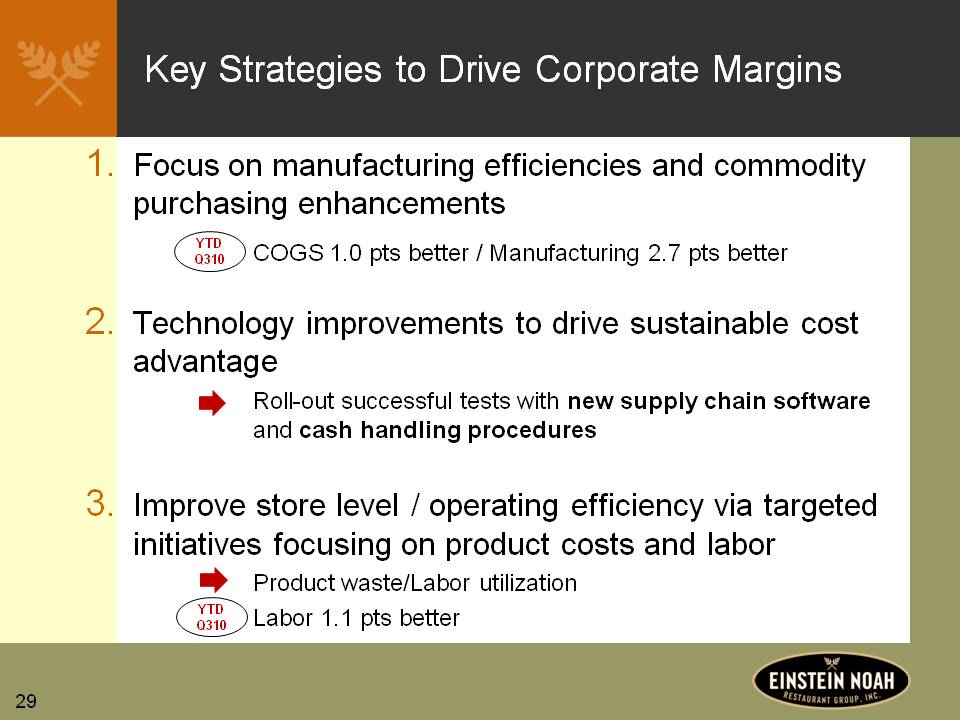
29 Key Strategies to Drive Corporate Margins 1. Focus on manufacturing efficiencies and commodity purchasing enhancements COGS 1.0 pts better / Manufacturing 2.7 pts better 2. Technology improvements to drive sustainable cost advantage Roll-out successful tests with new supply chain software and cash handling procedures 3. Improve store level / operating efficiency via targeted initiatives focusing on product costs and labor Product waste/Labor utilization Labor 1.1 pts better YTD Q310 YTD Q310
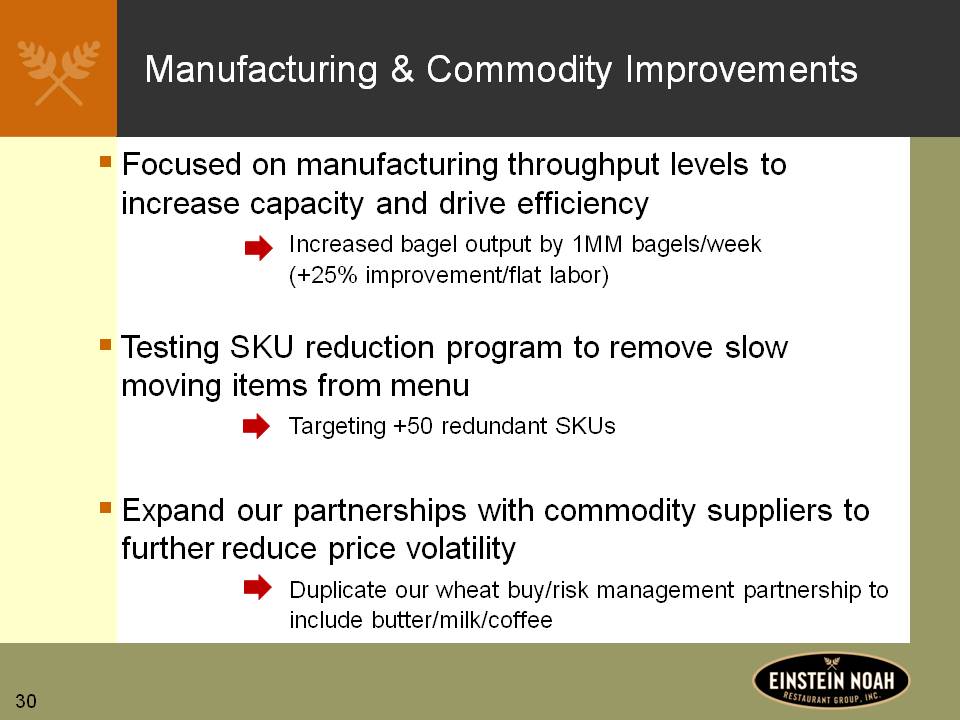
30 Manufacturing & Commodity Improvements Focused on manufacturing throughput levels to increase capacity and drive efficiency Increased bagel output by 1MM bagels/week (+25% improvement/flat labor) Testing SKU reduction program to remove slow moving items from menu Targeting +50 redundant SKUs Expand our partnerships with commodity suppliers to further reduce price volatility Duplicate our wheat buy/risk management partnership to include butter/milk/coffee
31 Manny Hilario Chief Financial Officer

32 Unit Growth in 2010
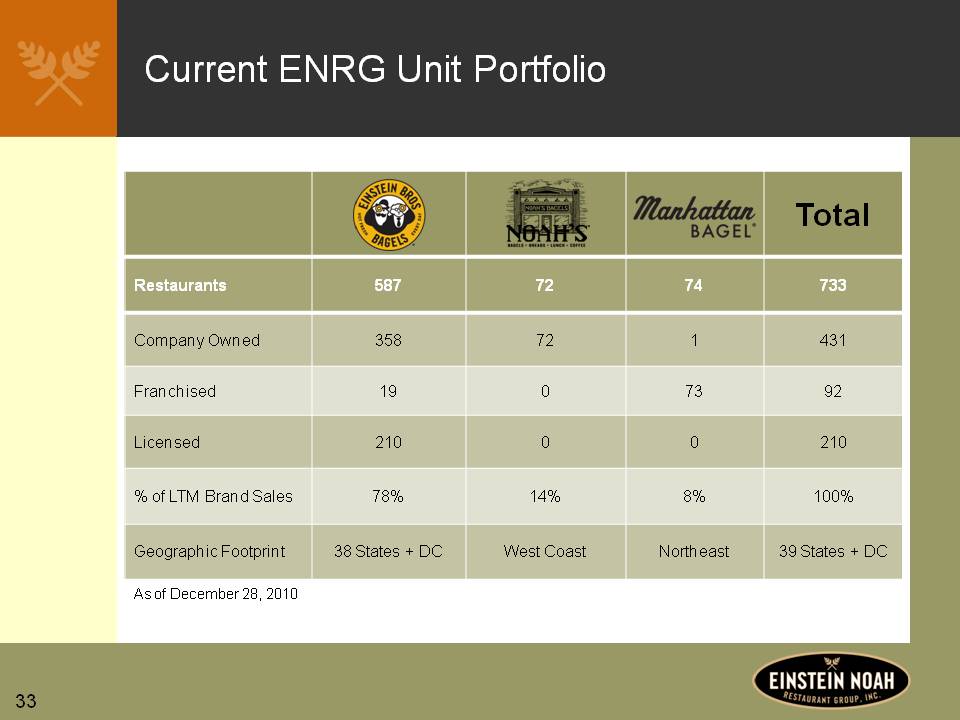
33 Current ENRG Unit Portfolio Restaurants 587 72 74 733 Company Owned 358 72 1 431 Franchised 19 0 73 92 Licensed 210 0 0 210 % of LTM Brand Sales 78% 14% 8% 100% Geographic Footprint 38 States + DC West Coast Northeast 39 States + DC As of December 28, 2010
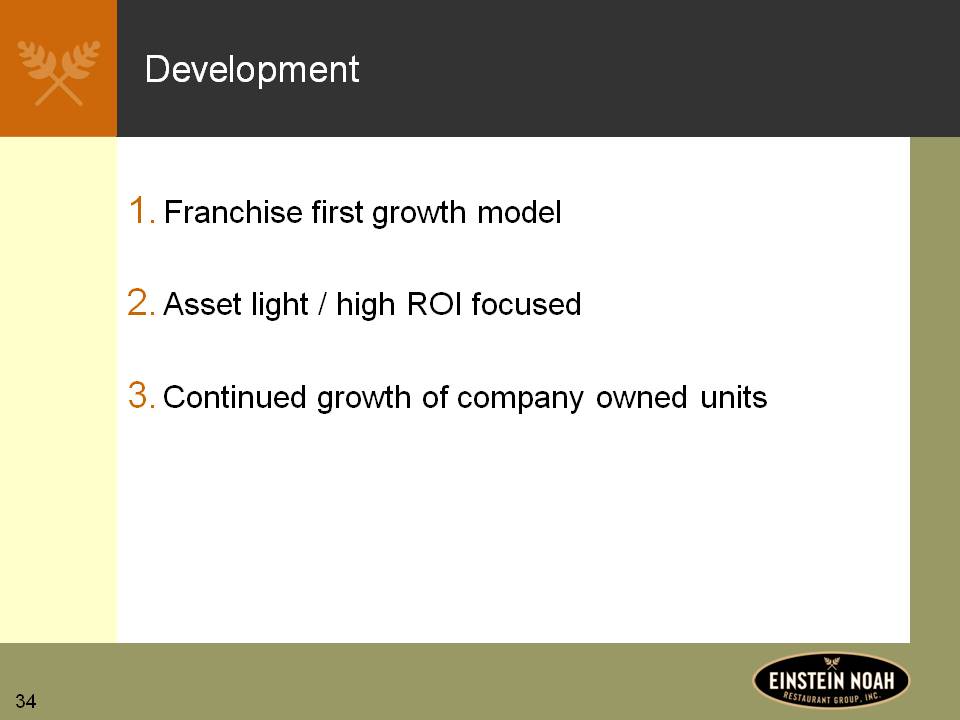
34 Development 1. Franchise first growth model2. Asset light / high ROI focused 3. Continued growth of company owned units
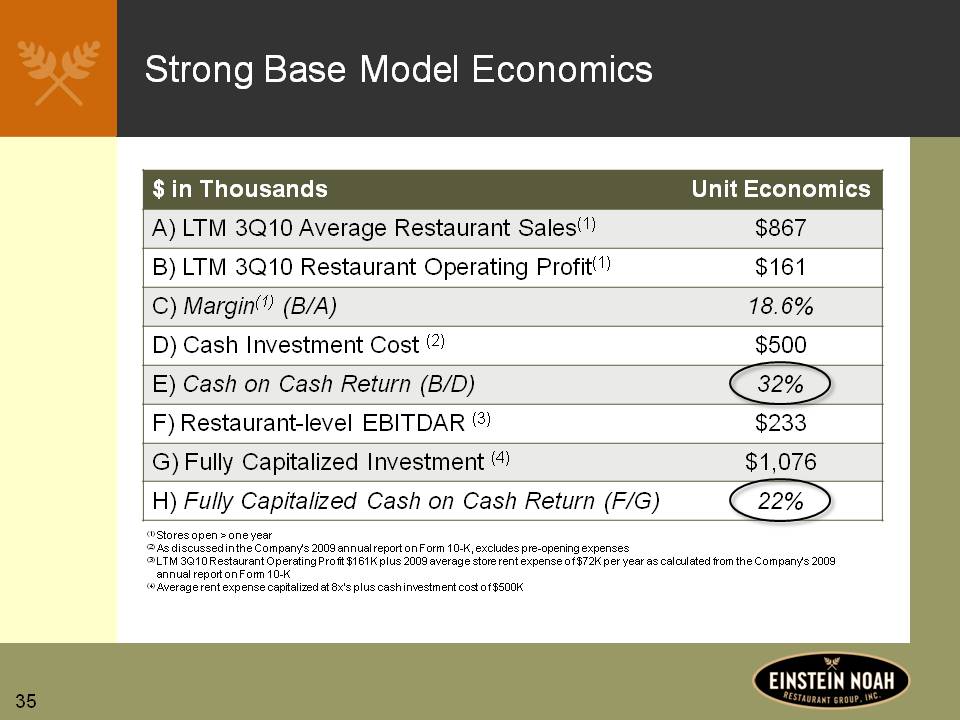
35 Strong Base Model Economics $ in Thousands Unit Economics A) LTM 3Q10 Average Restaurant Sales (1) $867 B) LTM 3Q10 Restaurant Operating Profit(1) $161 C) Margin(1) (B/A) 18.6% D) Cash Investment Cost(2) $500 E) Cash on Cash Return (B/D) 32% F) Restaurant-level EBITDAR(3) $233 G) Fully Capitalized Investment(4) $1,076 H) Fully Capitalized Cash on Cash Return (F/G) 22% (1) Stores open > one year (2) As discussed in the Company’s 2009 annual report on Form 10-K, excludes pre-opening expenses (3) LTM 3Q10 Restaurant Operating Profit $161K plus 2009 average store rent expense of $72K per year as calculated from the Company’s 2009 annual report on Form 10-K (4) Average rent expense capitalized at 8x’s plus cash investment cost of $500K
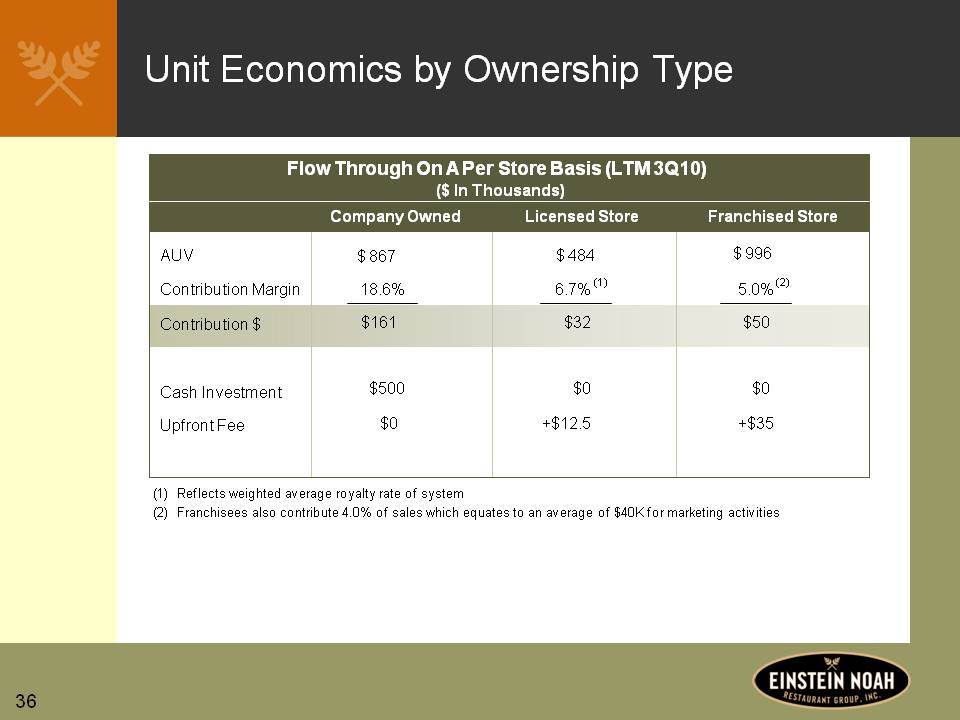
36 Unit Economics by Ownership Type Flow Through On A Per Store Basis (LTM 3Q10) ($ In Thousands) Company Owned Licensed Store Franchised Store AUV Contribution Margin Contribution $ Cash Investment Upfront Fee $ 867 18.6% $161 $500 $0 $ 484 6.7% (1) $32 $0 +$12.5 $ 996 5.0% (2) $50 $0 +$35 (1) Reflects weighted average royalty rate of system (2) Franchisees also contribute 4.0% of sales which equates to an average of $40K for marketing activities
37 Key Strategies for Unit Growth 1. Invest in franchise recruiting and financing support to drive franchisee development agreements 15 new locations in 2010 2. Leverage menu breadth and healthy halo to drive expansion in license channels 35 new locations in 2010 3. Maintain pace of company-store development 6 new locations in 2010
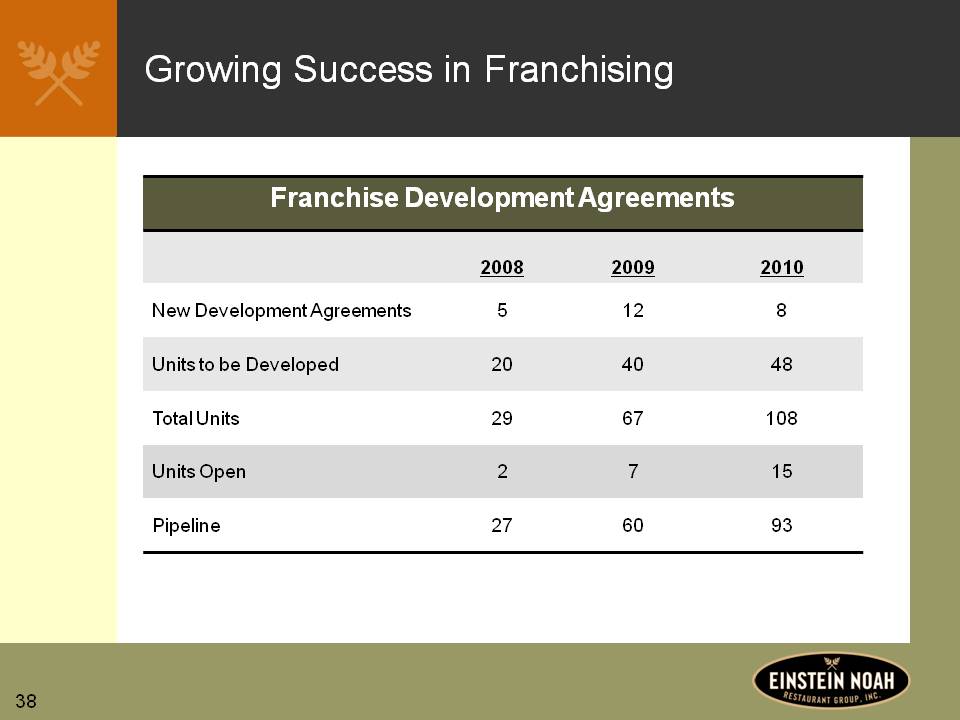
38 Growing Success in Franchising Franchise Development Agreements 2008 2009 2010 New Development Agreements 5 12 8 Units to be Developed 20 40 48 Total Units 29 67 108 Units Open 2 7 15 Pipeline 27 60 93
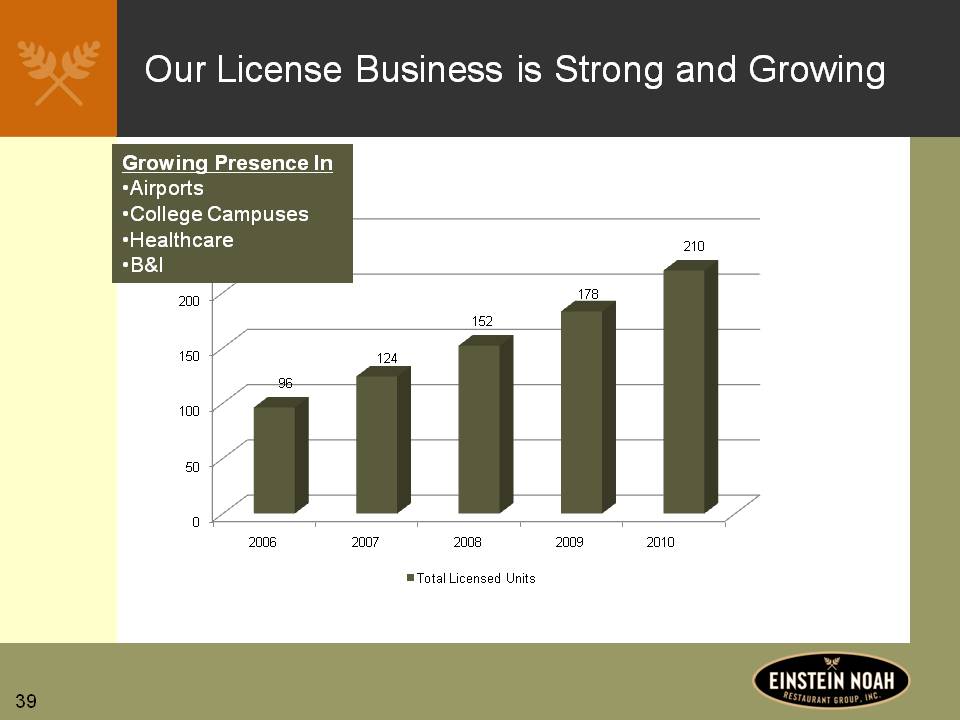
39 Our License Business is Strong and Growing Growing Presence In Airports College Campuses Healthcare B&I 2006 2007 2008 2009 2010 96 124 152 178 210 Total Licensed Units

40 Financial Overview
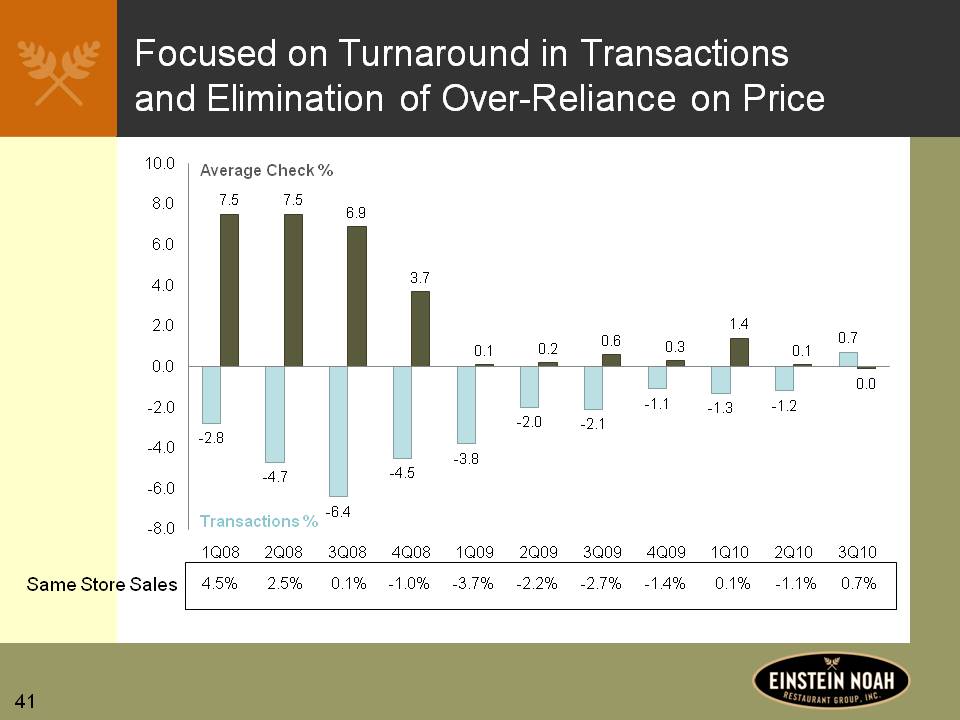
41 Focused on Turnaround in Transactions and Elimination of Over-Reliance on Price Average Check % Transactions % Same Store Sales 4.5% 2.5% 0.1% -1.0% -3.7% -2.2% -2.7% -1.4% 0.1% -1.1% 0.7% 1Q08 2Q08 3Q08 4Q08 1Q09 2Q09 3Q09 4Q09 1Q10 2Q10 3Q10 -2.8 7.5 -4.7 7.5 -6.4 6.9 -4.5 3.7 -3.8 0.1 -2.0 0.2 -2.1 0.6 -1.1 0.3 -1.3 1.4 -1.2 0.1 0.7 0.0
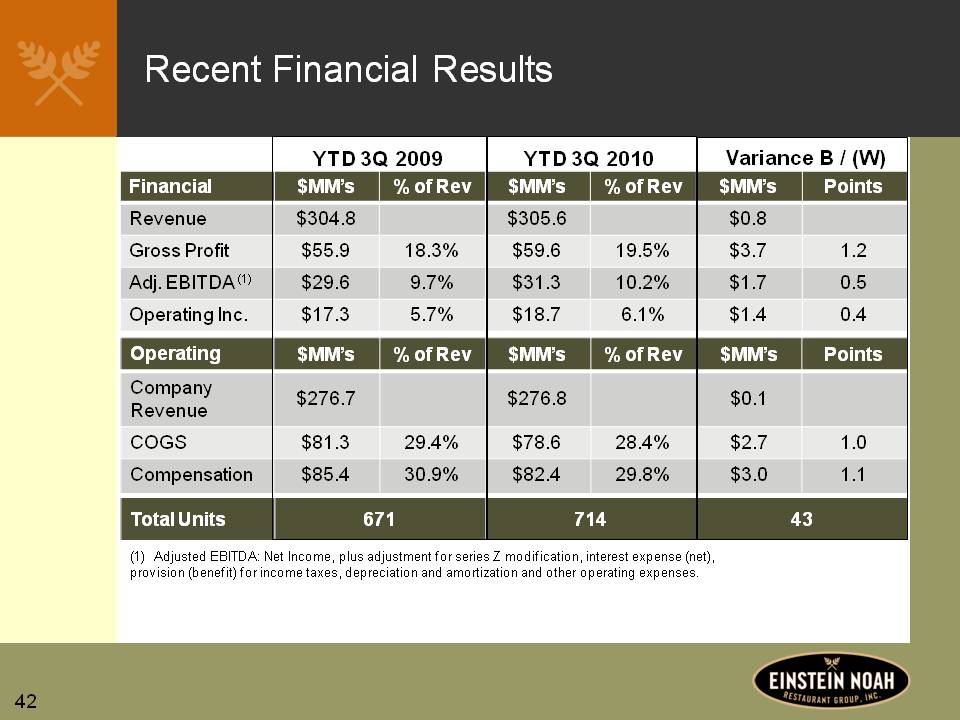
42 Recent Financial Results YTD 3Q 2009 YTD 3Q 2010 Variance B / (W) Financial $MM’s % of Rev $MM’s % of Rev $MM’s Points Revenue $304.8 $305.6 $0.8 Gross Profit $55.9 18.3% $59.6 19.5% $3.7 1.2 Adj. EBITDA (1) $29.6 9.7% $31.3 10.2% $1.7 0.5 Operating Inc. $17.3 5.7% $18.7 6.1% $1.4 0.4 Operating $MM’s % of Rev $MM’s % of Rev $MM’s Points Company Revenue $276.7 $276.8 $0.1 COGS $81.3 29.4% $78.6 28.4% $2.7 1.0 Compensation $85.4 30.9% $82.4 29.8% $3.0 1.1 Total Units 671 714 43 Adjusted EBITDA: Net Income, plus adjustment for series Z modification, interest expense (net), provision (benefit) for income taxes, depreciation and amortization and other operating expenses.
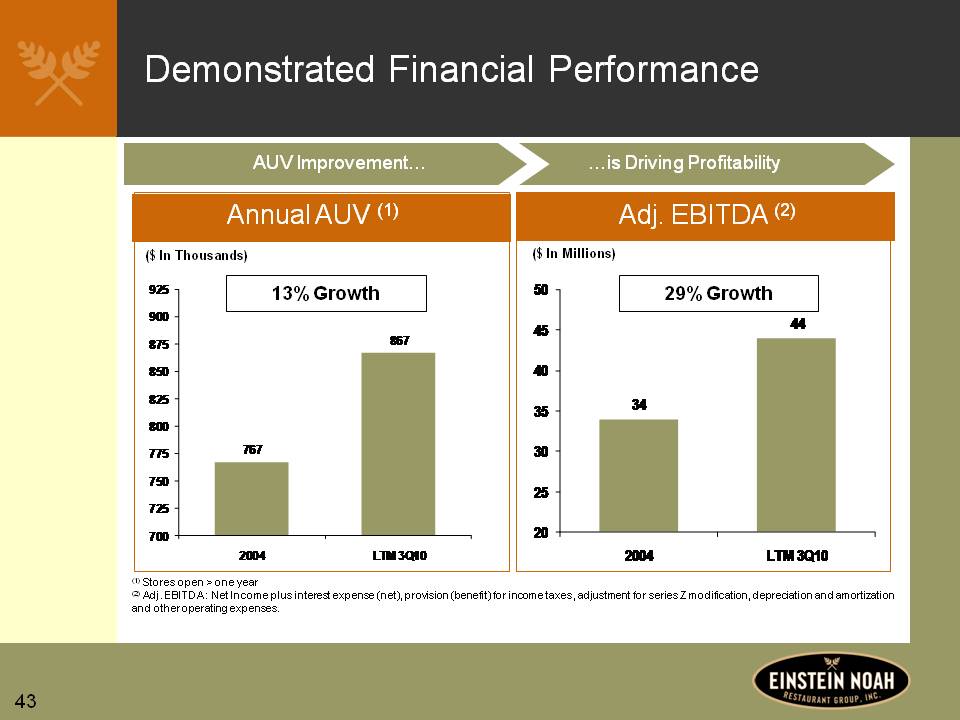
43 Demonstrated Financial Performance AUV Improvement… Annual AUV (1) ($ In Thousands) 13% Growth 767 867 2004 LTM 3Q10 …is Driving Profitability Adj. EBITDA (2) ($ In Millions) 29% Growth 34 44 2004 LTM 3Q10 (1) Stores open > one year (2) Adj. EBITDA : Net Income plus interest expense (net), provision (benefit) for income taxes, adjustment for series Z modification, depreciation and amortization and other operating expenses.
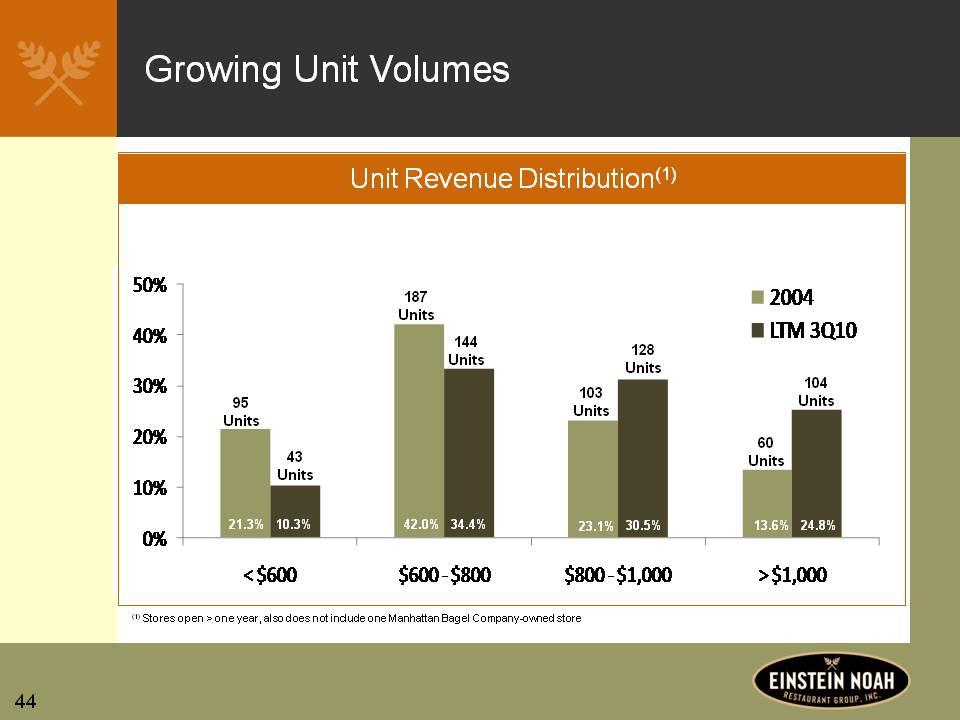
44 Growing Unit Volumes Unit Revenue Distribution(1) 95 Units 43 Units 21.3% 10.3% < $600 187 Units 144 Units 42.0% 34.4% $600-$800 103 Units 128Units 23.1% 30.5% $800-$1,000 60 Units 104 Units 13.6% 24.8% > $1,000 (1) Stores open > one year, also does not include one Manhattan Bagel Company-owned store
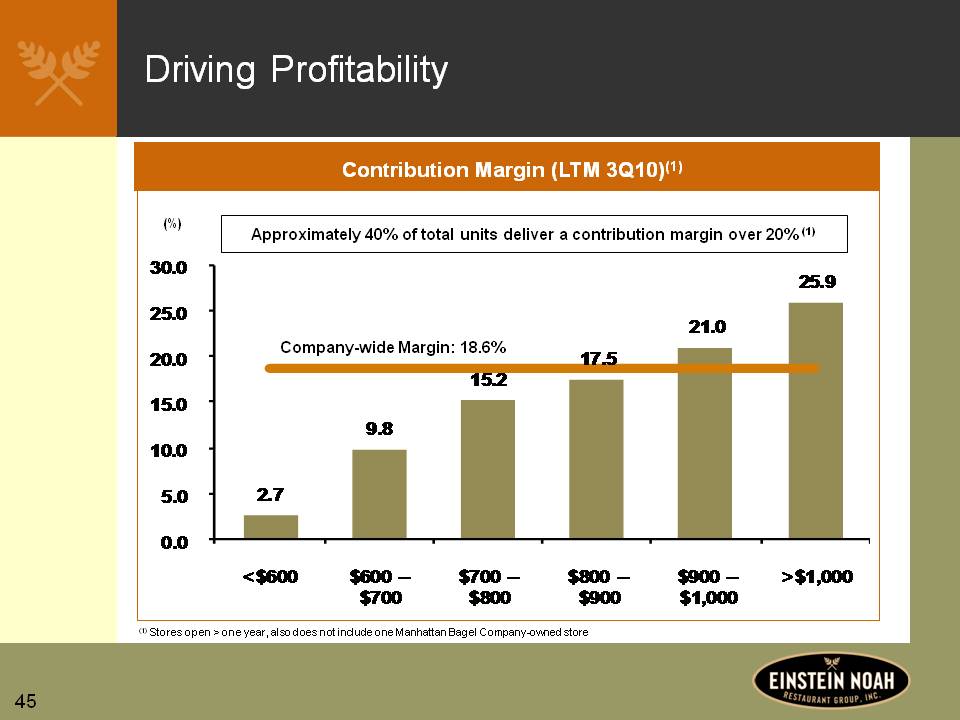
45 Driving Profitability Contribution Margin (LTM 3Q10)(1) (%) Approximately 40% of total units deliver a contribution margin over 20% (1) Company-wide Margin: 18.6% 2.7 9.8 15.2 17.5 21.0 25.9 < $600 $600-$700 $700-$800 $800-$900 $900-$1,000 > $1,000 (1) Stores open > one year, also does not include one Manhattan Bagel Company-owned store
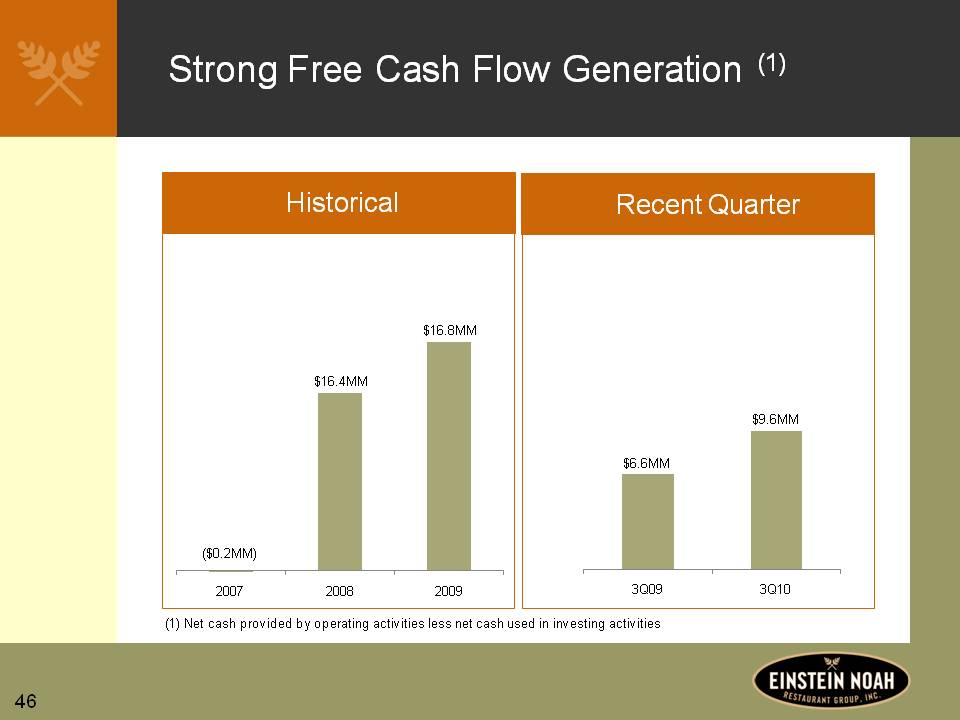
46 Strong Free Cash Flow Generation (1) Historical ($0.2MM) $16.4MM $16.8MM 2007 2008 2009 Recent Quarter $6.6MM $9.6MM 3Q09 3Q10 (1) Net cash provided by operating activities less net cash used in investing activities
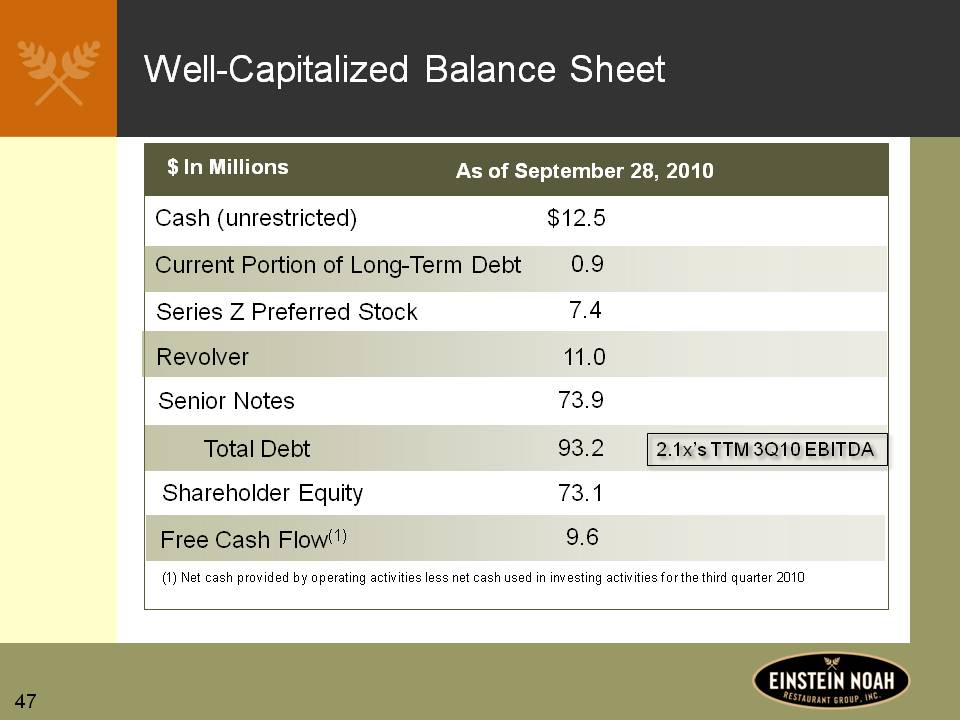
47 Well-Capitalized Balance Sheet $ In Millions As of September 28, 2010 Cash (unrestricted) Current Portion of Long-Term Debt Series Z Preferred Stock Revolver Senior Notes Total Debt Shareholder Equity Free Cash Flow(1) $12.5 0.9 7.4 11.0 73.9 93.2 73.1 9.6 2.1x’s TTM 3Q10 EBITDA (1) Net cash provided by operating activities less net cash used in investing activities for the third quarter 2010
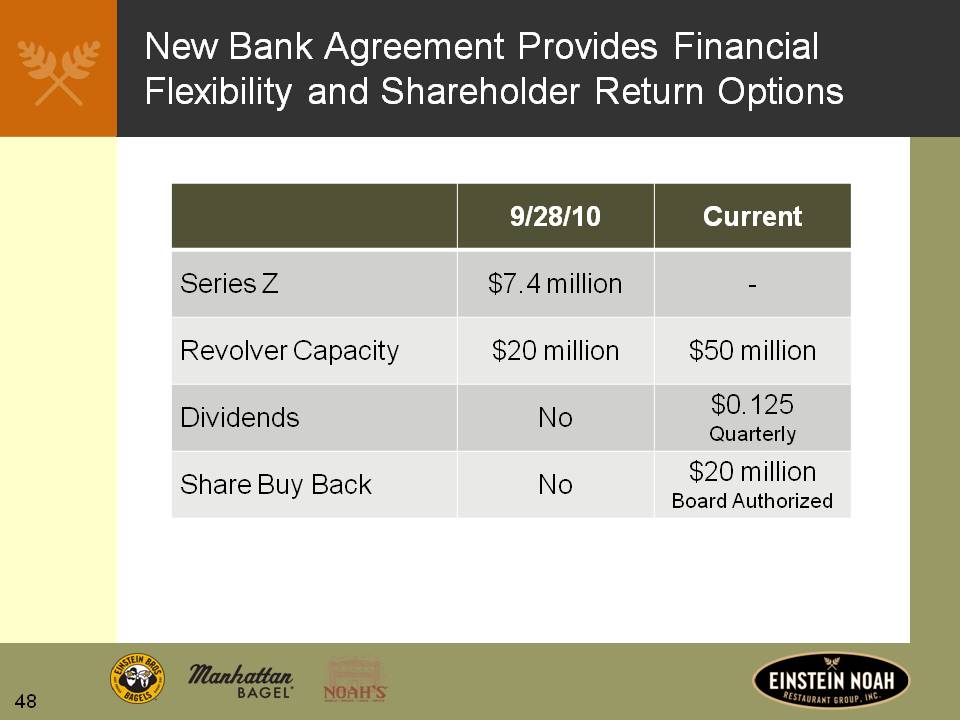
48 New Bank Agreement Provides Financial Flexibility and Shareholder Return Options 9/28/10 Current Series Z Revolver Capacity Dividends Share Buy Back $7.4 million $20 million No No - $50 million $0.125 Quarterly $20 million Board Authorized
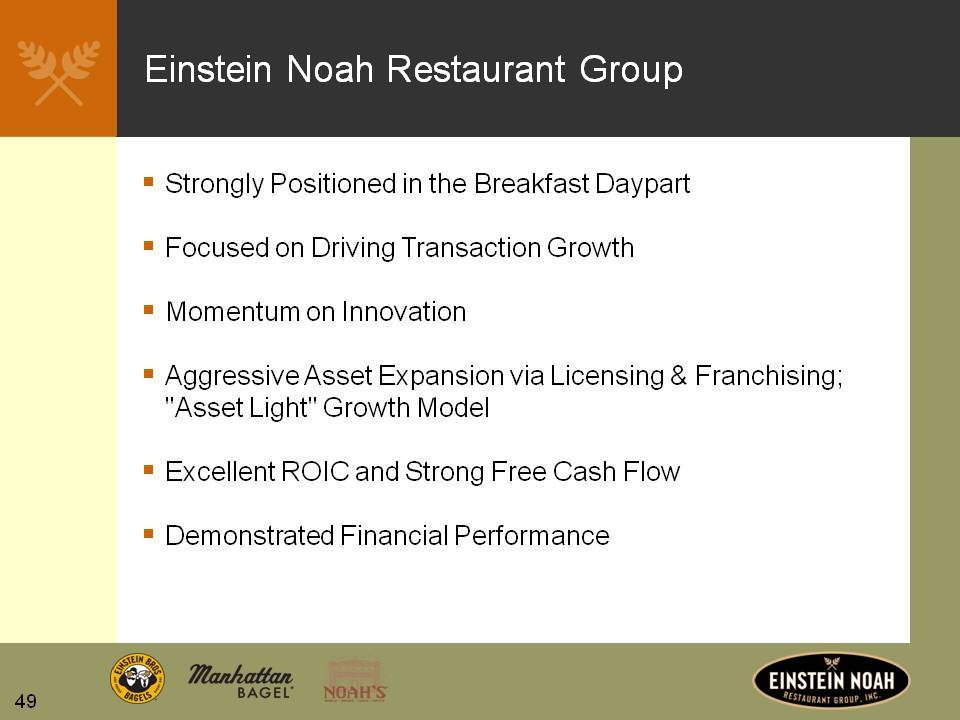
49 Einstein Noah Restaurant Group Strongly Positioned in the Breakfast Daypart Focused on Driving Transaction Growth Momentum on Innovation Aggressive Asset Expansion via Licensing & Franchising; "Asset Light" Growth Model Excellent ROIC and Strong Free Cash Flow Demonstrated Financial Performance
50 APPENDIX Appendix A: Net Income to EBITDA Reconciliation Appendix B: Free Cash Flow Reconciliation
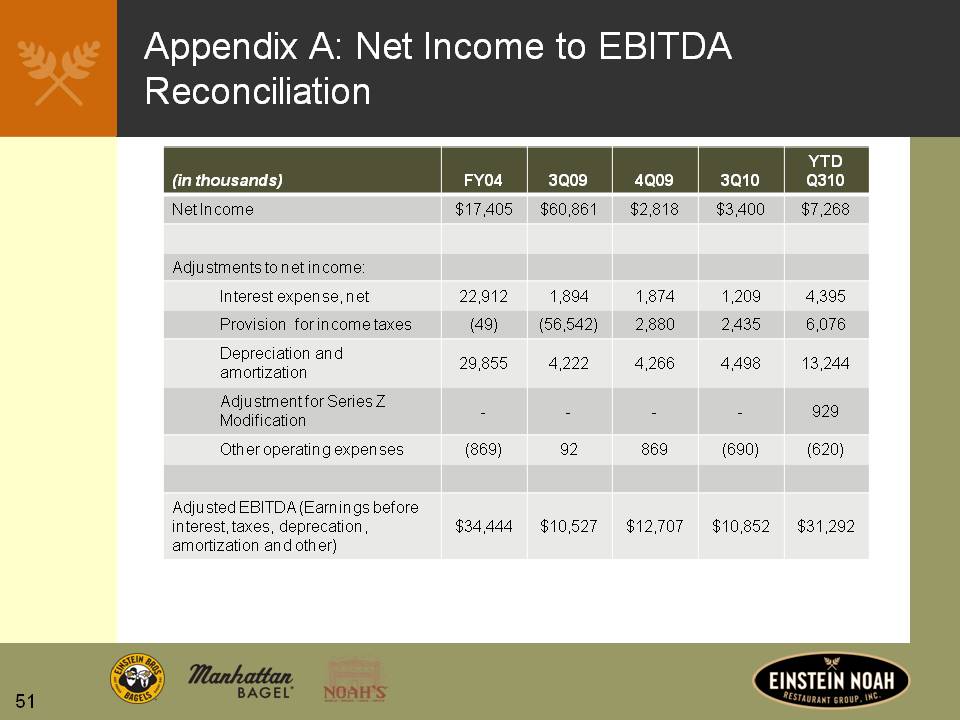
51 Appendix A: Net Income to EBITDA Reconciliation (in thousands) FY04 3Q09 4Q09 3Q10 YTD Q310 Net Income $17,405 $60,861 $2,818 $3,400 $7,268 Adjustments to net income: Interest expense, net 22,912 1,894 1,874 1,209 4,395 Provision for income taxes (49) (56,542) 2,880 2,435 6,076 Depreciation and amortization 29,855 4,222 4,266 4,498 13,244 Adjustment for Series Z Modification - - - - 929 Other operating expenses (869) 92 869 (690) (620) Adjusted EBITDA (Earnings before interest, taxes, deprecation, amortization and other) $34,444 $10,527 $12,707 $10,852 $31,292
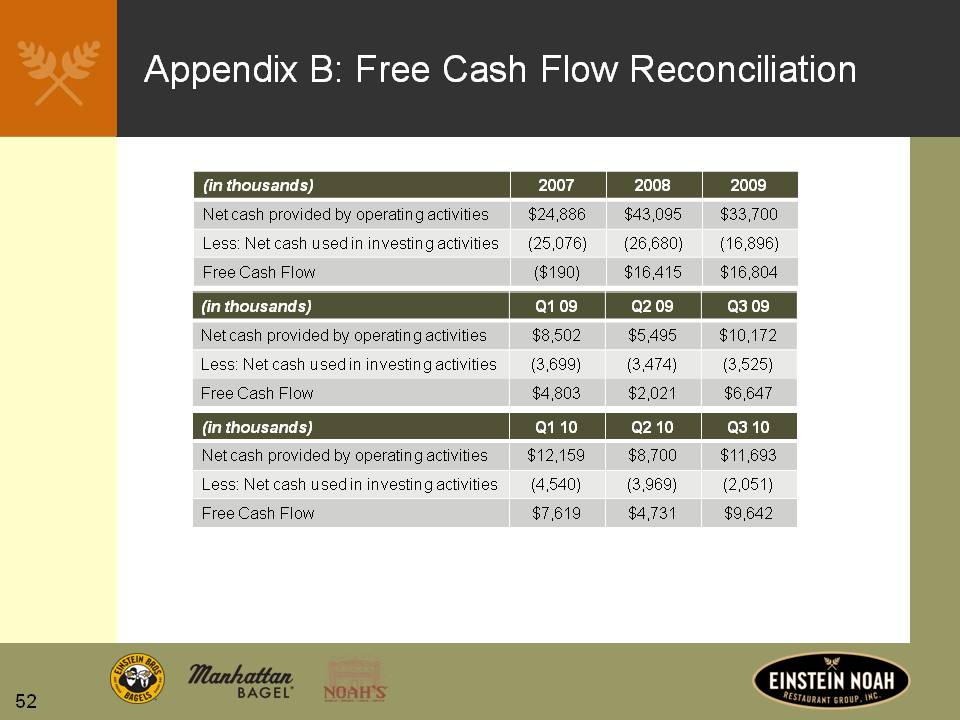
52 Appendix B: Free Cash Flow Reconciliation (in thousands) 2007 2008 2009 Net cash provided by operating activities $24,886 $43,095 $33,700 Less: Net cash used in investing activities (25,076) (26,680) (16,896) Free Cash Flow ($190) $16,415 $16,804 (in thousands) Q1 09 Q2 09 Q3 09 Net cash provided by operating activities $8,502 $5,495 $10,172 Less: Net cash used in investing activities (3,699) (3,474) (3,525) Free Cash Flow $4,803 $2,021 $6,647 (in thousands) Q1 10 Q2 10 Q3 10 Net cash provided by operating activities $12,159 $8,700 $11,693 Less: Net cash used in investing activities (4,540) (3,969) (2,051) Free Cash Flow $7,619 $4,731 $9,642